Methods and participatory approaches for identifying ...
12
Methods and participatory approaches for identifying social- ecological hotspots Azadeh Karimi a, b, * , Greg Brown a , Marc Hockings a a School of Geography, Planning, and Environmental Management, University of Queensland, Brisbane, QLD, 4072, Australia b Faculty of Natural Resources and Environment, Ferdowsi University of Mashhad, Iran article info Article history: Received 3 June 2015 Received in revised form 5 June 2015 Accepted 5 June 2015 Available online xxx Keywords: Social-ecological hotspots Public participation GIS Social values Zonation Conservation planning abstract Understanding the relationship between humans and their environment is essential for the planning and management of social-ecological systems but integration of social values with biophysical landscape information remains challenging. Identifying areas that are likely to be pivotal in land use planning decisions from both social and ecological perspectives provides one means of integration. Social- ecological “hotspots” represent valuable areas from both human and environmental perspectives but appropriate and valid methods for identifying such areas are under-developed. We applied an inductive research approach using empirical spatial data from a regional study in Australia to evaluate alternative methods for identifying social-ecological hotspots. Social data measuring the importance of the land- scape was collected using public participation geographic information systems (PPGIS) while ecologically valuable areas were identified from species distributions and Zonation conservation prioritization soft- ware. We applied multiple importance thresholds (cut-offs) to separately identify and measure social and ecological hotspots, and then quantified the degree of spatial concurrence (overlap) when combining the layers to generate social-ecological hotspots. Based on the findings, we developed guidelines for iden- tifying social-ecological hotspots under variable data conditions. We describe the practical implications of our findings by showing how the selected method for SES hotspot identification can enhance or limit the utility of hotspot analysis for decision support in regional conservation planning. © 2015 Elsevier Ltd. All rights reserved. 1. Introduction The social-ecological systems (SES) framework describes the interaction of complex human-environment systems (Ostrom, 2009) and provides a conceptual foundation for describing global environmental challenges such as the conservation of biological diversity (Knight, Cowling, Difford, & Campbell, 2010). A SES is a coherent, but dynamic and complex system of biophysical and social factors that regularly interact in a resilient, sustained manner at several spatial, temporal, and organizational scales to regulate the flow of critical resources (Redman, Grove, & Kuby, 2004). The SES conceptual framework has been developed extensively within the academic literature (e.g., Berkes, Colding, & Folke, 2003) with particular focus on system resilience (Walker, Holling, Carpenter, & Kinzig, 2004) and adaptive governance (Folke, Hahn, Olsson, & Norberg, 2005). While systems level analysis and understanding is essential for addressing complex multi-scalar humaneenvironment relation- ships, there is a parallel need to develop practical methods for operationalizing SES concepts for planning the governance and management of land and resource systems. Social and ecological systems are embedded within a geographic context and scale, but the rendering of spatially explicit maps that reveal critical areas of mutual importance remains an under-developed area of research and practice. Human-environment interaction occurs within geographical space that is ecologically and socially heterogeneous where some places are more important or critical to system out- comes than other places. The concept of coupled social-ecological space, also known as social-ecological “hotspots” (Alessa, Kliskey, & Brown, 2008) describes places that are both ecologically and socially important for practical application to environmental planning and management. The SES framework has been applied to identify likely conflicts and potential trade-offs between social and ecological factors and their associated processes, for example, in the management of land * Corresponding author. E-mail addresses: [email protected] (A. Karimi), [email protected] (G. Brown), [email protected] (M. Hockings). Contents lists available at ScienceDirect Applied Geography journal homepage: www.elsevier.com/locate/apgeog http://dx.doi.org/10.1016/j.apgeog.2015.06.003 0143-6228/© 2015 Elsevier Ltd. All rights reserved. Applied Geography 63 (2015) 9e20
Transcript of Methods and participatory approaches for identifying ...

lable at ScienceDirect
Applied Geography 63 (2015) 9e20
Contents lists avai
Applied Geography
journal homepage: www.elsevier .com/locate/apgeog
Methods and participatory approaches for identifying social-ecological hotspots
Azadeh Karimi a, b, *, Greg Brown a, Marc Hockings a
a School of Geography, Planning, and Environmental Management, University of Queensland, Brisbane, QLD, 4072, Australiab Faculty of Natural Resources and Environment, Ferdowsi University of Mashhad, Iran
a r t i c l e i n f o
Article history:Received 3 June 2015Received in revised form5 June 2015Accepted 5 June 2015Available online xxx
Keywords:Social-ecological hotspotsPublic participation GISSocial valuesZonationConservation planning
* Corresponding author.E-mail addresses: [email protected] (A. Kar
(G. Brown), [email protected] (M. Hockings).
http://dx.doi.org/10.1016/j.apgeog.2015.06.0030143-6228/© 2015 Elsevier Ltd. All rights reserved.
a b s t r a c t
Understanding the relationship between humans and their environment is essential for the planning andmanagement of social-ecological systems but integration of social values with biophysical landscapeinformation remains challenging. Identifying areas that are likely to be pivotal in land use planningdecisions from both social and ecological perspectives provides one means of integration. Social-ecological “hotspots” represent valuable areas from both human and environmental perspectives butappropriate and valid methods for identifying such areas are under-developed. We applied an inductiveresearch approach using empirical spatial data from a regional study in Australia to evaluate alternativemethods for identifying social-ecological hotspots. Social data measuring the importance of the land-scape was collected using public participation geographic information systems (PPGIS) while ecologicallyvaluable areas were identified from species distributions and Zonation conservation prioritization soft-ware. We applied multiple importance thresholds (cut-offs) to separately identify and measure social andecological hotspots, and then quantified the degree of spatial concurrence (overlap) when combining thelayers to generate social-ecological hotspots. Based on the findings, we developed guidelines for iden-tifying social-ecological hotspots under variable data conditions. We describe the practical implicationsof our findings by showing how the selected method for SES hotspot identification can enhance or limitthe utility of hotspot analysis for decision support in regional conservation planning.
© 2015 Elsevier Ltd. All rights reserved.
1. Introduction
The social-ecological systems (SES) framework describes theinteraction of complex human-environment systems (Ostrom,2009) and provides a conceptual foundation for describing globalenvironmental challenges such as the conservation of biologicaldiversity (Knight, Cowling, Difford, & Campbell, 2010). A SES is acoherent, but dynamic and complex system of biophysical andsocial factors that regularly interact in a resilient, sustainedmannerat several spatial, temporal, and organizational scales to regulatethe flow of critical resources (Redman, Grove, & Kuby, 2004). TheSES conceptual framework has been developed extensively withinthe academic literature (e.g., Berkes, Colding, & Folke, 2003) withparticular focus on system resilience (Walker, Holling, Carpenter, &Kinzig, 2004) and adaptive governance (Folke, Hahn, Olsson, &
imi), [email protected]
Norberg, 2005).While systems level analysis and understanding is essential for
addressing complex multi-scalar humaneenvironment relation-ships, there is a parallel need to develop practical methods foroperationalizing SES concepts for planning the governance andmanagement of land and resource systems. Social and ecologicalsystems are embedded within a geographic context and scale, butthe rendering of spatially explicit maps that reveal critical areas ofmutual importance remains an under-developed area of researchand practice. Human-environment interaction occurs withingeographical space that is ecologically and socially heterogeneouswhere some places are more important or critical to system out-comes than other places. The concept of coupled social-ecologicalspace, also known as social-ecological “hotspots” (Alessa, Kliskey,& Brown, 2008) describes places that are both ecologically andsocially important for practical application to environmentalplanning and management.
The SES framework has been applied to identify likely conflictsand potential trade-offs between social and ecological factors andtheir associated processes, for example, in the management of land

A. Karimi et al. / Applied Geography 63 (2015) 9e2010
and marine systems (e.g. Butler et al., 2011; Pollino, White, & Hart,2007) but the integration of human dimensions spatial data forenvironmental management, in particular, remains a work inprogress. Despite the call for better integration of humans and theiractivities (i.e., social data) into landscape ecology (Wu & Hobbs,2002) and human ecology (McLain et al., 2013), the identificationof important social areas that provide social and cultural ecosystemservices has lagged the identification of important ecological areasin ecosystem service assessments (Plieninger, Oteros Rozas, Dijks,&Bieling, 2013). In the marine environment, St. Martin and Hall-Arber (2008) go so far as to describe the social landscape as un-documented and a “missing layer” in decision-making.
The development of participatory mapping methods describedas public participation GIS (PPGIS), participatory GIS (PGIS), andvolunteered geographic information (VGI), provide a means tocapture spatially-explicit social data for integration with biophys-ical data layers in geographic information systems (Brown, 2005;Brown & Kytta, 2014), including the spatial mapping of culturalecosystem services (see Brown & Fagerholm, 2015; for a review ofapplications). The ability to identify social and cultural valuesthrough participatorymappingmethods has progressed toward theoperationalizing of SES concepts, but also presents new challengesfor data integration. Research into the identification and mappingof coupled social-ecological space or “hotspots” is relatively recentand there is as yet, little formal guidance in the current literature.The complexity, uncertainty, and potential error that characterizethe identification and mapping of ecological and social data may becarried forward and amplified in the spatial integration and overlayprocess.
The purpose of this paper is describe and model key parametersand decision thresholds for the identification of social-ecologicalhotspots and to provide some guidance to inform future SES hot-spot mapping. In the first study to demonstrate methods foridentifying social-ecological hotspots, Alessa et al. (2008) reportedthat output from SES hotspot mapping were dependent on theassumptions underlying the methodology such as the quantitativeparameters for determining the size of the hotspot and the speci-fied range of standardized density values and noted that “furtherwork is needed to explore the optimal threshold range for identi-fying an absolute hotspot size” (p. 38). In addition, the authorsnoted the limitation of using a single, convenient ecological metricsuch as net primary productivity for demonstrating the methodwhen other metrics such as species richness could (and should) beincorporated into socialeecological hotspot mapping. This studyaddresses these research needs by using data from a regional casestudy in Australia whose purpose was to identify social-ecologicalhotspots to inform biodiversity conservation planning in the re-gion. The specific objectives of this research were to generatesocial-ecological hotspots for the study region (Baffle Basin,Australia), to demonstrate how these hotspots can vary withdifferent parameters and assumptions about the data, and to pro-vide guidance for the generation of SES hotspots under alternativescenarios. The implications of these results for supporting regionalconservation planning efforts are described.
1.1. Ecological and social values importance evaluation
A defensible method for evaluating the importance of ecologicalsystems and their components is essential to making informedchoices about conserving biological diversity. A range of ap-proaches with different purposes have been developed includingthe design or expansion of conservation reserve networks (Kremenet al., 2008), the spatial prioritization of conservation actions(Moilanen, Leathwick, & Quinn, 2011), and the integration of socialdata into conservation prioritization models (Whitehead et al.,
2014). Key criteria used to evaluate ecological values haveincluded species richness, habitat quality, connectivity, irreplace-ability, representativeness and complementarity (Margules,Nicholls, & Pressey, 1988; Moilanen, Wilson, & Possingham, 2009;Pressey, Humphries, Margules, Vane-Wright, & Williams, 1994,Pressey, Johnson, & Wilson, 1994). In this study, we evaluated theimportance of ecological areas in a case study region using speciesdistribution data and Zonation spatial prioritization software(Moilanen& Kujala, 2008) that generated ecological hotspots basedon importance rankings.
Methods for evaluating the spatial importance of social systemsand their components are less well-developed than for ecologicalsystems given the complexity of accounting for multiple anddiverse human values that can be rendered spatially explicit.However, there has been significant research effort over the lastdecade to operationalize spatially-explicit social values that areembedded within social-ecological systems (Alessa et al., 2008;Brown, 2005; Brown & Raymond, 2007) The development PPGISmethods (see Brown & Kytta, 2014; Sieber, 2006 for reviews) hasprovided the means to generate spatially-explicit social informa-tion for a variety of environmental applications such as regionalconservation planning (Brown & Weber, 2013), national forest andpark planning (Brown & Reed, 2009; Brown & Weber, 2011), andmarine planning (Baldwin & Mahon, 2014). Methods commonlyused to identify spatial areas of important social values includemapped point densities (Alessa et al., 2008) or polygon densities(Ramirez-Gomez, Brown, & Tjon, 2013).
2. Methods
An overview of the analytical methods used in this study ispresented in Fig. 1. We first identified important ecological areas inthe study region from species distributions using Zonation software(Step 1), followed by the identification of important social areasgenerated from density maps of social values collected using PPGIS(Step 2). Social hotspots were generated from point data using twoalternative methods (global versus local). In Steps 3 and 4, weestablished a finite number (n ¼ 3) of model parameters (impor-tance thresholds of 10, 30, and 50%) for the evaluation of SES hot-spots, while in Steps 5 and 6, we performed multiple spatialoverlays of the social and ecological data using the predefinedimportance thresholds to compare the results under the alternativescenarios. In the final step, we present recommendations formeasuring socialeecological hotspots under variable conditions.
2.1. Study area
Baffle Basin is located at the southern end of Great Barrier Reefcatchment and falls within the Burnett Mary Natural ResourceManagement (NRM) region in Queensland, Australia (Fig. 2). Bafflebasin encompasses a total of 4114 km2 (Binney, 2008) with apopulation of 5822 people in 2011(Australian Bureau of Statistics,2013). The major ecologically valuable characteristics in Baffle Ba-sin include near pristine estuaries, threatened species of fauna andflora, two critically-endangered ecological communities (LittoralRain forest and Coastal Vine Thickets of Eastern Australia andLowland Subtropical Rain forest on Basalt Alluvium), a Dugongprotection area, and 26 protected areas, national parks, conserva-tion, and forest parks (Great Marine Reef Marine Park Authority,2012). The major land uses of this region are grazing, intensiveagriculture, water supply, road and rail infrastructure, and urbanresidential areas (Reef Water Quality Protection Plan, 2013).

Fig. 1. Process followed to evaluate alternative social-ecological hotspot methods.
A. Karimi et al. / Applied Geography 63 (2015) 9e20 11
2.2. Social data collection
A mixed-methods PPGIS survey (Pocewicz, Nielsen-Pincus,Brown, & Schnitzer, 2012) was implemented to collect spatially-explicit perceived landscape values in the Baffle Basin. In order toincrease the response rate, study participants were provided theoption of completing an internet-based or mail-based survey. APPGIS website was developed using a Google Maps ApplicationProgramming Interface (API) where participants were requested todrag and drop landscape value markers onto the map of the regionfollowing the methods provided to them. The landscape value ty-pology developed by Brown (2005) was adapted after consultationwith key stakeholders to identify the landscape values relevant tothe study area (Table 1).
We sent letters of invitation to 2200 residential addresses pro-vided by a marketing agency (Yell123, 2014), of which 365 wereundeliverable, leaving an effective sample size of 1835 households.The letter explained the study objectives, provided the PPGISwebsite URL, and included instructions for participating in thestudy. A unique website access code was provided to each house-hold to track responses. Two additional follow-up mailings weresent to non-respondents after the first invitation. In the thirdfollow-up mailing, we asked whether non-participants wouldprefer to participate using a hardcopy version of the survey. Inter-ested people were sent survey packages that included an A1 sizemap of the Baffle region, a one-page instruction explaining how tocomplete the survey, a legend with small, mnemonically-codedsticker dots for mapping the landscape values, and the same text-

Fig. 2. Location map of Baffle Basin region in Queensland, Australia.
Table 1Typology of perceived social values used in Baffle Basin study.
Value Operational description
Aesthetic/scenic These areas are valuable because they contain attractive scenery including sights, smells, and sounds.Economic These areas are valuable because they provide timber, fisheries, minerals, or tourism opportunities such as outfitting and guiding.Non-water-based
recreationThese areas are valuable because they provide a place for my favourite non water-based recreation activities.
Water-based recreation These areas are valuable because they provide opportunity for water-related recreational activities such as boating, fishing.Life sustaining/
ecologicalThese areas are valuable because they help produce, preserve, clean and renew air, soil and water.
Learning/scientific These areas are valuable because they provide places where we can learn about the environment through observation or study.aBiological value These areas are valuable because they provide a variety of fish, wildlife, plants, or other living organisms.Spiritual These areas are valuable because they are sacred, religious, or spiritually special places or because I feel reverence and respect for nature here.aIntrinsic These areas are valuable in their own right, no matter what I or others think about them.Historic/cultural These areas are valuable because they represent history, or provide places where people can continue to pass down memories, wisdom,
traditions, OR a way of life.Future These areas are valuable because they allow future generations to know and experience the area as it is now.aWilderness These places are valuable because they are wild, uninhabited, or relatively untouched by human activity.Social These areas are valuable because they provide opportunities for social interaction.
a Identifies values used in this study.
A. Karimi et al. / Applied Geography 63 (2015) 9e2012

A. Karimi et al. / Applied Geography 63 (2015) 9e20 13
based survey questions that were used in the internet survey. Afterreceiving the completed maps and survey questions from the re-spondents, the locations of the sticker dots were digitized into GISsoftware and merged with the internet PPGIS spatial data.
Household sampling was augmented by a purposive sample ofkey informants invited by email to participate in the survey. Lettersof invitationwere emailed to 48 key informants who have interestsor responsibility for natural resource management in the region.Key informants included Burnett Mary Regional Group (BMRG)managers, planning and conservation officers from Bundaberg andGladstone Regional Councils, sports and recreation associations,and conservation council managers. Finally, volunteer participationin the study was encouraged through family, work, and friend re-ferrals. Individuals that did not receive formal invitations toparticipate in the study could request an access code dynamicallyon the website.
2.3. Methods for identifying ecological importance
We used the Species of National Environmental Significance(SNES) data generated by the Australian government to identifyareas of ecological importance within the Baffle Basin region(Department of Environment, 2015). To determine ecologicalimportance, we considered all 162 species that had range mapscovering the study region (53 bird, 43 fish, 22 plant, 20 mammal,and 24 reptile species). These range maps included species orhabitat distributions of nationally important threatened andmigratory species. This species range information was combined toidentify spatial areas of high ecological value.
In our ecological model, spatial importance was determinedusing a complementarity-based approach in Zonation software (v.3.2) that prioritizes (ranks) the individual locations of the studyarea based on their contributions to the overall landscape evalu-ation (Moilanen et al.,2009) The heuristic algorithm within Zona-tion uses all data available about the occurrence of biodiversityfeatures (in this case, species range maps) to generate a hierarchalprioritization of the landscape (Moilanen et al., 2012). For thepurpose of this study, we used core-area zonation as the cellremoval rule which attempts to minimise biodiversity loss byremoving cells with the lowest contributions to the overallecological value of the landscape. The removal index di for eachcell is calculated based on the following equation (adapted fromMoilanen, 2007):
di ¼ maxjQijðSÞci
where:
Qij is the extent of distribution of speciesj remaining in cell i in the remaining set of the cell Sci is the cost of adding celli to the prioritization analysis
According to this aggregation rule, Zonation starts removing thecells with the smallest contribution to overall ecological value andcontinues the process until no cells are left. The cells with lower di-values are removed sooner with the remaining cells having highervalues. By removing parts of species' distribution ranges during theprocess, the ecological value of the remaining distributions in-creases. Zonation retains the core areas of all species as high-qualitylocations until the end of the cell removal process. The algorithmgives greater priorities to cells with the highest occurrence levels ofthe species, regardless of the extent of their distribution overlap(Moilanen et al., 2012). This hierarchical process of ranking the grid
cells identifies the ecological importance of the study area based onthe aggregated distribution of SNES found within the study area.
2.4. Methods for identifying social importance
To operationalize the concept of social hotspots, it was neces-sary to select the most relevant mapped social values (see Table 1)for analysis. To be comprehensive, we defined two scenarios thatrepresent perceived biological importance from a social perspec-tive. In the first scenario, we used only mapped points for biologicalvalue. In the second scenario, we combined the biological pointswith intrinsic and wilderness points because Brown, Weber, & deBie, 2015 reported that these three landscape values werespatially correlated with biological importance derived from anexpert assessment using species distributions. Hereafter, we referthe second scenario as the multiple-value scenario.
To identify social value hotspots, we used the following threemethods: (1) kernel density function, as a non-parametric tech-nique, to identify regional (global) hotspots, (2) simple point den-sity which divides the number of mapped points by the cell area,and (3) GetiseOrd Gi* spatial statistic to identify local hotspotswithin the region. The kernel and simple density methods requirethe identification of a point density value “cut-off” to delineateareas of importance (hotspots) and thus we call these “value-based” hotspot methods. For value-based methods, there is singlepoint density value for the region that determines whether socialvalue densities comprise a hotspot. In contrast, the GetiseOrd Gi*statistic identifies hotspots by examining the distribution of pointswithin a defined, local cell neighbourhood and thus, there is nosingle point density that determines importance.
2.5. Global density methods
Kernel density maps were generated as continuous surfacesusing a 500 m grid cell size and 3000 m search radius, parametersthat were appropriate for this analysis based on the point distri-butions and the scale of the study area. Kernel density mapping is atechnique that fits a smoothly curved surface or kernel over eachobservation based on a specified bandwidth or search radius(Alessa et al., 2008). In our analysis, we used standardized kerneldensities to reduce the effect of density calculations derived fromvariable quantities of mapped points. Standardized kernel densitieswere calculated by subtracting the mean grid density from eachgrid cell value and dividing by the standard deviation of the griddensity. This process generated raster maps (hotspot maps) of so-cial values for the two modelling scenarios (biological only andmultiple-value).
2.6. Local hotspots (GetiseOrd Gi*)
The GetiseOrd Gi* method identifies whether a particularlocation is surrounded by lower or higher point densities thanexpected relative to the mean distribution. Specifically, the Gi*statistic measures the degree of association that results from theconcentration of all points within a radius of a certain distance fromthe original point (Getis& Ord,1992). The result is a raster map thatidentifies local hotspots (areas with significantly more points thanexpected at given distance) and coldspots (areas with significantlyfewer points than expected at a given distance). This analysis wasperformed on both social value scenarios (biological only andmultiple-value) using 95% confidence levels to determine the areasof spatial significance.

A. Karimi et al. / Applied Geography 63 (2015) 9e2014
2.7. Modelling alternatives for measuring coupled social-ecologicalspace
We considered multiple scenarios to measure socialeecologicalhotspots. Because social-ecological hotspots are the intersection oftwo spatial data layers representing important social and ecologicalareas, the degree of spatial overlap will be influenced by the size ofthe social and ecological data layers that are intersected. Largerhotspot areas will result in greater probability of spatial overlap inthe study region and potentially larger social-ecological space,while smaller hotspot areas have lower probability of spatialintersection and potentially smaller social-ecological space. Inmodelling social-ecological space, decisions must be made aboutthe quantitative importance threshold to apply which determinesthe size of the component hotspots. For global measures of pointdistributions, a critical density value (threshold or cut-off) is typi-cally applied to determine the spatial areas of hotspots. Thisthreshold (cut-off value) represents a subjective judgement. Lowerthreshold values produce larger hotspot areas, while largerthreshold values produce smaller hotspot areas. Given that evenstandardized densities can produce variable-sized hotspots basedon the number of point observations, and given that multiple datalayers will be intersected to identify social-ecological space, anargument can be made that the input hotspot data layers for socialand ecological importance should be standardized by area ratherthan using a subjective density threshold value. Thus, social andecological hotspot maps can be generated based on densitythreshold values and then spatially intersected, or social andecological hotspot maps can be generated based on an equalizedareas and then spatially intersected. In our analyses, we examinedboth optionsd(1) defining importance density thresholds for theinput data layers followed by spatial intersection, and (2) applyingan equal-area criterion for the input data layers followed by spatialintersection.
What is an appropriate density threshold to determine hot-spots? Selecting the top 30% of density values as a cut-off foridentifying hotspots has been used in multiple studies (Alessa et al.,2008; Whitehead et al., 2014) and we selected this value as ourbaseline for comparison. To be comprehensive, we selected twoadditional density cut-off values (top 10% and 50% of densityvalues) in addition to the 30% value to understand the potentialeffects of the cut-off value on social-ecological space. The frequencydistributions of cell densities were used to determine which spe-cific cells satisfied the density threshold criteria.
In the equal-area model, the component hotspot layers (socialand ecological) were equalized by area before spatial intersection. Ifthe social and ecological hotspot data layers are unequal in areabased on the importance threshold or cut-off, the smaller of thetwo component hotspot layers is increased based on importance tomatch (equalize) the larger hotspot component. In theory, eitherthe social or ecological hotspot data layer could comprise a largerproportion of the study area. In practice, the top 10, 30, and 50% ofthe most important ecological areas identified with Zonation soft-ware equates to 10, 30, and 50% of the study area respectively andwas the larger of the two component hotspot data layers. Stan-dardized social value densities were equalized in area with themost ecologically important areas based on the top 10, 30, and 50%importance thresholds.
2.8. Operationalizing social-ecological hotspot spatial concurrence
The combination of different model configurations (biologicalonly versus multiple social values), using kernel density and simpledensity with three density thresholds (10, 30, and 50%), theGetiseOrd Gi* local hotspot method, and application of the equal-
area criterion, provides 30 pairwise combinations of social valuehotspots for spatial intersection with the ecological importancedata generated from the Zonation output.
We used two methods to examine the spatial concurrence(overlap) between social and ecological hotspots in the region. Wecalculated the phi correlation coefficient (4) using a 2 � 2 contin-gency table where grid cell values represent the presence orabsence of the social or ecological hotspot in the same studylocation (grid cell). The phi coefficient is a variation of the Pearsoncorrelation coefficient that is used for binary data and is related tothe chi-square statistic (c2), where c2 ¼ n 42 (Chedzoy, 2006; Zhu,Pfueller, Whitelaw, & Winter, 2010). The phi coefficient measuresthe strength of the relationship on a scale from 0 to 1 where largervalues for phi indicate greater spatial overlap between the socialand ecological hotspot areas.
The Jaccard coefficient (Van Jaarsveld et al., 1998) directlymeasures the degree of spatial overlap between social-ecologicalhotspots in each scenario and can range from 0 to 100 percent. Alarger Jaccard coefficient indicates greater spatial concurrence be-tween each pair of social and ecological hotspot data layers. TheJaccard coefficient (J) was calculated as follows:
J ¼ Number of grid cells shared by social and ecological hotspot layersP
Number of additional grid cells for both layers
� 100
The degree of spatial concurrence for each of the social-ecological hotspot scenarios was calculated and plotted using linegraphs to show how spatial overlap changes under alternativedefinitions of social hotspots (biological value only and multi-value), with alternative hotspot density thresholds (10, 30, 50%),and by applying the equal-area criterion.
2.9. Relationship of social-ecological hotspots to protected areas
To understand the potential implications of SES hotspotmethods for regional conservation planning, SES hotspots wereoverlayed on a map of existing protected areas within the studyarea. This type of analyses identifies whether SES hotspots fallwithin or outside existing protected areas. Protected areas wereidentified based on their designation under the Nature Conserva-tion Act 1992 (QLD) and downloaded from the Queensland Gov-ernment website (Queensland Government, 2015). These areasinclude national and conservation parks with relatively high legalprotection from future development and comprise 612.3 km2
(14.9%) of Baffle Basin region. These protected areasweremerged tocreate a single protected areas spatial layer. We then overlayed SEShotspots that were generated using biological social values withhotspot density thresholds (10, 30, 50%) using density values (un-equal areas) and followed by overlay of equalized area hotspotcomponents. We calculated the area and percentage of theecological and social hotspot components and the SES hotspots thatwere inside/outside of the protected areas. For purposes of visu-alization, we generated maps showing the spatial overlay of bothdensity value-based SES and equal-area generated SES.
3. Results
3.1. Survey results and respondent characteristics
A total of 1835 households in the Baffle Basin were sampled andinvited to participate in the study. The response rates for the web-based and hardcopy PPGIS surveys were 11.7% and 44.6% respec-tively and provided 264 responses for analysis. The total number ofspatial attributes identified by respondents was 9190 (72% via web-

A. Karimi et al. / Applied Geography 63 (2015) 9e20 15
based and 28% via hardcopy surveys). The number of key in-formants and volunteers who participated in the survey was 24 and45, respectively. The distributions of landscape values mapped bythe key informant and volunteer sampling groups were comparedto the household sampling group and found to be similar. There-fore, we combined the data from the different sampling groups forspatial analyses.
A non-response bias check was performed by sending postcardsto non-participants, asking their reason(s) for non-participation.The dominant reason (38.2%) given by non-participants was lackof knowledge of the region. Other frequent reasons for non-participation included living outside the Baffle region (12%), nothaving enough time (10%), and being retired and no longer living inthe area (5.3%).
The majority of respondents (58%) were male. The age of allrespondents ranged from 19 to 90, with an average age of 59. Studyrespondents expressed a reasonably high level of self-assessedknowledge and familiarity with the study region, with 60% ofinternet respondents indicating their knowledge about the placesin the Baffle region was excellent or good, and 37% assessing theirknowledge as average or below average. About 52% of hardcopysurvey participants self-assessed their region knowledge as excel-lent or good.
A large proportion of internet respondents (83%) had visited allor almost all of the locations that they identified on the mapcompared with 58% of hardcopy participants. Given the similarityin point distributions between the internet and hardcopy re-spondents, we integrated the data from these two groups for spatialanalyses.
3.2. Social and ecological system mapping results
Weused kernel density, simple point density, and GetiseOrd GI*methods tomeasure the spatial distribution of social values (Fig. 3a,b, and c). The ecological hotspots were generated from spatialprioritization analysis undertaken based on the range maps of 162species in the region (Fig. 3d). These spatial distributions were usedfor measuring and comparing multiple social-ecological hotspotsscenarios.
3.3. Evaluation of social-ecological hotspot methods
We quantified the spatial overlap between each pair of socialand ecological hotspots for biological and multiple-value scenariosusing the phi and Jaccard coefficients. The results of the twomethods are presented in Table 2a and b. In both social value sce-narios using equal-area measurement and alternative density cut-offs, the Jaccard coefficients were larger relative to the phi corre-lations between the same social and ecological hotspot scenarios.The largest spatial overlap (about 50% with Jaccard) was observedbetween social and ecological values whenwe equalized the area ofimportance in both social and ecological hotspots using the top 50%as a cut-off. Using phi, there was little practical difference in thespatial overlap (about 30%) using either biological ormultiple-valuesocial hotspots, a 50% density cut-off, and the standardized kernelor point density methods.
The social hotspots in both biological and multiple-value sce-narios had larger spatial concurrence with ecological hotspotswhen applying equal-area measurement to the density cut-offs.There was also a notable trend in increasing spatial overlap (bothphi and Jaccard) with larger density cut-offs, regardless of theglobal methods used to generate the social hotspots (see Fig. 4a andc). For example, using phi, the spatial overlap increased from about5% (at 10% importance) to about 20% (at 30% importance), to about30% (at 50% importance). When using density value cut-offs
without applying the equal-area criterion, there was relatively lit-tle spatial overlap between social and ecological hotspot areas. Thedegree of spatial concurrence using Jaccard increased slightly withlarger density cut-off values, but spatial concurrence did not revealany significant trend across the different scenarios (see Fig. 4b andd). Without applying the equal-area criterion, there was little dif-ference in spatial concurrence when increasing the cut-offthreshold from 30% to 50%.
When using GetiseOrd Gi* analysis as a localised method forboth biological and multiple-value scenarios, there was signifi-cantly less spatial concurrence than with equal-area global densitymethods at 50% cut-off thresholds (according to phi coefficient)(Fig. 4a and c). When global density areas were not equalized,spatial overlap using GetiseOrd Gi* was considerably larger in bothsocial scenarios (Fig. 4b and d). The largest spatial concurrence wasobserved with GetiseOrd Gi* analysis at the 30% cut-off level.
3.4. Relationship between social-ecological hotspot methods andprotected areas
The spatial overlap of SES with existing protected areas wascalculated for hotspot importance thresholds (10, 30, 50%) with theequal-area criterion. The results appear in Table 3. The smallestarea, but largest percentage of spatial overlap occurred using the10% importance threshold. As would be expected, the area of SESspatial overlap with protected areas increased at 30% and 50%importance thresholds, while the percent of total SES area con-tainedwithin protected areas declined. The SES spatial overlapwithprotected areas was influenced more by the location ecologicalhotspots than the location of social hotspots as evidenced by thesignificantly larger percentages of ecological hotspots containedwith protected area boundaries. Thus, the most important SEShotspot areas (e.g. 10% threshold) are more likely to be locatedwithin existing protected areas, while less important SES areas arelikely to fall outside existing protected areas. Further, ecologicallyimportant locations derived from species distributions showsstronger spatial concurrence with protected area designation thanmapped social perceptions of biological importance. These spatialoverlay results are presented in Fig. 5b. For purposes of contrast, wealso mapped density value-based SES hotspots (Fig. 5a). Withoutequalizing the social and ecological hotspot areas before spatialintersection, the result was a relatively small SES area located nearthe mouth of Baffle Creek, with most of the terrestrial area of theSES located within an existing protected area (i.e., Mouth of BaffleCreek Conservation Park).
4. Discussion
The primary objective of this research was to measure andevaluate social-ecological hotspots under variable conditions thatincluded alternative social value definitions, multiple importancethresholds, local versus global hotspot identification methods, andtwo different metrics for calculating spatial concurrence. Thedetermination of social-ecological space (SES) was sensitive to boththe methods and the parameters chosen. In particular, the greatestdifference in SES calculation resulted when an equal-area hotspotcriteria was applied (or not) to the social importance thresholds.The sensitivity of SES measurements to unequal-area social andecological hotspots was reflected in the results of the twomeasuresof spatial concurrence, phi and Jaccard. Under conditions thatequalize social and ecological hotspot areas before spatial overlay,the Jaccard coefficient performed better in capturing anddescribing SES. When the use of importance thresholds producedhighly unequal social and ecological areas for overlay, the phimethod performed better in identifying SES.
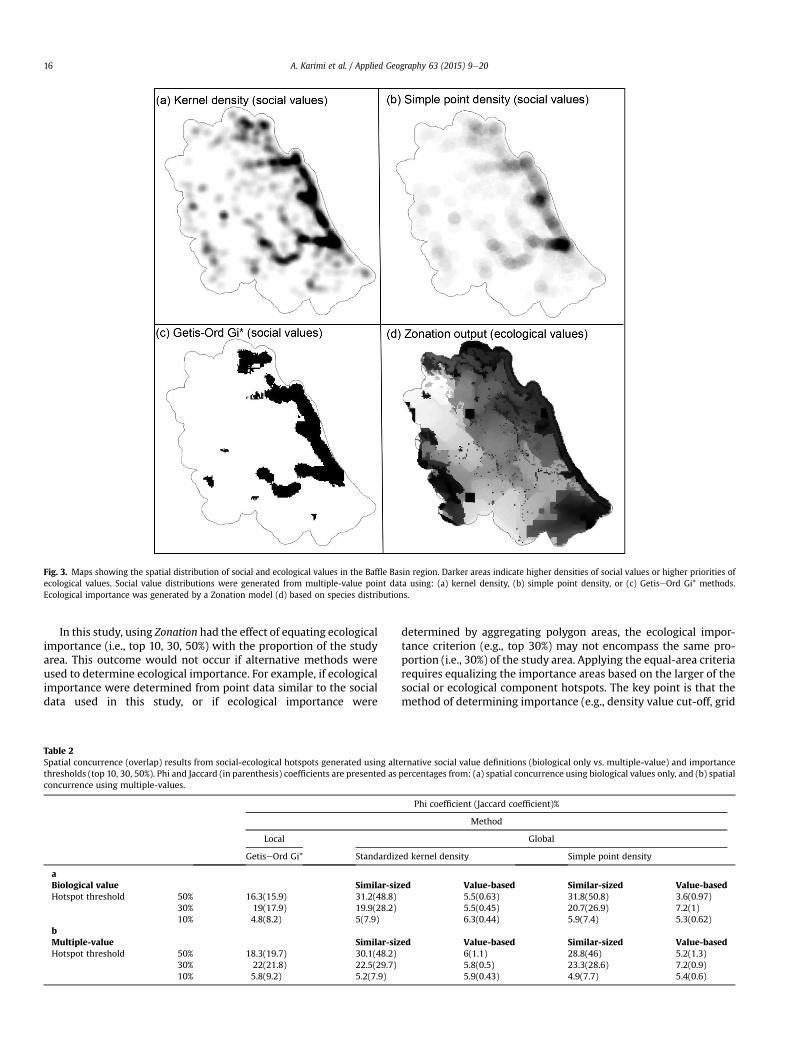
Fig. 3. Maps showing the spatial distribution of social and ecological values in the Baffle Basin region. Darker areas indicate higher densities of social values or higher priorities ofecological values. Social value distributions were generated from multiple-value point data using: (a) kernel density, (b) simple point density, or (c) GetiseOrd Gi* methods.Ecological importance was generated by a Zonation model (d) based on species distributions.
A. Karimi et al. / Applied Geography 63 (2015) 9e2016
In this study, using Zonation had the effect of equating ecologicalimportance (i.e., top 10, 30, 50%) with the proportion of the studyarea. This outcome would not occur if alternative methods wereused to determine ecological importance. For example, if ecologicalimportance were determined from point data similar to the socialdata used in this study, or if ecological importance were
Table 2Spatial concurrence (overlap) results from social-ecological hotspots generated using altthresholds (top 10, 30, 50%). Phi and Jaccard (in parenthesis) coefficients are presented asconcurrence using multiple-values.
Local
GetiseOrd Gi* Standardiz
aBiological value Similar-sizHotspot threshold 50% 16.3(15.9) 31.2(48.8)
30% 19(17.9) 19.9(28.2)10% 4.8(8.2) 5(7.9)
bMultiple-value Similar-sizHotspot threshold 50% 18.3(19.7) 30.1(48.2)
30% 22(21.8) 22.5(29.7)10% 5.8(9.2) 5.2(7.9)
determined by aggregating polygon areas, the ecological impor-tance criterion (e.g., top 30%) may not encompass the same pro-portion (i.e., 30%) of the study area. Applying the equal-area criteriarequires equalizing the importance areas based on the larger of thesocial or ecological component hotspots. The key point is that themethod of determining importance (e.g., density value cut-off, grid
ernative social value definitions (biological only vs. multiple-value) and importancepercentages from: (a) spatial concurrence using biological values only, and (b) spatial
Phi coefficient (Jaccard coefficient)%
Method
Global
ed kernel density Simple point density
ed Value-based Similar-sized Value-based5.5(0.63) 31.8(50.8) 3.6(0.97)5.5(0.45) 20.7(26.9) 7.2(1)6.3(0.44) 5.9(7.4) 5.3(0.62)
ed Value-based Similar-sized Value-based6(1.1) 28.8(46) 5.2(1.3)5.8(0.5) 23.3(28.6) 7.2(0.9)5.9(0.43) 4.9(7.7) 5.4(0.6)

Fig. 4. Line graphs showing phi and Jaccard (Jc) coefficients under alternative social value definitions (biological only vs. multiple-value) and importance thresholds (top 10, 30,50%). The four panels show: (a) biological value with equal-area measurement, (b) biological value with value-based measurement, (c) multiple-values with equal-area mea-surement, and (d) multiple-values with value-based measurement.
A. Karimi et al. / Applied Geography 63 (2015) 9e20 17
cell ranking, or simple heuristic judgment) determines the area ofimportance which has implications for using SES hotspots for landuse planning analysis.
Some additional context is important to help interpret the SESspatial concurrence findings. Using the phi coefficient, the degreeof SES spatial concurrence ranged from 5% to a maximum of about32% under conditions that equalized social and ecological hotspotareas at 50% importance thresholds (Table 2a). Although one wouldnot expect SES spatial concurrence to approach 100% under the bestof conditions, an important question concerns the level of SESspatial concurrence that would be considered “normal” (or base-line) for the SES variable being measured (in this case, biologicalimportance). Although this study was the first to quantify spatialconcurrence under variable conditions, a previous study by Brown,Smith, Alessa, and Kliskey (2004) collected spatially-explicit publicperceptions of biological importance using PPGIS and comparedthe results with biologically important areas identified by a panel ofbiological “experts”. That study reported spatial concurrence ofabout 30% between the PPGIS and expert assessments. Althoughthe previous study used a different method to assess biologicalimportance (expert polygon delineation vs. Zonation modelling),the studies appear similar enough to suggest that the SES spatialconcurrence findings in this study fall within the range of
Table 3Social-ecological hotspot area (% of area) located inside and outside of designated terrethresholds.
10% Threshold
Ecological hotspot (from zonation) 108 km2 (45.1%) 132 km2
Social hotspot (biological only values) 99 km2 (25.2%) 294 km2
SES hotspot (equal area criterion applied) 20 km2 (47.4%) 23 km2
expectations, reaching a maximum near 30% spatial concurrence.Thus, the evaluation of SES hotspot methods for biological impor-tance suggests that the expected range of SES spatial concurrence isnot 0e100% but rather has maximum spatial concurrence near 50%.The question is why?
The assessment of biological importance from an ecologicalperspective differs from the assessment of biological importancefrom a social perspective. In this study, biological importance wasdetermined through the ranking of spatial locations based onspecies range maps. The social assessment of biological importancewas much broader and included perceptions based on personalexperience with nature, socialization processes, or informationreceived through social networks or media. When individual per-ceptions of biological importance are aggregated, they becomemeasures of collective social importance, albeit with a high degreeof spatial variability. The fact that ecological and social hotspots forbiological importance exhibit low to moderate spatial concurrencemay be viewed as a positive outcome because different importancesystems are being combined to identify multi-criteria importantareas.
An important question is whether the findings of this study canprovide guidance for assessing social-ecological space in othersettings and conditions. This study was situated in a specific
strial protected areas in the Baffle Basin study area under alternative importance
30% Threshold 50% Threshold
331 km2 (37.2%) 558 km2 510 km2 (29.5%) 1219 km2
353 km2 (27.6%) 926 km2 2043 (24.4%) 1584 km2
834 (46.4%) 241 km2 1743 (35.1%) 806 km2

Fig. 5. Comparisons of social-ecological hotspots generated with 10%, 30%, and 50% importance thresholds and their distributions in the study area with existing protected areasusing: (a) density value-based thresholds, and (b) equal-area criterion applied to importance thresholds.
A. Karimi et al. / Applied Geography 63 (2015) 9e2018
geographic and social context (Baffle Basin region, Australia), usedparticipatory mapping methods with residents to identify impor-tant social values and species range maps to identify importantecological values, and evaluated a diverse, but not exhaustive, list ofmethods for measuring social-ecological space. The social impor-tance data was based on an adequate, but not exceptionally largesample of regional residents while the ecological importance datawas modelled from species range maps, each of which has its ownlimitations in accuracy and validity. Under these circumstances, theidentification of SES must necessarily be tentative, but as the firstresearch effort to examine alternative methods for measuringsocial-ecological hotspots, we developed some decision rules inTable 4 derived from the combination of parameters examined inthis study.
If SES are to be determined using hotspot thresholds thatmeasure the highest social and ecological importance (e.g., top 10%criterion), the use of either global (kernel or simple density) or localhotspot methods (GetiseOrd Gi*) provide comparable results. Butarguably, the choice of a 10% hotspot threshold for SES analysis has
Table 4Suggested guidelines for identifying social-ecological hotspots under different scenarios
Large differential between social and ecological h(value-based)
Biological value Multiple- valu
Smaller Cut-off 10% No difference in methods No differenceLarger cut-off 30% GetiseOrd Gi* GetiseOrd Gi*
50% GetiseOrd Gi* GetiseOrd Gi*
limited utility for regional conservation planning because futureproposed land uses do not generally involve the most ecologicallyimportant areas because these areas have already received someform of legal, protected status. Indeed, almost half of the top 10%most ecologically important areas identified in the Baffle region arelocated within existing national parks and protected areas.Following this logic, the most relevant areas for land use planninganalysis would be SES hotspots, but not necessarily the mostimportant SES areas in the region. Proposed changes in land use(e.g., new residential development or new mining activity) oftenoccur “on the margin” in areas that are biologically important, butperhaps not identified as most important. This would suggestselecting more liberal hotspot importance thresholds (for exampletop 30e50%) to identify SES hotspots outside of protected areas.The SES hotspots could be used to identify and rank areas forprotection occurring outside of designated protected areas. Giventhat some of these areas may be privately owned, these lands couldbe further classified according to level of protection as identified byBrown et al., (2015). Thus, conservation planning would consist of a
.
otspots area Similar-sized areas
e Biological value Multiple- value
in methods No difference in methods No difference in methodsGlobal methods Global methodsGlobal methods Global methods

A. Karimi et al. / Applied Geography 63 (2015) 9e20 19
two-step process that involves regional assessment of SES hotspots(described herein), followed by more specific assessment of theareas that comprise SES hotspots outside of designated protectedareas.
Larger SES importance thresholds appear more relevant toregional conservation planning analysis and decision support asthey identify larger areas outside of protected areas that meritfurther conservation consideration. More specifically, we wouldrecommend applying equal-area criterion using global methodswith larger importance thresholds (e.g., 30e50%). As a generalprinciple, we recommend applying the equal-area criterion towhatever importance threshold is chosen. If density value-basedmethods are used, there is a higher probability of generating un-equal area social and ecological hotspots as input to SES hotspotdetermination, resulting in smaller SES hotspots. These value-based methods also introduce a type of implicit weightingwherein the larger of the two component hotspots (either social orecological) exerts greater influence in SES identification. Underthese conditions, we recommend using GetiseOrd Gi* to identifySES hotspots at 30%e50% because this method generates larger SESareas than kernel or simple density methods (see Table 3).
The validity of social-ecological hotspots depends on the qualityof spatial data used to generate the social and ecological impor-tance maps. Both the social and ecological maps have importantlimitations. We attempted to obtain a large, representative sampleof PPGIS study participants in the study region, but were onlymarginally effective in our recruitment efforts. Survey responserates have been declining over the past decade, increasing thechallenge for researchers to collect representative social data. OurPPGIS household sampling response rates (12% internet, 44%hardcopy) were typical of response rates reported in other PPGISstudies in developed countries (see Brown & Kytta, 2014), butwould have benefited from a larger sample size because thequantity of point data available for density analysis is directlyrelated to the number of study participants. The ecological impor-tance spatial data layer was limited to consideration of speciesranges within the region. Additional ecological variables could havebeen included in the Zonation model and weightings could havebeen applied to different species.
If the social-ecological systems conceptual framework is tosupport and guide conservation and other land use planning,additional applied research will be needed in other study contexts.Case study research is inherently limited to the set of conditions inwhich the research is undertaken. Different ecoregions in othercountries would have differences in the distribution of species andhabitats, as well as potentially different social values for biologicalimportance, both of which would influence the spatial distributionof the component social and ecological hotspots that determine SEShotspots. For example, some societies might emphasize the utili-tarian, consumptive use of biological resources as a measure ofbiological importance while other societies might express appre-ciative, non-consumptive values that drive biological importance.In the determination of ecological importance, other ecologicalvariables such as vegetation communities, climate, and soil typescould be used to determine ecological importance. Regardless ofthe methods used to measure social and ecological importancewithin a given social and biophysical context, we suggest the spatialintegration guidelines provided herein are robust enough toaccommodate these differences to identify SES hotspots.
Further, there is a need to better integrate SES concepts intoexisting spatial decision support tools. One recent and innovativeapproach has been to directly include spatially-explicit socialvalues from PPGIS into conservation assessment models such asZonation to identify conservation prioritizations (Whitehead et al.,2014). The approach presented herein differs in that it prioritizes
social and ecological importance data independently and then in-tegrates the spatial data layers using simple spatial overlay tech-niques. There is merit in both approaches. Our preference is to keepsocial and ecological importance data layers separate and outsidethe complexity of a model for simplicity and transparency. SEShotspot maps allow one to easily visually determine whetherecological or social importance (or both) will be significant factorsin future decisions.
Acknowledgement
The authors are grateful for financial support from the School ofGeography, Planning and Environmental Management at the Uni-versity of Queensland, and technical support from the Burnett MaryRegional Group staff. The authors also thank Dr. Ayesha Tulloch forher technical support with analyses using Zonation software.
References
Alessa, L., Kliskey, A., & Brown, G. (2008). Socialeecological hotspots mapping: aspatial approach for identifying coupled socialeecological space. Landscape andUrban Planning, 85(1), 27e39.
Australian Bureau of Statistics. (2013). Australian demographic statistics December2012. Available from: http://www.abs.gov.au/ausstats/[email protected]/Latestproducts/3101.0Media%20Release1Dec%202012?opendocument&tabname¼Summary&prodno¼3101.0&issue¼Dec%202012&num¼&view¼ Accessed 11.09.13.
Baldwin, K., & Mahon, R. (2014). A participatory GIS for marine spatial planning inthe Grenadine Islands. Electronic Journal of Information Systems in DevelopingCountries, 63(7), 1e18.
Berkes, F., Colding, J., & Folke, C. (2003). Navigating social-ecological systems:Building resilience for complexity and change. Cambridge: Cambridge UniversityPress.
Binney, J. (2008). The economic and social implications of the Baffle Creek Basin waterresource plan. Marsden Jacob Associates.
Brown, G. (2005). Mapping spatial attributes in survey research for natural resourcemanagement: methods and applications. Society & Natural Resources, 18(1),17e39.
Brown, G., & Fagerholm, N. (2015). Empirical PPGIS/PGIS mapping of ecosystemservices: a review and evaluation. Ecosystem Services, 13, 119e133.
Brown, G., & Kytta, M. (2014). Key issues and research priorities for public partici-pation GIS (PPGIS): a synthesis based on empirical research. Applied Geography,46, 122e136.
Brown, G., & Raymond, C. (2007). The relationship between place attachment andlandscape values: toward mapping place attachment. Applied Geography, 27(2),89e111.
Brown, G., & Reed, P. (2009). Public participation GIS: a new method for use innational forest planning. Forest Science, 55(2), 166e182.
Brown, G., Smith, C., Alessa, L., & Kliskey, A. (2004). A comparison of perceptions ofbiological value with scientific assessment of biological importance. AppliedGeography, 24(2), 161e180.
Brown, G., & Weber, D. (2011). Public participation GIS: a new method for nationalpark planning. Landscape and Urban Planning, 102(1), 1e15.
Brown, G., & Weber, D. (2013). Using public participation GIS (PPGIS) on the Geo-web to monitor tourism development preferences. Journal of SustainableTourism, 21(2), 192e211.
Brown, G., Weber, D., & de Bie, K. (2015). Is PPGIS good enough? An empiricalevaluation of the quality of PPGIS crowd-sourced spatial data for conservationplanning. Land Use Policy, 43, 228e238.
Butler, J. R. A., Kroon, F. J., Brodie, J. E., Wong, G. Y., Metcalfe, D. J., Honz�ak, M., et al.(2011). An analysis of trade-offs between multiple ecosystem services andstakeholders linked to land use and water quality management in the GreatBarrier Reef, Australia. Agriculture, Ecosystems & Environment, 180(1), 176e191.
Chedzoy, O. B. (2006). Phi-coefficient. Encyclopedia of statistical sciences. Wiley &Sons.
Department of Environment. (2015). Species of national environmental significance.Available from: http://www.environment.gov.au/science/erin/databases-maps/snes Accessed 17.04.15.
Folke, C., Hahn, T., Olsson, P., & Norberg, J. (2005). Adaptive governance of social-ecological systems. Annual Review of Environment and Resources, 30(1),441e473.
Getis, A., & Ord, J. K. (1992). The analysis of spatial association by use of distancestatistic. Geographical Analysis, 24(3), 189e206.
Great Marine Reef Marine Park Authority. (2012). Baffle Basin assessment. Burnett-Mary Regional Management Group NRM Region.
Knight, A. T., Cowling, R. M., Difford, M., & Campbell, B. M. (2010). Mapping humanand social dimensions of conservation opportunity for the scheduling of con-servation action on private land. Conservation Biology, 24(5), 1348e1358.
Kremen, C., Cameron, A., Moilanen, A., Phillips, S. J., Thomas, C. D., Beentje, H., et al.

A. Karimi et al. / Applied Geography 63 (2015) 9e2020
(2008). Aligning conservation priorities across taxa in Madagascar with high-resolution planning tools. Science, 320(5873), 222e226.
Margules, C. R., Nicholls, A. O., & Pressey, R. L. (1988). Selecting networks of reservesto maximise biological diversity. Biological Conservation, 43(1), 63e76.
McLain, R., Poe, M., Biedenweg, K., Cerveny, L., Besser, D., & Blahna, D. (2013).Making sense of human ecology mapping: an overview of approaches tointegrating socio-spatial data into environmental planning. Human Ecology,41(5), 651e665.
Moilanen, A. (2007). Landscape zonation, benefit functions and target-basedplanning: unifying reserve selection strategies. Biological Conservation, 134(4),571e579.
Moilanen, A., & Kujala, H. (2008). Zonation. Spatial conservation planning frameworkand software. Version 3.1.11. User manual (p. 288). http://cbig.it.helsinki.fi/.
Moilanen, A., Leathwick, J. R., & Quinn, J. M. (2011). Spatial prioritization of con-servation management. Conservation Letters, 4(5), 383e393.
Moilanen, A., Meller, L., Lepanen, J., Montesino Pouzols, A., Arponen, A., & Kujala, H.(2012). Zonation: Spatial conservation planning framework and software version3.1 user manual. Helsinki: Helsingin Yliopisto.
Moilanen, A., Wilson, K. A., & Possingham, H. (2009). Spatial conservation prioriti-zation: Quantitative methods and computational tools. Oxford: Oxford UniversityPress.
Ostrom, E. (2009). A general framework for analysing sustainability of social-ecological systems. Science, 325(5939), 419e422.
Plieninger, T., Oteros Rozas, E., Dijks, S., & Bieling, C. (2013). Assessing, mapping andquantifying cultural ecosystem services at community level. Land Use Policy, 33,118e129.
Pocewicz, A., Nielsen-Pincus, M., Brown, G., & Schnitzer, R. (2012). An evaluation ofinternet versus paper-based methods for public participation geographic in-formation systems (PPGIS). Transactions in GIS, 16(1), 39e53.
Pollino, C. A., White, A. K., & Hart, B. T. (2007). Examination of conflicts andimproved strategies for the management of an endangered Eucalypt speciesusing Bayesian networks. Ecological Modelling, 201(1), 37e59.
Pressey, R. L., Humphries, C. J., Margules, C. R., Vane-Wright, R. I., & Williams, P.(1994). Beyond opportunism: key principles for systematic reserve selection.Biological Conservation, 67(3), 279e279.
Pressey, R. L., Johnson, I. R., & Wilson, P. D. (1994). Shades of irreplaceability:
towards a measure of the contribution of sites to a reservation goal. Biodiversityand Conservation, 3(3), 242e262.
Queensland Government. (2015). Protected areas of Queensland series. Availablefrom: https://data.qld.gov.au/dataset/protected-areas-of-queensland-seriesAccessed 29.05.15.
Ramirez-Gomez, S. O. I., Brown, G., & Tjon, A. S. F. (2013). Participatory mappingwith indigenous communities for conservation: challenges and lessons fromSuriname. The Electronic Journal of Information Systems in Developing Countries,58(2), 1e22.
Redman, C. L., Grove, J. M., & Kuby, L. H. (2004). Integrating social science into thelong-term ecological research (LTER) network: social dimensions of ecologicalchange and ecological dimensions of social change. Ecosystems, 7(2), 161e171.
Reef Water Quality Protection Plan. (2013). Burnett-Mary region second report card2010 baseline. Available from: www.reefplan.qld.gov.au Accessed 30.05.14.
Sieber, R. (2006). Public participation geographic information systems: a literaturereview and framework. Annals of the Association of American Geographers, 96(3),491e507.
St Martin, K., & Hall-Arber, M. (2008). The missing layer: geo-technologies, com-munities, and implications for marine spatial planning. Marine Policy, 32(5),779e786.
Van Jaarsveld, A. S., Freitag, S., Chown, S. L., Muller, C., Koch, S., Hull, H., et al. (1998).Biodiversity assessment and conservation strategies. Science, 279(5359),2106e2108.
Walker, B., Holling, C. S., Carpenter, S. R., & Kinzig, A. (2004). Resilience, adaptabilityand transformability in social-ecological systems. Ecology and Society, 9(2),5e13.
Whitehead, A. L., Kujala, H., Ives, C. D., Gordon, A., Lentini, P. E., Wintle, B. A., et al.(2014). Integrating biological and social values when prioritizing places forbiodiversity conservation. Conservation biology, 28(4), 992e1003.
Wu, J., & Hobbs, R. (2002). Key issues and research priorities in landscape ecology:an idiosyncratic synthesis. Landscape Ecology, 17(4), 355e365.
Yell123. (2014). Business directories. Available from: http://yell123.com/ Accessed01.02.14.
Zhu, X., Pfueller, S., Whitelaw, P., & Winter, C. (2010). Spatial differentiation oflandscape values in the Murray river region of Victoria, Australia. EnvironmentalManagement, 45(5), 896e911.