Methods10.1007... · Web viewNovel gemcitabine conjugated albumin nanoparticles: a potential...
16
Novel gemcitabine conjugated albumin nanoparticles: a potential strategy to enhance drug efficacy in pancreatic cancer treatment Varun Kushwah 1,2 3 , Ashish Kumar Agrawal 1,2 , Chandra Prakash 1 , David Mallinson 3 , Dimitrios A. Lamprou 3,4 , Ramesh C. Gupta 2 , Sanyog Jain 1 * 1 Centre for Pharmaceutical Nanotechnology, Department of Pharmaceutics, National Institute of Pharmaceutical Education and Research, SAS Nagar, Punjab, India. 2 James Graham Brown Cancer Centre, University of Louisville, Louisville, KY, USA. 3 Strathclyde Institute of Pharmacy & Biomedical Sciences (SIPBS), University of Strathclyde, Cathedral Street, Glasgow, G4 0RE, United Kingdom. 4 Medway School of Pharmacy, University of Kent, Medway Campus, Anson Building, Central Avenue, Chatham Maritime, Chatham, Kent, ME4 4TB, United Kingdom.
-
Upload
truongkien -
Category
Documents
-
view
216 -
download
0
Transcript of Methods10.1007... · Web viewNovel gemcitabine conjugated albumin nanoparticles: a potential...

Novel gemcitabine conjugated albumin nanoparticles: a potential strategy to enhance drug
efficacy in pancreatic cancer treatment
Varun Kushwah1,2 3, Ashish Kumar Agrawal1,2, Chandra Prakash1, David Mallinson3, Dimitrios
A. Lamprou3,4, Ramesh C. Gupta2, Sanyog Jain1*
1Centre for Pharmaceutical Nanotechnology, Department of Pharmaceutics, National Institute of
Pharmaceutical Education and Research, SAS Nagar, Punjab, India.2James Graham Brown Cancer Centre, University of Louisville, Louisville, KY, USA.3Strathclyde Institute of Pharmacy & Biomedical Sciences (SIPBS), University of Strathclyde,
Cathedral Street, Glasgow, G4 0RE, United Kingdom.4Medway School of Pharmacy, University of Kent, Medway Campus, Anson Building, Central
Avenue, Chatham Maritime, Chatham, Kent, ME4 4TB, United Kingdom.
* To whom correspondence should be addressed: E-mail: [email protected],
[email protected], Tel.: +91-172-2292055, Fax: +91-172-2214692

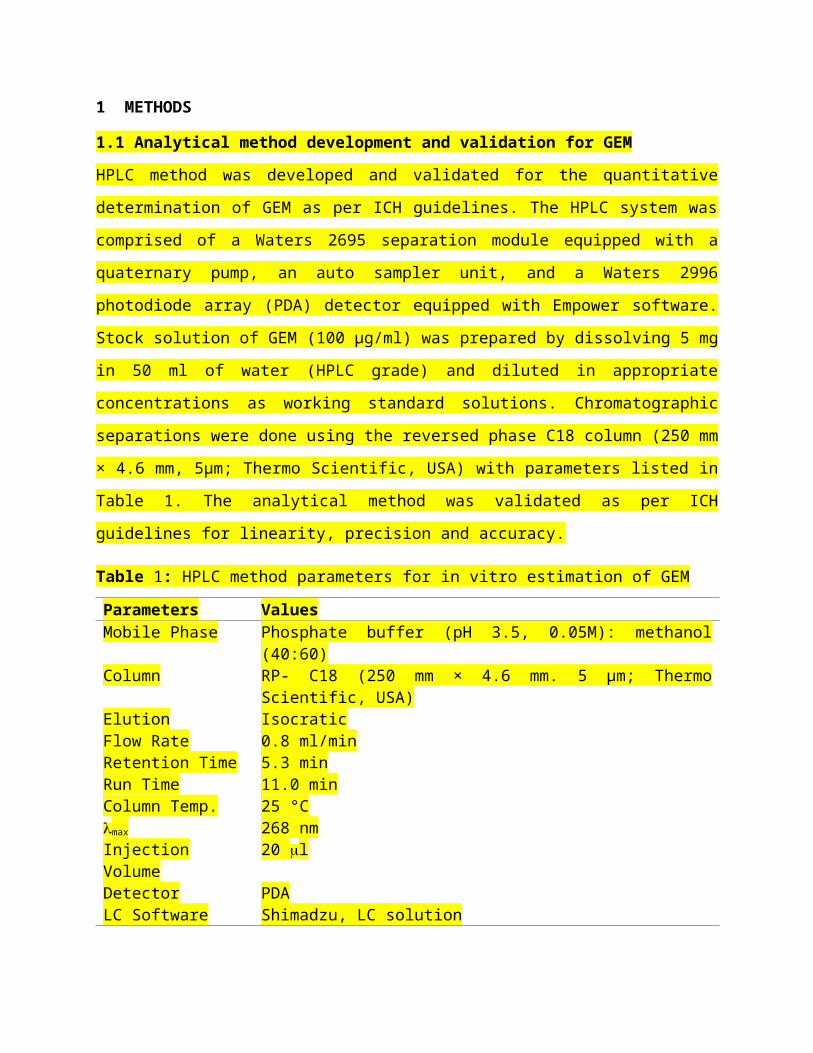
1 METHODS
1.1 Analytical method development and validation for GEM
HPLC method was developed and validated for the quantitative determination of GEM as per
ICH guidelines. The HPLC system was comprised of a Waters 2695 separation module equipped
with a quaternary pump, an auto sampler unit, and a Waters 2996 photodiode array (PDA)
detector equipped with Empower software. Stock solution of GEM (100 µg/ml) was prepared by
dissolving 5 mg in 50 ml of water (HPLC grade) and diluted in appropriate concentrations as
working standard solutions. Chromatographic separations were done using the reversed phase
C18 column (250 mm × 4.6 mm, 5μm; Thermo Scientific, USA) with parameters listed in Table
1. The analytical method was validated as per ICH guidelines for linearity, precision and
accuracy.
Table 1: HPLC method parameters for in vitro estimation of GEM
Parameters ValuesMobile Phase Phosphate buffer (pH 3.5, 0.05M): methanol (40:60) Column RP- C18 (250 mm × 4.6 mm. 5 μm; Thermo Scientific, USA) Elution Isocratic Flow Rate 0.8 ml/min Retention Time 5.3 minRun Time 11.0 min Column Temp. 25 °C max 268 nm Injection Volume 20 l Detector PDALC Software Shimadzu, LC solution
1.1.1 Linearity and range
Standard calibration curve was constructed in the concentration range of 1-50 μg/ml, showing
good linearity with correlation coefficient of 0.999 and other validation parameters (Table 2).
Table 2: HPLC method validation parameters for in vitro method
Parameter ValueRange 1-50 µg/mlLinearity (R2) 0.999±0.002Slope 72816.94±885.72Intercept 1907.92±60.30LOD 0.0027 µg/mlLOQ 0.0083 µg/ml
Values are expressed as mean ± SD (n=6)
1.2 Synthesis of GEM-BSA Conjugate
The GEM-BSA conjugate was synthesized via carbodiimide chemistry (Scheme 1) and the
chemical structure of GEM and GEM-BSA conjugate was authenticated via NMR analysis via
dissolving conjugate in D2O (Sigma-Aldrich Inc., USA) with 0.1% TMS as an internal reference.
The NMR analysis was done using Bruker BioSpin (Fallanden, Switzerland) Avance III 400
MHz NMR spectrometer (9.4 T, 54 nm vertical-bore magnet) equipped with a 5 mm BBFO-Plus
multinuclear probehead with Z-Gradient, operating at a proton frequency of 400.13 MHz. The
spectroscopic task was controlled by a HP xw-4600 workstation, and the spectral plotting was
obtained using Bruker TOPSPIN 2.1. The following abbreviations have been used in the
assignment of NMR peaks: s = singlet; d =doublet; t = triplet. The proton/carbon highlighted in
bold represents the proton/carbon under investigation.
Synthesis of acetylated intermediate of GEM
GEM (120 mg, 0.4 mmol; Fig. 1) was dissolved in methanol (by adding few drops of
triethylamine) and refluxed with acetic anhydride (61.2 mg, 0.6 mmol) in presence of anhydrous
pyridine (2 ml). After 24 h, the reaction mixture was allowed to cool and precipitated by-
products were filtered out. Purification of the acetylated intermediate of GEM (Fig. 2) was
achieved using column chromatography technique. Briefly, resultant mixture was adsorbed on
100-200 mesh size silica gel and eluted by hexane-ethyl acetate solvent system. Solvents were
concentrated on rotary evaporator and further dried in vacuum under reduced pressure.
Synthesis of succinylated intermediate of GEM
Acetylated intermediate of GEM (34.7 mg, 0.1 mmol; Fig. 3) was dissolved in DCM and
refluxed with succinic anhydride (15 mg, 0.15 mmol) in presence of anhydrous pyridine (1 ml).
After 24 h, the reaction mixture was allowed to cool and precipitated by-products were filtered
out. Purification of the succinylated intermediate of GEM was achieved using column
chromatography technique. Briefly, resultant mixture was adsorbed on 100-200 mesh size silica
gel and eluted by hexane - ethyl acetate solvent system. Solvents were concentrated on rotary
evaporator and further dried in vacuum under reduced pressure.
Synthesis of GEM-BSA Conjugate
For synthesis of GEM-BSA Conjugate (Fig. 4), the succinylated intermediate of GEM was
transformed initially to its activated NHS ester using standard protocol of carbodiimide
activation and then conjugated it with BSA. Briefly, Succinylated intermediate (0.1 mmol) was

dissolved in DMSO and activated with stoichiometric molar equivalent of EDC/NHS in presence
of pyridine. An excess of DMSO was used to enable the protein unfolding to a larger extent
thereby increasing the degree of hydrophobization; the mixture was stirred at room temperature
for 12 h. BSA (1 mmol) was added to the reaction mixture. The pH of the reaction mixture was
then adjusted to the pI of BSA after 12 h and the final mixture was precipitated using 100 ml of
acetone. The precipitated solution was centrifuged at 2000-3000 rpm for 20 min. The supernatant
was discarded and after deacetylation (acetylaed GEM-BSA conjugate incubated with 2 N NaOH
for 4 h and further kept overnight in the presence of amberlite resin to remove excess NaOH), the
resultant GEM-BSA conjugate was obtained and was characterized via NMR (Figure 1).
Scheme 1: Schematic illustration depicting the synthesis of GEM-BSA conjugate.

1H NMR of GEM (δ, D2O, ppm, 400 MHz): 9.37 (1H, s, H-1); 8.55 (1H, s, H-1); 7.98 (1H, d,
H-2); 6.25 (1H, d, H-3); 6.20 (1H, t, H-4); 4.39-4.31 (1H, m, H-5); 4.09-4.06 (1H, m, H-6); 4.00-
3.96 (1H, dd, H-7); 3.85-3.81 (1H, dd, H-7). 1H NMR of GEM-BSA conjugate (δ, D2O, ppm, 400 MHz): 8.32 (1H, s, H-1); 7.68 (1H, d, H-
2); 7.55-7.10 (m, aromatic protons of BSA); 6.01-5.93 (2H, m, H-3 and H-4); 3.94-3.80 (2H, m,
H-5 and H-6); 3.72-3.68 (2H, dd, H-7); 2.59 (1H, s, CH2 of succinic acid). 2.31-1.49 (m,
aliphatic protons of BSA).
Figure 1: 1H NMR spectra of A: GEM; B: GEM-BSA Conjugate
1.3 Characterization of GEM-BSA conjugate
1.3.1 Degree of modification (TNBS method)
The extent of conjugation between GEM and BSA was measured by evaluating the free amino
groups in BSA via 2,4,6 trinitrobenzenesulfonic acid (TNBS) reagent (27, 28). Briefly, 200 µL
of 1 mg/mL BSA (3.0303 µM final assay concentration) and GEM-BSA conjugate solution was
added to 600 µL 0.1 M sodium bicarbonate buffer (pH 8.5). TNBS (200 µL, 0.1%) was added to
the above mixture and kept for incubation at 37 °C in dark for 2 h. The absorbance of each
solution was measured at 340 nm using UV/Vis spectrophotometers (BioTek, USA). The molar
concentration of amine groups present in each sample was measured by using standard
calibration curve of known L-lysine concentrations (Eq. 1)
DM=CBSA−CGEM−BSA /CBSA× 100 (1)
Where, CBSA and CGEM−BSA are the concentration of free primary amino in BSA and GEM-BSA
conjugate, respectively
Furthermore, to evaluate the critical conjugation concentration, various ratios of GEM and BSA
(0.05:1, 0.1:1 and 0.15:1) were taken for the synthesis of GEM-BSA conjugate and further
analysed for the molar concentration of amine groups as per the protocol mentioned above.
1.3.2 Fluorescence spectroscopy
The conjugation of GEM with BSA was further analysed by measuring the intrinsic tryptophan
fluorescence emission spectra of ALB and GEM-ALB conjugate. Fluorescence readings of
samples were excited at 280 and the emission was recorded in the range from 300-400 (Peak
fluorescence intensity at 360 nm) in 96 well plate fluorescence reader Synergy 2, BioTek.
1.4 Characterization of GEM-BSA NPs
1.4.1 Freeze drying of GEM-BSA NPs
To further enhance the storage stability, the developed GEM-BSA NPs were lyophilized using
(Vir Tis, Wizard 2.0, New York, USA freeze-dryer) our previously patented stepwise freeze-
drying cycle with slight modification (32, 33). Briefly, the samples were subjected to freeze-
drying cycle comprised of freezing at −60 °C for 8 h, primary drying at −60 to 20 °C for 42 h,
and secondary drying at 25°C for 2 h. A constant pressure of 200 Torr was applied in each step.
Different cryoprotectants viz., trehalose, mannitol, and sucrose were screened at 5% w/v during
preliminary screening and mannitol was finalized based on the redispersibility index, and
reconstitution score of the freeze-dried nanoparticles. Mannitol was further optimized for the
efficient concentration between the range of 2.5−10% w/v.
1.4.2 Accelerated stability studies
Freeze dried NPs, with mannitol as a cryoprotectant, were assessed for accelerated stability
studies over a period of 6 months as per the protocol described in our earlier reports (35, 36). The
optimized nanoparticles were kept in stability chamber with temperature of 25±2 °C and RH
60%±5%. After 6 months, the nanoformulations were then evaluated for change in particle size.

1.5 In-vitro cell culture experiments
1.5.1 Energy dependence of cellular uptake
MIA PaCa-2 and PANC-1 cells (5x10⁴ cells/well) were separately seeded in 6-well plates and
incubated for 24 h. The cells were than incubated at 4 ºC and in presence of sodium azide (1
mg/mL) for 1 h, respectively.(39) C-6 loaded GEM-BSA NPs were added and incubated for an
additional 2 h, and the cells were then washed three times with HBSS for three times to remove
the extracellular particles and fixed with 3% paraformaldehyde and observed under CLSM.
2 RESULTS
2.1 Characterization of GEM-BSA conjugate
2.1.1 Degree of modification (TNBS method)
The quantitative estimation of amino groups in the L-lysine in the concentration range of 1-20
μg/mL was evaluated and used as a reference. The degree of modification of free amine groups
of BSA of conjugates synthesized with different GEM and BSA ratio was analysed to evaluate
the critical conjugation concentration.
Table 3: Degree of modification of GEM-BSA conjugate synthesized from various ratio of GEM:BSA
BSA GEM-BSA conjugate synthesized from various ratio of GEM:BSA
0.05:1 0.1:1 0.15:1Free amino group concentration
177.6 ± 8.3
170.6 157.3 ± 11.3 154.9 ± 9.25
Degree of modification (DM) %
3.9% 11.4% 12.3%
Values are presented as mean ± SD (n=6).
As evident from the Table 3, at ratio of 0.05:1 molar ratio, the degree of modification was found
to be significantly low as compared to 0.1:1 molar ratio of GEM and BSA. While, on increasing
the ratio of GEM and BSA to 0.15:1, slight increment in the degree of modification was
observed, suggesting inefficient/saturation in conjugation of GEM with BSA. Consequently,
0.1:1 molar ratio of GEM and BSA was considered as an optimal ratio for the synthesis of GEM-
BSA conjugate.
The molar concentration of free amino groups in BSA and GEM-BSA (synthesized with 0.1:1
ratio of GEM and BSA) was found to be 177.6 ± 8.3 μmol and 157.3 ± 11.3 μmol, respectively.

The corresponding reduction of the amino groups in GEM-BSA conjugate as compared to BSA
was a result of conjugation of GEM with BSA via amide bond. Assuming amino groups of BSA
as 100%, the degree of conjugation of GEM was found to be 11.4% (Table 4)
Table 4: Degree of modification determined via 2,4,6-trinitrobenzene sulfonic acid (TNBS) method
BSA (μmol) GEM-BSA (μmol)Free amino group concentration 177.6 ± 8.3 157.3 ± 11.3Degree of modification (DM) % 11.4%
Values are presented as mean ± SD (n=6).
2.1.2 Fluorescence spectroscopy
GEM-BSA conjugate resulted in about 41.93% quenching of fluorescence intensity (counts) of
19648.2 ± 427.2 as compared to 46857.6 ± 563.3 of native BSA. The fluorescence quenching
observed in case of GEM-BSA conjugate may be assigned to some conformational changes in
BSA following the covalent conjugation (Table 5).
Table 5: Intrinsic tryptophan fluorescence emission counts of BSA and GEM-BSA conjugates
(λex = 280 nm)
S. No. Samples Fluorescence intensity (counts)1. BSA 46857.6±563.32. GEM-BSA 19648.2±427.2
Values are presented as mean ± SD (n=6).
2.2 Characterization of GEM-BSA NPs
2.2.1 Freeze drying of GEM-BSA NPs
Effect of freeze drying on quality attributes viz. particle size, redispersibility index and
reconstitution score is shown in Table 6. A visual coagulation following the redispersion was
observed in case of NPs without cryoprotectants and hence the size could not be determined.
Among the different cryoprotectants tested, Mannitol showed minimum redispersibility index
with excellent reconstitution score and hence further tested at different concentrations between
the range of 2.5-10%. At lower concentration (2.5%) the redispersibility index was significantly
higher (p<0.01) while the difference was insignificant (p>0.05) at higher concentrations (≥5%
w/v) (Table 7).

Table 6: Freeze drying of GEM-BSA NPs using different cryoprotectants at 5% w/v
CryoprotectantsGEM-BSA NPs
Particle Size (nm) Ri = (Sf/Si) RSInitial 148.19 ± 6.48 - -
No cryoprotectant ND ND *Mannitola 158.56 ± 7.03 1.07 ± 0.03 ***Sucroseb 168.93 ± 7.81 1.14 ± 0.04 **
Trehaloseb 179.30 ± 8.42 1.21 ± 0.05 **Ri-Redispersibility index, RS-Reconstitution score, ND-not determined due to incomplete
redispersion of cake, *** redispersible within 20 sec with mere mixing, ** redispersible within 1
min, * reconstitution requires high shear vortexing for 2 min, but the cake was not completely
redispersed, a-Dense white intact cake, b-Dense white partially cracked cake. Values are
presented as mean ± SD (n=6).
Table 7: Optimization of Mannitol concentration based on redispersibility index and reconstitution score of freeze dried GEM-ALB-NPs
Cryoprotectant conc.(% w/v)
GEM-BSA NPsParticle Size (nm) Ri = (Sf/Si) RS
Initial 148.19 ± 6.48 - -2.5 165.97 ± 8.12 1.12 ± 0.04 ***5 158.56 ± 7.03 1.07 ± 0.03 ***
7.5 157.08 ± 7.42 1.06 ± 0.02 ***10 152.63 ± 5.35 1.03 ± 0.02 ***
Ri-Redispersibility index, RS-Reconstitution score, *** redispersible within 20 sec with mere
mixing. Values are presented as mean ± SD (n=6).
2.2.2 Accelerated stability studies
Accelerated stability studies were done for 6 months at 25 ± 2 °C and RH 60% ± 5% as per the
ICH guidelines. Freeze dried GEM-BSA NPs showed no change in terms of shrinkage of cake or
any other change in physical appearance. Insignificant (p > 0.05) increase in the particle size
(from 145.73 ± 8.27 to 156.23 ± 7.94 nm) and PDI (from 0.152 ± 0.025 to 0.167 ± 0.021) (Table
8) were noted after the 6 months of testing period.
Table 8: Characterization of formulation after 6 months of accelerated stability studies
Parameters Initial FinalParticle size (nm) 145.73±8.27 156.23±7.94PDI 0.152 ± 0.025 0.167 ± 0.021

Ease of reconstitution *** ***Physical appearance Intact fluffy cake Intact fluffy cake
*** redispersible within 20 sec with mere mixing. Values are presented as mean ± SD (n=6)
2.3 In-vitro cell culture experiments
2.3.1 Energy dependence of cellular uptake
The energy dependence of the cellular uptake was evaluated to further confirm endocytosis as
the main pathway by which these nanoparticles were taken up into the cells (Figure 2). Cellular
uptake of NPs by MIA-PaCa 2 and PANC-1 cells were found to be significantly reduced when
incubated at 4 °C. In addition, the effect of sodium azide mediated energy depletion on cell
uptake was evaluated, which also demonstrated hindrance towards the cellular uptake of NPs,
suggesting involvement of energy mediated endocytosis as the main mechanism for NPs uptake.
Figure 2: Energy dependent cell uptake of C-6 loaded GEM-BSA NPs at a concentration 1
µg/ml for 2h (A) at 4ºC, (B) After preincubation with SA, and (C) at 37 ºC. In all the images,
panel (a) Images under the green fluorescence channel; panel (b) Corresponding differential
interface contrast images of cells (c) Superimposition of panel (a) and panel (b). Panel (d) and (e)
in all the images show vertical and horizontal line series analysis of fluorescence along the white
line.