Method for correction of VFA loss in determination of dry ... · Method for correction of VFA loss...
53
Method for correction of VFA loss in determination of dry matter in biomass (Metod för korrigering av VFA-förlust vid bestämning av torrhalt i biomassa) SGC Rapport 2013:273 Cecilia Vahlberg, Erik Nordell, Lina Wiberg, Anna Schnürer ”Catalyzing energygas development for sustainable solutions”
Transcript of Method for correction of VFA loss in determination of dry ... · Method for correction of VFA loss...

Method for correction of VFA loss in determination of dry matter in biomass(Metod foumlr korrigering av VFA-foumlrlust vid bestaumlmning av torrhalt i biomassa)
SGC Rapport 2013273
Cecilia Vahlberg Erik Nordell Lina Wiberg Anna Schnuumlrer
rdquoCatalyzing energygas development for sustainable solutionsrdquo
SGC Rapport 2013273
Postadress och BesoumlksadressScheelegatan 3212 28 MALMOuml
Telefonvaumlxel040-680 07 60
Telefax0735-279104
E-postinfosgcse
Hemsidawwwsgcse
Method for correction of VFA loss in determination of dry matter in biomass(Metod foumlr korrigering av VFA-foumlrlust vid bestaumlmning av torrhalt i biomassa)
Cecilia Vahlberg Erik Nordell Lina Wiberg Anna Schnuumlrer
Denna studie har finansierats avEnergimyndighetenTekniska verken i Linkoumlping ABSveriges lantbruksuniversitetAvfall SverigeGoumlteborg Energi ABSvenskt Vatten UtvecklingStockholm Gas ABALcontrol ABEON Sverige ABNSR AB
Rapporten finns ocksaring publicerad avSvenskt Vatten Utveckling ndash Rapport C SGC2013-273Avfall Sverige ndash Rapport U201305
copy Svenskt Gastekniskt Center AB
SGC Rapport 2013273
2 Svenskt Gastekniskt Center AB Malmouml ndash wwwsgcse
SGC Rapport 2013273
Svenskt Gastekniskt Center AB Malmouml ndash wwwsgcse 3
Svenskt Gastekniskt Center AB SGC
Om SGCSGC aumlr ett spjutspetsfoumlretag inom haringllbar utveckling med ett nationellt uppdrag Vi arbetarunder devisen rdquoCatalyzing energygas development for sustainable solutionsrdquo Visamordnar branschgemensam utveckling kring framstaumlllning distribution och anvaumlndningav energigaser och sprider kunskap om energigaser Fokus ligger paring foumlrnybara gaser fraringnroumltning och foumlrgasning Tillsammans med foumlretag och med Energimyndigheten och desskollektivforskningsprogram Energigastekniskt utvecklingsprogram utvecklar vi nyamoumljligheter foumlr energigaserna att bidra till ett haringllbart samhaumllle Tillsammans med varingrafokusgrupper inom Roumltning Foumlrgasning och braumlnslesyntes Distribution och lagringKraftVaumlrme och Gasformiga drivmedel identifierar vi fraringgestaumlllningar avbranschgemensamt intresse att genomfoumlra forsknings- utvecklings ochellerdemonstrationsprojekt kring Som medlem i den europeiska gasforskningsorganisationenGERG faringngar SGC ocksaring upp internationella perspektiv paring utvecklingen inomenergigasomraringdet
Resultaten fraringn projekt drivna av SGC publiceras i en saumlrskild rapportserie ndash SGCRapport Rapporterna kan laddas ned fraringn hemsidan ndash wwwsgcse Det aumlr ocksaring moumljligtatt prenumerera paring de tryckta rapporterna SGC svarar foumlr utgivningen av rapporternamedan rapportfoumlrfattarna svarar foumlr rapporternas inneharingll
SGC ger ocksaring ut faktabroschyrer kring olika aspekter av energigasers framstaumlllningdistribution och anvaumlndning Broschyrer kan koumlpas via SGCs kansli
SGC har sedan starten 1990 sitt saumlte i Malmouml Vi aumlgs av Eon Gas Sverige AB EnergigasSverige Swedegas AB Goumlteborg Energi AB Lunds Energikoncernen AB (publ) ochOumlresundskraft AB
Malmouml 2013
Martin RagnarVerkstaumlllande direktoumlr
SGC Rapport 2013273
4 Svenskt Gastekniskt Center AB Malmouml ndash wwwsgcse
Swedish Gas Technology Centre SGC
SGC is a leading-edge company within the field of sustainable development having anational Swedish assignment We work under the vision of ldquoCatalyzing energygasdevelopment for sustainable solutionsrdquo We co-ordinate technical development includingmanufacture distribution and utilization of energy gases and spread knowledge on energygases Focus is on renewable gases from anaerobic digestion and gasification Togetherwith private companies and the Swedish Energy Agency and its frame programDevelopment program for energy gas technology we develop new solutions where theenergygases could provide benefits for a sustainable society Together with our focusgroups onAnaerobic digestion Gasification and fuel synthesis Distribution and storage PowerHeatand Gaseous fuels we identify issues of joint interest for the industry to build commonresearch development andor demonstrations projects around As a member of theEuropean gas research organization GERG SGC provides an international perspective tothe development within the energygas sector
Results from the SGC projects are published in a report series ndash SGC Rapport Thereports could be downloaded from our website ndash wwwsgcse It is also possible tosubscribe to the printed reports SGC is responsible for the publishing of the reportswhereas the authors of the report are responsible for the content of the reports
SGC also publishes fact brochures and the results from our research projects in the reportseries SGC Rapport Brochures could be purchase from the webiste
SGC is since the start in 1990 located to Malmouml We are owned by Eon Gas Sverige ABEnergigas Sverige Swedegas AB Goumlteborg Energi AB Lunds Energikoncernen AB(publ) and Oumlresundskraft AB
Malmouml Sweden 2013
Martin RagnarChief Executive Officer
SGC Rapport 2013273
Svenskt Gastekniskt Center AB Malmouml ndash wwwsgcse 5
Foreword
This project ldquoMethod for correction of VFA loss in determination of dry-matterrdquowas initiated by the department of FoU Biogas at Tekniska verken i Linkoumlping ABThe project group consisted of Cecilia Vahlberg Erik Nordell Lina Wiberg(Tekniska verken in Linkoumlping AB) and Anna Schnuumlrer (Swedish University ofAgricultural Sciences SLU) The project started in May 2012 and was completedin February 2013 when this report was published
The project had a reference group consisting of the following representatives
Tobias Persson SGC (program director)Irene Bohn NSR ABCatarina Jonasson EON Gas Sverige AB
SGC Rapport 2013273
6 Svenskt Gastekniskt Center AB Malmouml ndash wwwsgcse
Summary
There is an increasing demand for bio-methane as a renewable energy sourceTo accomplish a stable efficient and optimal biogas production it is important tomonitor the digestion process Imbalance in the digester may be caused by eginsufficient process-follow up and poor characterization and control of thesubstrates properties Parameters often used to evaluate the stability and theefficiency of the biogas production process are the hydraulic retention time (HRT)organic loading rate (OLR) the specific gas production and the degree ofdegradation These parameters (except for the HRT) are all calculated based onthe volatile solids (VS) content which is the organic part of the dry-matter (DM)contentA common technique to determine the DM content is by oven-drying This is a verysimple and robust method where water is evaporated and the dry matter of thesample remains However a disadvantage of the method is that volatile molecules(in addition to water) are lost during the drying Volatile substances include amongothers volatile fatty acids (VFAs) and alcohols This may result in anunderestimation of the DM content and subsequently also an underestimation ofthe VS content Consequently this will result in errors in all the parameters thatare calculated based on DM and VS
In this project the focus was to understand the evaporation of VFAs fromdifferent substrates used for biogas production and digestates (biofertilizer) duringthe DM-analysis by oven-drying at 105oC for 20 hours
First a method for analyzing the concentration of VFAs in oven-dried materialsby first dissolving the dried material in MilliQ water was confirmed This methodwas used throughout the project
Moreover the majority of the dissolved total organic carbon that was lost duringthe DM-analysis was confirmed to be VFAs (asymp75) Consequently determinationquantification of the evaporation of VFA from substrates and digestates duringDM-analysis are therefore of greatest importance
In this study four different biogas substrates and three digestates were includedin the laboratory research Results showed that the majority of the VFAs in all foursubstrates (with low pH) were lost during the DM-analysis using the oven-dryingmethod (ge95) Moreover the evaporation was not depending on the initial VFA concentration In the four substrates the VFA evaporation will result in significanterrors in both the DM and VS analysis of 3-30 Errors in parameters calculatedbased on the observed results varied in size correspondingly to DM and VS Theerror increases with increasing ratio between VFADM meaning that the high VFAconcentration in relation to the DM content increased the error It was also shownthat the degree of degradation could both be under-estimated and overestimated
The conclusion of the study was that there are of greatest importancecompensate for the VFA evaporation which occurs during the DM-analysis Thisassumes that the VFA content of the substrate should be measured for morecorrect results of DM and VS Two methods are suggested to compensate for theVFA evaporation during the DM-analysis The methods can easily be applied if theDM VS and VFA content of the substrates or digestates are analyzed
SGC Rapport 2013273
Svenskt Gastekniskt Center AB Malmouml ndash wwwsgcse 7
Sammanfattning paring svenska
Intresset foumlr biogas som en foumlrnybar energikaumllla har under de senaste aringren oumlkat iSverige Foumlr att kunna uppraumlttharinglla en stabil och optimal roumltningsprocess aumlr det avvaumlsentlig betydelse att drift- och processdata foumlljs upp och oumlvervakas paring etttillfredstaumlllande saumltt Dessvaumlrre suboptimeras ibland biogasproduktionen paring grundav bristande processoumlvervakning Driftstoumlrningar kan leda till processinstabilitetmed minskad biogasproduktion som foumlljd En foumlrutsaumlttning foumlr en braprocessuppfoumlljning aumlr att kontinuerligt kontrollera och karaktaumlrisera substratet Devanligaste parametrarna foumlr substratanalys aumlr torrsubstansen (TS aumlven kallat DM)och gloumldfoumlrlusten (VS aumlven kallad GF) Ofta analyseras aumlven koncentrationen avVFA och ammoniumkvaumlve alkalinitet och pH i roumltkammaren men inte alltidkontinuerligt i substraten Den organiska fraktionen av ett material (VS) maumlts oftasom en andel av torrsubstanshalten VS anvaumlnds foumlr att oberoende avvatteninneharingllet i ett prov kunna uppskatta den organiska belastningen ellergasproduktionen fraringn ett visst substrat
Det finns en rad olika processparameterar som anvaumlnds foumlr att oumlvervaka ochutvaumlrdera stabiliteten i biogasprocessen De vanligaste processparametrarna somoumlvervakas aumlr uppeharingllstid (HRT) organisk belastning (OLR) specifikgasproduktion och utroumltningsgrad Dessa parametrar (HRT undantaget) baserasparing substratets organiska inneharingll dvs VS och daumlrmed indirekt TS-halten TS ochVS-halten kan bestaumlmmas med flera olika typer av analysmetoder Inom VA- ochbiogasbranschen aumlr det vanligast att TS-halten bestaumlms genom ugnstorkning vidkontrollerade foumlrharingllande med avseende paring tid och temperatur Enligt densvenska standarden SS 02 81 13 (SIS 1981) kan TS-maumltning ugn appliceras paringtex avloppsvatten slam och sedimentprover Vid bestaumlmning av TS-halt i ettslam rekommenderas en torktid paring 20 timmar vid 105oC Det finns dock en radalternativa metoder till ugnstorkning som inte aumlr vanliga vid maumltning av slam mendesto vanligare inom andra industrier saring som livsmedelsindustrin ochskogsindustrin tex Karl-Fisher titrering infraroumld spektrometri och mikrovaringgs-torkning Vid flertalet biogasanlaumlggningar anvaumlnds aumlven en snabbmetod foumlr TS-maumltning som baseras paring torkning av materialet med infraroumld straringlning (vaumlrme)
TS-maumltning med hjaumllp av ugnstorkning anvaumlnds frekvent daring den aumlr mycketenkel billig och kraumlver inte heller naringgon avancerad utrustning Vidare aumlr det enkeltatt analysera VS i direkt anslutning till analys av TS i ugn genom att gloumldga TS-provet vid 550oC i 2 timmar (SIS 1981) Bestaumlmning av TS-halt genomugnstorkning aumlr dock foumlrknippat med vissa antaganden dels att endast vattenavgaringr vid upphettningen av materialet dels att avgaringngen av vatten aumlr den sammai alla typer av material och dels att vi inte faringr naringgra reaktioner i materialet underupphettningen som paringverkar resultatet Eftersom biogassubstrat inneharingller flertaletflyktiga foumlreningar som tex alkoholer och flyktiga fettsyror finns det daumlrfoumlr en oumlkadrisk foumlr avgaringng av dessa eller liknande foumlreningar daring TS-halten bestaumlms vidugnstorkning Detta kan saringledes leda till att felaktigt vaumlrde paring TS-halten ochdaumlrmed aumlven ett felaktigt VS-vaumlrde erharinglls och processparametrar som beraumlknasbaserat paring dessa blir missvisande
Det huvudsakliga syftet med projektet var att utvaumlrdera avgaringngen av flyktigafettsyror (VFA) i matriser av substrat och roumltrester vid TS-analys i ugn Projektetsyftade aumlven till att ta fram en metod som foumlr att kompensera foumlr den eventuellafoumlraringngningen VFA och daumlrmed erharinglla ett mer korrekt TS och VS-vaumlrde Inomramen foumlr projektet utvaumlrderades aumlven foumlraringngningen av ammonium och loumlst
SGC Rapport 2013273
8 Svenskt Gastekniskt Center AB Malmouml ndash wwwsgcse
organiskt kol (TOC) Fyra olika substrat och tre olika roumltrester analyserades istudien alla med olika ursprung
En metod daumlr det torkade TS-provet loumlstes upp i vatten och daumlrefteranalyserades foumlr VFA anvaumlndes foumlr att utvaumlrdera foumlraringngningen av VFA vidugnstorkning vid 105oC i 20 timmar Metoden verifierades genom att houmlja pH(pHgtgtpKa) i ett referensprov som innehoumlll houmlga koncentrationer av VFA pHhoumljdes foumlr att de negativt laddade flyktiga fettsyrorna daring skulle interagera medpositivt laddade molekyler i materialet och paring saring saumltt inte foumlraringngas vidugnstorkningen Resultaten fraringn dessa verifieringstester visade att det var moumljligtatt analysera de organiska fettsyrorna syrorna efter det att det torkade materialetloumlsts upp i vatten och att metoden var tillfoumlrlitlig Vidare saring analyserades aumlven dentotala maumlngden organisk kol i ett referensprov foumlre respektive efter ugnstorkningoch relaterades till foumlraringngningen av VFA Resultaten visade att 75 av de loumlstaorganiska foumlreningar som foumlraringngades vid TS-analysen var flyktiga fettsyror somkunde identifieras vid VFA-analysen Det aumlr alltsaring ytterst vaumlsentligt att belysa justavgaringngen av VFA vid TS-analysen
Resultaten fraringn studien visade att foumlraringngningen av VFA vid TS-analys i ugn varmellan 95 och 100 foumlr de fyra substratet Daring den ursprungliga totala VFA-koncentrationen varierade mellan de olika substraten (3-17 g VFAL) tyder dettaparing att den initiala koncentrationen inte paringverkar andelen av VFA som foumlraringngas vidupphettning av de fyra substraten Vidare tyder de utfoumlrda foumlrsoumlken paring attfoumlraringngningen av VFA var oberoende av molekylvikten foumlr de sju flyktiga fettsyrornasom analyserades (fraringn aumlttiksyra till heptansyra) Eftersom felen mellan de olikasubstraten varierade garingr det inte att generalisera felet i VS-vikten foumlr alla typer avsubstrat Det aumlr alltsaring mycket viktigt att analysera koncentrationen av VFA i sittmaterial foumlr att faring en indikation paring hur stort felet aumlr vid varje specifikbiogasanlaumlggning eller substratsmix
I biogoumldselproverna var resultatet dock annorlunda Initialkoncentrationerna avVFA var generellt laumlgre samtidigt som pH-halten var houmlgre Foumlraringngningen i de trebiogoumldseln var laumlgre aumln i de undersoumlkta substraten och varierade mellan 0-55med en houmlgre avgaringng med en oumlkande koncentration av VFA En laumlgre avgaringng avVFA var ocksaring vaumlntad eftersom en stoumlrre andel av VFA aumlr teoretiskt sett negativtladdade vid ett houmlgre pH jaumlmfoumlrt med vid laumlgre pH som tex i de analyseradesubstraten I de fyra substraten var aumlven det ursprungliga pH-vaumlrde laringgt (le52) vilket kan jaumlmfoumlras med pH i biogoumldseln som var naumlra 8 Detta tyder paring att pH aumlren viktig parameterar som inverkar paring andelen VFA som angaringr vid TS-analys iugn
Foumlr de fyra substraten resulterade avgaringngen av VFA vid TS-analysen ett fel paring3-31 av VS-vikten Felet varierade stort fraringn substrat till substrat beroende paringkvoten mellan TS och VFA koncentrationen Foumlljaktligen substrat som innehoumlllhoumlga koncentrationer av VFA och samtidigt hade relativt laringg TS-halt resulterade istoumlrst fel paring VS-vikten
Om ingen kompensation foumlr avgaringng av VFA utfoumlrs erharinglls en houmlgre organiskbelastning aumln oumlnskat Detta samtidigt som det finns en risk att den specifikagasproduktionen oumlverskattas Utan kompensering foumlr foumlraringngningen av VFA kanman med det substrat som hade houmlgst VFA-avgaringng av misstag belasta sinprocess med organisk belastning som aumlr 31 houmlgre aumln oumlnskat Andrakonsekvenser som detta kan ge aumlr att felaktiga slutsatser dras tex om tvaringsubstrat skall jaumlmfoumlras med varandra varvid det ena inneharingller houmlgakoncentrationer av VFA medan det andra inte goumlr det Vidare kan detta ge falska
SGC Rapport 2013273
Svenskt Gastekniskt Center AB Malmouml ndash wwwsgcse 9
positiva resultat i sk utroumltningsfoumlrsoumlk som ofta anvaumlnds foumlr att vaumlrdera ettsubstrats metangaspotential Utroumltningsgraden baseras paring TS och VS i baringdeingaringende substrat och utgaringende biogoumldsel vilket innebaumlr att felet i dennaparameter till och med kan bli houmlgre jaumlmfoumlrt med felen i belastning och specifikgasproduktion Om baringde substratet och biogoumldseln inneharingller houmlgakoncentrationer av VFA vilket kan vara fallet i vissa typer av biogasprocesserskulle alltsaring felet kunna bli mycket stort
Vid utvaumlrdering av foumlraringngning observerades aumlven att en stor andel avammoniuminneharingllet avgaringr vid TS-analys i ugn Detta kan vara av betydelse foumlranalysen av biogoumldsel daumlr koncentrationen av ammonium aumlr houmlg relativt TS-halten Vilken betydelse foumlraringngningen av ammonium har foumlr analysresultatet foumlrTS- och VS-halten har inte klargjorts i detta projekt utan boumlr utredas ytterligare
Foumlr att goumlra resultaten fraringn studien saring generella och laumltta att anvaumlnda paring enbiogasanlaumlggning eller paring ett laboratorium som moumljligt har tvaring metoder foumlrslagitsmed olika noggrannhet foumlr att kompensera foumlr avgaringngen av VFA I baringdametoderna behoumlver man ha kaumlnnedom om sina material och inneharingllet av flyktigafettsyror som potentiellt skulle kunna avgaring Metod 1 baseras paring observationen avatt flyktigheten foumlr VFA i sura substrat aumlr gt95 Foumlr att utfoumlra kompensationenkraumlvs med denna metod analysvaumlrden foumlr VFA TS och VS i substratet Metod 2innebaumlr att kompensationen genomfoumlrs paring samma saumltt som de material som harundersoumlkts i denna studie genom att VFA analyseras i baringde vaumltskefasen samt iden i vatten upploumlsta torra fasen efter ugnstorkningen Genom att sedan beraumlknagraden flyktighet kan ett kompenserat vaumlrde foumlr TS och VS beraumlknas specifikt foumlrjust detta material Denna metod kan alltsaring anvaumlndas baringde paring substrat ochbiogoumldsel
Sammanfattningsvis visar resultaten fraringn denna studie att det aumlr mycket viktigatt beakta foumlraringngningen av VFA vid TS-analys i ugn Det aumlr daumlrfoumlr viktigt attkompensera uppmaumltta TS- och VS-vaumlrden foumlr den VFA som avgaringr vid analysenMetoderna foumlr att kompensera foumlr foumlraringngningen som presenteras i denna rapportaumlr enkla att anvaumlnda men det kraumlver att TS VS och VFA koncentrationenanalyseras paring materialen och kontinuerligt foumlljs upp om variationer foumlrekommer imaterialen Genom att kompensera foumlr foumlraringngningen av VFA erharinglls mer korrektavaumlrden foumlr TS och VS-vaumlrden Detta bidrar till en foumlrbaumlttrad moumljlighet att styra ochoumlvervaka biogasprocessen liksom en baumlttre jaumlmfoumlrelse av olika driftparametrarmellan olika biogasanlaumlggningar
SGC Rapport 2013273
10 Svenskt Gastekniskt Center AB Malmouml ndash wwwsgcse
SGC Rapport 2013273
Svenskt Gastekniskt Center AB Malmouml ndash wwwsgcse 11
Table of contents
1 Background13
Aim1411
Dry-matter content1412
Methods to determine the dry-matter content1613
Oven-drying methods 16131
Microwave oven-drying17132
Infrared drying17133
Karl-Fischer titration18134
Near infrared spectroscopy18135
Anaerobic digestion1914
Process biology 19141
Process instability 20142
Process parameters 2115
Maximum bio-methane potential21151
Specific gas production21152
Organic loading rate (OLR)22153
Degree of degradation 22154
Volatility2316
The chemistry of volatile fatty acids (VFA)23161
VFA content in the substrate 25162
2 Experimental26
General analysis procedure 2621
Validation of the general analysis procedure2722
Analysis methods and calculations 2723
Sample preparation2924
3 Results and discussion 30
Samples characterization 3031
Validation of the general analysis procedure3032
Evaporation of VFA compared to TOC3133
Volatility of volatile fatty acids (VFA) 3334
Substrate S133341
Substrate S234342
Substrate S335343
SGC Rapport 2013273
12 Svenskt Gastekniskt Center AB Malmouml ndash wwwsgcse
Substrate S435344
Digestate D136345
Digestate D237346
Digestate D337347
Errors in process parameters due to VFA evaporation3835
Evaporation of ammonium during the dry-matter analysis 4036
The volatility of VFA ndash a summary of the observed results4237
Methods to compensate DM for VFA evaporation biogas substrates4438
Method 1 - Rough estimation method45381
Method 2 - Detailed estimation method 46382
4 Conclusions 48
5 Acknowledgements49
6 Literature50
SGC Rapport 2013273
Svenskt Gastekniskt Center AB Malmouml ndash wwwsgcse 13
1 Background
The interest for bio-methane as a renewable energy source has increased overthe last couple of years In Sweden this increasing interest has mainly been dueto a growing demand for bio-methane to be used as vehicle fuel The researchpublications regarding bio-methane production have also increased over the lastcouple of years which shows that there is a large interest for bio-methane as arenewable energy source worldwide (search term ldquobiogasrdquo Web of Science) Theproduction of bio-methane also has other positive effects for our society besidesthe possibility to be used for the production of vehicle fuel heat and electricity Incommercial bio-methane production where the degradation of organic materialtakes place under controlled conditions in biogas digesters instead of just putting itin a landfill the contribution of methane to the atmosphere can be reducedAnother positive aspect is that the digestate formed in the digester can be used asa fertilizer thus decreasing the demand for mineral fertilizers and enabling arecycling of nutrient between urban and rural areas (Tafdrup 1995 Ward et al2008)
In order to accomplish a more efficient and optimal bio-methane productionmore knowledge is still required One important factor in order to accomplish astable biogas production is a regular surveillance of the digestion process(Madsen et al 2011) Changes of operation conditions can have a great impacton the performance of the digestion process Imbalance in the digester due to poorprocess follow-up may result in a decrease in the production of biogas or evenserious process failures An imbalance in the digester and a decreased biogasproduction is often associated with high costs Reliable control systems arebelieved to become of great importance for the development and successfulnessof the biogas production as an energy source in the future (Lomborg et al 2009)Knowledge of the characteristics of the substrate and of the digestate is essentialfor efficient monitoring of the biogas process With a good characterization of thesubstrate parameters such as the organic load to the digester can be optimizedand inhibition of the microbial activity can be avoided Characterization of thedigestate is important to determine the nutrient value and the application ratewhen it is used as a fertilizer Characterization parameters frequently used in orderto control the substrate and the digestate are for example dry-matter content (DM)volatile solids content (VS) concentration of volatile fatty acids (VFAs) pHalkalinity and concentration of ammonium
A common method to determine the DM-value is by oven-drying In Swedenthis is performed according to or slightly modified to the Swedish Standardmethod SS 02 81 13 (SIS 1981) According to SS 02 81 13 (SIS 1981) DM forsludge samples and sediment samples should be dried for 20 hours in 105oC andVS is subsequently determined by drying the sample for 2 hours in 550oC Theoven-drying method is robust and easy to use However a problem with thismethod is the evaporation of other molecules besides water during the dryingprocess which can result in an underestimation of the DM content (Kreuger et al2011 Larsen amp Jones 1973 Porter amp Murray 2001 Samuelsson et al 2006Weiszligbach amp Strubelt 2008a Weiszligbach amp Strubelt 2008b) If the DM content isunderestimated this in turn results in an underestimation of the VS content andconsequently also an underestimation of the organic loading rate (OLR) anoverestimation of the specific gas production an overestimation of the methaneyield as well as errors in the calculated degree of degradation This phenomenon
SGC Rapport 2013273
14 Svenskt Gastekniskt Center AB Malmouml ndash wwwsgcse
has been observed and is a well-known problem in the field of animal foodproduction Volatility coefficients based upon the evaporation of VFAs in differenttypes of silage have been published in the literature (Weiszligbach amp Strubelt 2008aWeiszligbach amp Strubelt 2008b) However the biogas field has not paid muchattention to this problem This project focuses on oven DM-analysis and errors inthe DM content due to the loss of mainly VFAs during the oven-drying of biogassubstrates and biogas digestates
Aim11
The aim of this study was to develop a method that could be used to compensatefor errors obtained in the analysis of the DM content due to the loss of VFAs usingthe oven-drying technique To achieve this aim the evaporation of different VFAsduring the oven-drying was investigated and volatility constants were calculatedbased upon the obtained results Moreover the study included an investigation ofthe possibility to correlate the loss of VFAs during the drying to the total amount ofdissolved carbons in the investigated samples In addition to VFA the loss ofammonia during the DM-analysis was also analyzed and a literature study ofdifferent methods to determine the DM content was performed
This project was designed to answer five questions
1 Which VFAs are lost from a sample during the DM-analysis2 How much of each VFA is lost from the sample during the DM-analysis3 Is the evaporation of the VFAs dependent upon the initial concentrations of
the VFAs in the samples4 Does the evaporation of VFAs differ between different types of materials
eg digestates and substrates and is there a difference between the sametypes of materials obtained from different full-scale biogas plants
5 Is there a correlation between the relative amount of VFAs that is lostduring the drying and the total amount of carbon (TOC) present in thematerial
Dry-matter content12
The dry-matter (DM) content also known as the total solids (TS) is a widely usedparameter for the characterization of substrates and digestates The DM content isthe amount of sample left in a sample after water has been removed (Figure 1)The DM consists of organic material known as the volatile solids (VS) andinorganic material known as the ash The VS represent the part of the DM whichcan be converted to biogas and is often expressed as a percentage of the DMcontent
SGC Rapport 2013273
Svenskt Gastekniskt Center AB Malmouml ndash wwwsgcse 15
Figure 1 A schematic figure showing the relationship between the dry-matter (DM)content the volatile solids (VS) content and the ash content
The measures DM and VS content are used in operation of biogas plants fordifferent purposes Generally these measurements can be divided in three maincategories
Substrate measurements ndash to monitor the quality of the substrate organicloading rate and specific biogas production
Digestion measurements ndash to monitor the process stability Digestate measurements ndash to evaluate the quality of the bio-fertilizer
Substrates used for biogas production commonly consist of a variety of differenttypes of organic material Substrates are characterized to get information of theorganic content of a specific substrate or a substrate mixture A substrate mixturetypically contains waste products such as household waste food industry wasteagriculture waste and sludge from wastewater treatment plants Other commonsubstrates are silage stillage glycerin and alcohols (Carlsson amp Uldal 2009) Thesubstrates may contain different amounts of fat carbohydrate and protein all withdiverse properties but highly degradable in the biogas process Agriculture wasteand wood residuals may also consist of organic material that is non-biodegradabledue to high content of lignin
In biogas production it is important to monitor and to know the organic loadingrate (OLR) to avoid stress on the microorganisms active in the biogas process andsecure stable conditions The organic content of the substrate and the substratemixture must be quantified to be able to calculate the organic load It is importantnot to judge the DM content based on the viscosity of a substance The DM of forexample milk and cream are approximately 10 and 60 respectively In spite ofthis difference we experience these products as relatively equally ldquowetrdquo which in abiogas context can have devastating consequences as it is the ldquodryrdquo componentthat is converted to biogas and not the water
Digestion measures are parameters that are used for process monitoring andthese parameters are relaying on DM and VS values These measures aremonitoring the effectiveness of the anaerobic degradation Examples of
SGC Rapport 2013273
16 Svenskt Gastekniskt Center AB Malmouml ndash wwwsgcse
parameters in this category are the specific gas production (Nm3 kg-1) the organicloading rate (kg VS m-3 d-1) and the degree of degradation () By following theseparameters regularly in daily operation the process can be closely monitoredwhich is important to enable a stable biogas production These measures can alsobe used for benchmarking the production against other plants and historic data ofthe biogas plant in operation
Chemical analyzes are performed on the digestate (also named bio fertilizer)Several plants in Sweden have their bio-fertilizer certified according to SPCR 120(SP 2010) These certification rules specify conditions of certification technicalstandards and requirements for continuous monitoring of certified bio-fertilizerMost of the analyzed parameters are expressed as a function of the DM content(SP 2010)
Methods to determine the dry-matter content13
A number of different methods have been developed to determine the dry-matter(DM) content of various samples The most frequently used method in Sweden forbiogas applications is an oven-drying technique Other methods that can be usedto determine the DM content are eg the Karl Fisher titration (Petit et al 1997Porter and Barton 1997) microwave oven-drying (Marquez et al 1995) infrareddrying near infrared reflection spectroscopy (NIR-spectroscopy) (Lomborg et al2009) freeze drying (Samuelsson et al 2006) distillation (Samuelsson et al2006) and acoustic chemometrics (Lomborg et al 2009)
Oven-drying methods131
The oven-drying method can be used to determine the dry-matter (DM) content invarious materials A known amount of a sample is dried in an oven at a settemperature and for a specific time-period Water evaporates from the sampleduring the drying and the relative amount of DM can be calculated by comparingthe weight of the sample before and after the drying
Several different oven-drying methods are used worldwide In Sweden dryingtechniques that are based upon the accredited Swedish Standard methodSS 02 81 131981-05-20 (SIS 1981) are most frequently used in laboratoriesperforming analysis on sludge and sediments According to this standard thesample should be dried in an oven at 105degC for 20 hours However if the samestandard is applied on waste waters the drying time is only required to be 2 hours(SIS 1981) According to another oven-drying methods the samples should firstbe dried to a constant weight at a temperature of approximately 60-65degC and thendried at 105degC for three hours (Weiszligbach amp Strubelt 2008a) or the DM contentcan be determined by just drying the samples until their weight is constant(Samuelsson et al 2006) Other drying temperatures that are used are in therange of 60-130degC (Porter amp Murray 2001 Samuelsson et al 2006) Moreoverwhen determining the water content of yoghurt in Germany the product should bedried at a temperature of 102degC but in Switzerland it is enough if the yoghurt isdried at 87degC (Isengard amp Walter 1998) Also the weight of the samples that areanalyzed may differ (Isengard amp Walter 1998) Due to the fact that so manydifferent oven-drying methods exist with different temperatures sample weightand drying times it is difficult to compare the results and draw conclusionsconcerning the optimal methodology
SGC Rapport 2013273
Svenskt Gastekniskt Center AB Malmouml ndash wwwsgcse 17
A problem with the oven-drying method in general is that other volatilemolecules besides water may be lost during the analysis This can potentiallyresult in an underestimation of the DM content of the analyzed material andsubsequently also in the VS content (Kreuger et al 2011 Larsen amp Jones 1973Porter amp Murray 2001 Samuelsson et al 2006 Weiszligbach amp Strubelt 2008aWeiszligbach amp Strubelt 2008b) There might also a risk that side reactions ordegradation of the substances in the samples are initiated by the heating
However the oven-drying technique has also many advantages which is thereason why this method often is preferred for the analysis of the DM content Themain advantages with oven-drying are that the technique is very simple robustand straightforward Furthermore the technique does not require any advancednor sophisticated equipment Consequently a low-cost instrument with lowoperating costs can be used A number of samples can also be analyzed at thesame time Furthermore by applying oven-drying the content of volatile solids(VS) can easily be measured by first determining the DM content and thereafterwith the same sample determine the VS content in an oven at 550degC The DMdetermination with oven-drying is in many ways suitable for substrates anddigestate from biogas plants However it is clear that improvements giving bettercontrol of the loss of volatile organic compounds are necessary
Microwave oven-drying132
The motivation for the development of microwave oven-drying techniques was toshorten the measurement time compared to the oven-drying methods (Isengard ampWalter 1998) The risk of introducing side reactions is also reduced whenshortening the drying time (Reh amp Gerber 2003)
When using the microwave oven-drying technique one can choose to dry thesample during a certain time or to dry the sample until the weight is constant aswhen using the oven-drying technique The results might vary when dryingdifferent amounts of the samples during a certain time Consequently it is better todry the samples until the weight of the sample is constant (Isengard amp Walter1998) If the materials contains molecules that absorbs light in the microwaveregion care needs to be taken to avoid overheating of the materials (Reh ampGerber 2003) The technique is very straightforward and the measurement timeas well as the analysis time is fast The measurement with microwave techniqueapplied on dairy products is fast with a time of analysis of less than 5 min (Reh ampGerber 2003) According to our knowledge it is not common to use microwaveoven-drying to analyze the DM content in samples used in the biogas production
Infrared drying133
The infrared (IR) drying method to determine the DM content is a quick andcommonly used at full scale biogas plants The sample is dried with IR radiation ata certain temperature during a specific time eg at 120degC for 20 minutes Themeasurement time is thus shorter than the oven-drying but it is normally onlypossible to analyze one sample at the time The DM content is calculated bycomparing the weight of the samples before and after the drying as for the oven-and microwave-drying Commercially available instruments for infrared dryingexists that are very simple to use When a material is heated there is always a riskthat other molecules besides water such as the VFAs are lost during the analysis
SGC Rapport 2013273
18 Svenskt Gastekniskt Center AB Malmouml ndash wwwsgcse
A higher value of the DM is often observed when comparing values obtained frominfrared drying with DM values from oven-drying for the same sample This couldbe due to eg that the loss of VFAs is lower and that not all of the water has beenremoved from the samples
Karl-Fischer titration134
The Karl-Fisher (KF) titration method was developed in the mid-1930th and it is afrequently used method to determine the DM content in for example food (De Caroet al 2001 MacLeod 1991) The method is based on the highly selective reactionbetween water (H2O) and iodine (I2) and can be used to detect very lowconcentrations of water The detection can be either colorimetric or volumetricThe water in the samples needs to be unbound to be able to react with iodine andtherefore the samples need to be processed before the analysis The preparationof the samples can take between 1-2 hours depending on the sample type but theactual measurement is fast (1-2 minutes) Alternative preparation methods todecrease the time before the measurement have been presented in the literature(De Caro et al 2001)
A problem with the KF titration method is that side reactions between thematerials to be analyzed and the chemicals used in the titration are possible(MacLeod 1991) These reactions can cause errors in the results resulting in anunderestimation or overestimation of the water content in the analyzed material(MacLeod 1991) From the analysis of the results it can be very complicated toseparate a KF titration involving side reactions from a normal KF titration
One other complication when using KF titration method is that iodine can beoxidized by for example Fe3+ Cu2+ and NO2
- (MacLeod 1991) As a result thewater content will be underestimated since the oxidized iodine cannot react withwater present in the sample The water content can also be underestimated if theanalyzed materials contain sulfur dioxide and molecules which contain a carbonylfunctional group eg aldehydes or ketones since these can form complexes withwater (MacLeod 1991) As the materials used for anaerobic digestion oftencontains a very large variety of molecules and substances it seems reasonable toassume that the Karl-Fischer method to determine the water content in thesematerials might be complicated However this still needs to be investigated
Near infrared spectroscopy135
Near infrared spectroscopy (NIR) has been suggested as a potential technique tobe used for online monitoring on full scale plants and the method has eg beenused to measure the DM content (Lomborg et al 2009) the VS content (Nordberget al 2010) and the amount of VFAs (Lomborg et al 2009) in substrates Thematerials are irradiated with electromagnetic radiation and quantitative informationregarding eg the DM content can be obtained by analyzing how much of theelectromagnetic radiation that is absorbed transmitted or reflected by the material(Lomborg et al 2009 Nicolaiumla et al 2007) For NIR electromagnetic radiationwith a wavelength between 780-2500 nm is being used (Nicolaiumla et al 2007)
SGC Rapport 2013273
Svenskt Gastekniskt Center AB Malmouml ndash wwwsgcse 19
Anaerobic digestion14
Process biology141
In order to degrade organic material to methane and carbon dioxide in a biogasprocess a close cooperation between different microorganisms with differentmetabolic capacities is required (Gerardi 2003) Many organisms are also socalled syntrophs ie they benefit from the activity of each other and successfullybreak down organic matter (substrate) that neither one could manage aloneDuring the formation of biogas complex polymers and structures are hydrolyzed tosimple monomers in the first step (Figure 2) Fat is for example converted to fattyacids and glycerol proteins into amino acids and cellulose and starch intoglucose The produced monomers are taken up by the bacteria in the next stepcalled the lsquofermentative steprsquo or the acidogenesis During this step monomers areconverted into smaller compounds such as ethanol lactic acid and volatile fattyacids (VFAs) such as acetic acid propionic acid butyric acid In additionhydrogen gas (H2) and carbon dioxide (CO2) are also formed (Gerardi 2003) Theproduced VFAs are further converted to acetic acid hydrogen gas and carbondioxide provided that the hydrogen is kept at a low pressure by a rapidlyconsumption by hydrogenotrophic (hydrogen-consuming) methane formers Aceticacid hydrogen gas (H2) and carbon dioxide (CO2) form the primary substrates foracetoclastic (acetic acid-consuming) and hydrogenotrophic methane formersrespectively (Gerardi 2003) The methane-forming step is generally considered tobe rate-limiting in the biogas process but the hydrolysis step can also be the bottleneck in the degradation depending on the character of the substrates This meansthat the rate of the hydrolysis step might for some substrates eg cellulose orother polymeric materials be slower than the methane-forming step
At least three co-operating organism populations are required to achievecomplete degradation of organic matter to methane and carbon dioxide Howeverin a properly functioning biogas process there are often many more due to thecomplexity of the ingoing material
SGC Rapport 2013273
20 Svenskt Gastekniskt Center AB Malmouml ndash wwwsgcse
Figure 2 Degradation of organic matter to methane and carbon dioxide underanaerobic conditions
Process instability142
It is important for the degradation process that the biological system is balancedand that the cooperation between the different groups of bacteria is effective If toomuch volatile solids continuously are fed into the reactor and the microorganismsare unable to consume all VFAs formed an increase in acetate and hydrogen gasensues High concentrations of hydrogen gas and acetate may lead to furtherimbalance in the degradation process and as a consequence various VFAs maystart to accumulate (Ahring et al 1995) If the process instability is driven furtherthis will result in a decrease in alkalinity finally resulting in a decrease in pHWhen pH decreases a larger amount of the VFAs become uncharged and more
SGC Rapport 2013273
Svenskt Gastekniskt Center AB Malmouml ndash wwwsgcse 21
repellant of water If this situation is allowed to continue there is a high risk forfoaming (Ganidi et al 2009)
Process parameters15
There are several biogas process parameters of importance for operation andsurveillance of biogas digester including DM and VS content Many of theseparameters are used both in research and full scale operation The mainparameters depending on DM and VS are further explained in this section
Maximum bio-methane potential151
A common way to determine the potential of a certain substrate is to perform abio-methane potential test This type of test is normally performed in lab-scalebatch conditions and gives information of the potential methane production of thesubstrate For a full-scale production plant this test is for example of interestduring an evaluation concerning the possible economical profit to treat a specificsubstrate In this test the DM and VS value of the substrate is of criticalimportance as the methane production from the investigated substrate is related tothe VS content Thus a correct DM and VS measurement is essential If the DM orVS is underestimated due to loss of VFA or other organic compounds themaximum bio-methane potential may be overestimated which can lead to wrongdecisions at a full-scale plant or wrong conclusions in scientific reports
Specific gas production152
The specific gas production provides information about the gas potential of theadded substrates to the digestion process When treating a constant and similarsubstrate mixture (inlet feed) each day a stable and equal specific gas productionis expected Even if the inlet-flow to the digesters varies the specific gasproduction should be similar from one day to another due to the normalization tothe organic loading rate (Equation 1) Change in the specific gas production thatcannot be related to change of substrate or dramatic change in OLR can indicatethat the process is undergoing a process disturbance
Equation 1)ܨݏܩ ݓ
௦௨௦௧௧ܯܦ כ ௦௨௦௧௧כ ݑ ௦௨௦௧௧ቆכ
ଷ ݏ
ቇ
Also here a correct VS value is essential An underestimation of the VS will resultin an overestimation in the specific gas production This overestimation possessesa problem when eg evaluating the biogas potential of different substratespotentially resulting in wrong decision regarding the priorities of the substrate ofinterest Variations in analysis results for DM and VS due to differences in theconcentration of volatile substances within the substrate will also result in incorrectconclusion that the calculated specific gas production is varying
SGC Rapport 2013273
22 Svenskt Gastekniskt Center AB Malmouml ndash wwwsgcse
Organic loading rate (OLR)153
OLR is a parameter which gives information about the amount of organic materialthat is being fed to the digester with a specific volume OLR can easily becalculated (Equation 2) if the flow DM and VS of the substrate are known
Equation 2)
ݑ ௦௨௦௧௧ܯܦכ௦௨௦௧௧ כ ௦௨௦௧௧
ݑ ௗ௦௧כ൬כ
ଷ כ൰
When performing wet anaerobic digestion at mesophilic temperatures (~37degC)typical values for the OLR are 2-4 kg VS m-3 d-1 (Ek et al 2011 Nordell et al2013) In a thermophilic process these values are slightly higher The optimalcondition for the microorganisms is to maintain an OLR as stable as possibleOverloading a digesters and having a rapidly fluctuating OLR may lead toaccumulation of VFAs which in turn can cause a decrease in pH andconsequently a decrease in gas yield due to stressed microorganismsConclusively it is important to secure a stable and not to high OLR Thusunderestimation of DM and VS may cause severe problems as this my mistakecould results in an overload giving unfavorable conditions for the microorganismpresent in the digester
Degree of degradation154
Degree of degradation is a parameter used for evaluation of the processefficiency This parameter does not take into account the biogas potential of theadded substrate Instead the degree of the degradation is a parameter thatdescribes the amount of added organic material that actually has been convertedinto biogas under the prevailing conditions A high value of the degree ofdegradation indicates a well performing digestion process and an easilydegradable substrate Calculations can be performed according to equation 3 Dueto the restrictions of the CSTR-system (continuous in- and outtake) and energyneed for the microorganismrsquos growth the degree of degradation normally do notexceed 80 During the calculation both DM and VS content of the substrate aswell as of the digestate are used Consequently using false low values of DM andVS may result in large errors
The degree of degradation will be overestimated if the VS of the digestate isunderestimated As a consequence wrong conclusions concerning the processperformance could be made ie one could think the process is still workingproperly since the degree of degradation is high despite the fact that the digestatecontains a lot of VFAs This could then lead to wrong decision concerning thepriority when choosing between different substrate to be used in the biogasproduction The degree of degradation will be overestimated if the VS of thedigestate is underestimated This could contribute to mistakes due to the fact thatone would think the process is still working properly since the degree ofdegradation is high despite the fact that the digestate contains a lot of VFAs
SGC Rapport 2013273
Svenskt Gastekniskt Center AB Malmouml ndash wwwsgcse 23
Equation 3)
൬ͳെௗ௦௧௧ܯܦ כ ௗ௦௧௧
௦௨௦௧௧ܯܦ כ ௦௨௦௧௧൰כͳͲͲ()
Volatility16
The volatility of molecules is dependent both on the chemical properties of themolecules themselves and upon the surrounding environment Volatile moleculeshave a high so-called vapor pressure at a certain temperature compared to othermolecules (Ebbing 1993) An example of a very volatile molecule is chloroformwhich has a vapor pressure of 160 mmHg at a temperature of 20degC(wwwsigmaaldrichcom) This can be compared to ethanol and water which havevapor pressures of 446 and 173 mmHg respectively at the same temperature(20degC) (Table 1) Normally the vapor pressure decreases with the molecularweight when comparing molecules with similar molecular structure This can beobserved for the VFAs that have been investigated in this study (Table 1) Thelowest vapor pressure is found for heptanoic acid (lt01 mmHg) and the highest isfound for acetic acid (114 mmHg) Consequently acetic acid is when justconsidering the vapor pressure more volatile than heptanoic acid In order for amolecular transition to occur from the liquid phase to the gas phase (vaporization)the kinetic energy of the molecules in the liquid must become higher than theirpotential energy (Ebbing 1993) which is determined by eg intermolecularinteractions such as electrostatic interactions or hydrogen bonding This meansthat if molecules in a liquid are charged thus interacting with other chargedmolecules the volatility decreases
The chemistry of volatile fatty acids (VFA)161
The intermediary products from the acidogenesis are volatile compounds such asorganic acids and alcohols Alcohols such as methanol and ethanol have a muchhigher vapor pressure and lower boiling points compared to the VFAs (Table 1)Methanol and ethanol have boiling points below 100degC while all the VFAs haveboiling points above 100degC (Table 1)
SGC Rapport 2013273
24 Svenskt Gastekniskt Center AB Malmouml ndash wwwsgcse
Table 1 The properties of different volatile compounds such as volatile fatty acidsand alcohols
Compounds Formula pKa1 Mol weigth
1
(gmol)TOC()
Boilingpoint (
oC)
Vapor pressure(mm Hg)
Formic acid CH2O2 375 460 26 1011
Acetic acid C2H4O2 475 600 40 1181 114
2
Propionic acid C3H6O2 487 740 49 1411 24
2
Lactic acid C3H6O3 386 901 40 122Butyric acid C4H7O2 482 881 54 163
1 0432
Iso-butyric acid C4H8O2 486 881 54 1551 15
2
Valeric acid C5H10O2 482 1021 59 1861 015
2
Iso-Valeric acid C5H10O2 478 1021 59 176 0382
Hexanoic acid C6H12O2 488 1161 62 2061 018
2
Iso-hexanoic acid C6H12O2 485 1161 62
Heptanoic acid C7H14O2 471 1301 65 223 lt012
Methanol CH4OH - 320 36 65 9772
Ethanol C2H5OH - 461 52 78 4462
Propanol C3H7OH - 601 60 97 332
Theoretical At 20 degC1 SI-data2 sigma-aldrich
Charged VFAs will interact with other charged moleculessubstances in thematerials Consequently these VFAs will have a lower volatility compared touncharged VFAs The degree of ionization is determined by the pH of the materialand majority of the VFAs will be uncharged if the pHltltpKa (Figure 3)
Figure 3 A typical titration curve for a buffered system such as a biogas substratewith a low pH to which a base is added At the pKa the amount of ionized andunionized acids is equal for a certain acid
SGC Rapport 2013273
Svenskt Gastekniskt Center AB Malmouml ndash wwwsgcse 25
VFA content in the substrate162
Even though a substrate originally normally consists of fat protein andcarbohydrates this may not be the fact when the substrates enter the digestionprocess With easy available substrates such as food waste and slaughterhousewaste the degradation often starts already when the substrates are held in stockin eg storage tanks at the biogas plant The biological activity may be particularlyhigh during the summer when the temperature is high This biological processdoes typically not include methanogenesis but the substrates may undergo thefirst steps in the anaerobic process the hydrolysis and the acidogenesis This maylead to an early start of the anaerobic process and formation of multiple organiccompounds such as alcohols and volatile fatty acids which can contribute to avery low pH of the substrate The low pH is an unsuitable condition formethanogenesis to occur and therefore the VFA is still within the substrate whenit finally enters the digester The VFA concentration in a substrate mixture can thussometimes represent a large share of the DM and the VS content which make itimportant to ensure that a reliable method for DM and VS measurement is appliedto avoid an underestimate of the VS content
SGC Rapport 2013273
26 Svenskt Gastekniskt Center AB Malmouml ndash wwwsgcse
2 Experimental
Seven materials were investigated in this study The study included three differentsubstrates from full scale biogas plants in Sweden two pasteurized food andslaughterhouse mixtures abbreviated S1 and S2 as well as one grass silagematerial abbreviated S3 The study also included sludge from grease separatorsto be treated at a water treatment plant in Sweden abbreviated S4 Besides thefour substrates the study also included three digestates abbreviated D1 D2 andD3 The digestates D1 and D2 originated from two different full scale plants inSweden The digestate D3 originated from a bio-reactor used in a lab-scaleexperiment
General analysis procedure21
The concentrations of DM VFA pH ammonium and TOC were all determinedwith the same analysis procedure for all samples
Figure 4 A sketch of the analysis procedures used in the project
1) A known weight of the wet material was placed in the DM-oven
2) The DM content was determined according to the description in Chapter 23(Analysis methods and calculations)
3) A known amount of MilliQ water (asymp9-20 g depending on the sample) was allowed to soak into the dried sample for 5-10 minutes and the obtained
SGC Rapport 2013273
Svenskt Gastekniskt Center AB Malmouml ndash wwwsgcse 27
solution (dissolved dried sample + MilliQ water) was then stirred for 15-30minutes
4) The VFA concentration the pH or the dissolved TOC in the original sample aswell as the soaked dissolved dried sample were analyzed according to thedescription in Chapter 23 For the ammonium analysis the dried material wasinvestigated according to the procedure described in Chapter 23 (Analysismethods and calculations)
5) Calculations were performed to determine the VFA compensated DM-value(DMcomp Equation 7) ie the amount of acids that evaporated during the drying(difference between VFA content in the wet and dried sample) were added tothe DM value
Validation of the general analysis procedure22
To verify that it was possible to analyze VFA in dried samples which had beendissolved in MilliQ water the pH was increased in test samples (pHgt11) before theDM analysis using oven-drying The modification of pH was performed by addingapproximately 30 ml of 1M NaOH to about 100 ml of substrate S1 (S1NaOH) and byadding 29 ml of 1M NaOH to 107 ml of the substrate S2 (S2NaOH) Theconcentration of VFA in the wet sample was compared to the concentration of theVFA in the dissolved dried sample
Analysis methods and calculations23
The DM was analyzed by drying a known weight (~10 g) of the wet sample (wetweight) according to SS 02 81 13 (SIS 1981) in an oven for 20 hours at 105 degCThe samples were then placed in a desiccator to avoid accumulation of wateruntil the samples had cool down and the weight of the material was thereaftermeasured (DM weight)
To determine the VS the dried material was further heated at 550 degC for 3hours which is slightly modified compared to the SS 02 81 13 (SIS 1981) where2 hours which is stated The material was then allowed to cool down in adesiccator before the weight of the material was measured (ash weight) The DMand VS were analyzed in at least six independent samples for each of theinvestigated materials The DM () and VS ( of DM) were calculated accordingto equations 4 and 5 respectively The VFA concentration within the dried samplewas calculated according to equation 6 and the volatility according to equation 7
Equation 4)
൬ܯܦ ݓ ݐ
ݓݐ ݐ൰כͳͲͲൌ ݕݎܦ ݐݐ ݎ ݐ ሺΨሻݐ
SGC Rapport 2013273
28 Svenskt Gastekniskt Center AB Malmouml ndash wwwsgcse
Equation 5)
൭1 ndash൬ݐℎݓℎݏܣ
ܯܦ ݐℎݓ൰൱ lowast 100 = ) )
Equation 6)
ௗௗ௦ܣܨ (ܮ) = ௗ௦௦௩ௗௗௗlowastቆܣܨ൫ ௦ ௗௗ + ௪௧൯
௦ ௧ቇ(ܮ)
Equation 7)
௩௧௧௬ܣܨ () =ቆ1 minusௗௗ௦ܣܨ ( fraslܮ )
௪௧௦ܣܨ ( fraslܮ )ቇlowast 100
The VFA compensated DMcomp and VScomp were calculated according to theEquations 8 and 9 where DMm is the measured DM value VSm is the measuredVS value and VFAvolatility is the volatility of the VFA based upon the totalconcentration of VFA
Equation 8)
ܯܦ () = DM୫ () + ൭௩௧௧௬ܣܨ ()
100lowast )௧ܣܨ fraslܮ )൱ lowast 10ସ
Equation 9)
൫ ofܯܦ ൯
=൫DM () lowast ()൯+ (10ସ lowast ()௩ܣܨ lowast ܣܨ ((ܮ)
ܯܦ ()
The VFAs were analyzed using a Clarus 550 gas chromatograph (Perkin ElmerUSA) equipped with a packed Elite-FFAP column used for acidic compounds(Jonsson amp Boreacuten 2002) The VFA was analyzed in at least three independentwet samples and three independent dissolved dried samples for each of theinvestigated materials and the presented values are the average of the threemeasurements The presented VFAs concentrations for the dissolved driedsamples have been correlated for the dilution with MilliQ water The average of theconcentration is presented with a 95 confidence interval
The ammonium (NH4-N) was analyzed according to the FOSS Tecatorsapplication sub note 3502 using a Kjeltec 8200 distillation system (FOSS inScandinavia Sweden) The ammonium was analyzed in at least threeindependent wet samples and three independent dissolved dried samples for allthe materials The presented concentration is the average of the threeindependent measurements with a 95 confidence interval The presentedconcentrations of NH4-N have been correlated for the dilution It should be notified
SGC Rapport 2013273
Svenskt Gastekniskt Center AB Malmouml ndash wwwsgcse 29
that the concentration of ammonium includes both the ammonium in the NH4-Nstate as well as the NH3-N state
The TOC was determined in the dissolved fraction of the S1 substrate bycentrifugation of the substrate (11 000 rpm 20 min) and thereafter filtration of thesupernatant trough 045 microm Millipore filter TOC was then determined in thefiltrate TOC was analyzed with the instrument Multi NC 3100 (AnalytikJena UKUnited Kingdom) according to the guidelines in SS-EN 1484 Here the organiccarbon in the sample is oxidized to carbon dioxide using a patina catalyzer andthe carbon dioxide concentration is then determined by a NDIR detector Threeindependent analyzes were performed on the wet sample and the dissolved driedsample of S1 The pH was measured using a potentiometric pH-meter (WTWInolab USA) equipped with a Hamilton electrode at asymp25degC
Sample preparation24
The materials S1 S2 D1 D2 and D3 were stored in a freezer at -20 degC until useThe substrates S3 and S4 were placed in a refrigerator at +4 degC and analyzed veryshortly after the materials had been received at Tekniska verken The silagesubstrate (S3) was diluted in water (S3 Water 153) and mixed with a handblender prior to the analysis of VFAs pH and ammonium DM and VS weremeasured on undiluted material of S3 as described in Chapter 23
SGC Rapport 2013273
30 Svenskt Gastekniskt Center AB Malmouml ndash wwwsgcse
3 Results and discussion
The main focus of this project was the evaporation of VFAs from differentmaterials used in the biogas production during the DM-analysis by oven-dryingThe results from the analyzed substrates and digestates are presented anddiscussed with respect to the volatility of VFA and the potential errors in DM VSand different important biogas parameters The result from evaporation analyzesof ammonium and the total organic carbon are also shown and discussedFurthermore two different methods to be used to compensate for errors in DM andVS due to the loss of VFA are proposed
Samples characterization31
Seven different materials were analyzed in this project two pasteurized mixturesof substrates (S1 and S2) one grass silage (S3) one sludge material from greaseseparators (S4) and three different digestates (D1 D2 and D3) Thecharacteristics of the seven analyzed materials can be found inTable 2
Table 2 The characteristics of the materials included in this study
Sample DM () VS ( of DM) VFA (mgL) NH4-N (mgkg) pH
S1 72 plusmn 02 75 plusmn 20 17 000 plusmn 570 1 370 plusmn 39 52 plusmn 00
S2 14 plusmn 05 91 plusmn 04 4 300 plusmn 61 514 plusmn 142 50 plusmn 00
S3 23 plusmn 04 91 plusmn 01 6 500 plusmn 4 453 plusmn 206 41 plusmn 00
S4 36 plusmn 02 99 plusmn 11 3 000 plusmn 20 48 plusmn 5 46 plusmn 00
D1 34 plusmn 00 56 plusmn 02 320 plusmn 13 2 880 plusmn 117 79 plusmn 01
D2 47 plusmn 01 73 plusmn 02 460 plusmn 33 2 810 plusmn 65 79 plusmn 00
D3 42 plusmn 02 76 plusmn 10 7 700 plusmn 200 5 340 plusmn 106 80 plusmn 00
Validation of the general analysis procedure32
The same general analysis procedure was used in this project to measure theconcentration of VFAs in the dried samples This analysis procedure is describedin Chapter 21 The samples were first dried and then dissolved in MilliQ waterprior to the analysis To verify this procedure the pH of substrates S1 and S2 wasincreased to above 11 before the oven-drying The S1 and S2 samples to whichthe NaOH was added are hereafter abbreviated S1NaOH and S2NaOH The aim withthis modification of pH was to increase the degree of ionization of the VFAs in thesamples The negatively charged VFAs may interact with positively chargedmolecules and remain in the sample during the drying and the evaporation shouldbe minimized Consequently the concentration of VFAs in the wet and dissolveddried samples should be about the same if the method to analyze VFA in drymaterials dissolved in MilliQ is working The observed results for the pasteurizedmixture of materials S1NaOH and S2NaOH are presented in Tables 3 and 4respectively
SGC Rapport 2013273
Svenskt Gastekniskt Center AB Malmouml ndash wwwsgcse 31
Table 3 The concentrations of VFAs in the wet and the dissolved dried samples ofS1NaOH (pHgt11) and the calculated volatility The volatility has been calculatedaccording to Equation 7
Volatile fatty acidWet sample
(mgL)Dissolved dried sample
(mgL)Volatility
()
Acetic acid 6 000 6 100 0
Propionic acid 2 300 2 100 9
Butyric acid 1 300 1 100 15
Iso-butyric acid 300 200 33
Pentanoic acid 930 970 0
Iso-pentanoic acid 300 250 17
Hexanoic acid 1 600 1 700 0
Iso-hexanoic acid 100 80 20
Heptanoic acid 300 250 17
Sum VFA (mgL) 13 000 12 800 2
The volatility when considering the total concentration of VFAs was calculated tobe 2 and 20 for S1NaOH and S2NaOH respectively These results are in agreementwith a previous published article by (Derikx et al 1994) According to this studyVFAs can be fixed in manures during oven-drying when the pH is above 10 Theobserved results showed that a majority of the VFAs was detected in both S1NaOH
and S2NaOH thus indicating that the method of analyze VFA within a dried samplesworks
Table 4 The concentration of VFAs in the wet and the dissolved dried samples ofS2NaOH (pHgt11) and the calculated volatility ()The volatility has been calculatedaccording to Equation 7
Volatile fatty acidWet sample
(mgL)Dissolved dried sample
(mgL)Volatility
()
Acetic acid 3 000 2 800 7
Propionic acid 660 400 39
Butyric acid 500 280 44
Iso-butyric acid 70 30 57
Pentanoic acid 260 140 46
Iso-pentanoic acid 100 70 30
Hexanoic acid 160 120 25
Iso-hexanoic acid 30 20 33
Heptanoic acid 100 70 30
Sum VFA (mgL) 4 900 3 900 20
Evaporation of VFA compared to TOC33
The dissolved fraction of total organic carbons (TOC) was analyzed in thesubstrate with the highest VFA concentration substrate S1 before oven-drying aswell as after oven-drying By analyzing both VFA and dissolved TOC the mass-balance of organic carbon within the samples was calculated Only the dissolvedfraction of the samples was analyzed assuming that no TOC was transferred fromsolid to dissolved TOC during the oven-drying procedure During the oven-dryingthe dissolved TOC decreased from approximately 16 700 mgL down to about 6
SGC Rapport 2013273
32 Svenskt Gastekniskt Center AB Malmouml ndash wwwsgcse
100 mgL while the VFA level decreased from approximately 17 000 mgL to 780mgL (Table 5) The concentration of VFAs in the wet sample correspondedtheoretically to about 8 300 mg TOCL whereas the concentration of VFA in thedissolved dried sample corresponded to approximately 360 mg TOCL It shouldbe notified that since the theoretical value of TOC in each VFA differ calculationsof each individual VFA were performed for these calculated TOC values
Table 5 VFA and TOC within the wet and dissolved dried samples
ParameterWet sample
(mgL)Dissolved dried sample
(mgL)Evaporation
(mgL)
VFA 17 000 plusmn 570 780 plusmn 140 16 220
Calculated TOC as VFA 8 300 360 7 940
Measured dissolved TOC 16 700 plusmn 650 6 100 plusmn 220 10 600 Evaporation based on theoretical calculations No standard division is given
The evaporated part of TOC expressed as the difference between wet anddissolved dried sample corresponded to approximately 10 600 mg TOCLHowever the amount of evaporated TOC as VFA (data analysis) was only about8 000 mg TOCL corresponding to about 75 of the evaporated TOC during thedrying (Figure 5 Subsequently this indicates that approximately 25 of theevaporated volatile substances were not detected in the VFA analysis As the TOCmethod only gives value of organic carbon this fraction represents unknownvolatile organic compounds However there are some VFAs that are not detectedin the used VFA analysis such as formic acid (boiling point of asymp101 degC) and lacticacid (boiling point of asymp122 degC) Other common organic compounds that also arevolatile and might be present in different types of substrate mixtures are egmethanol ethanol and acetone However as illustrated in Figure 5 75 of theevaporated volatile organic compounds can be detected in VFA-analysis whichshows that a VFA-compensation method is relevant and could result in areasonable good approximation of the DM and VS values
SGC Rapport 2013273
Svenskt Gastekniskt Center AB Malmouml ndash wwwsgcse 33
Figure 5 Distribution of volatile dissolved TOC within the wet sample before dryingand in the dried sample after oven-drying
Volatility of volatile fatty acids (VFA)34
Substrate S1341
As can be seen in Table 6 the analysis of the degree of evaporation of VFAs from
S1 a pasteurized mixture of an organic material with a very high concentration of
VFAs (gt17 000 mgL) showed a total loss of 95 of VFA in the oven-dried sample
(dissolved dried sample) compared to non-dried sample (wet sample) The highest
concentration of acids in substrate S1 was observed for acetic acid which
corresponded to approximately 47 of the total concentration of VFAs in the
material The lowest concentration was found for iso-hexanoic acid which
contributed to less than 1 of the total concentrations of the VFAs Both these
VFAs present at high and low concentrations as well as other VFAs present in
the sample were lost to an almost equal extent during the drying Consequently
this result indicated that the evaporation of the VFAs was not dependent on the
initial concentration of the individual acids in the substrate S1
50
2
50
34
48
75
1625
0
10
20
30
40
50
60
70
80
90
100
Wet sample Dried sample Evaporated part
Dis
trib
uti
on
of
dis
so
lve
dT
OC
()
Evaporation of unknown TOC Evaporation of TOC as VFA
Other volatile dissolved TOC Dissolved TOC as VFA
SGC Rapport 2013273
34 Svenskt Gastekniskt Center AB Malmouml ndash wwwsgcse
Table 6 The concentration of VFAs in substrate S1 before and after the DM-analysis and the VFA volatility The mean values are presented with a 95confidence interval and the volatility has been calculated according to Equation 7
Volatile fatty acidWet sample
(mgL)Dissolved dried sample
(mgL)Volatility
()
Acetic acid 8 300 plusmn 560 460 plusmn 53 94
Propionic acid 3 100 plusmn 110 94 plusmn 21 97
Butyric acid 1 900 plusmn 230 68 plusmn 17 96
Iso-butyric acid 300 plusmn 20 6 plusmn 5 98
Pentanoic acid 1 300 plusmn 250 46 plusmn 13 96
Iso-pentanoic acid 500 plusmn 20 10 plusmn 5 98
Hexanoic acid 1 700 plusmn 400 77 plusmn 21 96
Iso-hexanoic acid 100 plusmn 6 5 plusmn 3 96
Heptanoic acid 200 plusmn 10 10 plusmn 6 92
Sum VFA (mgL) 17 000 plusmn 570 780 plusmn 140 95
The pH of material S1 was measured prior to the drying and was found to be 52After the drying the pH was found to be 59 This increase in pH indicates that thecomposition of substrate S1 had changed during the drying The increase in pHcould be partly explained by the loss of VFAs but there are many othercompounds in addition to VFA that can have an influence on the pH such as theammoniumammonia system as well as the carbonate system Consequently it islikely that the change in pH is not only due to the evaporation of the VFAs
Substrate S2342
Substrate S2 initially contained 4 300 mg VFAL of which acetic acid was thedominating acid (Table 7) Despite the fact that the substrates S2 and S1 have asimilar origin the VFA concentration was about 4 times higher in S1 compared toS2 The observed volatility of VFA was 99 during the DM analysis of substrateS2 (Table 7) This is a slightly higher volatility compared to sample S1 Moreoveran increase in pH was detected during the DM-analysis for S2 from a pH of 50 to58 in agreement with the observed change in pH for substrate S1
Table 7 The concentrations of VFAs in substrate S2 before and after the DM-analysis and the VFA volatility The mean values are presented with a 95confidence interval and the volatility has been calculated according to Equation 7
Volatile fatty acidWet sample
(mgL)Dissolved dried sample
(mgL)Volatility
()
Acetic acid 2 600 plusmn 0 49 plusmn 11 98
Propionic acid 660 plusmn 10 0 plusmn 0 100
Butyric acid 470 plusmn 21 3 plusmn 1 99
Iso-butyric acid 70 plusmn 3 0 plusmn 0 100
Pentanoic acid 220 plusmn 9 0 plusmn 0 100
Iso-pentanoic acid 100 plusmn 20 0 plusmn 0 100
Hexanoic acid 110 plusmn 16 0 plusmn 0 100
Iso-hexanoic acid 20 plusmn 1 0 plusmn 0 100
Heptanoic acid 30 plusmn 3 0 plusmn 0 100
Sum VFA (mgL) 4300 plusmn 61 52 plusmn 11 99
SGC Rapport 2013273
Svenskt Gastekniskt Center AB Malmouml ndash wwwsgcse 35
Substrate S3343
The silage (substrate S3) had a different origin compared to the substrates S1 andS2 which were pasteurized food and slaughterhouse mixtures The VFA profile ofS3 was shown to be very different from S1 and S2 The substrate S3 containedonly acetic acid (99
Table 8) while the substrates S1 and S2 contained all of the VFAs The total VFAconcentration within the substrate S3 was 6 500 mg VFAL During the DM-analysis of the substrate S3 97 of the VFAs were evaporated (
Table 8) This is in line with the results from samples S1 and S2 but higher thanthe results presented by Porter and Murray (2001) which observed a volatility ofapproximately 89 However in this study the silage was heated at 100degC for 16hours thus another oven-drying method was used compared to the one in thisstudy Analogic to the observed results in the substrates S1 and S2 the pHincreased during the DM-analysis from 41 to 48
Table 8 The concentration of VFA in substrate S3 before and after the DM-analysis and the VFA volatility The mean values are presented with a 95confidence interval and the volatility has been calculated according to Equation 7
Volatile fatty acid Wet sample (mgL)Dissolved driedsample (mgL)
Volatility ()
Acetic acid 6400 plusmn 0 190 plusmn 56 97
Propionic acid 20 plusmn 5 10 plusmn 2 ndash
Butyric acid 16 plusmn 1 0 plusmn 0 100
Iso-butyric acid 0 plusmn 0 0 plusmn 0 ndash
Pentanoic acid 0 plusmn 0 0 plusmn 0 ndash
Iso-pentanoic acid 0 plusmn 0 0 plusmn 0 ndash
Hexanoic acid 23 plusmn 0 0 plusmn 0 100
Iso-hexanoic acid 0 plusmn 0 0 plusmn 0 ndash
Heptanoic acid 0 plusmn 0 0 plusmn 0 ndash
Sum VFA (mgL) 6 400 plusmn 4 190 plusmn 57 97
The uncertainty in the concentration of propionic acid in the silage was very high since the results varied very muchbetween the three independent samples Consequently it would be incorrect to calculate the volatility based upon theseresults
Silage normally contain higher concentrations of lactic acid compared to VFAsalcohols and ammonia-nitrogen The volatility of lactic acid in silage has howeverbeen found to be lower (lt38) than VFAs ammonia and alcohols (Porter ampMurray 2001 Weiszligbach amp Strubelt 2008a) In this study the volatility of lacticacid for S3 was however not analyzed
Substrate S4344
The initial VFA concentration in S4 (3 000 mg VFAL) was lower than the otheranalyzed substrates It was found that almost all of the VFAs were lost during theDM-analysis giving a volatility of 100 when considering the total concentrationof VFA (Table 9) This is in agreement with the observed results for S1 S2 andS3 The pH was increased in S4 during the DM-analysis from pH 46 to 53 inagreement with results obtained for the other analyzed substrates
SGC Rapport 2013273
36 Svenskt Gastekniskt Center AB Malmouml ndash wwwsgcse
Table 9 The concentration of VFA in substrate S4 before and after the DM-analysis and the calculated volatility The mean values are presented with a 95confidence interval and the volatility has been calculated according to Equation 7
Volatile fatty acidWet sample
(mgL)Dissolved dried sample
(mgL)Volatility
()
Acetic acid 940 plusmn 39 0 plusmn 0 100
Propionic acid 890 plusmn 0 4 plusmn 1 100
Butyric acid 640 plusmn 26 0 plusmn 0 100
Iso-butyric acid 10 plusmn 1 0 plusmn 0 100
Pentanoic acid 390 plusmn 24 3 plusmn 1 99
Iso-pentanoic acid 30 plusmn 2 0 plusmn 0 100
Hexanoic acid 63 plusmn 3 1 plusmn 0 98
Iso-hexanoic acid 0 plusmn 0 0 plusmn 0 ndash
Heptanoic acid 5 plusmn 0 0 plusmn 0 100
Sum VFA (mgL) 3 000 plusmn 19 8 plusmn 2 100
Digestate D1345
The concentrations of the analyzed VFAs in the wet and dissolved dried samplesof digestate D1 are summarized in Table 10 The initial total concentration of VFAwas approximately 320 mgL with the highest concentration of acetic acid (~88)among the VFAs A low VFA concentration in the digestate is typically for biogasdigesters with high process efficiency and stability
A higher total concentration of the VFAs was observed after the DM-analysiscompared to the initial concentration (Table 10) It seems unlikely that VFAs havebeen formed during the drying but in cannot be ruled out However due to the lowVFA concentration the uncertainty in the VFA analysis is quite high Consequentlythere might not be a difference in the VFA concentrations between the wet anddissolved dried samples but merely an effect of the uncertainty in themethodology This result is expected since the pH in the sample was 79 and wasincreased to 94 during the drying Both pH are however higher than the pKa forthe VFAs
Table 10 The concentration of VFA in digestate D1 before and after DM-analysisand VFA volatility The mean values are presented with a 95 confidence intervaland the volatility has been calculated according to Equation 7
Volatile fatty acidWet sample
(mgL)Dissolved dried sample
(mgL)Volatility
()
Acetic acid 280 plusmn 14 300 plusmn 18 0
Propionic acid 13 plusmn 2 25 plusmn 2 0
Butyric acid 7 plusmn 0 11 plusmn 1 0
Iso-butyric acid 4 plusmn 0 5 plusmn 0 0
Pentanoic acid 0 plusmn 0 4 plusmn 1 0
Iso-pentanoic acid 8 plusmn 1 7 plusmn 1 13
Hexanoic acid 3 plusmn 3 7 plusmn 1 0
Iso-hexanoic acid 0 plusmn 0 2 plusmn 0 0
Heptanoic acid 0 plusmn 0 7 plusmn 1 0
Sum VFA (mgL) 320 plusmn 13 370 plusmn 18 0
SGC Rapport 2013273
Svenskt Gastekniskt Center AB Malmouml ndash wwwsgcse 37
Digestate D2346
The initial sample of the digestate D2 contained mainly acetic acid whichcorresponded to approximately 88 of the total VFA concentration (Table 11) Theconcentrations of the rest of the VFAs ie propionic acid butyric acid iso-butyricacid pentanoic acid iso-pentanoic acid hexanoic acid iso-hexanoic acid andheptanoic acid were very low Consequently the uncertainties of theconcentrations of these acids were high as for sample D1 However as theconcentrations of those acids were low they will thus not have a large impact onthe final result The pH of the initial sample of D2 was found to be 79 Despite thefact that D1 and D2 had similar VFA profile and the same initial pH a difference inthe volatility was observed The volatility of the VFAs in D2 considering the totalconcentrations of VFAs was calculated to be 18 This volatility was highercompared to the VFA volatility for D1 (0) A volatility of 18 is howevernegligible when considering errors in the DM and VS values as the initialconcentration of VFA was low During the drying the pH was increased to 82
Table 11 The concentrations of VFAs in the digestate (D2) before and after theDM-analysis and the VFA volatility The mean values are presented with a 95confidence interval and the volatility has been calculated according to Equation 7
Volatile fatty acidWet sample
(mgL)Dissolved dried sample
(mgL)Volatility
()
Acetic acid 400 plusmn 28 310 plusmn 29 23
Propionic acid 26 plusmn 4 24 plusmn 4 8
Butyric acid 9 plusmn 2 9 plusmn 1 0
Iso-butyric acid 7 plusmn 1 5 plusmn 1 29
Pentanoic acid 0 plusmn 0 3 plusmn 0 0
Iso-pentanoic acid 8 plusmn 1 4 plusmn 3 50
Hexanoic acid 3 plusmn 3 6 plusmn 1 0
Iso-hexanoic acid 0 plusmn 0 1 plusmn 1 0
Heptanoic acid 0 plusmn 0 4 plusmn 4 0
Sum VFA (mgL) 450 plusmn 33 370 plusmn 37 18
Digestate D3347
Digestate D3 was withdrawn from a biogas reactor suffering from accumulation ofVFA indicating that the biogas process was suffering from in imbalance (Ahring etal 1995) The total concentration of VFAs was much higher in the D3 sample(7 700 mgL Table 12) compared to D1 (320 mgL) and D2 (460 mgL) Moreovereven in spite of high concentration of VFA the pH was due to high bufferingcapacity (data not shown) high (pH 8) During the drying the pH was decreaseddown to 63
The overall VFA volatility for D3 was calculated to be approximately 55 (Table12) which is higher compared to the VFA volatility for D1 (0) and D2 (20)Consequently the highest VFA volatility was observed for the digestate with thehighest initial concentration of VFAs Even though the initial pH (80) in D3 washigh 55 of the VFAs were still lost during the drying However the pH within thedried sample was 63 which theoretical would give increased evaporation andthereby supports the results achieved in D3 compared to D1 and D2 Why the pHwas decreased in not obvious however a theory is that ammonium is evaporated
SGC Rapport 2013273
38 Svenskt Gastekniskt Center AB Malmouml ndash wwwsgcse
before the VFAs If that is the case loss of ammonium (through ammonia) willresult in decreasing pH in the sample during the drying and thereby increasing theVFA volatility
All in all the results from the three digestates shown that the volatility is bothdepending of the initial pH the pH after drying and the buffer capacity of thesample A generalization of the volatility of different digestates is therefore difficultto achieve without doing the same measurements for each individual digestates asin the present study
Table 12 The concentrations of VFAs in digestate D3 before and after DM-analysis and VFA volatility The mean values are presented with a 95 confidenceinterval and the volatility has been calculated according to Equation 7
Volatile fatty acidWet sample
(mgL)Dissolved dried sample
(mgL)Volatility
()
Acetic acid 6 500 plusmn 170 2 900 plusmn 120 55
Propionic acid 370 plusmn 3 210 plusmn 4 43
Butyric acid 60 plusmn 2 77 plusmn 1 0
Iso-butyric acid 300 plusmn 120 90 plusmn 3 70
Pentanoic acid 6 plusmn 1 31 plusmn 1 0
Iso-pentanoic acid 400 plusmn 21 100 plusmn 6 75
Hexanoic acid 5 plusmn 2 40 plusmn 2 0
Iso-hexanoic acid 18 plusmn 0 8 plusmn 0 56
Heptanoic acid 0 plusmn 0 6 plusmn 0 0
Sum VFA (mgL) 7 700 plusmn 200 3 500 plusmn 120 55
Errors in process parameters due to VFA evaporation35
The evaporation of VFAs during the DM-analysis of the different analyzed sampleswas shown to be significant The volatility of the VFA in substrates was between95-100 (Table 13) which clearly highlights the problem with the evaporationThe results from the analysis of the evaporation of VFAs of the digestate sampleswere more difficult to interpret as the results varied from 0-55 evaporation
Since calculations of central process parameters are based upon the DM andVS content it is essential that they are correct By knowing the volatility of the VFAcompensation can be made and more correct DM and VS values can becalculated Calculated compensated DM (from hereby called DMcomp) and VS(from hereby called VScomp) values are presented in Table 13 This table alsoincludes calculations of the errors in DM (DMerror) and VS (VSerror) ie errorsdepending on the DM VS VFA concentration and the volatility of the VFA TheDMerror which is the relative difference between DM and DMcomp varied betweenapproximately 3-23 and the VSerror varied between 3-31 for the analyzedsubstrates The evaporation of other volatile organic molecules than VFA is notincluded since only VFA was measured The error in DM and VS may therefore beeven higher
The DMerror and VSerror were shown to be of minor importance for the digestatesD1 and D2 which contained low concentrations of VFAs However the DMerror andVSerror were for the digestate S3 was approximately 10 and 14 respectively
SGC Rapport 2013273
Svenskt Gastekniskt Center AB Malmouml ndash wwwsgcse 39
Table 13 Calculated DMcomp and VScomp values after compensation for the VFAevaporation The errors in the DM and VS values are also shown
SampleVFA(gL)
DM()
VS( of DM)
VFAvol
()DMcomp
()VScomp
( of DM)DMerror
()VSerror
()
S1 17 72 75 95 89 80 23 31
S2 43 14 91 99 14 92 3 3
S3 65 23 91 97 24 91 3 3
S4 30 36 99 100 39 99 8 8
D1 03 34 56 0 34 56 0 0
D2 05 47 73 18 47 73 0 0
D3 77 4 77 54 44 79 10 14
Calculations of the OLR using VS (not corrected) of the four different substrates(S1ndashS4) showed 3ndash31 higher value compared to calculations using thecompensated VS content (Figure 4 Table 12) Substrates S1 and S2 originatedfrom two different plants with pasteurization and the origin of the ingoing materialsdigested are relatively similar However the error in OLR is only 3 for substrateS2 but as high as 31 for substrate S1 (Figure 6 Table 13) This clearly showsthat is not possible to generalize the error for a substrate mixture without actuallyknowing the VFA concentration It is therefore important to continuously analyzeVFA within the substrate mixture to be able to calculate a correct OLR A constantOLR over time increases the process stability and that might be hard to achievewithout compensating the DM and VS values for the VFA evaporation particularlyif the VFA levels in the substrate are varying a lot
Figure 6 The relative error in the VFA compensated values of DM (DMcomp) andVS (VScomp) compared to the measured DM and VS values
Calculation of specific biogas production with non-corrected VS values will resultsin the same relative error as the OLR calculation This can be exemplified byassuming the ldquotruerdquo specific gas production for S1 and S2 (eg 070 Nm3kg VS)Without compensating for the VFA evaporation the specific biogas production will
0
5
10
15
20
25
30
35
S1 S2 S3 S4 D1 D2 D3
Re
lati
ve
err
or
()
DM error () VS error ()
SGC Rapport 2013273
40 Svenskt Gastekniskt Center AB Malmouml ndash wwwsgcse
be 092 Nm3kg VS and 072 Nm3kg VS for S1 and S2 respectively This meansthat one would assume that the substrate S1 had 28 higher biogas potential thansubstrate S2 which is incorrect The error (VSerror) caused by the VFA evaporationwithin the substrate will result in false-high specific biogas production and couldthereby lead to incorrect judgment concerning the economic value of a specificsubstrates for a biogas plant
Using different VS values and calculating the degree of degradation illustratesthat the error might even be higher than the errors in the parameters OLR andspecific gas production This is caused by the fact that both the DM and VS of theinlet substrate as well as the DM and VS of the digestate are used in thiscalculation In a scenario when a substrate with a high concentration of VFA isdigested thus giving a risk that VFA also is being accumulated in the digester thecalculation may results in a ldquodoublerdquo false value This can be exemplified byassuming a hypothetical biogas plant where substrate S1 is fed into the digesterand D3 is the outlet digestate With a compensation of the VFA evaporation in themeasurement in the substrate as well as in the digestate the degree ofdegradation will be 51 When doing the same calculation but with a VFAcompensation for the VS content of the substrate only and not for the digestate afalse-high value of 56 is obtained Without any VFA compensation at all thedegree of the degradation will on the contrary have a false-low value of 43
All in all it is of great importance to take the error in the DM and VS intoconsideration when performing calculation of organic loading rate specific biogasproduction as well as the degree of degradation However the error may benegligible for some substrates and biogas plants (eg digestion of substrate S2 orS4) but essential for other plants with high VFA content in the substrate (egdigestion of S1 or S3)
Evaporation of ammonium during the dry-matter analysis36
The main focus of the present project was to evaluate the evaporation of VFAsduring the DM-analysis using oven-drying However both the substrates anddigestates also contain inorganic molecules such as ammonium and ammoniawhich can affect the DM results The total concentration of ammonium (NH4-N)was analyzed in the samples before and after the DM-analysis and the observedresults are presented in Table 14 and in Figure 7 It should be notified that thepresented values include both the concentration of ammonium in the NH4-N stateas well as the NH3-N state but will hereafter just be called NH4-N
A common value of ammonium concentration in the digestate from a co-digestion plant is approximately 3 g NH4-Nkg exemplified by the samples D1 andD2 (Table 14) Ammonium and ammonia is in equilibrium with each other with anincreasing fraction being ammonia with increasing pH and temperature In amesophilic process (~37 degC) about 10 of the total ammonium fraction is in theammonia state However in the oven-drying the temperature rises to 105degC andwill more or less dislocate the equilibrium to ammonia (boiling point -33degC) whichis highly volatile By using the formula given by (Hansen et al 1998) and a typicalpH of a digestate 75 the oven-drying at 105oC will result in 61 of the total NH4-N being in the NH3-N state Thus more or less all ammonium and ammonia canbe expected to be evaporated in the case of a digestate However in a substrateless than 1 of the ammonium is expected to be in NH3-N state due to a lower pH(typically 4-5)
SGC Rapport 2013273
Svenskt Gastekniskt Center AB Malmouml ndash wwwsgcse 41
Table 14 The concentration of ammonium (NH4-N) in wet and dissolved driedsamples of the substrates S1-S4 and digestates D1 and D2 The mean values arepresented with a 95 confidence interval and the volatility has been calculated bythe same principle as the volatility of the VFAs (Equation 7)
SampleWet sample
(mg NH4-NL)Dissolved dried sample
(mg NH4-NL)Volatility
()
S1 1 400 plusmn 39 27 plusmn 3 98
S2 510 plusmn 140 10 plusmn 6 98
S3 450 plusmn 210 390 plusmn 48 13
S4 48 plusmn 5 3 plusmn 1 94
D1 2 900 plusmn 120 4 plusmn 1 100
D2 2 800 plusmn 65 49 plusmn 9 98
The analysis showed the highest concentrations of NH4-N for D1 (~29 gNH4-Nkg) and D2 (~28 g NH4-Nkg) Both digestate D1 and D2 had a pH of 79 inthe wet samples The tested substrates contained between 005 to 14 g NH4-Nkgand the pH varied from 41 to 52 It was thus observed that the pH was highlycorrelated with the NH4-N concentration with a linear correlation of 96 Thisshowed that samples with high levels of ammonium had a higher pH thansubstrates with low NH4-N concentrations In spite of the variation in pH thevolatility of ammonium was shown to be ge94 in S1 S2 S4 D1 and D2 The results also indicated that the ammonium volatility was lower in S3 (~13)compared to the other materials In a previous published study by Porter andMurray (2001) the volatility of ammonia was found to be gt97 in grass silage thatwas heated It seems unlikely that there would be such a large difference in thevolatility of ammonium in the grass silage included in this study compared to thestudy published by Porter and Murray (2001)The silage was more complicated toanalyze since the DM was much higher than the other analyzed materials and theS3 had to be mixed with water prior to the analysis of the wet (initial) ammoniumconcentration It is possible that not all of the ammonium was detected in the wetsample The uncertainty was also very high in the measurements of the wetsample of S3 (Table 14) which is an indication of an inhomogeneity with respectto the ammonium concentration
SGC Rapport 2013273
42 Svenskt Gastekniskt Center AB Malmouml ndash wwwsgcse
Figure 7 Volatility of ammonium within the different samples complied with the pHand ammonium concentration of the wet samples (before drying)
The volatility of VFA ndash a summary of the observed results37
As discussed previously the VFA volatility was higher than 95 in all foursubstrates (Figure 8) The volatility was lower for all the three digestates comparedto the four substrates and there were a significant difference between thedigestates being approximately 0 18 and 55 for D1 D2 and D3 respectivelyFor the digestate samples the highest volatility of the VFAs was found for thedigestate with the highest total VFA concentration However it should be noticedthat for materials with very low concentrations of VFAs such as the digestate D1and D2 the uncertainty in the analyzed VFA concentrations was large
0
1
2
3
4
5
6
7
8
9
0
20
40
60
80
100
S1 S2 S3 S4 D1 D2
pH
inw
et
sa
mp
leA
mm
on
ium
co
nc
en
tra
tio
n(g
NH
4-N
kg
)
Vo
lati
lity
()
Volatility Ammonium pH
SGC Rapport 2013273
Svenskt Gastekniskt Center AB Malmouml ndash wwwsgcse 43
Figure 8 The volatility of VFA the pH and the total concentration of VFAs in thefour analyzed substrates and the three investigated digestates
When comparing the volatility of VFAs of substrates and digestates it is clear thatpH is an important parameter The volatility was much higher for the substrateswith low pH than the digestate that had a much higher pH The importance of pHfor the degree of evaporation was also shown in the experiments performed toverify that it was possible to detect a majority of the VFAs in dissolved driedsamples diluted in MilliQ water (Chapter 32) The volatility was 95 in sample S1with a pH of 52 and 2 when the pH had been increased to above 11 The sametrend was observed for S2 sample for which the volatility was 99 (pH 50)compared to 19 when the pH was above 11 Consequently these resultsshowed that the evaporation of VFAs can be minimized by modifying the pHNegatively charged VFAs might interact with positively charged molecules orsubstances within the material and the evaporation of the VFAs is consequentlyminimized
The substrates used for biogas production are highly complex and diverse at amolecular level Consequently even when comparing similar types of substratesoriginating from different full scale plants these materials will be different at themolecular level It is thus likely that different reactions and composition changeswill occur within different materials during the drying process and this might in turnhave an impact of the evaporation of the volatile compounds This was forexample observed in this project as the pH of the analyzed materials changeddifferently in different samples during the oven DM-analysis Consequently theevaporation of volatile molecules from a sample might influence the volatility of themolecules still in the sample It is difficult to clearly reveal what chemical propertyof the materials or what environmental factor that will have the most effect on theevaporation of VFA and ammonia
0
2
4
6
8
10
12
14
0
10
20
30
40
50
60
70
80
90
100
S1 S2 S3 S4 D1 D2 D3
We
tp
Ho
fs
am
ple
VF
AV
ola
tili
ty(
)W
et
VF
Ac
on
ce
ntr
ati
on
(gL
)
Sample
Volatility VFA concentration pH
SGC Rapport 2013273
44 Svenskt Gastekniskt Center AB Malmouml ndash wwwsgcse
Methods to compensate DM for VFA evaporation biogas substrates38
For someone in the business of biogas production that would like to adopt thefindings in this study two methods for compensation are suggested whenanalyzing DM with oven-drying
As stated earlier the impact of the discrepancy in the analysis is dependent onthe characteristics of the materials analyzed For materials typically substratesstreams with a low pH (lt52) there is probably a high risk that the majority of theVFA is lost during the oven DM-analysis This might be a large problem when theanalyzed material has a high concentration of VFAs in relation to the DM as theerror in VS-weight in this case would be very large Therefore there are no quickfix of this problem and no general rules to adopt for all types of materials
An original thought was to prove a method decreasing evaporation of VFA byadding NaOH and thus increase the pH The VFAs would then be fixed in thesample and by considering the amount of added NaOH contributing to DM and itwould then be possible to obtain a correct DM and VS value This method wouldbe relatively easy to adopt for operators at a biogas plant or in a laboratoryHowever even if the VFAs could be fixed into the samples during the DM-analysis the addition of NaOH caused false-high DM values probably due toother chemical reactions within the sample Modification of pH by adding NaOH tominimize the evaporation of VFAs has also been investigated by (Nordberg et al2010) which observed a lower experimental DM value than expected for artificialsubstrates
Therefore the suggested methods for correction DM are more complicated andinclude more analysis of the material of interest than expected and hoped forbefore performing this study As other volatile molecules besides VFA might bepresent in the materials these should also be compensated for to obtain exact DMand VS values More accurate DM and VS values are however obtained by usingthe suggested method to compensate for the VFA loss than without compensationFor substrates with low pH both methods can be applied Since the variation inresults for evaporation of VFA in the digestate only method 2 should be appliedThe suggested methods give different accuracy of the DMcomp
SGC Rapport 2013273
Svenskt Gastekniskt Center AB Malmouml ndash wwwsgcse 45
Method 1 - Rough estimation method381
Method 1 for estimation of DMcomp and VScomp is suggested for substrates with lowpH (pH le 52) and when a rough estimate is sufficient Analyzes of pH and VFA (as a sum of organic acids or as VFA) are performed on the material (substratedigestate or mixtures of materials)
1)Measure DM (DMm) and VS (VSm) according to the Swedish Standard method SS02 81 13 (SIS 1981) DM determination in oven for 20 hours at 105oC and VSdetermination of the dried sample for 2 hours at 550oC
2)Analyze the concentrations of VFAs in the original sample (VFAm) This could bedone by analyzing the individual VFA and sum them up or by using a quickmethod that gives the sum directly The unit of the result used should beldquomg VFALrdquo
3)Assume a value for the volatility of VFAs in your substrate preferably VFAvol =98 (see results and discussion for volatility in different types of substrates)Calculate the compensated DMcomp weight by
ܯܦ ሺΨሻൌ ܯܦ () ቌቀ ௩௧௧௬ܣܨ ()ቁ
100ܣܨכ (Ȁܮ) lowast 10ସቍ
4)Calculate VScomp ( of DMcomp) by
൫Ψ ܯܦ ൯ൌ
൫ܯܦ () כ ()൯ ቀͳͲସ ௩௧௧௬ܣܨכ () ܣܨכ (Ȁܮ)ቁ
ܯܦ ()
SGC Rapport 2013273
46 Svenskt Gastekniskt Center AB Malmouml ndash wwwsgcse
Method 2 - Detailed estimation method382
This method should be used to compensate for the evaporation of VFAs in thosecases where it is important to have a very good estimation of the DM content in aspecific substrate or substrate mixture For digestates this method only can beused
1)Analyze the concentrations of VFAs in the original sample (VFAm) This could bedone by analyzing the individual VFA and sum them up or by using a quickmethod that gives the sum directly The unit of the result used should beldquomg VFALrdquo
2)Measure DM (DMm) and VS (VSm) according to the Swedish Standard methodSS 02 81 13 (SIS 1981) DM determination in oven for 20 hours at 105oC and VSdetermination of the dried sample for 2 hours at 550oC
3)Add MilliQ water to the beaker containing the dried material The added amount ofMilliQ water (mwater) should be adjusted so that the weight of the material isapproximately the same as before the drying Consequently if 8 grams ofmaterials were inserted in the oven then the weight of the dried materialsdissolved in MilliQ water (mwater) should be about 8 grams The water shouldhowever cover the dried material so if eg a lot of material is fixed on the wall ofthe beaker it might be necessarily to add more water
a) Notice the weight of the dried sample (msampledried)b) Let the beaker with the dried material and the added MilliQ water stand for 30
minutes Then stir the solution for 10 minutesc) Analyze the concentration of VFAs in the dissolved dried material
(VFAdrieddissolved)d) Calculate the concentrations of VFAs in the dried material before dissolved in
MilliQ water (VFAdried)
(ܮȀ)ௗௗܣܨ ൌ ൬כௗ௦௦௩ௗǡௗௗܣܨ൫ ೞ ǡା ൯
ೞ ǡ ൰
4)Calculate the actually volatility () of the VFAs in the sample
()௩௧௧௬ܣܨ ൌ ቆͳെிቀ
ಽቁ
ி ቀ
ಽቁቇכͳͲͲ
5)Calculate the compensated DMcomp weight by
ܯܦ ሺΨሻൌ ܯܦ () ቆ௩௧௧௬ܣܨ ()
100כ ܣܨ ( fraslܮ ) lowast 10ସቇ
SGC Rapport 2013273
Svenskt Gastekniskt Center AB Malmouml ndash wwwsgcse 47
6)Calculate VScomp ( of DMcomp) by
൫ ܯܦ ൯=
൫ܯܦ () lowast ()൯+ ቀ10ସ lowast ௩௧௧௬ܣܨ () lowast ܣܨ ቁ(ܮ)
ܯܦ ()
SGC Rapport 2013273
48 Svenskt Gastekniskt Center AB Malmouml ndash wwwsgcse
4 Conclusions
In this study the evaporation of VFAs and ammonia from different substrates anddigestates during DM-analysis using oven-drying were investigated The resultsshowed that the evaporation of VFAs during the DM-analysis using oven-dryingcould be a major problem for substrates with a relatively high concentration of VFAin relation to the DM content Four distinct biogas substrates (3-17 g VFAL) allwith low pH were evaluated with the respect to VFA evaporation The loss of VFAduring the DM-analysis in oven (20 hours 105oC) was concluded to be 95-100for the four substrates The errors caused by evaporation of VFAs during the DM-analysis may result in a false-high specific biogas production and a false-loworganic loading rate In the present study the measurement errors were in therange of 3-31 for the analyzed substrates Three different types of digestateswere also evaluated (03-77 g VFAL) all with high pH with the respect to VFAevaporation The evaporation of VFA varied between 0-50 in the digestates Thedifference between the substrates and digestates indicated that the pH and buffercapacity of the samples were important factors
Moreover a comparison between the concentrations of VFA and the amount ofdissolved organic carbon (TOC) for a reference substrate indicated that themajority of the volatile organic material that was lost during the DM-analysis wasVFA Based on the obtained results two different methods (with differentaccuracy) to compensate the DM and VS in biogas substrates with low pH anddigestates were suggested Furthermore it was also shown that also ammoniumevaporated from substrates and digestates during the oven-drying This might beof importance for digested materials where the concentration of ammonium oftenis high The evaporation of ammonium should be investigated further to be able tocompensate for the loss of this volatile molecule
All in all the results from the present study showed that it is of greatestimportance to compensate DM and VS for the VFA evaporation that occurs duringDM-analysis by oven-drying By applying one of the methods suggested in thisreport more reliable values of specific biogas production and potential organicloading rates could be expected in both full scale and laboratory scale conditions
SGC Rapport 2013273
Svenskt Gastekniskt Center AB Malmouml ndash wwwsgcse 49
5 Acknowledgements
The authors would like to thank NSR Swedish Biogas International SvenskBiogas i Linkoumlping AB and Stockholm Vatten for providing us with samples ofsubstrates and digestates during the experiments The authors would like to thankKatarina Stensen (Tekniska verken FoU Biogas) who performed the pre-studyand gave value input on the written report Thanks to Daniel Hellstroumlm (SvensktVatten Utveckling) and Andreas Carlsson (Stockholm Vatten) and Angelica Blom(Avfall Sverige) for their great input and review of the the written report JanMoestedt and Soumlren Nilsson Paringledal (Tekniska verken R amp D Biogas) for valuablediscussions of the lab results The authors would like to give thanks to Irene Bohn(NSR) Catarina Jonasson (EON) and Tobias Persson (SGC) for sharing theirknowledge and engagement during the reference meetings Finally the authorswould like to thank Yasna Calderon (Tekniska verken RampD Biogas) HelenWolrath (Tekniska verken Water Laboratory) and Karin Eden (Tekniska verkenWater Laboratory) for the assistance during the analysis and for valuable input tothe project
Finally and again thanks to all of the financiers to the project Tekniska verken iLinkoumlping AB Swedish University of Agricultural Sciences Swedish WasteManagement Goumlteborg Energi AB Svenskt Vatten Utveckling Stockholm GasAB ALcontrol AB EON Sverige AB NSR AB and SGC through the SwedishEnergy Agency
SGC Rapport 2013273
50 Svenskt Gastekniskt Center AB Malmouml ndash wwwsgcse
6 Literature
Ahring BK Sandberg M Angelidaki I 1995 Volatile Fatty-Acids as Indicatorsof Process Imbalance in Anaerobic Digesters Applied Microbiology andBiotechnology 43(3) 559-565
Carlsson M Uldal M 2009 Substrathandbok foumlr biogasproduktion (English titleSubstrate manual for biogas production) Svenskt Gastekniskt CenterISRN SGC-R-200-SE
De Caro CA Aichert A Walter CM 2001 Efficient precise and fast waterdetermination by the Karl Fischer titration Food Control 12(7) 431-436
Derikx PJL Willers HC ten Have PJW 1994 Effect of pH on the behaviourof volatile compounds in organic manures during dry-matter determinationBioresour Technol 49(1) 41-45
Ebbing DD 1993 General Chemistry Fourth Edition Houghton Mifflin CompanyBoston MA USA
Ek A Hallin S Vallin L Schnuumlrer A Karlsson M 2011 Slaughterhousewaste co-digestion - Experiences from 15 years of full-scale operationWorld Renewable Energy Congress ndash Sweden 8ndash13 May 2011Linkoumlping Sweden
Ganidi N Tyrrel S Cartmell E 2009 Anaerobic digestion foaming causes ndash Areview Bioresour Technol 100(23) 5546-5554
Gerardi MH 2003 The Microbiology of Anaerobic Digesters John wiley amp SonsInc United States of America
Hansen KH Angelidaki I Ahring BK 1998 Anaerobic digestion of swinemanure Inhibition by ammonia Water Research 32(1) 5-12
Isengard HD Walter M 1998 Can the water content of dairy products bedetermined accurately by microwave drying Zeitschrift Fur Lebensmittel-Untersuchung Und-Forschung a-Food Research and Technology 207(5)377-380
Jonsson S Boreacuten H 2002 Analysis of mono- and diesters of o-phthalic acid bysolid-phase extractions with polystyrene-divinylbenzene-based polymersJournal of Chromatography A 963(1-2) 393-400
Kreuger E Nges IA Bjoumlrnsson L 2011 Ensiling of crops for biogas productionndash effects on methane yield and total solids determination BiotechnolBiofuels
Larsen RE Jones GM 1973 Effects on different dry matter determinationmethods on chemical composition and in vitro digestibility of silage Can JAnim Sci 53 753-760
Lomborg CJ Holm-Nielsen JB Oleskowicz-Popiel P Esbensen KH 2009Near infrared and acoustic chemometrics monitoring of volatile fatty acidsand dry matter during co-digestion of manure and maize silage BioresourTechnol 100(5) 1711-1719
MacLeod SΚ 1991 Moisture Determination Using Karl Fischer Τitrations AnalChem 63 (10) pp 557Andash566A(10) 557A-566A
Madsen M Holm-Nielsen JB Esbensen KH 2011 Monitoring of anaerobicdigestion processes A review prespective Renewable and SustainableEnergy Reviews 15 3141-3155
SGC Rapport 2013273
Svenskt Gastekniskt Center AB Malmouml ndash wwwsgcse 51
Marquez MF Garcia B Ruiz V Ruizlopez MAD 1995 DETERMINATIONOF TOTAL SOLIDS IN DAIRY-PRODUCTS USING THE MICROWAVE-OVEN METHOD International Journal of Food Science and Technology30(3) 307-310
Nicolaiumla BM Beullensa K Bobelyna E Peirsa A Saeysa W Theronb KILammertyna J 2007 Nondestructive measurement of fruit and vegetablequality by means of NIR spectroscopy A review Postharvest Biology andTechnology 46(2) 99-118
Nordberg Aring Hansson M Kanerot M Krozer A Loumlfving B Sahlin E 2010Robusta maumlttekniker on-line foumlr
optimerad biogasproduktion WASTE REFINERY ISSN 1654-4706Nordell E Bohn I Karlsson M Moestedt J Wiberg L 2013 Improved
process stability and increased biogas production rate by addition of ironhydrochloric acid and trace elements Biomass amp BioenergySubmitted(Submitted)
Porter MG Murray RS 2001 The volatility of components of grass silage onoven drying and the inter-relationship between dry-matter content estimatedby different analytical methods Grass and Forage Science 56(4) 405-411
Reh CT Gerber A 2003 Total solids determination in dairy products bymicrowave oven technique Food Chemistry 82(1) 125-131
Samuelsson R Burvall J Jirjis R 2006 Comparison of different methods forthe determination of moisture content in biomass Biomass and Bioenergy30(11) 929-934
SIS 1981 Vattenundersoumlkningar - Bestaumlmning av torrsubstans ochgloumldgningsrest i vatten slam och sediment Vol SS 02 81 13 pp 1-3
SP 2010 SPCR 120 Certifieringsregler foumlr Biogoumldsel Vol SPCR 120 SPSveriges Tekniska Forskningsinstitut Borarings
Tafdrup S 1995 Viable energy production and waste recycling from anaerobicdigestion of manure and other biomass materials Biomass amp Bioenergy 9303-314
Ward AJ Hobbs PJ Holliman PJ Jones DL 2008 Optimisation of theanaerobic digestion of agricultural resources Bioresource Technology99(17) 7928-7940
Weiszligbach F Strubelt C 2008a Correcting the Dry Matter Content of MaizeSilages as a Substrate for Biogas Production Landtechnik 2 82-83
Weiszligbach F Strubelt C 2008b Correction of Dry Matter Content in Sugar BeetSilage as a Substrate for Biogas Production Landtechnik 63(6) 354-355
wwwsigmaaldrichcom

SGC Rapport 2013273
24 Svenskt Gastekniskt Center AB Malmouml ndash wwwsgcse
Table 1 The properties of different volatile compounds such as volatile fatty acidsand alcohols
Compounds Formula pKa1 Mol weigth
1
(gmol)TOC()
Boilingpoint (
oC)
Vapor pressure(mm Hg)
Formic acid CH2O2 375 460 26 1011
Acetic acid C2H4O2 475 600 40 1181 114
2
Propionic acid C3H6O2 487 740 49 1411 24
2
Lactic acid C3H6O3 386 901 40 122Butyric acid C4H7O2 482 881 54 163
1 0432
Iso-butyric acid C4H8O2 486 881 54 1551 15
2
Valeric acid C5H10O2 482 1021 59 1861 015
2
Iso-Valeric acid C5H10O2 478 1021 59 176 0382
Hexanoic acid C6H12O2 488 1161 62 2061 018
2
Iso-hexanoic acid C6H12O2 485 1161 62
Heptanoic acid C7H14O2 471 1301 65 223 lt012
Methanol CH4OH - 320 36 65 9772
Ethanol C2H5OH - 461 52 78 4462
Propanol C3H7OH - 601 60 97 332
Theoretical At 20 degC1 SI-data2 sigma-aldrich
Charged VFAs will interact with other charged moleculessubstances in thematerials Consequently these VFAs will have a lower volatility compared touncharged VFAs The degree of ionization is determined by the pH of the materialand majority of the VFAs will be uncharged if the pHltltpKa (Figure 3)
Figure 3 A typical titration curve for a buffered system such as a biogas substratewith a low pH to which a base is added At the pKa the amount of ionized andunionized acids is equal for a certain acid
SGC Rapport 2013273
Svenskt Gastekniskt Center AB Malmouml ndash wwwsgcse 25
VFA content in the substrate162
Even though a substrate originally normally consists of fat protein andcarbohydrates this may not be the fact when the substrates enter the digestionprocess With easy available substrates such as food waste and slaughterhousewaste the degradation often starts already when the substrates are held in stockin eg storage tanks at the biogas plant The biological activity may be particularlyhigh during the summer when the temperature is high This biological processdoes typically not include methanogenesis but the substrates may undergo thefirst steps in the anaerobic process the hydrolysis and the acidogenesis This maylead to an early start of the anaerobic process and formation of multiple organiccompounds such as alcohols and volatile fatty acids which can contribute to avery low pH of the substrate The low pH is an unsuitable condition formethanogenesis to occur and therefore the VFA is still within the substrate whenit finally enters the digester The VFA concentration in a substrate mixture can thussometimes represent a large share of the DM and the VS content which make itimportant to ensure that a reliable method for DM and VS measurement is appliedto avoid an underestimate of the VS content
SGC Rapport 2013273
26 Svenskt Gastekniskt Center AB Malmouml ndash wwwsgcse
2 Experimental
Seven materials were investigated in this study The study included three differentsubstrates from full scale biogas plants in Sweden two pasteurized food andslaughterhouse mixtures abbreviated S1 and S2 as well as one grass silagematerial abbreviated S3 The study also included sludge from grease separatorsto be treated at a water treatment plant in Sweden abbreviated S4 Besides thefour substrates the study also included three digestates abbreviated D1 D2 andD3 The digestates D1 and D2 originated from two different full scale plants inSweden The digestate D3 originated from a bio-reactor used in a lab-scaleexperiment
General analysis procedure21
The concentrations of DM VFA pH ammonium and TOC were all determinedwith the same analysis procedure for all samples
Figure 4 A sketch of the analysis procedures used in the project
1) A known weight of the wet material was placed in the DM-oven
2) The DM content was determined according to the description in Chapter 23(Analysis methods and calculations)
3) A known amount of MilliQ water (asymp9-20 g depending on the sample) was allowed to soak into the dried sample for 5-10 minutes and the obtained
SGC Rapport 2013273
Svenskt Gastekniskt Center AB Malmouml ndash wwwsgcse 27
solution (dissolved dried sample + MilliQ water) was then stirred for 15-30minutes
4) The VFA concentration the pH or the dissolved TOC in the original sample aswell as the soaked dissolved dried sample were analyzed according to thedescription in Chapter 23 For the ammonium analysis the dried material wasinvestigated according to the procedure described in Chapter 23 (Analysismethods and calculations)
5) Calculations were performed to determine the VFA compensated DM-value(DMcomp Equation 7) ie the amount of acids that evaporated during the drying(difference between VFA content in the wet and dried sample) were added tothe DM value
Validation of the general analysis procedure22
To verify that it was possible to analyze VFA in dried samples which had beendissolved in MilliQ water the pH was increased in test samples (pHgt11) before theDM analysis using oven-drying The modification of pH was performed by addingapproximately 30 ml of 1M NaOH to about 100 ml of substrate S1 (S1NaOH) and byadding 29 ml of 1M NaOH to 107 ml of the substrate S2 (S2NaOH) Theconcentration of VFA in the wet sample was compared to the concentration of theVFA in the dissolved dried sample
Analysis methods and calculations23
The DM was analyzed by drying a known weight (~10 g) of the wet sample (wetweight) according to SS 02 81 13 (SIS 1981) in an oven for 20 hours at 105 degCThe samples were then placed in a desiccator to avoid accumulation of wateruntil the samples had cool down and the weight of the material was thereaftermeasured (DM weight)
To determine the VS the dried material was further heated at 550 degC for 3hours which is slightly modified compared to the SS 02 81 13 (SIS 1981) where2 hours which is stated The material was then allowed to cool down in adesiccator before the weight of the material was measured (ash weight) The DMand VS were analyzed in at least six independent samples for each of theinvestigated materials The DM () and VS ( of DM) were calculated accordingto equations 4 and 5 respectively The VFA concentration within the dried samplewas calculated according to equation 6 and the volatility according to equation 7
Equation 4)
൬ܯܦ ݓ ݐ
ݓݐ ݐ൰כͳͲͲൌ ݕݎܦ ݐݐ ݎ ݐ ሺΨሻݐ
SGC Rapport 2013273
28 Svenskt Gastekniskt Center AB Malmouml ndash wwwsgcse
Equation 5)
൭1 ndash൬ݐℎݓℎݏܣ
ܯܦ ݐℎݓ൰൱ lowast 100 = ) )
Equation 6)
ௗௗ௦ܣܨ (ܮ) = ௗ௦௦௩ௗௗௗlowastቆܣܨ൫ ௦ ௗௗ + ௪௧൯
௦ ௧ቇ(ܮ)
Equation 7)
௩௧௧௬ܣܨ () =ቆ1 minusௗௗ௦ܣܨ ( fraslܮ )
௪௧௦ܣܨ ( fraslܮ )ቇlowast 100
The VFA compensated DMcomp and VScomp were calculated according to theEquations 8 and 9 where DMm is the measured DM value VSm is the measuredVS value and VFAvolatility is the volatility of the VFA based upon the totalconcentration of VFA
Equation 8)
ܯܦ () = DM୫ () + ൭௩௧௧௬ܣܨ ()
100lowast )௧ܣܨ fraslܮ )൱ lowast 10ସ
Equation 9)
൫ ofܯܦ ൯
=൫DM () lowast ()൯+ (10ସ lowast ()௩ܣܨ lowast ܣܨ ((ܮ)
ܯܦ ()
The VFAs were analyzed using a Clarus 550 gas chromatograph (Perkin ElmerUSA) equipped with a packed Elite-FFAP column used for acidic compounds(Jonsson amp Boreacuten 2002) The VFA was analyzed in at least three independentwet samples and three independent dissolved dried samples for each of theinvestigated materials and the presented values are the average of the threemeasurements The presented VFAs concentrations for the dissolved driedsamples have been correlated for the dilution with MilliQ water The average of theconcentration is presented with a 95 confidence interval
The ammonium (NH4-N) was analyzed according to the FOSS Tecatorsapplication sub note 3502 using a Kjeltec 8200 distillation system (FOSS inScandinavia Sweden) The ammonium was analyzed in at least threeindependent wet samples and three independent dissolved dried samples for allthe materials The presented concentration is the average of the threeindependent measurements with a 95 confidence interval The presentedconcentrations of NH4-N have been correlated for the dilution It should be notified
SGC Rapport 2013273
Svenskt Gastekniskt Center AB Malmouml ndash wwwsgcse 29
that the concentration of ammonium includes both the ammonium in the NH4-Nstate as well as the NH3-N state
The TOC was determined in the dissolved fraction of the S1 substrate bycentrifugation of the substrate (11 000 rpm 20 min) and thereafter filtration of thesupernatant trough 045 microm Millipore filter TOC was then determined in thefiltrate TOC was analyzed with the instrument Multi NC 3100 (AnalytikJena UKUnited Kingdom) according to the guidelines in SS-EN 1484 Here the organiccarbon in the sample is oxidized to carbon dioxide using a patina catalyzer andthe carbon dioxide concentration is then determined by a NDIR detector Threeindependent analyzes were performed on the wet sample and the dissolved driedsample of S1 The pH was measured using a potentiometric pH-meter (WTWInolab USA) equipped with a Hamilton electrode at asymp25degC
Sample preparation24
The materials S1 S2 D1 D2 and D3 were stored in a freezer at -20 degC until useThe substrates S3 and S4 were placed in a refrigerator at +4 degC and analyzed veryshortly after the materials had been received at Tekniska verken The silagesubstrate (S3) was diluted in water (S3 Water 153) and mixed with a handblender prior to the analysis of VFAs pH and ammonium DM and VS weremeasured on undiluted material of S3 as described in Chapter 23
SGC Rapport 2013273
30 Svenskt Gastekniskt Center AB Malmouml ndash wwwsgcse
3 Results and discussion
The main focus of this project was the evaporation of VFAs from differentmaterials used in the biogas production during the DM-analysis by oven-dryingThe results from the analyzed substrates and digestates are presented anddiscussed with respect to the volatility of VFA and the potential errors in DM VSand different important biogas parameters The result from evaporation analyzesof ammonium and the total organic carbon are also shown and discussedFurthermore two different methods to be used to compensate for errors in DM andVS due to the loss of VFA are proposed
Samples characterization31
Seven different materials were analyzed in this project two pasteurized mixturesof substrates (S1 and S2) one grass silage (S3) one sludge material from greaseseparators (S4) and three different digestates (D1 D2 and D3) Thecharacteristics of the seven analyzed materials can be found inTable 2
Table 2 The characteristics of the materials included in this study
Sample DM () VS ( of DM) VFA (mgL) NH4-N (mgkg) pH
S1 72 plusmn 02 75 plusmn 20 17 000 plusmn 570 1 370 plusmn 39 52 plusmn 00
S2 14 plusmn 05 91 plusmn 04 4 300 plusmn 61 514 plusmn 142 50 plusmn 00
S3 23 plusmn 04 91 plusmn 01 6 500 plusmn 4 453 plusmn 206 41 plusmn 00
S4 36 plusmn 02 99 plusmn 11 3 000 plusmn 20 48 plusmn 5 46 plusmn 00
D1 34 plusmn 00 56 plusmn 02 320 plusmn 13 2 880 plusmn 117 79 plusmn 01
D2 47 plusmn 01 73 plusmn 02 460 plusmn 33 2 810 plusmn 65 79 plusmn 00
D3 42 plusmn 02 76 plusmn 10 7 700 plusmn 200 5 340 plusmn 106 80 plusmn 00
Validation of the general analysis procedure32
The same general analysis procedure was used in this project to measure theconcentration of VFAs in the dried samples This analysis procedure is describedin Chapter 21 The samples were first dried and then dissolved in MilliQ waterprior to the analysis To verify this procedure the pH of substrates S1 and S2 wasincreased to above 11 before the oven-drying The S1 and S2 samples to whichthe NaOH was added are hereafter abbreviated S1NaOH and S2NaOH The aim withthis modification of pH was to increase the degree of ionization of the VFAs in thesamples The negatively charged VFAs may interact with positively chargedmolecules and remain in the sample during the drying and the evaporation shouldbe minimized Consequently the concentration of VFAs in the wet and dissolveddried samples should be about the same if the method to analyze VFA in drymaterials dissolved in MilliQ is working The observed results for the pasteurizedmixture of materials S1NaOH and S2NaOH are presented in Tables 3 and 4respectively
SGC Rapport 2013273
Svenskt Gastekniskt Center AB Malmouml ndash wwwsgcse 31
Table 3 The concentrations of VFAs in the wet and the dissolved dried samples ofS1NaOH (pHgt11) and the calculated volatility The volatility has been calculatedaccording to Equation 7
Volatile fatty acidWet sample
(mgL)Dissolved dried sample
(mgL)Volatility
()
Acetic acid 6 000 6 100 0
Propionic acid 2 300 2 100 9
Butyric acid 1 300 1 100 15
Iso-butyric acid 300 200 33
Pentanoic acid 930 970 0
Iso-pentanoic acid 300 250 17
Hexanoic acid 1 600 1 700 0
Iso-hexanoic acid 100 80 20
Heptanoic acid 300 250 17
Sum VFA (mgL) 13 000 12 800 2
The volatility when considering the total concentration of VFAs was calculated tobe 2 and 20 for S1NaOH and S2NaOH respectively These results are in agreementwith a previous published article by (Derikx et al 1994) According to this studyVFAs can be fixed in manures during oven-drying when the pH is above 10 Theobserved results showed that a majority of the VFAs was detected in both S1NaOH
and S2NaOH thus indicating that the method of analyze VFA within a dried samplesworks
Table 4 The concentration of VFAs in the wet and the dissolved dried samples ofS2NaOH (pHgt11) and the calculated volatility ()The volatility has been calculatedaccording to Equation 7
Volatile fatty acidWet sample
(mgL)Dissolved dried sample
(mgL)Volatility
()
Acetic acid 3 000 2 800 7
Propionic acid 660 400 39
Butyric acid 500 280 44
Iso-butyric acid 70 30 57
Pentanoic acid 260 140 46
Iso-pentanoic acid 100 70 30
Hexanoic acid 160 120 25
Iso-hexanoic acid 30 20 33
Heptanoic acid 100 70 30
Sum VFA (mgL) 4 900 3 900 20
Evaporation of VFA compared to TOC33
The dissolved fraction of total organic carbons (TOC) was analyzed in thesubstrate with the highest VFA concentration substrate S1 before oven-drying aswell as after oven-drying By analyzing both VFA and dissolved TOC the mass-balance of organic carbon within the samples was calculated Only the dissolvedfraction of the samples was analyzed assuming that no TOC was transferred fromsolid to dissolved TOC during the oven-drying procedure During the oven-dryingthe dissolved TOC decreased from approximately 16 700 mgL down to about 6
SGC Rapport 2013273
32 Svenskt Gastekniskt Center AB Malmouml ndash wwwsgcse
100 mgL while the VFA level decreased from approximately 17 000 mgL to 780mgL (Table 5) The concentration of VFAs in the wet sample correspondedtheoretically to about 8 300 mg TOCL whereas the concentration of VFA in thedissolved dried sample corresponded to approximately 360 mg TOCL It shouldbe notified that since the theoretical value of TOC in each VFA differ calculationsof each individual VFA were performed for these calculated TOC values
Table 5 VFA and TOC within the wet and dissolved dried samples
ParameterWet sample
(mgL)Dissolved dried sample
(mgL)Evaporation
(mgL)
VFA 17 000 plusmn 570 780 plusmn 140 16 220
Calculated TOC as VFA 8 300 360 7 940
Measured dissolved TOC 16 700 plusmn 650 6 100 plusmn 220 10 600 Evaporation based on theoretical calculations No standard division is given
The evaporated part of TOC expressed as the difference between wet anddissolved dried sample corresponded to approximately 10 600 mg TOCLHowever the amount of evaporated TOC as VFA (data analysis) was only about8 000 mg TOCL corresponding to about 75 of the evaporated TOC during thedrying (Figure 5 Subsequently this indicates that approximately 25 of theevaporated volatile substances were not detected in the VFA analysis As the TOCmethod only gives value of organic carbon this fraction represents unknownvolatile organic compounds However there are some VFAs that are not detectedin the used VFA analysis such as formic acid (boiling point of asymp101 degC) and lacticacid (boiling point of asymp122 degC) Other common organic compounds that also arevolatile and might be present in different types of substrate mixtures are egmethanol ethanol and acetone However as illustrated in Figure 5 75 of theevaporated volatile organic compounds can be detected in VFA-analysis whichshows that a VFA-compensation method is relevant and could result in areasonable good approximation of the DM and VS values
SGC Rapport 2013273
Svenskt Gastekniskt Center AB Malmouml ndash wwwsgcse 33
Figure 5 Distribution of volatile dissolved TOC within the wet sample before dryingand in the dried sample after oven-drying
Volatility of volatile fatty acids (VFA)34
Substrate S1341
As can be seen in Table 6 the analysis of the degree of evaporation of VFAs from
S1 a pasteurized mixture of an organic material with a very high concentration of
VFAs (gt17 000 mgL) showed a total loss of 95 of VFA in the oven-dried sample
(dissolved dried sample) compared to non-dried sample (wet sample) The highest
concentration of acids in substrate S1 was observed for acetic acid which
corresponded to approximately 47 of the total concentration of VFAs in the
material The lowest concentration was found for iso-hexanoic acid which
contributed to less than 1 of the total concentrations of the VFAs Both these
VFAs present at high and low concentrations as well as other VFAs present in
the sample were lost to an almost equal extent during the drying Consequently
this result indicated that the evaporation of the VFAs was not dependent on the
initial concentration of the individual acids in the substrate S1
50
2
50
34
48
75
1625
0
10
20
30
40
50
60
70
80
90
100
Wet sample Dried sample Evaporated part
Dis
trib
uti
on
of
dis
so
lve
dT
OC
()
Evaporation of unknown TOC Evaporation of TOC as VFA
Other volatile dissolved TOC Dissolved TOC as VFA
SGC Rapport 2013273
34 Svenskt Gastekniskt Center AB Malmouml ndash wwwsgcse
Table 6 The concentration of VFAs in substrate S1 before and after the DM-analysis and the VFA volatility The mean values are presented with a 95confidence interval and the volatility has been calculated according to Equation 7
Volatile fatty acidWet sample
(mgL)Dissolved dried sample
(mgL)Volatility
()
Acetic acid 8 300 plusmn 560 460 plusmn 53 94
Propionic acid 3 100 plusmn 110 94 plusmn 21 97
Butyric acid 1 900 plusmn 230 68 plusmn 17 96
Iso-butyric acid 300 plusmn 20 6 plusmn 5 98
Pentanoic acid 1 300 plusmn 250 46 plusmn 13 96
Iso-pentanoic acid 500 plusmn 20 10 plusmn 5 98
Hexanoic acid 1 700 plusmn 400 77 plusmn 21 96
Iso-hexanoic acid 100 plusmn 6 5 plusmn 3 96
Heptanoic acid 200 plusmn 10 10 plusmn 6 92
Sum VFA (mgL) 17 000 plusmn 570 780 plusmn 140 95
The pH of material S1 was measured prior to the drying and was found to be 52After the drying the pH was found to be 59 This increase in pH indicates that thecomposition of substrate S1 had changed during the drying The increase in pHcould be partly explained by the loss of VFAs but there are many othercompounds in addition to VFA that can have an influence on the pH such as theammoniumammonia system as well as the carbonate system Consequently it islikely that the change in pH is not only due to the evaporation of the VFAs
Substrate S2342
Substrate S2 initially contained 4 300 mg VFAL of which acetic acid was thedominating acid (Table 7) Despite the fact that the substrates S2 and S1 have asimilar origin the VFA concentration was about 4 times higher in S1 compared toS2 The observed volatility of VFA was 99 during the DM analysis of substrateS2 (Table 7) This is a slightly higher volatility compared to sample S1 Moreoveran increase in pH was detected during the DM-analysis for S2 from a pH of 50 to58 in agreement with the observed change in pH for substrate S1
Table 7 The concentrations of VFAs in substrate S2 before and after the DM-analysis and the VFA volatility The mean values are presented with a 95confidence interval and the volatility has been calculated according to Equation 7
Volatile fatty acidWet sample
(mgL)Dissolved dried sample
(mgL)Volatility
()
Acetic acid 2 600 plusmn 0 49 plusmn 11 98
Propionic acid 660 plusmn 10 0 plusmn 0 100
Butyric acid 470 plusmn 21 3 plusmn 1 99
Iso-butyric acid 70 plusmn 3 0 plusmn 0 100
Pentanoic acid 220 plusmn 9 0 plusmn 0 100
Iso-pentanoic acid 100 plusmn 20 0 plusmn 0 100
Hexanoic acid 110 plusmn 16 0 plusmn 0 100
Iso-hexanoic acid 20 plusmn 1 0 plusmn 0 100
Heptanoic acid 30 plusmn 3 0 plusmn 0 100
Sum VFA (mgL) 4300 plusmn 61 52 plusmn 11 99
SGC Rapport 2013273
Svenskt Gastekniskt Center AB Malmouml ndash wwwsgcse 35
Substrate S3343
The silage (substrate S3) had a different origin compared to the substrates S1 andS2 which were pasteurized food and slaughterhouse mixtures The VFA profile ofS3 was shown to be very different from S1 and S2 The substrate S3 containedonly acetic acid (99
Table 8) while the substrates S1 and S2 contained all of the VFAs The total VFAconcentration within the substrate S3 was 6 500 mg VFAL During the DM-analysis of the substrate S3 97 of the VFAs were evaporated (
Table 8) This is in line with the results from samples S1 and S2 but higher thanthe results presented by Porter and Murray (2001) which observed a volatility ofapproximately 89 However in this study the silage was heated at 100degC for 16hours thus another oven-drying method was used compared to the one in thisstudy Analogic to the observed results in the substrates S1 and S2 the pHincreased during the DM-analysis from 41 to 48
Table 8 The concentration of VFA in substrate S3 before and after the DM-analysis and the VFA volatility The mean values are presented with a 95confidence interval and the volatility has been calculated according to Equation 7
Volatile fatty acid Wet sample (mgL)Dissolved driedsample (mgL)
Volatility ()
Acetic acid 6400 plusmn 0 190 plusmn 56 97
Propionic acid 20 plusmn 5 10 plusmn 2 ndash
Butyric acid 16 plusmn 1 0 plusmn 0 100
Iso-butyric acid 0 plusmn 0 0 plusmn 0 ndash
Pentanoic acid 0 plusmn 0 0 plusmn 0 ndash
Iso-pentanoic acid 0 plusmn 0 0 plusmn 0 ndash
Hexanoic acid 23 plusmn 0 0 plusmn 0 100
Iso-hexanoic acid 0 plusmn 0 0 plusmn 0 ndash
Heptanoic acid 0 plusmn 0 0 plusmn 0 ndash
Sum VFA (mgL) 6 400 plusmn 4 190 plusmn 57 97
The uncertainty in the concentration of propionic acid in the silage was very high since the results varied very muchbetween the three independent samples Consequently it would be incorrect to calculate the volatility based upon theseresults
Silage normally contain higher concentrations of lactic acid compared to VFAsalcohols and ammonia-nitrogen The volatility of lactic acid in silage has howeverbeen found to be lower (lt38) than VFAs ammonia and alcohols (Porter ampMurray 2001 Weiszligbach amp Strubelt 2008a) In this study the volatility of lacticacid for S3 was however not analyzed
Substrate S4344
The initial VFA concentration in S4 (3 000 mg VFAL) was lower than the otheranalyzed substrates It was found that almost all of the VFAs were lost during theDM-analysis giving a volatility of 100 when considering the total concentrationof VFA (Table 9) This is in agreement with the observed results for S1 S2 andS3 The pH was increased in S4 during the DM-analysis from pH 46 to 53 inagreement with results obtained for the other analyzed substrates
SGC Rapport 2013273
36 Svenskt Gastekniskt Center AB Malmouml ndash wwwsgcse
Table 9 The concentration of VFA in substrate S4 before and after the DM-analysis and the calculated volatility The mean values are presented with a 95confidence interval and the volatility has been calculated according to Equation 7
Volatile fatty acidWet sample
(mgL)Dissolved dried sample
(mgL)Volatility
()
Acetic acid 940 plusmn 39 0 plusmn 0 100
Propionic acid 890 plusmn 0 4 plusmn 1 100
Butyric acid 640 plusmn 26 0 plusmn 0 100
Iso-butyric acid 10 plusmn 1 0 plusmn 0 100
Pentanoic acid 390 plusmn 24 3 plusmn 1 99
Iso-pentanoic acid 30 plusmn 2 0 plusmn 0 100
Hexanoic acid 63 plusmn 3 1 plusmn 0 98
Iso-hexanoic acid 0 plusmn 0 0 plusmn 0 ndash
Heptanoic acid 5 plusmn 0 0 plusmn 0 100
Sum VFA (mgL) 3 000 plusmn 19 8 plusmn 2 100
Digestate D1345
The concentrations of the analyzed VFAs in the wet and dissolved dried samplesof digestate D1 are summarized in Table 10 The initial total concentration of VFAwas approximately 320 mgL with the highest concentration of acetic acid (~88)among the VFAs A low VFA concentration in the digestate is typically for biogasdigesters with high process efficiency and stability
A higher total concentration of the VFAs was observed after the DM-analysiscompared to the initial concentration (Table 10) It seems unlikely that VFAs havebeen formed during the drying but in cannot be ruled out However due to the lowVFA concentration the uncertainty in the VFA analysis is quite high Consequentlythere might not be a difference in the VFA concentrations between the wet anddissolved dried samples but merely an effect of the uncertainty in themethodology This result is expected since the pH in the sample was 79 and wasincreased to 94 during the drying Both pH are however higher than the pKa forthe VFAs
Table 10 The concentration of VFA in digestate D1 before and after DM-analysisand VFA volatility The mean values are presented with a 95 confidence intervaland the volatility has been calculated according to Equation 7
Volatile fatty acidWet sample
(mgL)Dissolved dried sample
(mgL)Volatility
()
Acetic acid 280 plusmn 14 300 plusmn 18 0
Propionic acid 13 plusmn 2 25 plusmn 2 0
Butyric acid 7 plusmn 0 11 plusmn 1 0
Iso-butyric acid 4 plusmn 0 5 plusmn 0 0
Pentanoic acid 0 plusmn 0 4 plusmn 1 0
Iso-pentanoic acid 8 plusmn 1 7 plusmn 1 13
Hexanoic acid 3 plusmn 3 7 plusmn 1 0
Iso-hexanoic acid 0 plusmn 0 2 plusmn 0 0
Heptanoic acid 0 plusmn 0 7 plusmn 1 0
Sum VFA (mgL) 320 plusmn 13 370 plusmn 18 0
SGC Rapport 2013273
Svenskt Gastekniskt Center AB Malmouml ndash wwwsgcse 37
Digestate D2346
The initial sample of the digestate D2 contained mainly acetic acid whichcorresponded to approximately 88 of the total VFA concentration (Table 11) Theconcentrations of the rest of the VFAs ie propionic acid butyric acid iso-butyricacid pentanoic acid iso-pentanoic acid hexanoic acid iso-hexanoic acid andheptanoic acid were very low Consequently the uncertainties of theconcentrations of these acids were high as for sample D1 However as theconcentrations of those acids were low they will thus not have a large impact onthe final result The pH of the initial sample of D2 was found to be 79 Despite thefact that D1 and D2 had similar VFA profile and the same initial pH a difference inthe volatility was observed The volatility of the VFAs in D2 considering the totalconcentrations of VFAs was calculated to be 18 This volatility was highercompared to the VFA volatility for D1 (0) A volatility of 18 is howevernegligible when considering errors in the DM and VS values as the initialconcentration of VFA was low During the drying the pH was increased to 82
Table 11 The concentrations of VFAs in the digestate (D2) before and after theDM-analysis and the VFA volatility The mean values are presented with a 95confidence interval and the volatility has been calculated according to Equation 7
Volatile fatty acidWet sample
(mgL)Dissolved dried sample
(mgL)Volatility
()
Acetic acid 400 plusmn 28 310 plusmn 29 23
Propionic acid 26 plusmn 4 24 plusmn 4 8
Butyric acid 9 plusmn 2 9 plusmn 1 0
Iso-butyric acid 7 plusmn 1 5 plusmn 1 29
Pentanoic acid 0 plusmn 0 3 plusmn 0 0
Iso-pentanoic acid 8 plusmn 1 4 plusmn 3 50
Hexanoic acid 3 plusmn 3 6 plusmn 1 0
Iso-hexanoic acid 0 plusmn 0 1 plusmn 1 0
Heptanoic acid 0 plusmn 0 4 plusmn 4 0
Sum VFA (mgL) 450 plusmn 33 370 plusmn 37 18
Digestate D3347
Digestate D3 was withdrawn from a biogas reactor suffering from accumulation ofVFA indicating that the biogas process was suffering from in imbalance (Ahring etal 1995) The total concentration of VFAs was much higher in the D3 sample(7 700 mgL Table 12) compared to D1 (320 mgL) and D2 (460 mgL) Moreovereven in spite of high concentration of VFA the pH was due to high bufferingcapacity (data not shown) high (pH 8) During the drying the pH was decreaseddown to 63
The overall VFA volatility for D3 was calculated to be approximately 55 (Table12) which is higher compared to the VFA volatility for D1 (0) and D2 (20)Consequently the highest VFA volatility was observed for the digestate with thehighest initial concentration of VFAs Even though the initial pH (80) in D3 washigh 55 of the VFAs were still lost during the drying However the pH within thedried sample was 63 which theoretical would give increased evaporation andthereby supports the results achieved in D3 compared to D1 and D2 Why the pHwas decreased in not obvious however a theory is that ammonium is evaporated
SGC Rapport 2013273
38 Svenskt Gastekniskt Center AB Malmouml ndash wwwsgcse
before the VFAs If that is the case loss of ammonium (through ammonia) willresult in decreasing pH in the sample during the drying and thereby increasing theVFA volatility
All in all the results from the three digestates shown that the volatility is bothdepending of the initial pH the pH after drying and the buffer capacity of thesample A generalization of the volatility of different digestates is therefore difficultto achieve without doing the same measurements for each individual digestates asin the present study
Table 12 The concentrations of VFAs in digestate D3 before and after DM-analysis and VFA volatility The mean values are presented with a 95 confidenceinterval and the volatility has been calculated according to Equation 7
Volatile fatty acidWet sample
(mgL)Dissolved dried sample
(mgL)Volatility
()
Acetic acid 6 500 plusmn 170 2 900 plusmn 120 55
Propionic acid 370 plusmn 3 210 plusmn 4 43
Butyric acid 60 plusmn 2 77 plusmn 1 0
Iso-butyric acid 300 plusmn 120 90 plusmn 3 70
Pentanoic acid 6 plusmn 1 31 plusmn 1 0
Iso-pentanoic acid 400 plusmn 21 100 plusmn 6 75
Hexanoic acid 5 plusmn 2 40 plusmn 2 0
Iso-hexanoic acid 18 plusmn 0 8 plusmn 0 56
Heptanoic acid 0 plusmn 0 6 plusmn 0 0
Sum VFA (mgL) 7 700 plusmn 200 3 500 plusmn 120 55
Errors in process parameters due to VFA evaporation35
The evaporation of VFAs during the DM-analysis of the different analyzed sampleswas shown to be significant The volatility of the VFA in substrates was between95-100 (Table 13) which clearly highlights the problem with the evaporationThe results from the analysis of the evaporation of VFAs of the digestate sampleswere more difficult to interpret as the results varied from 0-55 evaporation
Since calculations of central process parameters are based upon the DM andVS content it is essential that they are correct By knowing the volatility of the VFAcompensation can be made and more correct DM and VS values can becalculated Calculated compensated DM (from hereby called DMcomp) and VS(from hereby called VScomp) values are presented in Table 13 This table alsoincludes calculations of the errors in DM (DMerror) and VS (VSerror) ie errorsdepending on the DM VS VFA concentration and the volatility of the VFA TheDMerror which is the relative difference between DM and DMcomp varied betweenapproximately 3-23 and the VSerror varied between 3-31 for the analyzedsubstrates The evaporation of other volatile organic molecules than VFA is notincluded since only VFA was measured The error in DM and VS may therefore beeven higher
The DMerror and VSerror were shown to be of minor importance for the digestatesD1 and D2 which contained low concentrations of VFAs However the DMerror andVSerror were for the digestate S3 was approximately 10 and 14 respectively
SGC Rapport 2013273
Svenskt Gastekniskt Center AB Malmouml ndash wwwsgcse 39
Table 13 Calculated DMcomp and VScomp values after compensation for the VFAevaporation The errors in the DM and VS values are also shown
SampleVFA(gL)
DM()
VS( of DM)
VFAvol
()DMcomp
()VScomp
( of DM)DMerror
()VSerror
()
S1 17 72 75 95 89 80 23 31
S2 43 14 91 99 14 92 3 3
S3 65 23 91 97 24 91 3 3
S4 30 36 99 100 39 99 8 8
D1 03 34 56 0 34 56 0 0
D2 05 47 73 18 47 73 0 0
D3 77 4 77 54 44 79 10 14
Calculations of the OLR using VS (not corrected) of the four different substrates(S1ndashS4) showed 3ndash31 higher value compared to calculations using thecompensated VS content (Figure 4 Table 12) Substrates S1 and S2 originatedfrom two different plants with pasteurization and the origin of the ingoing materialsdigested are relatively similar However the error in OLR is only 3 for substrateS2 but as high as 31 for substrate S1 (Figure 6 Table 13) This clearly showsthat is not possible to generalize the error for a substrate mixture without actuallyknowing the VFA concentration It is therefore important to continuously analyzeVFA within the substrate mixture to be able to calculate a correct OLR A constantOLR over time increases the process stability and that might be hard to achievewithout compensating the DM and VS values for the VFA evaporation particularlyif the VFA levels in the substrate are varying a lot
Figure 6 The relative error in the VFA compensated values of DM (DMcomp) andVS (VScomp) compared to the measured DM and VS values
Calculation of specific biogas production with non-corrected VS values will resultsin the same relative error as the OLR calculation This can be exemplified byassuming the ldquotruerdquo specific gas production for S1 and S2 (eg 070 Nm3kg VS)Without compensating for the VFA evaporation the specific biogas production will
0
5
10
15
20
25
30
35
S1 S2 S3 S4 D1 D2 D3
Re
lati
ve
err
or
()
DM error () VS error ()
SGC Rapport 2013273
40 Svenskt Gastekniskt Center AB Malmouml ndash wwwsgcse
be 092 Nm3kg VS and 072 Nm3kg VS for S1 and S2 respectively This meansthat one would assume that the substrate S1 had 28 higher biogas potential thansubstrate S2 which is incorrect The error (VSerror) caused by the VFA evaporationwithin the substrate will result in false-high specific biogas production and couldthereby lead to incorrect judgment concerning the economic value of a specificsubstrates for a biogas plant
Using different VS values and calculating the degree of degradation illustratesthat the error might even be higher than the errors in the parameters OLR andspecific gas production This is caused by the fact that both the DM and VS of theinlet substrate as well as the DM and VS of the digestate are used in thiscalculation In a scenario when a substrate with a high concentration of VFA isdigested thus giving a risk that VFA also is being accumulated in the digester thecalculation may results in a ldquodoublerdquo false value This can be exemplified byassuming a hypothetical biogas plant where substrate S1 is fed into the digesterand D3 is the outlet digestate With a compensation of the VFA evaporation in themeasurement in the substrate as well as in the digestate the degree ofdegradation will be 51 When doing the same calculation but with a VFAcompensation for the VS content of the substrate only and not for the digestate afalse-high value of 56 is obtained Without any VFA compensation at all thedegree of the degradation will on the contrary have a false-low value of 43
All in all it is of great importance to take the error in the DM and VS intoconsideration when performing calculation of organic loading rate specific biogasproduction as well as the degree of degradation However the error may benegligible for some substrates and biogas plants (eg digestion of substrate S2 orS4) but essential for other plants with high VFA content in the substrate (egdigestion of S1 or S3)
Evaporation of ammonium during the dry-matter analysis36
The main focus of the present project was to evaluate the evaporation of VFAsduring the DM-analysis using oven-drying However both the substrates anddigestates also contain inorganic molecules such as ammonium and ammoniawhich can affect the DM results The total concentration of ammonium (NH4-N)was analyzed in the samples before and after the DM-analysis and the observedresults are presented in Table 14 and in Figure 7 It should be notified that thepresented values include both the concentration of ammonium in the NH4-N stateas well as the NH3-N state but will hereafter just be called NH4-N
A common value of ammonium concentration in the digestate from a co-digestion plant is approximately 3 g NH4-Nkg exemplified by the samples D1 andD2 (Table 14) Ammonium and ammonia is in equilibrium with each other with anincreasing fraction being ammonia with increasing pH and temperature In amesophilic process (~37 degC) about 10 of the total ammonium fraction is in theammonia state However in the oven-drying the temperature rises to 105degC andwill more or less dislocate the equilibrium to ammonia (boiling point -33degC) whichis highly volatile By using the formula given by (Hansen et al 1998) and a typicalpH of a digestate 75 the oven-drying at 105oC will result in 61 of the total NH4-N being in the NH3-N state Thus more or less all ammonium and ammonia canbe expected to be evaporated in the case of a digestate However in a substrateless than 1 of the ammonium is expected to be in NH3-N state due to a lower pH(typically 4-5)
SGC Rapport 2013273
Svenskt Gastekniskt Center AB Malmouml ndash wwwsgcse 41
Table 14 The concentration of ammonium (NH4-N) in wet and dissolved driedsamples of the substrates S1-S4 and digestates D1 and D2 The mean values arepresented with a 95 confidence interval and the volatility has been calculated bythe same principle as the volatility of the VFAs (Equation 7)
SampleWet sample
(mg NH4-NL)Dissolved dried sample
(mg NH4-NL)Volatility
()
S1 1 400 plusmn 39 27 plusmn 3 98
S2 510 plusmn 140 10 plusmn 6 98
S3 450 plusmn 210 390 plusmn 48 13
S4 48 plusmn 5 3 plusmn 1 94
D1 2 900 plusmn 120 4 plusmn 1 100
D2 2 800 plusmn 65 49 plusmn 9 98
The analysis showed the highest concentrations of NH4-N for D1 (~29 gNH4-Nkg) and D2 (~28 g NH4-Nkg) Both digestate D1 and D2 had a pH of 79 inthe wet samples The tested substrates contained between 005 to 14 g NH4-Nkgand the pH varied from 41 to 52 It was thus observed that the pH was highlycorrelated with the NH4-N concentration with a linear correlation of 96 Thisshowed that samples with high levels of ammonium had a higher pH thansubstrates with low NH4-N concentrations In spite of the variation in pH thevolatility of ammonium was shown to be ge94 in S1 S2 S4 D1 and D2 The results also indicated that the ammonium volatility was lower in S3 (~13)compared to the other materials In a previous published study by Porter andMurray (2001) the volatility of ammonia was found to be gt97 in grass silage thatwas heated It seems unlikely that there would be such a large difference in thevolatility of ammonium in the grass silage included in this study compared to thestudy published by Porter and Murray (2001)The silage was more complicated toanalyze since the DM was much higher than the other analyzed materials and theS3 had to be mixed with water prior to the analysis of the wet (initial) ammoniumconcentration It is possible that not all of the ammonium was detected in the wetsample The uncertainty was also very high in the measurements of the wetsample of S3 (Table 14) which is an indication of an inhomogeneity with respectto the ammonium concentration
SGC Rapport 2013273
42 Svenskt Gastekniskt Center AB Malmouml ndash wwwsgcse
Figure 7 Volatility of ammonium within the different samples complied with the pHand ammonium concentration of the wet samples (before drying)
The volatility of VFA ndash a summary of the observed results37
As discussed previously the VFA volatility was higher than 95 in all foursubstrates (Figure 8) The volatility was lower for all the three digestates comparedto the four substrates and there were a significant difference between thedigestates being approximately 0 18 and 55 for D1 D2 and D3 respectivelyFor the digestate samples the highest volatility of the VFAs was found for thedigestate with the highest total VFA concentration However it should be noticedthat for materials with very low concentrations of VFAs such as the digestate D1and D2 the uncertainty in the analyzed VFA concentrations was large
0
1
2
3
4
5
6
7
8
9
0
20
40
60
80
100
S1 S2 S3 S4 D1 D2
pH
inw
et
sa
mp
leA
mm
on
ium
co
nc
en
tra
tio
n(g
NH
4-N
kg
)
Vo
lati
lity
()
Volatility Ammonium pH
SGC Rapport 2013273
Svenskt Gastekniskt Center AB Malmouml ndash wwwsgcse 43
Figure 8 The volatility of VFA the pH and the total concentration of VFAs in thefour analyzed substrates and the three investigated digestates
When comparing the volatility of VFAs of substrates and digestates it is clear thatpH is an important parameter The volatility was much higher for the substrateswith low pH than the digestate that had a much higher pH The importance of pHfor the degree of evaporation was also shown in the experiments performed toverify that it was possible to detect a majority of the VFAs in dissolved driedsamples diluted in MilliQ water (Chapter 32) The volatility was 95 in sample S1with a pH of 52 and 2 when the pH had been increased to above 11 The sametrend was observed for S2 sample for which the volatility was 99 (pH 50)compared to 19 when the pH was above 11 Consequently these resultsshowed that the evaporation of VFAs can be minimized by modifying the pHNegatively charged VFAs might interact with positively charged molecules orsubstances within the material and the evaporation of the VFAs is consequentlyminimized
The substrates used for biogas production are highly complex and diverse at amolecular level Consequently even when comparing similar types of substratesoriginating from different full scale plants these materials will be different at themolecular level It is thus likely that different reactions and composition changeswill occur within different materials during the drying process and this might in turnhave an impact of the evaporation of the volatile compounds This was forexample observed in this project as the pH of the analyzed materials changeddifferently in different samples during the oven DM-analysis Consequently theevaporation of volatile molecules from a sample might influence the volatility of themolecules still in the sample It is difficult to clearly reveal what chemical propertyof the materials or what environmental factor that will have the most effect on theevaporation of VFA and ammonia
0
2
4
6
8
10
12
14
0
10
20
30
40
50
60
70
80
90
100
S1 S2 S3 S4 D1 D2 D3
We
tp
Ho
fs
am
ple
VF
AV
ola
tili
ty(
)W
et
VF
Ac
on
ce
ntr
ati
on
(gL
)
Sample
Volatility VFA concentration pH
SGC Rapport 2013273
44 Svenskt Gastekniskt Center AB Malmouml ndash wwwsgcse
Methods to compensate DM for VFA evaporation biogas substrates38
For someone in the business of biogas production that would like to adopt thefindings in this study two methods for compensation are suggested whenanalyzing DM with oven-drying
As stated earlier the impact of the discrepancy in the analysis is dependent onthe characteristics of the materials analyzed For materials typically substratesstreams with a low pH (lt52) there is probably a high risk that the majority of theVFA is lost during the oven DM-analysis This might be a large problem when theanalyzed material has a high concentration of VFAs in relation to the DM as theerror in VS-weight in this case would be very large Therefore there are no quickfix of this problem and no general rules to adopt for all types of materials
An original thought was to prove a method decreasing evaporation of VFA byadding NaOH and thus increase the pH The VFAs would then be fixed in thesample and by considering the amount of added NaOH contributing to DM and itwould then be possible to obtain a correct DM and VS value This method wouldbe relatively easy to adopt for operators at a biogas plant or in a laboratoryHowever even if the VFAs could be fixed into the samples during the DM-analysis the addition of NaOH caused false-high DM values probably due toother chemical reactions within the sample Modification of pH by adding NaOH tominimize the evaporation of VFAs has also been investigated by (Nordberg et al2010) which observed a lower experimental DM value than expected for artificialsubstrates
Therefore the suggested methods for correction DM are more complicated andinclude more analysis of the material of interest than expected and hoped forbefore performing this study As other volatile molecules besides VFA might bepresent in the materials these should also be compensated for to obtain exact DMand VS values More accurate DM and VS values are however obtained by usingthe suggested method to compensate for the VFA loss than without compensationFor substrates with low pH both methods can be applied Since the variation inresults for evaporation of VFA in the digestate only method 2 should be appliedThe suggested methods give different accuracy of the DMcomp
SGC Rapport 2013273
Svenskt Gastekniskt Center AB Malmouml ndash wwwsgcse 45
Method 1 - Rough estimation method381
Method 1 for estimation of DMcomp and VScomp is suggested for substrates with lowpH (pH le 52) and when a rough estimate is sufficient Analyzes of pH and VFA (as a sum of organic acids or as VFA) are performed on the material (substratedigestate or mixtures of materials)
1)Measure DM (DMm) and VS (VSm) according to the Swedish Standard method SS02 81 13 (SIS 1981) DM determination in oven for 20 hours at 105oC and VSdetermination of the dried sample for 2 hours at 550oC
2)Analyze the concentrations of VFAs in the original sample (VFAm) This could bedone by analyzing the individual VFA and sum them up or by using a quickmethod that gives the sum directly The unit of the result used should beldquomg VFALrdquo
3)Assume a value for the volatility of VFAs in your substrate preferably VFAvol =98 (see results and discussion for volatility in different types of substrates)Calculate the compensated DMcomp weight by
ܯܦ ሺΨሻൌ ܯܦ () ቌቀ ௩௧௧௬ܣܨ ()ቁ
100ܣܨכ (Ȁܮ) lowast 10ସቍ
4)Calculate VScomp ( of DMcomp) by
൫Ψ ܯܦ ൯ൌ
൫ܯܦ () כ ()൯ ቀͳͲସ ௩௧௧௬ܣܨכ () ܣܨכ (Ȁܮ)ቁ
ܯܦ ()
SGC Rapport 2013273
46 Svenskt Gastekniskt Center AB Malmouml ndash wwwsgcse
Method 2 - Detailed estimation method382
This method should be used to compensate for the evaporation of VFAs in thosecases where it is important to have a very good estimation of the DM content in aspecific substrate or substrate mixture For digestates this method only can beused
1)Analyze the concentrations of VFAs in the original sample (VFAm) This could bedone by analyzing the individual VFA and sum them up or by using a quickmethod that gives the sum directly The unit of the result used should beldquomg VFALrdquo
2)Measure DM (DMm) and VS (VSm) according to the Swedish Standard methodSS 02 81 13 (SIS 1981) DM determination in oven for 20 hours at 105oC and VSdetermination of the dried sample for 2 hours at 550oC
3)Add MilliQ water to the beaker containing the dried material The added amount ofMilliQ water (mwater) should be adjusted so that the weight of the material isapproximately the same as before the drying Consequently if 8 grams ofmaterials were inserted in the oven then the weight of the dried materialsdissolved in MilliQ water (mwater) should be about 8 grams The water shouldhowever cover the dried material so if eg a lot of material is fixed on the wall ofthe beaker it might be necessarily to add more water
a) Notice the weight of the dried sample (msampledried)b) Let the beaker with the dried material and the added MilliQ water stand for 30
minutes Then stir the solution for 10 minutesc) Analyze the concentration of VFAs in the dissolved dried material
(VFAdrieddissolved)d) Calculate the concentrations of VFAs in the dried material before dissolved in
MilliQ water (VFAdried)
(ܮȀ)ௗௗܣܨ ൌ ൬כௗ௦௦௩ௗǡௗௗܣܨ൫ ೞ ǡା ൯
ೞ ǡ ൰
4)Calculate the actually volatility () of the VFAs in the sample
()௩௧௧௬ܣܨ ൌ ቆͳെிቀ
ಽቁ
ி ቀ
ಽቁቇכͳͲͲ
5)Calculate the compensated DMcomp weight by
ܯܦ ሺΨሻൌ ܯܦ () ቆ௩௧௧௬ܣܨ ()
100כ ܣܨ ( fraslܮ ) lowast 10ସቇ
SGC Rapport 2013273
Svenskt Gastekniskt Center AB Malmouml ndash wwwsgcse 47
6)Calculate VScomp ( of DMcomp) by
൫ ܯܦ ൯=
൫ܯܦ () lowast ()൯+ ቀ10ସ lowast ௩௧௧௬ܣܨ () lowast ܣܨ ቁ(ܮ)
ܯܦ ()
SGC Rapport 2013273
48 Svenskt Gastekniskt Center AB Malmouml ndash wwwsgcse
4 Conclusions
In this study the evaporation of VFAs and ammonia from different substrates anddigestates during DM-analysis using oven-drying were investigated The resultsshowed that the evaporation of VFAs during the DM-analysis using oven-dryingcould be a major problem for substrates with a relatively high concentration of VFAin relation to the DM content Four distinct biogas substrates (3-17 g VFAL) allwith low pH were evaluated with the respect to VFA evaporation The loss of VFAduring the DM-analysis in oven (20 hours 105oC) was concluded to be 95-100for the four substrates The errors caused by evaporation of VFAs during the DM-analysis may result in a false-high specific biogas production and a false-loworganic loading rate In the present study the measurement errors were in therange of 3-31 for the analyzed substrates Three different types of digestateswere also evaluated (03-77 g VFAL) all with high pH with the respect to VFAevaporation The evaporation of VFA varied between 0-50 in the digestates Thedifference between the substrates and digestates indicated that the pH and buffercapacity of the samples were important factors
Moreover a comparison between the concentrations of VFA and the amount ofdissolved organic carbon (TOC) for a reference substrate indicated that themajority of the volatile organic material that was lost during the DM-analysis wasVFA Based on the obtained results two different methods (with differentaccuracy) to compensate the DM and VS in biogas substrates with low pH anddigestates were suggested Furthermore it was also shown that also ammoniumevaporated from substrates and digestates during the oven-drying This might beof importance for digested materials where the concentration of ammonium oftenis high The evaporation of ammonium should be investigated further to be able tocompensate for the loss of this volatile molecule
All in all the results from the present study showed that it is of greatestimportance to compensate DM and VS for the VFA evaporation that occurs duringDM-analysis by oven-drying By applying one of the methods suggested in thisreport more reliable values of specific biogas production and potential organicloading rates could be expected in both full scale and laboratory scale conditions
SGC Rapport 2013273
Svenskt Gastekniskt Center AB Malmouml ndash wwwsgcse 49
5 Acknowledgements
The authors would like to thank NSR Swedish Biogas International SvenskBiogas i Linkoumlping AB and Stockholm Vatten for providing us with samples ofsubstrates and digestates during the experiments The authors would like to thankKatarina Stensen (Tekniska verken FoU Biogas) who performed the pre-studyand gave value input on the written report Thanks to Daniel Hellstroumlm (SvensktVatten Utveckling) and Andreas Carlsson (Stockholm Vatten) and Angelica Blom(Avfall Sverige) for their great input and review of the the written report JanMoestedt and Soumlren Nilsson Paringledal (Tekniska verken R amp D Biogas) for valuablediscussions of the lab results The authors would like to give thanks to Irene Bohn(NSR) Catarina Jonasson (EON) and Tobias Persson (SGC) for sharing theirknowledge and engagement during the reference meetings Finally the authorswould like to thank Yasna Calderon (Tekniska verken RampD Biogas) HelenWolrath (Tekniska verken Water Laboratory) and Karin Eden (Tekniska verkenWater Laboratory) for the assistance during the analysis and for valuable input tothe project
Finally and again thanks to all of the financiers to the project Tekniska verken iLinkoumlping AB Swedish University of Agricultural Sciences Swedish WasteManagement Goumlteborg Energi AB Svenskt Vatten Utveckling Stockholm GasAB ALcontrol AB EON Sverige AB NSR AB and SGC through the SwedishEnergy Agency
SGC Rapport 2013273
50 Svenskt Gastekniskt Center AB Malmouml ndash wwwsgcse
6 Literature
Ahring BK Sandberg M Angelidaki I 1995 Volatile Fatty-Acids as Indicatorsof Process Imbalance in Anaerobic Digesters Applied Microbiology andBiotechnology 43(3) 559-565
Carlsson M Uldal M 2009 Substrathandbok foumlr biogasproduktion (English titleSubstrate manual for biogas production) Svenskt Gastekniskt CenterISRN SGC-R-200-SE
De Caro CA Aichert A Walter CM 2001 Efficient precise and fast waterdetermination by the Karl Fischer titration Food Control 12(7) 431-436
Derikx PJL Willers HC ten Have PJW 1994 Effect of pH on the behaviourof volatile compounds in organic manures during dry-matter determinationBioresour Technol 49(1) 41-45
Ebbing DD 1993 General Chemistry Fourth Edition Houghton Mifflin CompanyBoston MA USA
Ek A Hallin S Vallin L Schnuumlrer A Karlsson M 2011 Slaughterhousewaste co-digestion - Experiences from 15 years of full-scale operationWorld Renewable Energy Congress ndash Sweden 8ndash13 May 2011Linkoumlping Sweden
Ganidi N Tyrrel S Cartmell E 2009 Anaerobic digestion foaming causes ndash Areview Bioresour Technol 100(23) 5546-5554
Gerardi MH 2003 The Microbiology of Anaerobic Digesters John wiley amp SonsInc United States of America
Hansen KH Angelidaki I Ahring BK 1998 Anaerobic digestion of swinemanure Inhibition by ammonia Water Research 32(1) 5-12
Isengard HD Walter M 1998 Can the water content of dairy products bedetermined accurately by microwave drying Zeitschrift Fur Lebensmittel-Untersuchung Und-Forschung a-Food Research and Technology 207(5)377-380
Jonsson S Boreacuten H 2002 Analysis of mono- and diesters of o-phthalic acid bysolid-phase extractions with polystyrene-divinylbenzene-based polymersJournal of Chromatography A 963(1-2) 393-400
Kreuger E Nges IA Bjoumlrnsson L 2011 Ensiling of crops for biogas productionndash effects on methane yield and total solids determination BiotechnolBiofuels
Larsen RE Jones GM 1973 Effects on different dry matter determinationmethods on chemical composition and in vitro digestibility of silage Can JAnim Sci 53 753-760
Lomborg CJ Holm-Nielsen JB Oleskowicz-Popiel P Esbensen KH 2009Near infrared and acoustic chemometrics monitoring of volatile fatty acidsand dry matter during co-digestion of manure and maize silage BioresourTechnol 100(5) 1711-1719
MacLeod SΚ 1991 Moisture Determination Using Karl Fischer Τitrations AnalChem 63 (10) pp 557Andash566A(10) 557A-566A
Madsen M Holm-Nielsen JB Esbensen KH 2011 Monitoring of anaerobicdigestion processes A review prespective Renewable and SustainableEnergy Reviews 15 3141-3155
SGC Rapport 2013273
Svenskt Gastekniskt Center AB Malmouml ndash wwwsgcse 51
Marquez MF Garcia B Ruiz V Ruizlopez MAD 1995 DETERMINATIONOF TOTAL SOLIDS IN DAIRY-PRODUCTS USING THE MICROWAVE-OVEN METHOD International Journal of Food Science and Technology30(3) 307-310
Nicolaiumla BM Beullensa K Bobelyna E Peirsa A Saeysa W Theronb KILammertyna J 2007 Nondestructive measurement of fruit and vegetablequality by means of NIR spectroscopy A review Postharvest Biology andTechnology 46(2) 99-118
Nordberg Aring Hansson M Kanerot M Krozer A Loumlfving B Sahlin E 2010Robusta maumlttekniker on-line foumlr
optimerad biogasproduktion WASTE REFINERY ISSN 1654-4706Nordell E Bohn I Karlsson M Moestedt J Wiberg L 2013 Improved
process stability and increased biogas production rate by addition of ironhydrochloric acid and trace elements Biomass amp BioenergySubmitted(Submitted)
Porter MG Murray RS 2001 The volatility of components of grass silage onoven drying and the inter-relationship between dry-matter content estimatedby different analytical methods Grass and Forage Science 56(4) 405-411
Reh CT Gerber A 2003 Total solids determination in dairy products bymicrowave oven technique Food Chemistry 82(1) 125-131
Samuelsson R Burvall J Jirjis R 2006 Comparison of different methods forthe determination of moisture content in biomass Biomass and Bioenergy30(11) 929-934
SIS 1981 Vattenundersoumlkningar - Bestaumlmning av torrsubstans ochgloumldgningsrest i vatten slam och sediment Vol SS 02 81 13 pp 1-3
SP 2010 SPCR 120 Certifieringsregler foumlr Biogoumldsel Vol SPCR 120 SPSveriges Tekniska Forskningsinstitut Borarings
Tafdrup S 1995 Viable energy production and waste recycling from anaerobicdigestion of manure and other biomass materials Biomass amp Bioenergy 9303-314
Ward AJ Hobbs PJ Holliman PJ Jones DL 2008 Optimisation of theanaerobic digestion of agricultural resources Bioresource Technology99(17) 7928-7940
Weiszligbach F Strubelt C 2008a Correcting the Dry Matter Content of MaizeSilages as a Substrate for Biogas Production Landtechnik 2 82-83
Weiszligbach F Strubelt C 2008b Correction of Dry Matter Content in Sugar BeetSilage as a Substrate for Biogas Production Landtechnik 63(6) 354-355
wwwsigmaaldrichcom
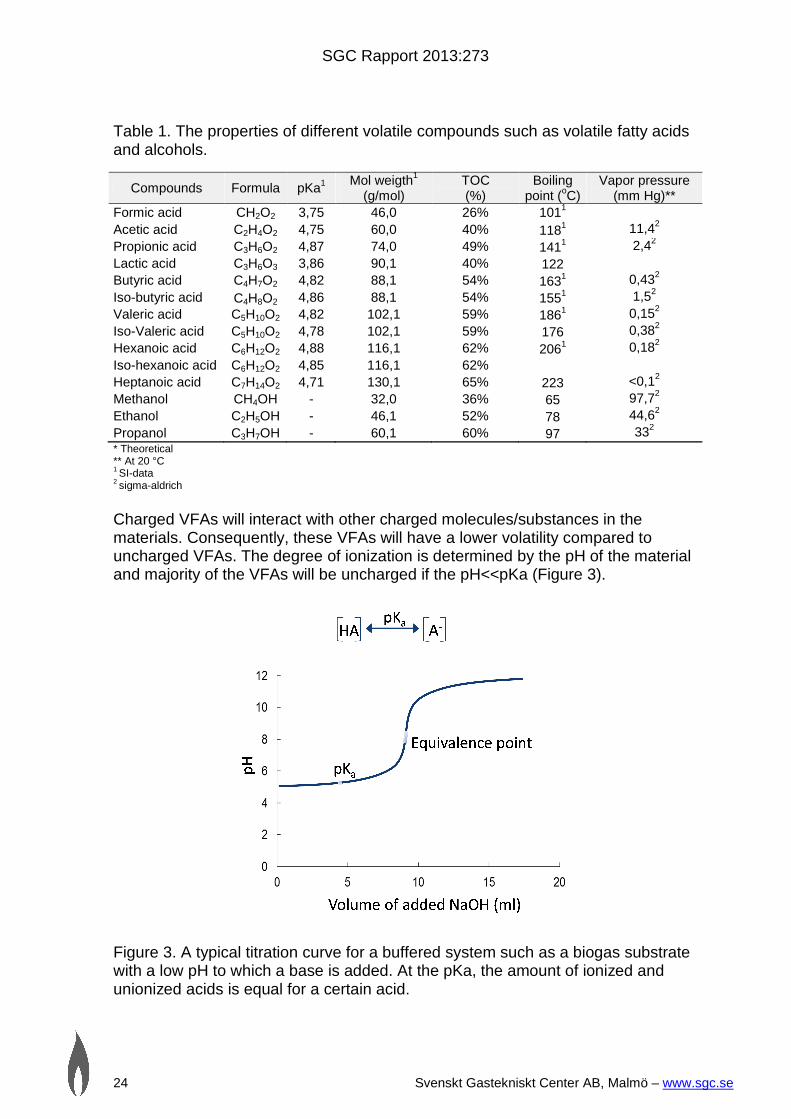
SGC Rapport 2013273
32 Svenskt Gastekniskt Center AB Malmouml ndash wwwsgcse
100 mgL while the VFA level decreased from approximately 17 000 mgL to 780mgL (Table 5) The concentration of VFAs in the wet sample correspondedtheoretically to about 8 300 mg TOCL whereas the concentration of VFA in thedissolved dried sample corresponded to approximately 360 mg TOCL It shouldbe notified that since the theoretical value of TOC in each VFA differ calculationsof each individual VFA were performed for these calculated TOC values
Table 5 VFA and TOC within the wet and dissolved dried samples
ParameterWet sample
(mgL)Dissolved dried sample
(mgL)Evaporation
(mgL)
VFA 17 000 plusmn 570 780 plusmn 140 16 220
Calculated TOC as VFA 8 300 360 7 940
Measured dissolved TOC 16 700 plusmn 650 6 100 plusmn 220 10 600 Evaporation based on theoretical calculations No standard division is given
The evaporated part of TOC expressed as the difference between wet anddissolved dried sample corresponded to approximately 10 600 mg TOCLHowever the amount of evaporated TOC as VFA (data analysis) was only about8 000 mg TOCL corresponding to about 75 of the evaporated TOC during thedrying (Figure 5 Subsequently this indicates that approximately 25 of theevaporated volatile substances were not detected in the VFA analysis As the TOCmethod only gives value of organic carbon this fraction represents unknownvolatile organic compounds However there are some VFAs that are not detectedin the used VFA analysis such as formic acid (boiling point of asymp101 degC) and lacticacid (boiling point of asymp122 degC) Other common organic compounds that also arevolatile and might be present in different types of substrate mixtures are egmethanol ethanol and acetone However as illustrated in Figure 5 75 of theevaporated volatile organic compounds can be detected in VFA-analysis whichshows that a VFA-compensation method is relevant and could result in areasonable good approximation of the DM and VS values
SGC Rapport 2013273
Svenskt Gastekniskt Center AB Malmouml ndash wwwsgcse 33
Figure 5 Distribution of volatile dissolved TOC within the wet sample before dryingand in the dried sample after oven-drying
Volatility of volatile fatty acids (VFA)34
Substrate S1341
As can be seen in Table 6 the analysis of the degree of evaporation of VFAs from
S1 a pasteurized mixture of an organic material with a very high concentration of
VFAs (gt17 000 mgL) showed a total loss of 95 of VFA in the oven-dried sample
(dissolved dried sample) compared to non-dried sample (wet sample) The highest
concentration of acids in substrate S1 was observed for acetic acid which
corresponded to approximately 47 of the total concentration of VFAs in the
material The lowest concentration was found for iso-hexanoic acid which
contributed to less than 1 of the total concentrations of the VFAs Both these
VFAs present at high and low concentrations as well as other VFAs present in
the sample were lost to an almost equal extent during the drying Consequently
this result indicated that the evaporation of the VFAs was not dependent on the
initial concentration of the individual acids in the substrate S1
50
2
50
34
48
75
1625
0
10
20
30
40
50
60
70
80
90
100
Wet sample Dried sample Evaporated part
Dis
trib
uti
on
of
dis
so
lve
dT
OC
()
Evaporation of unknown TOC Evaporation of TOC as VFA
Other volatile dissolved TOC Dissolved TOC as VFA
SGC Rapport 2013273
34 Svenskt Gastekniskt Center AB Malmouml ndash wwwsgcse
Table 6 The concentration of VFAs in substrate S1 before and after the DM-analysis and the VFA volatility The mean values are presented with a 95confidence interval and the volatility has been calculated according to Equation 7
Volatile fatty acidWet sample
(mgL)Dissolved dried sample
(mgL)Volatility
()
Acetic acid 8 300 plusmn 560 460 plusmn 53 94
Propionic acid 3 100 plusmn 110 94 plusmn 21 97
Butyric acid 1 900 plusmn 230 68 plusmn 17 96
Iso-butyric acid 300 plusmn 20 6 plusmn 5 98
Pentanoic acid 1 300 plusmn 250 46 plusmn 13 96
Iso-pentanoic acid 500 plusmn 20 10 plusmn 5 98
Hexanoic acid 1 700 plusmn 400 77 plusmn 21 96
Iso-hexanoic acid 100 plusmn 6 5 plusmn 3 96
Heptanoic acid 200 plusmn 10 10 plusmn 6 92
Sum VFA (mgL) 17 000 plusmn 570 780 plusmn 140 95
The pH of material S1 was measured prior to the drying and was found to be 52After the drying the pH was found to be 59 This increase in pH indicates that thecomposition of substrate S1 had changed during the drying The increase in pHcould be partly explained by the loss of VFAs but there are many othercompounds in addition to VFA that can have an influence on the pH such as theammoniumammonia system as well as the carbonate system Consequently it islikely that the change in pH is not only due to the evaporation of the VFAs
Substrate S2342
Substrate S2 initially contained 4 300 mg VFAL of which acetic acid was thedominating acid (Table 7) Despite the fact that the substrates S2 and S1 have asimilar origin the VFA concentration was about 4 times higher in S1 compared toS2 The observed volatility of VFA was 99 during the DM analysis of substrateS2 (Table 7) This is a slightly higher volatility compared to sample S1 Moreoveran increase in pH was detected during the DM-analysis for S2 from a pH of 50 to58 in agreement with the observed change in pH for substrate S1
Table 7 The concentrations of VFAs in substrate S2 before and after the DM-analysis and the VFA volatility The mean values are presented with a 95confidence interval and the volatility has been calculated according to Equation 7
Volatile fatty acidWet sample
(mgL)Dissolved dried sample
(mgL)Volatility
()
Acetic acid 2 600 plusmn 0 49 plusmn 11 98
Propionic acid 660 plusmn 10 0 plusmn 0 100
Butyric acid 470 plusmn 21 3 plusmn 1 99
Iso-butyric acid 70 plusmn 3 0 plusmn 0 100
Pentanoic acid 220 plusmn 9 0 plusmn 0 100
Iso-pentanoic acid 100 plusmn 20 0 plusmn 0 100
Hexanoic acid 110 plusmn 16 0 plusmn 0 100
Iso-hexanoic acid 20 plusmn 1 0 plusmn 0 100
Heptanoic acid 30 plusmn 3 0 plusmn 0 100
Sum VFA (mgL) 4300 plusmn 61 52 plusmn 11 99
SGC Rapport 2013273
Svenskt Gastekniskt Center AB Malmouml ndash wwwsgcse 35
Substrate S3343
The silage (substrate S3) had a different origin compared to the substrates S1 andS2 which were pasteurized food and slaughterhouse mixtures The VFA profile ofS3 was shown to be very different from S1 and S2 The substrate S3 containedonly acetic acid (99
Table 8) while the substrates S1 and S2 contained all of the VFAs The total VFAconcentration within the substrate S3 was 6 500 mg VFAL During the DM-analysis of the substrate S3 97 of the VFAs were evaporated (
Table 8) This is in line with the results from samples S1 and S2 but higher thanthe results presented by Porter and Murray (2001) which observed a volatility ofapproximately 89 However in this study the silage was heated at 100degC for 16hours thus another oven-drying method was used compared to the one in thisstudy Analogic to the observed results in the substrates S1 and S2 the pHincreased during the DM-analysis from 41 to 48
Table 8 The concentration of VFA in substrate S3 before and after the DM-analysis and the VFA volatility The mean values are presented with a 95confidence interval and the volatility has been calculated according to Equation 7
Volatile fatty acid Wet sample (mgL)Dissolved driedsample (mgL)
Volatility ()
Acetic acid 6400 plusmn 0 190 plusmn 56 97
Propionic acid 20 plusmn 5 10 plusmn 2 ndash
Butyric acid 16 plusmn 1 0 plusmn 0 100
Iso-butyric acid 0 plusmn 0 0 plusmn 0 ndash
Pentanoic acid 0 plusmn 0 0 plusmn 0 ndash
Iso-pentanoic acid 0 plusmn 0 0 plusmn 0 ndash
Hexanoic acid 23 plusmn 0 0 plusmn 0 100
Iso-hexanoic acid 0 plusmn 0 0 plusmn 0 ndash
Heptanoic acid 0 plusmn 0 0 plusmn 0 ndash
Sum VFA (mgL) 6 400 plusmn 4 190 plusmn 57 97
The uncertainty in the concentration of propionic acid in the silage was very high since the results varied very muchbetween the three independent samples Consequently it would be incorrect to calculate the volatility based upon theseresults
Silage normally contain higher concentrations of lactic acid compared to VFAsalcohols and ammonia-nitrogen The volatility of lactic acid in silage has howeverbeen found to be lower (lt38) than VFAs ammonia and alcohols (Porter ampMurray 2001 Weiszligbach amp Strubelt 2008a) In this study the volatility of lacticacid for S3 was however not analyzed
Substrate S4344
The initial VFA concentration in S4 (3 000 mg VFAL) was lower than the otheranalyzed substrates It was found that almost all of the VFAs were lost during theDM-analysis giving a volatility of 100 when considering the total concentrationof VFA (Table 9) This is in agreement with the observed results for S1 S2 andS3 The pH was increased in S4 during the DM-analysis from pH 46 to 53 inagreement with results obtained for the other analyzed substrates
SGC Rapport 2013273
36 Svenskt Gastekniskt Center AB Malmouml ndash wwwsgcse
Table 9 The concentration of VFA in substrate S4 before and after the DM-analysis and the calculated volatility The mean values are presented with a 95confidence interval and the volatility has been calculated according to Equation 7
Volatile fatty acidWet sample
(mgL)Dissolved dried sample
(mgL)Volatility
()
Acetic acid 940 plusmn 39 0 plusmn 0 100
Propionic acid 890 plusmn 0 4 plusmn 1 100
Butyric acid 640 plusmn 26 0 plusmn 0 100
Iso-butyric acid 10 plusmn 1 0 plusmn 0 100
Pentanoic acid 390 plusmn 24 3 plusmn 1 99
Iso-pentanoic acid 30 plusmn 2 0 plusmn 0 100
Hexanoic acid 63 plusmn 3 1 plusmn 0 98
Iso-hexanoic acid 0 plusmn 0 0 plusmn 0 ndash
Heptanoic acid 5 plusmn 0 0 plusmn 0 100
Sum VFA (mgL) 3 000 plusmn 19 8 plusmn 2 100
Digestate D1345
The concentrations of the analyzed VFAs in the wet and dissolved dried samplesof digestate D1 are summarized in Table 10 The initial total concentration of VFAwas approximately 320 mgL with the highest concentration of acetic acid (~88)among the VFAs A low VFA concentration in the digestate is typically for biogasdigesters with high process efficiency and stability
A higher total concentration of the VFAs was observed after the DM-analysiscompared to the initial concentration (Table 10) It seems unlikely that VFAs havebeen formed during the drying but in cannot be ruled out However due to the lowVFA concentration the uncertainty in the VFA analysis is quite high Consequentlythere might not be a difference in the VFA concentrations between the wet anddissolved dried samples but merely an effect of the uncertainty in themethodology This result is expected since the pH in the sample was 79 and wasincreased to 94 during the drying Both pH are however higher than the pKa forthe VFAs
Table 10 The concentration of VFA in digestate D1 before and after DM-analysisand VFA volatility The mean values are presented with a 95 confidence intervaland the volatility has been calculated according to Equation 7
Volatile fatty acidWet sample
(mgL)Dissolved dried sample
(mgL)Volatility
()
Acetic acid 280 plusmn 14 300 plusmn 18 0
Propionic acid 13 plusmn 2 25 plusmn 2 0
Butyric acid 7 plusmn 0 11 plusmn 1 0
Iso-butyric acid 4 plusmn 0 5 plusmn 0 0
Pentanoic acid 0 plusmn 0 4 plusmn 1 0
Iso-pentanoic acid 8 plusmn 1 7 plusmn 1 13
Hexanoic acid 3 plusmn 3 7 plusmn 1 0
Iso-hexanoic acid 0 plusmn 0 2 plusmn 0 0
Heptanoic acid 0 plusmn 0 7 plusmn 1 0
Sum VFA (mgL) 320 plusmn 13 370 plusmn 18 0
SGC Rapport 2013273
Svenskt Gastekniskt Center AB Malmouml ndash wwwsgcse 37
Digestate D2346
The initial sample of the digestate D2 contained mainly acetic acid whichcorresponded to approximately 88 of the total VFA concentration (Table 11) Theconcentrations of the rest of the VFAs ie propionic acid butyric acid iso-butyricacid pentanoic acid iso-pentanoic acid hexanoic acid iso-hexanoic acid andheptanoic acid were very low Consequently the uncertainties of theconcentrations of these acids were high as for sample D1 However as theconcentrations of those acids were low they will thus not have a large impact onthe final result The pH of the initial sample of D2 was found to be 79 Despite thefact that D1 and D2 had similar VFA profile and the same initial pH a difference inthe volatility was observed The volatility of the VFAs in D2 considering the totalconcentrations of VFAs was calculated to be 18 This volatility was highercompared to the VFA volatility for D1 (0) A volatility of 18 is howevernegligible when considering errors in the DM and VS values as the initialconcentration of VFA was low During the drying the pH was increased to 82
Table 11 The concentrations of VFAs in the digestate (D2) before and after theDM-analysis and the VFA volatility The mean values are presented with a 95confidence interval and the volatility has been calculated according to Equation 7
Volatile fatty acidWet sample
(mgL)Dissolved dried sample
(mgL)Volatility
()
Acetic acid 400 plusmn 28 310 plusmn 29 23
Propionic acid 26 plusmn 4 24 plusmn 4 8
Butyric acid 9 plusmn 2 9 plusmn 1 0
Iso-butyric acid 7 plusmn 1 5 plusmn 1 29
Pentanoic acid 0 plusmn 0 3 plusmn 0 0
Iso-pentanoic acid 8 plusmn 1 4 plusmn 3 50
Hexanoic acid 3 plusmn 3 6 plusmn 1 0
Iso-hexanoic acid 0 plusmn 0 1 plusmn 1 0
Heptanoic acid 0 plusmn 0 4 plusmn 4 0
Sum VFA (mgL) 450 plusmn 33 370 plusmn 37 18
Digestate D3347
Digestate D3 was withdrawn from a biogas reactor suffering from accumulation ofVFA indicating that the biogas process was suffering from in imbalance (Ahring etal 1995) The total concentration of VFAs was much higher in the D3 sample(7 700 mgL Table 12) compared to D1 (320 mgL) and D2 (460 mgL) Moreovereven in spite of high concentration of VFA the pH was due to high bufferingcapacity (data not shown) high (pH 8) During the drying the pH was decreaseddown to 63
The overall VFA volatility for D3 was calculated to be approximately 55 (Table12) which is higher compared to the VFA volatility for D1 (0) and D2 (20)Consequently the highest VFA volatility was observed for the digestate with thehighest initial concentration of VFAs Even though the initial pH (80) in D3 washigh 55 of the VFAs were still lost during the drying However the pH within thedried sample was 63 which theoretical would give increased evaporation andthereby supports the results achieved in D3 compared to D1 and D2 Why the pHwas decreased in not obvious however a theory is that ammonium is evaporated
SGC Rapport 2013273
38 Svenskt Gastekniskt Center AB Malmouml ndash wwwsgcse
before the VFAs If that is the case loss of ammonium (through ammonia) willresult in decreasing pH in the sample during the drying and thereby increasing theVFA volatility
All in all the results from the three digestates shown that the volatility is bothdepending of the initial pH the pH after drying and the buffer capacity of thesample A generalization of the volatility of different digestates is therefore difficultto achieve without doing the same measurements for each individual digestates asin the present study
Table 12 The concentrations of VFAs in digestate D3 before and after DM-analysis and VFA volatility The mean values are presented with a 95 confidenceinterval and the volatility has been calculated according to Equation 7
Volatile fatty acidWet sample
(mgL)Dissolved dried sample
(mgL)Volatility
()
Acetic acid 6 500 plusmn 170 2 900 plusmn 120 55
Propionic acid 370 plusmn 3 210 plusmn 4 43
Butyric acid 60 plusmn 2 77 plusmn 1 0
Iso-butyric acid 300 plusmn 120 90 plusmn 3 70
Pentanoic acid 6 plusmn 1 31 plusmn 1 0
Iso-pentanoic acid 400 plusmn 21 100 plusmn 6 75
Hexanoic acid 5 plusmn 2 40 plusmn 2 0
Iso-hexanoic acid 18 plusmn 0 8 plusmn 0 56
Heptanoic acid 0 plusmn 0 6 plusmn 0 0
Sum VFA (mgL) 7 700 plusmn 200 3 500 plusmn 120 55
Errors in process parameters due to VFA evaporation35
The evaporation of VFAs during the DM-analysis of the different analyzed sampleswas shown to be significant The volatility of the VFA in substrates was between95-100 (Table 13) which clearly highlights the problem with the evaporationThe results from the analysis of the evaporation of VFAs of the digestate sampleswere more difficult to interpret as the results varied from 0-55 evaporation
Since calculations of central process parameters are based upon the DM andVS content it is essential that they are correct By knowing the volatility of the VFAcompensation can be made and more correct DM and VS values can becalculated Calculated compensated DM (from hereby called DMcomp) and VS(from hereby called VScomp) values are presented in Table 13 This table alsoincludes calculations of the errors in DM (DMerror) and VS (VSerror) ie errorsdepending on the DM VS VFA concentration and the volatility of the VFA TheDMerror which is the relative difference between DM and DMcomp varied betweenapproximately 3-23 and the VSerror varied between 3-31 for the analyzedsubstrates The evaporation of other volatile organic molecules than VFA is notincluded since only VFA was measured The error in DM and VS may therefore beeven higher
The DMerror and VSerror were shown to be of minor importance for the digestatesD1 and D2 which contained low concentrations of VFAs However the DMerror andVSerror were for the digestate S3 was approximately 10 and 14 respectively
SGC Rapport 2013273
Svenskt Gastekniskt Center AB Malmouml ndash wwwsgcse 39
Table 13 Calculated DMcomp and VScomp values after compensation for the VFAevaporation The errors in the DM and VS values are also shown
SampleVFA(gL)
DM()
VS( of DM)
VFAvol
()DMcomp
()VScomp
( of DM)DMerror
()VSerror
()
S1 17 72 75 95 89 80 23 31
S2 43 14 91 99 14 92 3 3
S3 65 23 91 97 24 91 3 3
S4 30 36 99 100 39 99 8 8
D1 03 34 56 0 34 56 0 0
D2 05 47 73 18 47 73 0 0
D3 77 4 77 54 44 79 10 14
Calculations of the OLR using VS (not corrected) of the four different substrates(S1ndashS4) showed 3ndash31 higher value compared to calculations using thecompensated VS content (Figure 4 Table 12) Substrates S1 and S2 originatedfrom two different plants with pasteurization and the origin of the ingoing materialsdigested are relatively similar However the error in OLR is only 3 for substrateS2 but as high as 31 for substrate S1 (Figure 6 Table 13) This clearly showsthat is not possible to generalize the error for a substrate mixture without actuallyknowing the VFA concentration It is therefore important to continuously analyzeVFA within the substrate mixture to be able to calculate a correct OLR A constantOLR over time increases the process stability and that might be hard to achievewithout compensating the DM and VS values for the VFA evaporation particularlyif the VFA levels in the substrate are varying a lot
Figure 6 The relative error in the VFA compensated values of DM (DMcomp) andVS (VScomp) compared to the measured DM and VS values
Calculation of specific biogas production with non-corrected VS values will resultsin the same relative error as the OLR calculation This can be exemplified byassuming the ldquotruerdquo specific gas production for S1 and S2 (eg 070 Nm3kg VS)Without compensating for the VFA evaporation the specific biogas production will
0
5
10
15
20
25
30
35
S1 S2 S3 S4 D1 D2 D3
Re
lati
ve
err
or
()
DM error () VS error ()
SGC Rapport 2013273
40 Svenskt Gastekniskt Center AB Malmouml ndash wwwsgcse
be 092 Nm3kg VS and 072 Nm3kg VS for S1 and S2 respectively This meansthat one would assume that the substrate S1 had 28 higher biogas potential thansubstrate S2 which is incorrect The error (VSerror) caused by the VFA evaporationwithin the substrate will result in false-high specific biogas production and couldthereby lead to incorrect judgment concerning the economic value of a specificsubstrates for a biogas plant
Using different VS values and calculating the degree of degradation illustratesthat the error might even be higher than the errors in the parameters OLR andspecific gas production This is caused by the fact that both the DM and VS of theinlet substrate as well as the DM and VS of the digestate are used in thiscalculation In a scenario when a substrate with a high concentration of VFA isdigested thus giving a risk that VFA also is being accumulated in the digester thecalculation may results in a ldquodoublerdquo false value This can be exemplified byassuming a hypothetical biogas plant where substrate S1 is fed into the digesterand D3 is the outlet digestate With a compensation of the VFA evaporation in themeasurement in the substrate as well as in the digestate the degree ofdegradation will be 51 When doing the same calculation but with a VFAcompensation for the VS content of the substrate only and not for the digestate afalse-high value of 56 is obtained Without any VFA compensation at all thedegree of the degradation will on the contrary have a false-low value of 43
All in all it is of great importance to take the error in the DM and VS intoconsideration when performing calculation of organic loading rate specific biogasproduction as well as the degree of degradation However the error may benegligible for some substrates and biogas plants (eg digestion of substrate S2 orS4) but essential for other plants with high VFA content in the substrate (egdigestion of S1 or S3)
Evaporation of ammonium during the dry-matter analysis36
The main focus of the present project was to evaluate the evaporation of VFAsduring the DM-analysis using oven-drying However both the substrates anddigestates also contain inorganic molecules such as ammonium and ammoniawhich can affect the DM results The total concentration of ammonium (NH4-N)was analyzed in the samples before and after the DM-analysis and the observedresults are presented in Table 14 and in Figure 7 It should be notified that thepresented values include both the concentration of ammonium in the NH4-N stateas well as the NH3-N state but will hereafter just be called NH4-N
A common value of ammonium concentration in the digestate from a co-digestion plant is approximately 3 g NH4-Nkg exemplified by the samples D1 andD2 (Table 14) Ammonium and ammonia is in equilibrium with each other with anincreasing fraction being ammonia with increasing pH and temperature In amesophilic process (~37 degC) about 10 of the total ammonium fraction is in theammonia state However in the oven-drying the temperature rises to 105degC andwill more or less dislocate the equilibrium to ammonia (boiling point -33degC) whichis highly volatile By using the formula given by (Hansen et al 1998) and a typicalpH of a digestate 75 the oven-drying at 105oC will result in 61 of the total NH4-N being in the NH3-N state Thus more or less all ammonium and ammonia canbe expected to be evaporated in the case of a digestate However in a substrateless than 1 of the ammonium is expected to be in NH3-N state due to a lower pH(typically 4-5)
SGC Rapport 2013273
Svenskt Gastekniskt Center AB Malmouml ndash wwwsgcse 41
Table 14 The concentration of ammonium (NH4-N) in wet and dissolved driedsamples of the substrates S1-S4 and digestates D1 and D2 The mean values arepresented with a 95 confidence interval and the volatility has been calculated bythe same principle as the volatility of the VFAs (Equation 7)
SampleWet sample
(mg NH4-NL)Dissolved dried sample
(mg NH4-NL)Volatility
()
S1 1 400 plusmn 39 27 plusmn 3 98
S2 510 plusmn 140 10 plusmn 6 98
S3 450 plusmn 210 390 plusmn 48 13
S4 48 plusmn 5 3 plusmn 1 94
D1 2 900 plusmn 120 4 plusmn 1 100
D2 2 800 plusmn 65 49 plusmn 9 98
The analysis showed the highest concentrations of NH4-N for D1 (~29 gNH4-Nkg) and D2 (~28 g NH4-Nkg) Both digestate D1 and D2 had a pH of 79 inthe wet samples The tested substrates contained between 005 to 14 g NH4-Nkgand the pH varied from 41 to 52 It was thus observed that the pH was highlycorrelated with the NH4-N concentration with a linear correlation of 96 Thisshowed that samples with high levels of ammonium had a higher pH thansubstrates with low NH4-N concentrations In spite of the variation in pH thevolatility of ammonium was shown to be ge94 in S1 S2 S4 D1 and D2 The results also indicated that the ammonium volatility was lower in S3 (~13)compared to the other materials In a previous published study by Porter andMurray (2001) the volatility of ammonia was found to be gt97 in grass silage thatwas heated It seems unlikely that there would be such a large difference in thevolatility of ammonium in the grass silage included in this study compared to thestudy published by Porter and Murray (2001)The silage was more complicated toanalyze since the DM was much higher than the other analyzed materials and theS3 had to be mixed with water prior to the analysis of the wet (initial) ammoniumconcentration It is possible that not all of the ammonium was detected in the wetsample The uncertainty was also very high in the measurements of the wetsample of S3 (Table 14) which is an indication of an inhomogeneity with respectto the ammonium concentration
SGC Rapport 2013273
42 Svenskt Gastekniskt Center AB Malmouml ndash wwwsgcse
Figure 7 Volatility of ammonium within the different samples complied with the pHand ammonium concentration of the wet samples (before drying)
The volatility of VFA ndash a summary of the observed results37
As discussed previously the VFA volatility was higher than 95 in all foursubstrates (Figure 8) The volatility was lower for all the three digestates comparedto the four substrates and there were a significant difference between thedigestates being approximately 0 18 and 55 for D1 D2 and D3 respectivelyFor the digestate samples the highest volatility of the VFAs was found for thedigestate with the highest total VFA concentration However it should be noticedthat for materials with very low concentrations of VFAs such as the digestate D1and D2 the uncertainty in the analyzed VFA concentrations was large
0
1
2
3
4
5
6
7
8
9
0
20
40
60
80
100
S1 S2 S3 S4 D1 D2
pH
inw
et
sa
mp
leA
mm
on
ium
co
nc
en
tra
tio
n(g
NH
4-N
kg
)
Vo
lati
lity
()
Volatility Ammonium pH
SGC Rapport 2013273
Svenskt Gastekniskt Center AB Malmouml ndash wwwsgcse 43
Figure 8 The volatility of VFA the pH and the total concentration of VFAs in thefour analyzed substrates and the three investigated digestates
When comparing the volatility of VFAs of substrates and digestates it is clear thatpH is an important parameter The volatility was much higher for the substrateswith low pH than the digestate that had a much higher pH The importance of pHfor the degree of evaporation was also shown in the experiments performed toverify that it was possible to detect a majority of the VFAs in dissolved driedsamples diluted in MilliQ water (Chapter 32) The volatility was 95 in sample S1with a pH of 52 and 2 when the pH had been increased to above 11 The sametrend was observed for S2 sample for which the volatility was 99 (pH 50)compared to 19 when the pH was above 11 Consequently these resultsshowed that the evaporation of VFAs can be minimized by modifying the pHNegatively charged VFAs might interact with positively charged molecules orsubstances within the material and the evaporation of the VFAs is consequentlyminimized
The substrates used for biogas production are highly complex and diverse at amolecular level Consequently even when comparing similar types of substratesoriginating from different full scale plants these materials will be different at themolecular level It is thus likely that different reactions and composition changeswill occur within different materials during the drying process and this might in turnhave an impact of the evaporation of the volatile compounds This was forexample observed in this project as the pH of the analyzed materials changeddifferently in different samples during the oven DM-analysis Consequently theevaporation of volatile molecules from a sample might influence the volatility of themolecules still in the sample It is difficult to clearly reveal what chemical propertyof the materials or what environmental factor that will have the most effect on theevaporation of VFA and ammonia
0
2
4
6
8
10
12
14
0
10
20
30
40
50
60
70
80
90
100
S1 S2 S3 S4 D1 D2 D3
We
tp
Ho
fs
am
ple
VF
AV
ola
tili
ty(
)W
et
VF
Ac
on
ce
ntr
ati
on
(gL
)
Sample
Volatility VFA concentration pH
SGC Rapport 2013273
44 Svenskt Gastekniskt Center AB Malmouml ndash wwwsgcse
Methods to compensate DM for VFA evaporation biogas substrates38
For someone in the business of biogas production that would like to adopt thefindings in this study two methods for compensation are suggested whenanalyzing DM with oven-drying
As stated earlier the impact of the discrepancy in the analysis is dependent onthe characteristics of the materials analyzed For materials typically substratesstreams with a low pH (lt52) there is probably a high risk that the majority of theVFA is lost during the oven DM-analysis This might be a large problem when theanalyzed material has a high concentration of VFAs in relation to the DM as theerror in VS-weight in this case would be very large Therefore there are no quickfix of this problem and no general rules to adopt for all types of materials
An original thought was to prove a method decreasing evaporation of VFA byadding NaOH and thus increase the pH The VFAs would then be fixed in thesample and by considering the amount of added NaOH contributing to DM and itwould then be possible to obtain a correct DM and VS value This method wouldbe relatively easy to adopt for operators at a biogas plant or in a laboratoryHowever even if the VFAs could be fixed into the samples during the DM-analysis the addition of NaOH caused false-high DM values probably due toother chemical reactions within the sample Modification of pH by adding NaOH tominimize the evaporation of VFAs has also been investigated by (Nordberg et al2010) which observed a lower experimental DM value than expected for artificialsubstrates
Therefore the suggested methods for correction DM are more complicated andinclude more analysis of the material of interest than expected and hoped forbefore performing this study As other volatile molecules besides VFA might bepresent in the materials these should also be compensated for to obtain exact DMand VS values More accurate DM and VS values are however obtained by usingthe suggested method to compensate for the VFA loss than without compensationFor substrates with low pH both methods can be applied Since the variation inresults for evaporation of VFA in the digestate only method 2 should be appliedThe suggested methods give different accuracy of the DMcomp
SGC Rapport 2013273
Svenskt Gastekniskt Center AB Malmouml ndash wwwsgcse 45
Method 1 - Rough estimation method381
Method 1 for estimation of DMcomp and VScomp is suggested for substrates with lowpH (pH le 52) and when a rough estimate is sufficient Analyzes of pH and VFA (as a sum of organic acids or as VFA) are performed on the material (substratedigestate or mixtures of materials)
1)Measure DM (DMm) and VS (VSm) according to the Swedish Standard method SS02 81 13 (SIS 1981) DM determination in oven for 20 hours at 105oC and VSdetermination of the dried sample for 2 hours at 550oC
2)Analyze the concentrations of VFAs in the original sample (VFAm) This could bedone by analyzing the individual VFA and sum them up or by using a quickmethod that gives the sum directly The unit of the result used should beldquomg VFALrdquo
3)Assume a value for the volatility of VFAs in your substrate preferably VFAvol =98 (see results and discussion for volatility in different types of substrates)Calculate the compensated DMcomp weight by
ܯܦ ሺΨሻൌ ܯܦ () ቌቀ ௩௧௧௬ܣܨ ()ቁ
100ܣܨכ (Ȁܮ) lowast 10ସቍ
4)Calculate VScomp ( of DMcomp) by
൫Ψ ܯܦ ൯ൌ
൫ܯܦ () כ ()൯ ቀͳͲସ ௩௧௧௬ܣܨכ () ܣܨכ (Ȁܮ)ቁ
ܯܦ ()
SGC Rapport 2013273
46 Svenskt Gastekniskt Center AB Malmouml ndash wwwsgcse
Method 2 - Detailed estimation method382
This method should be used to compensate for the evaporation of VFAs in thosecases where it is important to have a very good estimation of the DM content in aspecific substrate or substrate mixture For digestates this method only can beused
1)Analyze the concentrations of VFAs in the original sample (VFAm) This could bedone by analyzing the individual VFA and sum them up or by using a quickmethod that gives the sum directly The unit of the result used should beldquomg VFALrdquo
2)Measure DM (DMm) and VS (VSm) according to the Swedish Standard methodSS 02 81 13 (SIS 1981) DM determination in oven for 20 hours at 105oC and VSdetermination of the dried sample for 2 hours at 550oC
3)Add MilliQ water to the beaker containing the dried material The added amount ofMilliQ water (mwater) should be adjusted so that the weight of the material isapproximately the same as before the drying Consequently if 8 grams ofmaterials were inserted in the oven then the weight of the dried materialsdissolved in MilliQ water (mwater) should be about 8 grams The water shouldhowever cover the dried material so if eg a lot of material is fixed on the wall ofthe beaker it might be necessarily to add more water
a) Notice the weight of the dried sample (msampledried)b) Let the beaker with the dried material and the added MilliQ water stand for 30
minutes Then stir the solution for 10 minutesc) Analyze the concentration of VFAs in the dissolved dried material
(VFAdrieddissolved)d) Calculate the concentrations of VFAs in the dried material before dissolved in
MilliQ water (VFAdried)
(ܮȀ)ௗௗܣܨ ൌ ൬כௗ௦௦௩ௗǡௗௗܣܨ൫ ೞ ǡା ൯
ೞ ǡ ൰
4)Calculate the actually volatility () of the VFAs in the sample
()௩௧௧௬ܣܨ ൌ ቆͳെிቀ
ಽቁ
ி ቀ
ಽቁቇכͳͲͲ
5)Calculate the compensated DMcomp weight by
ܯܦ ሺΨሻൌ ܯܦ () ቆ௩௧௧௬ܣܨ ()
100כ ܣܨ ( fraslܮ ) lowast 10ସቇ
SGC Rapport 2013273
Svenskt Gastekniskt Center AB Malmouml ndash wwwsgcse 47
6)Calculate VScomp ( of DMcomp) by
൫ ܯܦ ൯=
൫ܯܦ () lowast ()൯+ ቀ10ସ lowast ௩௧௧௬ܣܨ () lowast ܣܨ ቁ(ܮ)
ܯܦ ()
SGC Rapport 2013273
48 Svenskt Gastekniskt Center AB Malmouml ndash wwwsgcse
4 Conclusions
In this study the evaporation of VFAs and ammonia from different substrates anddigestates during DM-analysis using oven-drying were investigated The resultsshowed that the evaporation of VFAs during the DM-analysis using oven-dryingcould be a major problem for substrates with a relatively high concentration of VFAin relation to the DM content Four distinct biogas substrates (3-17 g VFAL) allwith low pH were evaluated with the respect to VFA evaporation The loss of VFAduring the DM-analysis in oven (20 hours 105oC) was concluded to be 95-100for the four substrates The errors caused by evaporation of VFAs during the DM-analysis may result in a false-high specific biogas production and a false-loworganic loading rate In the present study the measurement errors were in therange of 3-31 for the analyzed substrates Three different types of digestateswere also evaluated (03-77 g VFAL) all with high pH with the respect to VFAevaporation The evaporation of VFA varied between 0-50 in the digestates Thedifference between the substrates and digestates indicated that the pH and buffercapacity of the samples were important factors
Moreover a comparison between the concentrations of VFA and the amount ofdissolved organic carbon (TOC) for a reference substrate indicated that themajority of the volatile organic material that was lost during the DM-analysis wasVFA Based on the obtained results two different methods (with differentaccuracy) to compensate the DM and VS in biogas substrates with low pH anddigestates were suggested Furthermore it was also shown that also ammoniumevaporated from substrates and digestates during the oven-drying This might beof importance for digested materials where the concentration of ammonium oftenis high The evaporation of ammonium should be investigated further to be able tocompensate for the loss of this volatile molecule
All in all the results from the present study showed that it is of greatestimportance to compensate DM and VS for the VFA evaporation that occurs duringDM-analysis by oven-drying By applying one of the methods suggested in thisreport more reliable values of specific biogas production and potential organicloading rates could be expected in both full scale and laboratory scale conditions
SGC Rapport 2013273
Svenskt Gastekniskt Center AB Malmouml ndash wwwsgcse 49
5 Acknowledgements
The authors would like to thank NSR Swedish Biogas International SvenskBiogas i Linkoumlping AB and Stockholm Vatten for providing us with samples ofsubstrates and digestates during the experiments The authors would like to thankKatarina Stensen (Tekniska verken FoU Biogas) who performed the pre-studyand gave value input on the written report Thanks to Daniel Hellstroumlm (SvensktVatten Utveckling) and Andreas Carlsson (Stockholm Vatten) and Angelica Blom(Avfall Sverige) for their great input and review of the the written report JanMoestedt and Soumlren Nilsson Paringledal (Tekniska verken R amp D Biogas) for valuablediscussions of the lab results The authors would like to give thanks to Irene Bohn(NSR) Catarina Jonasson (EON) and Tobias Persson (SGC) for sharing theirknowledge and engagement during the reference meetings Finally the authorswould like to thank Yasna Calderon (Tekniska verken RampD Biogas) HelenWolrath (Tekniska verken Water Laboratory) and Karin Eden (Tekniska verkenWater Laboratory) for the assistance during the analysis and for valuable input tothe project
Finally and again thanks to all of the financiers to the project Tekniska verken iLinkoumlping AB Swedish University of Agricultural Sciences Swedish WasteManagement Goumlteborg Energi AB Svenskt Vatten Utveckling Stockholm GasAB ALcontrol AB EON Sverige AB NSR AB and SGC through the SwedishEnergy Agency
SGC Rapport 2013273
50 Svenskt Gastekniskt Center AB Malmouml ndash wwwsgcse
6 Literature
Ahring BK Sandberg M Angelidaki I 1995 Volatile Fatty-Acids as Indicatorsof Process Imbalance in Anaerobic Digesters Applied Microbiology andBiotechnology 43(3) 559-565
Carlsson M Uldal M 2009 Substrathandbok foumlr biogasproduktion (English titleSubstrate manual for biogas production) Svenskt Gastekniskt CenterISRN SGC-R-200-SE
De Caro CA Aichert A Walter CM 2001 Efficient precise and fast waterdetermination by the Karl Fischer titration Food Control 12(7) 431-436
Derikx PJL Willers HC ten Have PJW 1994 Effect of pH on the behaviourof volatile compounds in organic manures during dry-matter determinationBioresour Technol 49(1) 41-45
Ebbing DD 1993 General Chemistry Fourth Edition Houghton Mifflin CompanyBoston MA USA
Ek A Hallin S Vallin L Schnuumlrer A Karlsson M 2011 Slaughterhousewaste co-digestion - Experiences from 15 years of full-scale operationWorld Renewable Energy Congress ndash Sweden 8ndash13 May 2011Linkoumlping Sweden
Ganidi N Tyrrel S Cartmell E 2009 Anaerobic digestion foaming causes ndash Areview Bioresour Technol 100(23) 5546-5554
Gerardi MH 2003 The Microbiology of Anaerobic Digesters John wiley amp SonsInc United States of America
Hansen KH Angelidaki I Ahring BK 1998 Anaerobic digestion of swinemanure Inhibition by ammonia Water Research 32(1) 5-12
Isengard HD Walter M 1998 Can the water content of dairy products bedetermined accurately by microwave drying Zeitschrift Fur Lebensmittel-Untersuchung Und-Forschung a-Food Research and Technology 207(5)377-380
Jonsson S Boreacuten H 2002 Analysis of mono- and diesters of o-phthalic acid bysolid-phase extractions with polystyrene-divinylbenzene-based polymersJournal of Chromatography A 963(1-2) 393-400
Kreuger E Nges IA Bjoumlrnsson L 2011 Ensiling of crops for biogas productionndash effects on methane yield and total solids determination BiotechnolBiofuels
Larsen RE Jones GM 1973 Effects on different dry matter determinationmethods on chemical composition and in vitro digestibility of silage Can JAnim Sci 53 753-760
Lomborg CJ Holm-Nielsen JB Oleskowicz-Popiel P Esbensen KH 2009Near infrared and acoustic chemometrics monitoring of volatile fatty acidsand dry matter during co-digestion of manure and maize silage BioresourTechnol 100(5) 1711-1719
MacLeod SΚ 1991 Moisture Determination Using Karl Fischer Τitrations AnalChem 63 (10) pp 557Andash566A(10) 557A-566A
Madsen M Holm-Nielsen JB Esbensen KH 2011 Monitoring of anaerobicdigestion processes A review prespective Renewable and SustainableEnergy Reviews 15 3141-3155
SGC Rapport 2013273
Svenskt Gastekniskt Center AB Malmouml ndash wwwsgcse 51
Marquez MF Garcia B Ruiz V Ruizlopez MAD 1995 DETERMINATIONOF TOTAL SOLIDS IN DAIRY-PRODUCTS USING THE MICROWAVE-OVEN METHOD International Journal of Food Science and Technology30(3) 307-310
Nicolaiumla BM Beullensa K Bobelyna E Peirsa A Saeysa W Theronb KILammertyna J 2007 Nondestructive measurement of fruit and vegetablequality by means of NIR spectroscopy A review Postharvest Biology andTechnology 46(2) 99-118
Nordberg Aring Hansson M Kanerot M Krozer A Loumlfving B Sahlin E 2010Robusta maumlttekniker on-line foumlr
optimerad biogasproduktion WASTE REFINERY ISSN 1654-4706Nordell E Bohn I Karlsson M Moestedt J Wiberg L 2013 Improved
process stability and increased biogas production rate by addition of ironhydrochloric acid and trace elements Biomass amp BioenergySubmitted(Submitted)
Porter MG Murray RS 2001 The volatility of components of grass silage onoven drying and the inter-relationship between dry-matter content estimatedby different analytical methods Grass and Forage Science 56(4) 405-411
Reh CT Gerber A 2003 Total solids determination in dairy products bymicrowave oven technique Food Chemistry 82(1) 125-131
Samuelsson R Burvall J Jirjis R 2006 Comparison of different methods forthe determination of moisture content in biomass Biomass and Bioenergy30(11) 929-934
SIS 1981 Vattenundersoumlkningar - Bestaumlmning av torrsubstans ochgloumldgningsrest i vatten slam och sediment Vol SS 02 81 13 pp 1-3
SP 2010 SPCR 120 Certifieringsregler foumlr Biogoumldsel Vol SPCR 120 SPSveriges Tekniska Forskningsinstitut Borarings
Tafdrup S 1995 Viable energy production and waste recycling from anaerobicdigestion of manure and other biomass materials Biomass amp Bioenergy 9303-314
Ward AJ Hobbs PJ Holliman PJ Jones DL 2008 Optimisation of theanaerobic digestion of agricultural resources Bioresource Technology99(17) 7928-7940
Weiszligbach F Strubelt C 2008a Correcting the Dry Matter Content of MaizeSilages as a Substrate for Biogas Production Landtechnik 2 82-83
Weiszligbach F Strubelt C 2008b Correction of Dry Matter Content in Sugar BeetSilage as a Substrate for Biogas Production Landtechnik 63(6) 354-355
wwwsigmaaldrichcom
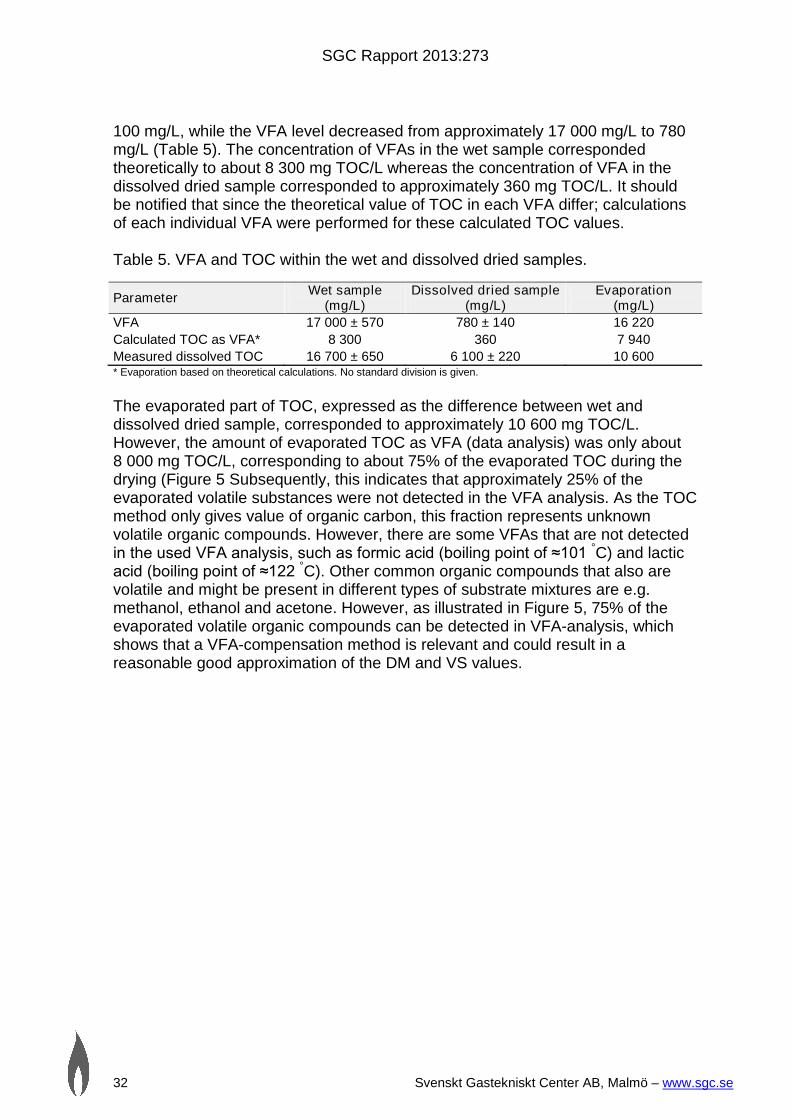
SGC Rapport 2013273
Svenskt Gastekniskt Center AB Malmouml ndash wwwsgcse 51
Marquez MF Garcia B Ruiz V Ruizlopez MAD 1995 DETERMINATIONOF TOTAL SOLIDS IN DAIRY-PRODUCTS USING THE MICROWAVE-OVEN METHOD International Journal of Food Science and Technology30(3) 307-310
Nicolaiumla BM Beullensa K Bobelyna E Peirsa A Saeysa W Theronb KILammertyna J 2007 Nondestructive measurement of fruit and vegetablequality by means of NIR spectroscopy A review Postharvest Biology andTechnology 46(2) 99-118
Nordberg Aring Hansson M Kanerot M Krozer A Loumlfving B Sahlin E 2010Robusta maumlttekniker on-line foumlr
optimerad biogasproduktion WASTE REFINERY ISSN 1654-4706Nordell E Bohn I Karlsson M Moestedt J Wiberg L 2013 Improved
process stability and increased biogas production rate by addition of ironhydrochloric acid and trace elements Biomass amp BioenergySubmitted(Submitted)
Porter MG Murray RS 2001 The volatility of components of grass silage onoven drying and the inter-relationship between dry-matter content estimatedby different analytical methods Grass and Forage Science 56(4) 405-411
Reh CT Gerber A 2003 Total solids determination in dairy products bymicrowave oven technique Food Chemistry 82(1) 125-131
Samuelsson R Burvall J Jirjis R 2006 Comparison of different methods forthe determination of moisture content in biomass Biomass and Bioenergy30(11) 929-934
SIS 1981 Vattenundersoumlkningar - Bestaumlmning av torrsubstans ochgloumldgningsrest i vatten slam och sediment Vol SS 02 81 13 pp 1-3
SP 2010 SPCR 120 Certifieringsregler foumlr Biogoumldsel Vol SPCR 120 SPSveriges Tekniska Forskningsinstitut Borarings
Tafdrup S 1995 Viable energy production and waste recycling from anaerobicdigestion of manure and other biomass materials Biomass amp Bioenergy 9303-314
Ward AJ Hobbs PJ Holliman PJ Jones DL 2008 Optimisation of theanaerobic digestion of agricultural resources Bioresource Technology99(17) 7928-7940
Weiszligbach F Strubelt C 2008a Correcting the Dry Matter Content of MaizeSilages as a Substrate for Biogas Production Landtechnik 2 82-83
Weiszligbach F Strubelt C 2008b Correction of Dry Matter Content in Sugar BeetSilage as a Substrate for Biogas Production Landtechnik 63(6) 354-355
wwwsigmaaldrichcom