METHOD DEVELOPMENT AND VALIDATION FOR THE … · the concentration of Famotidine and ibuprofen and...
16
International Journal of Pharmacy and Biological Sciences ISSN: 2321-3272 (Print), ISSN: 2230-7605 (Online) IJPBS | Volume 7 | Issue 2 | APR-JUN| 2017 | 56-71 Original Research Article – Pharmaceutical Sciences| Open Access| UGC Approved | MCI Approved Journal International Journal of Pharmacy and Biological Sciences G.Sandhyarani* & M.Sarangapani www.ijpbs.com or www.ijpbsonline.com 56 METHOD DEVELOPMENT AND VALIDATION FOR THE SIMULTANEOUS ESTIMATION OF IBUPROFEN AND FAMOTIDINE G.Sandhyarani 1 ,M.Sarangapani 1 post-doctoral fellow, university college of pharmaceutical sciences, Kakatiya University, Warangal, Telangana State, India-506001 *Corresponding Author Email: [email protected] ABSTRACT The main objective of the proposed work is to develop and validate a high precision and accurate analytical method for the simultaneous estimation of Ibuprofen and Famotidine in pharmaceutical dosage form by reverse phase high performance liquid chromatography (RP- HPLC) and validate the method as per ICH guidelines. Solubility determination of Ibuprofen and Famotidine in various solvents and buffers. Determine the absorption maxima of both the drugs UV-VISIBLE region in different solvents/buffers and selecting the solvents for HPLC method development. Analytical chemistry derives its principles from various branches of science like chemistry, physics, microbiology, nuclear science and electronics. This method provides information about the relative amount of one or more of these components. 1 Initially method development work was started by taking UV-visible spectra from 400-200 nm of Famotidine and Ibuprofen (10ppm) standard solutions. By observing the overlain spectra of standard solutions λmax 231 nm was taken for trials to develop HPLC method. The relationship between the concentration of Famotidine and ibuprofen and area of Famotidine and ibuprofen is linear in the range examined since all points lie in a straight line as shown in Figures 8.21, 8.22 and 8.23 respectively and the correlation coefficient is well within limits. KEY WORDS Analytical method, Ibuprofen, Famotidine. 2.1 INTRODUCTION AIM: The main objective of the proposed work is to develop and validate a high precision and accurate analytical method for the simultaneous estimation of Ibuprofen and Famotidine in pharmaceutical dosage form by reverse phase high performance liquid chromatography (RP- HPLC) and validate the method as per ICH guidelines. OBJECTIVE: To develop a new analytical method for simultaneous estimation of Ibuprofen and Famotidine in bulk and combination by RP-HPLC and validate the above method as per ICH guidelines. A good method development strategy should require only as many experimental runs as are necessary to achieve the desired final result .it should be simple as possible, yet it should allow the use of sophisticated tools such as computer modeling. 7 Nature of sample Before beginning of method development, we need to review about the sample, in order to define goals of separation. The kinds of sample related information that can be important are: The various kinds of sample related information that may be important for method development was summarized in Table 1.3 Method requirements The goals of the analytical method that need to be developed are considered. The detection limits, selectivity, linearity, range, accuracy and precision are defined.
Transcript of METHOD DEVELOPMENT AND VALIDATION FOR THE … · the concentration of Famotidine and ibuprofen and...
International Journal of Pharmacy and Biological Sciences
ISSN: 2321-3272 (Print), ISSN: 2230-7605 (Online)
IJPBS | Volume 7 | Issue 2 | APR-JUN| 2017 | 56-71
Original Research Article – Pharmaceutical Sciences| Open Access| UGC Approved | MCI Approved Journal
International Journal of Pharmacy and Biological Sciences G.Sandhyarani* & M.Sarangapani
www.ijpbs.com or www.ijpbsonline.com
56
METHOD DEVELOPMENT AND VALIDATION FOR THE SIMULTANEOUS
ESTIMATION OF IBUPROFEN AND FAMOTIDINE
G.Sandhyarani 1,M.Sarangapani
1 post-doctoral fellow, university college of pharmaceutical sciences, Kakatiya University, Warangal, Telangana
State, India-506001
*Corresponding Author Email: [email protected]
ABSTRACT
The main objective of the proposed work is to develop and validate a high precision and accurate analytical
method for the simultaneous estimation of Ibuprofen and Famotidine in pharmaceutical dosage form by reverse
phase high performance liquid chromatography (RP- HPLC) and validate the method as per ICH guidelines.
Solubility determination of Ibuprofen and Famotidine in various solvents and buffers. Determine the absorption
maxima of both the drugs UV-VISIBLE region in different solvents/buffers and selecting the solvents for HPLC
method development. Analytical chemistry derives its principles from various branches of science like chemistry,
physics, microbiology, nuclear science and electronics. This method provides information about the relative
amount of one or more of these components. 1 Initially method development work was started by taking UV-visible
spectra from 400-200 nm of Famotidine and Ibuprofen (10ppm) standard solutions. By observing the overlain
spectra of standard solutions λmax 231 nm was taken for trials to develop HPLC method. The relationship between
the concentration of Famotidine and ibuprofen and area of Famotidine and ibuprofen is linear in the range
examined since all points lie in a straight line as shown in Figures 8.21, 8.22 and 8.23 respectively and the
correlation coefficient is well within limits.
KEY WORDS
Analytical method, Ibuprofen, Famotidine.
2.1 INTRODUCTION
AIM: The main objective of the proposed work is to
develop and validate a high precision and accurate
analytical method for the simultaneous estimation of
Ibuprofen and Famotidine in pharmaceutical dosage
form by reverse phase high performance liquid
chromatography (RP- HPLC) and validate the method as
per ICH guidelines.
OBJECTIVE: To develop a new analytical method for
simultaneous estimation of Ibuprofen and Famotidine
in bulk and combination by RP-HPLC and validate the
above method as per ICH guidelines.
A good method development strategy should require
only as many experimental runs as are necessary to
achieve the desired final result .it should be simple as
possible, yet it should allow the use of sophisticated
tools such as computer modeling. 7
Nature of sample
Before beginning of method development, we need to
review about the sample, in order to define goals of
separation. The kinds of sample related information
that can be important are:
The various kinds of sample related information that
may be important for method development was
summarized in Table 1.3
Method requirements
The goals of the analytical method that need to be
developed are considered. The detection limits,
selectivity, linearity, range, accuracy and precision are
defined.
International Journal of Pharmacy and Biological Sciences G.Sandhyarani* & M.Sarangapani
www.ijpbs.com or www.ijpbsonline.com
57
ISSN: 2230-7605 (Online); ISSN: 2321-3272 (Print)
Int J Pharm Biol Sci.
Literature search and prior methodology
The information related to the analyte is surveyed for
synthesis, physical and chemical properties, solubility
and relevant analytical methods. Books, periodicals and
USP/NF, and publications are reviewed.
Choosing a method
a. Using the information in the literatures,
methodology is adapted. The methods are
modified wherever necessary. Sometimes it is
necessary to acquire additional instrumentation
to reproduce, modify, improve or validate existing
methods for analytes.
b. If there are no prior methods for the analyte in the
literature, from analogy, the compounds that are
similar in structure and chemical properties are
investigated and are worked out. There is usually
one compound for which analytical method
already exist that is similar to the analyte of
interest. 7
Instrumental setup and initial studies
a) The required instrumentation is setup installation,
operational and performance qualifications of
instrumentation verified by using laboratory standard
operating procedures.
b) Always new solvents, filters are used, for example,
method development is never started, on a HPLC
column that has been used earlier.
c) The analyte standard in a suitable
injection/introduction solution and in known
concentrations and solvents are prepared. It is
important to start with an authentic, known standard
rather than with a complex sample matrix. If the sample
is extremely close to the standard (ex: bulk drug) then
it is possible to start work with the actual sample.
Optimization
During optimization one parameter is changed at a time
and set of conditions are isolated, rather than using a
trial and error approach. Work has been done from an
organized methodical plan and every step is
documented (in lab notebook) in case of dead ends.
Reversed-Phase HPLC offers multiple parameters for
optimizing a separation. To plan separation by RP-HPLC,
the analyst must select both a stationary phase and a
mobile phase appropriate to the analyte under
investigation. In addition, the analyst must identify
chromatographic conditions that will maintain the
sharpness of analyte bands as the sample moves
through the stationary phase column to the detector.
The first attempt at optimization of separation requires
selection of a promising set of conditions.
To optimize the solvent strength, one approach is to
begin with a mobile phase that is probably too strong
and reduce solvent strength to increase k' (capacity
factor, is the measure of retention) between successive
runs. When all the peaks fit within the range 0.5< k' <
20, the mobile phase is near optimum from the
standpoint of solvent strength.
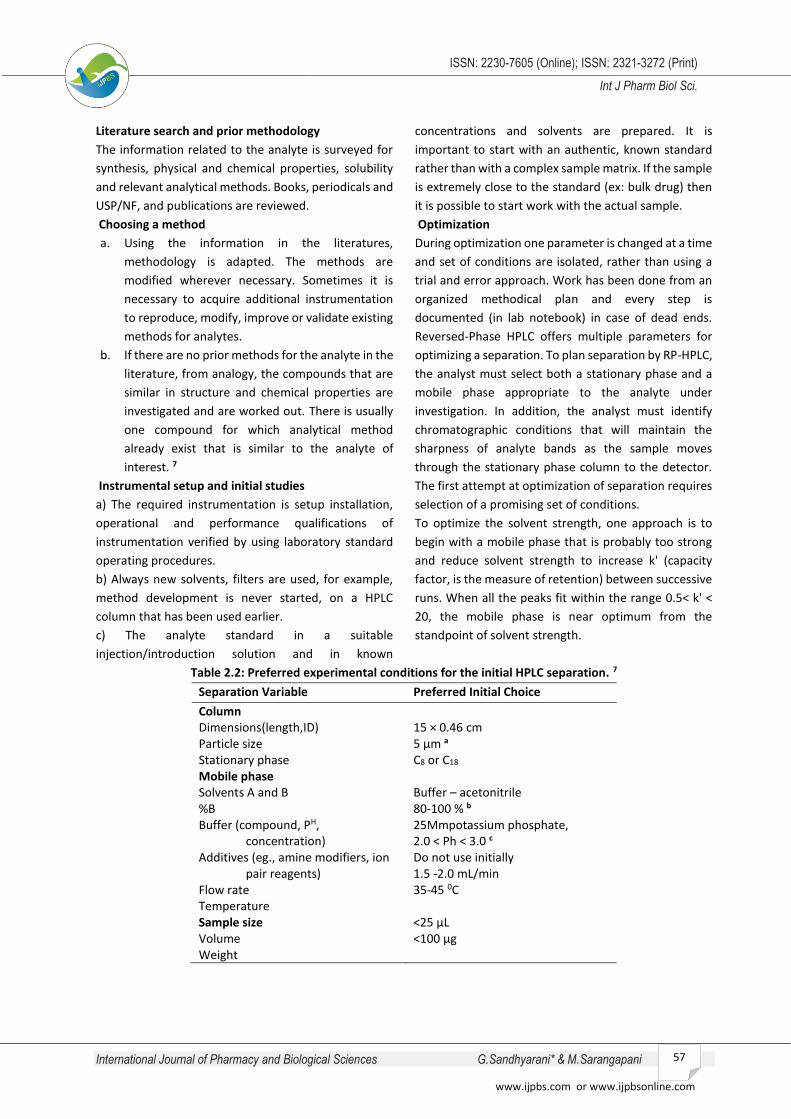
Table 2.2: Preferred experimental conditions for the initial HPLC separation. 7
Separation Variable Preferred Initial Choice
Column Dimensions(length,ID) Particle size Stationary phase Mobile phase Solvents A and B %B Buffer (compound, PH,
concentration) Additives (eg., amine modifiers, ion
pair reagents) Flow rate Temperature Sample size Volume Weight
15 × 0.46 cm 5 µm a C8 or C18 Buffer – acetonitrile 80-100 % b 25Mmpotassium phosphate, 2.0 < Ph < 3.0 c Do not use initially 1.5 -2.0 mL/min 35-45 0C <25 µL <100 µg

International Journal of Pharmacy and Biological Sciences G.Sandhyarani* & M.Sarangapani
www.ijpbs.com or www.ijpbsonline.com
58
ISSN: 2230-7605 (Online); ISSN: 2321-3272 (Print)
Int J Pharm Biol Sci.
3.5 µm particles are an alternative, using a 7.5 cm
column. For an initial isocratic run, an initial gradient
run is preferred. No buffer required for neutral
samples, for pH <2.5, pH-stable columns
recommended.
Once the solvent strength has been properly adjusted
for the sample, the next selection parameter that can
be explored is α (band spacing). In many cases, it is
possible to obtain a satisfactory separation simply by
varying solvent strength.
This is usually sufficient for simple and easily resolved
samples such as less polar and medium polar non-ionic
solutes, but for samples containing ionic and ionizable
compounds, apart from changes in solvent strength,
several other separation variables are to be altered to
optimize band spacing, retention or peak shape. 7
A temperature of 40-60°c appears to be convenient in
reversed phase-LC, when sample component permits.
Compared to ambient conditions operation at these
temperatures usually doubles the column efficiency in
terms of number of theoretical plates. Different
concentrations of the various organic solvents are
required to maintain constant solvent strength. Varying
the pH of mobile phase may drastically alter separation
selectively in RP-HPLC, if the sample components are
acids or bases. When dealing with a sample component
of weak base, pKa 8 the ion suppression technique can
be used by adding an acidic buffer. If this is ineffective,
an ion pair reagent, such as alkyl sulfonic acid may be
added. For strong bases, pKa > 8, ion pairs are more
effective than ion suppression.
Documentation of analytical figures of merit
The originally determined analytical figures of merit
Limit of Quantitation (LOQ), Limit of Detection (LOD),
Linearity, time per analysis, cost, sample preparation
etc., are documented.
Evaluation of method development with actual
samples
The sample solution should lead to absolute
identification of the analyte peak of interest apart from
all other matrix components.
RESULTS AND DISCUSSION
ANALYTICAL METHOD DEVELOPMENT:
selection of wavelength
Preparation of standard solution of Famotidine
About 10 mg of Famotidine was weighed and taken in a
10-mL volumetric flask, to this 5 mL of mobile phase
was added, sonicated and the volume was made up to
mark with the mobile phase.
Further dilution was made by taking 1 mL of the above
prepared solution into 10 mL volumetric flask to obtain
a concentration of 100 µg/ mL of the drug.
Further dilution was made by taking 1mL of above
prepared solution into 10 mL volumetric flask and
volume made up to mark to obtain a concentration of
10µg/mL of the drug.
Preparation of standard solution of Ibuprofen
About 10 mg of ibuprofen was weighed and taken in a
10-mL volumetric flask, to this 5 mL of mobile phase
was added, sonicated and the volume was made up to
mark with the mobile phase.
Further dilution was made by taking 1 mL of the above
prepared solution into 10 mL volumetric flask to obtain
a concentration of 100 µg/ mL of the drug.
Further dilution was made by taking 1mL of above
prepared solution into 10 mL volumetric flask and
volume made up to mark to obtain a concentration of
10µg/mL of the drug.
Optimization of UV conditions:
Initially method development work was started by
taking UV-visible spectra from 400-200 nm of
Famotidine and Ibuprofen (10ppm) standard solutions.
By observing the overlain spectra of standard solutions
λmax 231 nm was taken for trials to develop HPLC
method
METHOD DEVELOPMENT
The objective of this experiment was to optimize the
assay method for estimation of Famotidine and
Ibuprofen based on the literature survey made, so here
the trails mentioned describes how the optimization
was done.
Trail: 1
Preparation of Mobile phase
Preparation of Standard Solutions of Famotidine and
Ibuprofen
Chromatographic conditions:
Mobile phase: pH 3 buffer: ACN (50:50)
Flow rate: 0.7 mL/min
Column: c18
Detector wavelength: 231 nm
Injection volume: 20 µL
International Journal of Pharmacy and Biological Sciences G.Sandhyarani* & M.Sarangapani
www.ijpbs.com or www.ijpbsonline.com
59
ISSN: 2230-7605 (Online); ISSN: 2321-3272 (Print)
Int J Pharm Biol Sci.
Sl.No Peak name RT Peak area TP Rs Asymmetry
1 Famo 1.865 1351873.250 617.388 - 1.265
2 Ibu 3.432 715705.813 1686.779 4.196 1.250
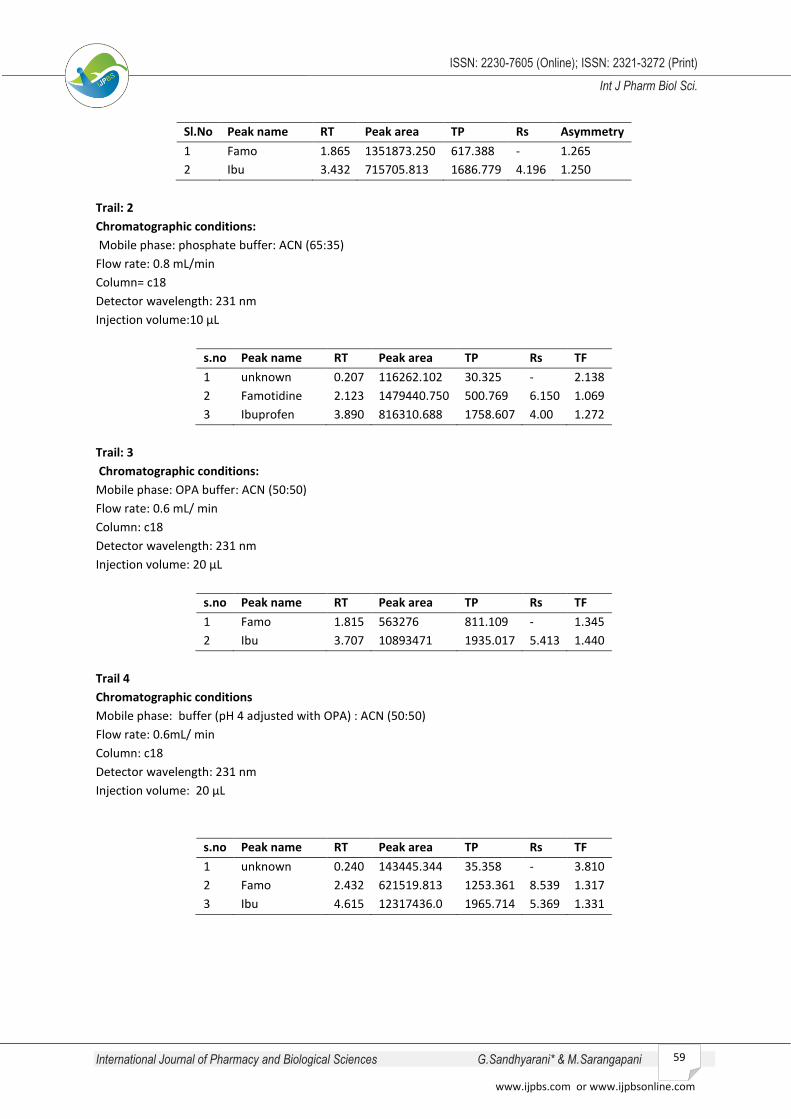
Trail: 2
Chromatographic conditions:
Mobile phase: phosphate buffer: ACN (65:35)
Flow rate: 0.8 mL/min
Column= c18
Detector wavelength: 231 nm
Injection volume:10 µL
s.no Peak name RT Peak area TP Rs TF
1 unknown 0.207 116262.102 30.325 - 2.138
2 Famotidine 2.123 1479440.750 500.769 6.150 1.069
3 Ibuprofen 3.890 816310.688 1758.607 4.00 1.272
Trail: 3
Chromatographic conditions:
Mobile phase: OPA buffer: ACN (50:50)
Flow rate: 0.6 mL/ min
Column: c18
Detector wavelength: 231 nm
Injection volume: 20 µL
s.no Peak name RT Peak area TP Rs TF
1 Famo 1.815 563276 811.109 - 1.345
2 Ibu 3.707 10893471 1935.017 5.413 1.440
Trail 4
Chromatographic conditions
Mobile phase: buffer (pH 4 adjusted with OPA) : ACN (50:50)
Flow rate: 0.6mL/ min
Column: c18
Detector wavelength: 231 nm
Injection volume: 20 µL
s.no Peak name RT Peak area TP Rs TF
1 unknown 0.240 143445.344 35.358 - 3.810
2 Famo 2.432 621519.813 1253.361 8.539 1.317
3 Ibu 4.615 12317436.0 1965.714 5.369 1.331

International Journal of Pharmacy and Biological Sciences G.Sandhyarani* & M.Sarangapani
www.ijpbs.com or www.ijpbsonline.com
60
ISSN: 2230-7605 (Online); ISSN: 2321-3272 (Print)
Int J Pharm Biol Sci.
Trail 5
Chromatographic conditions:
Mobile phase: buffer (pH 4 adjusted with OPA) : ACN (50:50)
Flow rate: 0.8mL/ min
Column: c18
Detector wavelength: 231 nm
Injection volume: 20 µL
s.no Peak name RT Peak area TP Rs TF
1 Famo 1.915 513246.688 1233.583 - 1.233
2 Ibu 3.173 5867314.5 1893.081 4.194 1.401
Trail: 6
Chromatographic conditions:
Mobile phase: OPA buffer: ACN (50:50)
Flow rate: 0.7 mL/min
Column:c18
Detector wavelength: 231 nm
Column Injection volume: 20 µL
S.NO PEAK NAME RT PEAK AREA TP Rs TF
1 Famo 1.898 268754.594 1466.767 - 1.216
2 Ibu 3.98 3397840.5 1953.432 4.260 1.389
Trail: 7
Chromatographic conditions
Mobile phase: 0.1% Orthophosphoric acid: ACN (50:50)
Flow rate: 0.8 mL/min
Column: c18(X-terra 4.6 mm×150 mm, 5µm)
Detector wavelength: 231 nm
Column Injection volume: 20 µL
s.no Peak name RT Peak area TP Rs TF
1 Famo 2.473 216752.406 4033.222 - 1.186
2 Ibu 3.407 1357775.750 2619.485 3.758 1.127
Optimized Method Parameters:
Table No. 6: Optimized Method Parameters
PARAMETERS CONDITIONS
Mobile Phase 0.1 % Orthophosphoric acid: Acetonitrile
(50:50)
Column (Stationary Phase) X-terra(C18) (4.6mm x 150mm, 5m)
Flow rate (ml/min) 0.8 mL/min
Column temperature (°C) Ambient
Volume of injection loop (l) 20 µL
Detection wavelength (nm) 231 nm
Drug RT (min) Famotidine 2.473 min
Ibuprofen 3.407 min

International Journal of Pharmacy and Biological Sciences G.Sandhyarani* & M.Sarangapani
www.ijpbs.com or www.ijpbsonline.com
61
ISSN: 2230-7605 (Online); ISSN: 2321-3272 (Print)
Int J Pharm Biol Sci.
PROCEDURE:
Preparation of buffer:
Taken 1000ml of HPLC grade water. Added the 1 ml of
Orthophosphoric acid.
Preparation of mobile phase
A mixture of above prepared buffer 500 ml (80%), and
500 ml of HPLC grade Acetonitrile (50%) were mixed
and degassed in ultrasonic water bath for 5 minutes.
The mobile phase was filtered through 0.45 µ filter
under vacuum.
ASSAY:
Preparation of the Famotidine and Ibuprofen standard
& sample solution:
Preparation of Standard Solution:
Transferred 240 mg of Famotidine and 8 mg of
Ibuprofen working standard into a 100ml clean dry
volumetric flask and added about 70ml of diluent. It
was sonicated to dissolve completely and made volume
up to the mark with the same diluent. (Stock solution)
(2400, 80µg/ml)
From this, 5 ml of the solution was pipette into another
50ml volumetric flask and diluted up to the mark with
diluent.
Preparation of sample solution:
Accurately weighed and transferred tablet powder
equivalent to 240 mg of Famotidine and 8 mg of
Ibuprofen working standard into a 100ml clean dry
volumetric flask and added about 70ml of diluent. It
was sonicated to dissolve completely and made volume
up to the mark with the same diluent. (Stock solution)
(2400, 80µg/ml)
From this, 5 ml of the solution was pipette into another
50ml volumetric flask and diluted up to the mark with
diluent.
Procedure:
20 µL of the standard and sample solutions were
injected into the chromatographic system and areas for
the Famotidine and Ibuprofen peaks were measured.
%Assay was calculated by using the formulae.
Calculation:
ASSAY %=AT
AS×
WS
DS×
DT
WT×
P
100×
AVG WT
LC×100
Where:
AT = Average area counts of sample preparation.
AS = Average area counts of standard preparation.
WS = Weight of working standard taken in mg.
P = Percentage purity of working standard
LC = label claim mg/mL
Avg wt = average weight
Standard chromatogram
s.no Peak name RT Peak area TP Rs TF
1 Famotidine 2.473 1701986 2883.618 - 1.275
2 Ibuprofen 3.407 5899512 2959.965 3.066 1.156

International Journal of Pharmacy and Biological Sciences G.Sandhyarani* & M.Sarangapani
www.ijpbs.com or www.ijpbsonline.com
62
ISSN: 2230-7605 (Online); ISSN: 2321-3272 (Print)
Int J Pharm Biol Sci.
Sample chromatogram:
s.no Peak name RT Peak area TP Rs TF
1 Famo 2.498 172220.625 2755 - 1.294
2 Ibu 3.432 5996133.50 2990 3.077 1.169
Drug Label claim (mg) Amount found (mg) % assay
Famotidine 26.6 26.2 99.49
Ibuprofen 800 798.5 98.4
The results of the % Assay calculated are given in Table 8.14 and the values were found to be in limits (98 % - 101%)
ANALYTICAL METHOD VALIDATION
Validation:
Establishing documentation evidence, which provides
a high degree of assurance that specific process, will
consistently produce a product meeting its
predetermined specification and quality attributes.
A) Accuracy
B) Precision
C) Intermediate Precision
D) Linearity
E) Limit of detection
F) Limit of quantitation
G) Robustness
H) System Suitability
A) ACCURACY:
The closeness of agreement between the true values
which is accepted either conventional new value or an
accepted reference value and the value found.
Preparation of Sample solution:
Accurately weighed and transferred tablet powder
equivalent to 240 mg of Ibuprofen and 8 mg of
Famotidine working standard into a 100ml clean dry
volumetric flask and added about 70ml of diluent. It
was sonicated to dissolve completely and made volume
up to the mark with the same diluent. (Stock solution)
(2400, 80µg/ml)
For preparation of 50% solution (With respect to
target Assay concentration):
From this above 2.5 ml of the standard solution and 5
ml of sample solution was pipetted into another 50ml
volumetric flask and diluted up to the mark with
diluent.
For preparation of 100% solution (With respect to
target Assay concentration):
From this above 5 ml of the standard solution and 5 ml
of sample solution was pipetted into another 50ml
volumetric flask and diluted up to the mark with
diluent.
For preparation of 150% solution (With respect to
target Assay concentration):
From this above 7.5 ml of the standard solution and 5.0
ml of sample solution was pipetted into another 50ml
volumetric flask and diluted up to the mark with
diluent.
Procedure:
The standard solution, Accuracy -50%, Accuracy -100%
and Accuracy -150% solutions were injected into the
chromatogram.

International Journal of Pharmacy and Biological Sciences G.Sandhyarani* & M.Sarangapani
www.ijpbs.com or www.ijpbsonline.com
63
ISSN: 2230-7605 (Online); ISSN: 2321-3272 (Print)
Int J Pharm Biol Sci.
Sample preparation for accuracy
Level Amount of Famotidine added (µg/ mL)
Amount of ibuprofen added (µg/ mL) Total volume (mL)
50% 4 120 50 100% 8 240 50 150% 12 360 50
Chromatogram of 50% recovery
Results for chromatogram of 50% recovery
Peak no Drug RT Peak area TP Rs TF
1 Famo 2.482 3844353.750 2783.618 - 1.275
2 Ibu 3.415 11320494 2959.965 3.066 1.156
Chromatogram of 100% recovery
Result for chromatograph of 100% recovery
Peak no Drug RT PA TP Rs TF
1 FAMO 2.498 1722200.625 2755.19 - 1.294
2 IBU 3.432 5996133.5 2990.3 3.077 1.169

International Journal of Pharmacy and Biological Sciences G.Sandhyarani* & M.Sarangapani
www.ijpbs.com or www.ijpbsonline.com
64
ISSN: 2230-7605 (Online); ISSN: 2321-3272 (Print)
Int J Pharm Biol Sci.
Chromatogram of 150%recovery
Results for chromatogram of 150% recovery
Peak no Drug RT PA TP Rs TF
1 FAMO 2.473 4612953 2855.1 - 1.244
2 IBU 3.415 14054761 2690.3 3.097 1.169
The Amount found and Amount added for Famotidine and Ibuprofen and the individual recovery and mean
recovery values were calculated and reported in table:
Results for recovery of Famotidine
Concentration Amount present
(µg/ mL)
Amount added
(µg/ mL)
Amount
found(µg/mL)
%
recovery
%mean
recovery
50% 7.8 6.5 14.32 100.3 100.7
100% 7.8 7.8 15.86 15.86
150% 7.8 9.3 17.3 17.3
Results for recovery of Ibuprofen
Concentration Amount present
(µg/ mL)
Amount added
(µg/ mL)
Amount
found(µg/mL)
%
recovery
% mean recovery
50% 240 192 432 99.9 98.3
100% 240 240 476 98.3
150% 240 288 531 101.0
Acceptance Criteria:
The % Recovery for each level should be between 98.0
to 102.0%.
B) PRECISION:
The precision of an analytical method is a measure of
the random error and is defined as the agreement
between replicate measurements of the same sample.
It is expressed as the percentage coefficient of variation
(%CV) or relative standard deviation (RSD) of the
replicate measurements.
% RSD = Standard deviation x 100
Mean
Procedure for Precision:
Preparation of stock solution:
Accurately weighed and transferred tablet powder
equivalent to 240 mg of Famotidine and 8 mg of
Ibuprofen working standard into a 100ml clean dry
volumetric flask and added about 70ml of diluent. It
was sonicated to dissolve completely and made volume
up to the mark with the same diluent. (Stock solution)
(2400, 80µg/ml)
From this, 5 ml of the solution was pipetted into
another 50ml volumetric flask and diluted up to the
mark with diluent.
Procedure:
The solution was injected for five times and measured
the area for all five injections in HPLC. The %RSD for the
International Journal of Pharmacy and Biological Sciences G.Sandhyarani* & M.Sarangapani
www.ijpbs.com or www.ijpbsonline.com
65
ISSN: 2230-7605 (Online); ISSN: 2321-3272 (Print)
Int J Pharm Biol Sci.
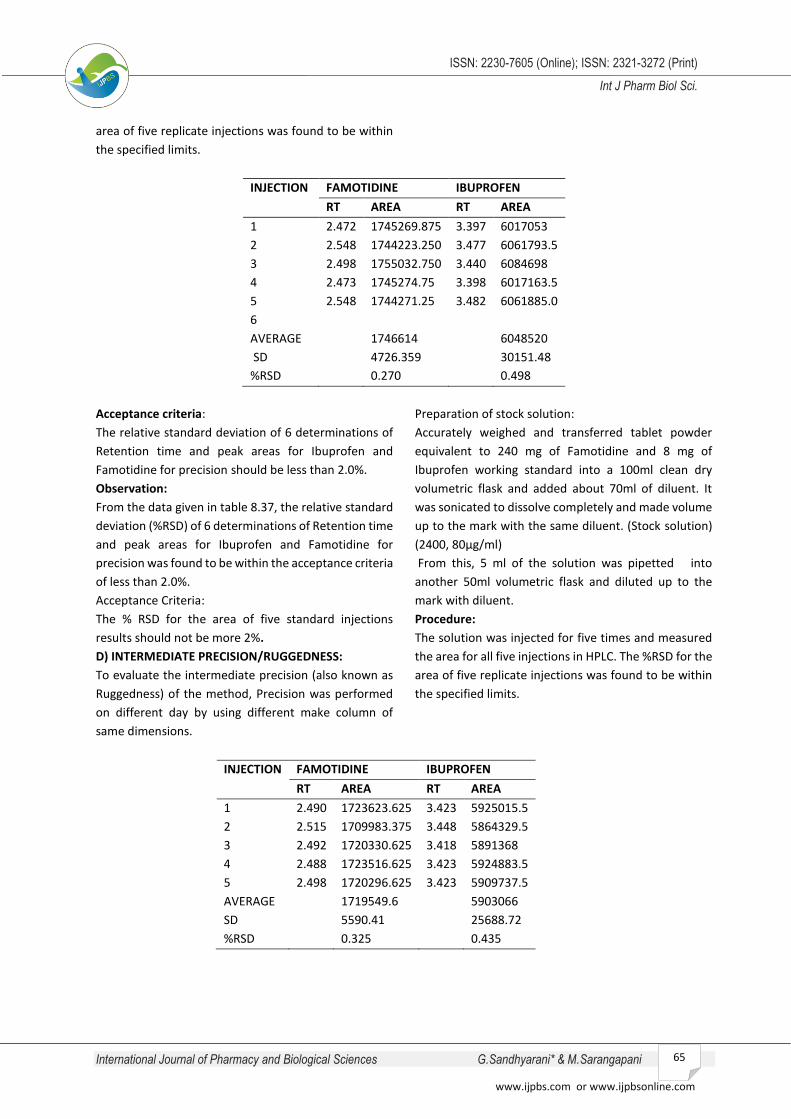
area of five replicate injections was found to be within
the specified limits.
INJECTION FAMOTIDINE IBUPROFEN
RT AREA RT AREA
1 2.472 1745269.875 3.397 6017053
2 2.548 1744223.250 3.477 6061793.5
3 2.498 1755032.750 3.440 6084698
4 2.473 1745274.75 3.398 6017163.5
5 2.548 1744271.25 3.482 6061885.0
6
AVERAGE 1746614 6048520
SD 4726.359 30151.48
%RSD 0.270 0.498
Acceptance criteria:
The relative standard deviation of 6 determinations of
Retention time and peak areas for Ibuprofen and
Famotidine for precision should be less than 2.0%.
Observation:
From the data given in table 8.37, the relative standard
deviation (%RSD) of 6 determinations of Retention time
and peak areas for Ibuprofen and Famotidine for
precision was found to be within the acceptance criteria
of less than 2.0%.
Acceptance Criteria:
The % RSD for the area of five standard injections
results should not be more 2%.
D) INTERMEDIATE PRECISION/RUGGEDNESS:
To evaluate the intermediate precision (also known as
Ruggedness) of the method, Precision was performed
on different day by using different make column of
same dimensions.
Preparation of stock solution:
Accurately weighed and transferred tablet powder
equivalent to 240 mg of Famotidine and 8 mg of
Ibuprofen working standard into a 100ml clean dry
volumetric flask and added about 70ml of diluent. It
was sonicated to dissolve completely and made volume
up to the mark with the same diluent. (Stock solution)
(2400, 80µg/ml)
From this, 5 ml of the solution was pipetted into
another 50ml volumetric flask and diluted up to the
mark with diluent.
Procedure:
The solution was injected for five times and measured
the area for all five injections in HPLC. The %RSD for the
area of five replicate injections was found to be within
the specified limits.
INJECTION FAMOTIDINE IBUPROFEN
RT AREA RT AREA
1 2.490 1723623.625 3.423 5925015.5
2 2.515 1709983.375 3.448 5864329.5
3 2.492 1720330.625 3.418 5891368
4 2.488 1723516.625 3.423 5924883.5
5 2.498 1720296.625 3.423 5909737.5
AVERAGE 1719549.6 5903066
SD 5590.41 25688.72
%RSD 0.325 0.435
International Journal of Pharmacy and Biological Sciences G.Sandhyarani* & M.Sarangapani
www.ijpbs.com or www.ijpbsonline.com
66
ISSN: 2230-7605 (Online); ISSN: 2321-3272 (Print)
Int J Pharm Biol Sci.
Acceptance criteria:
The relative standard deviation of 5 determinations of
Retention time and peak areas for Famotidine and
Ibuprofen for precision should be less than 2.0%.
Observation:
From the data given in table 8.37, the relative standard
deviation (%RSD) of 6 determinations of Retention time
and peak areas for Famotidine and Ibuprofen for
precision was found to be within the acceptance criteria
of less than 2.0%.
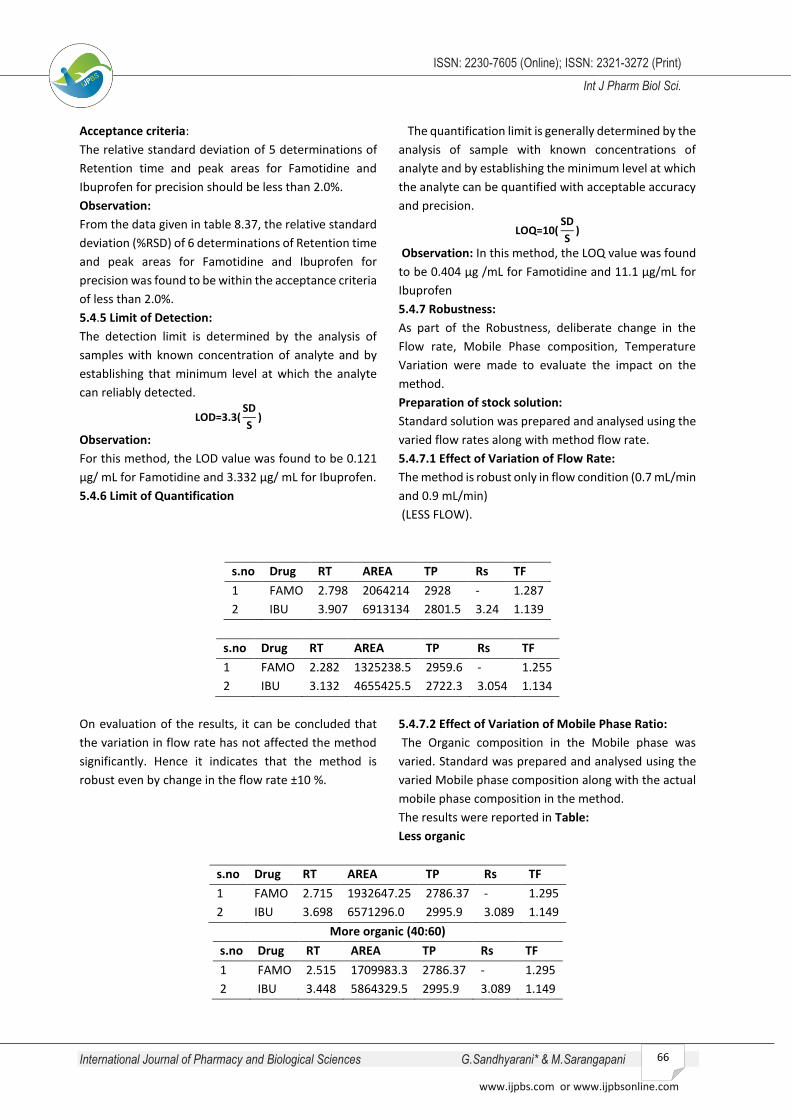
5.4.5 Limit of Detection:
The detection limit is determined by the analysis of
samples with known concentration of analyte and by
establishing that minimum level at which the analyte
can reliably detected.
LOD=3.3(SD
S)
Observation:
For this method, the LOD value was found to be 0.121
µg/ mL for Famotidine and 3.332 µg/ mL for Ibuprofen.
5.4.6 Limit of Quantification
The quantification limit is generally determined by the
analysis of sample with known concentrations of
analyte and by establishing the minimum level at which
the analyte can be quantified with acceptable accuracy
and precision.
LOQ=10(SD
S)
Observation: In this method, the LOQ value was found
to be 0.404 µg /mL for Famotidine and 11.1 µg/mL for
Ibuprofen
5.4.7 Robustness:
As part of the Robustness, deliberate change in the
Flow rate, Mobile Phase composition, Temperature
Variation were made to evaluate the impact on the
method.
Preparation of stock solution:
Standard solution was prepared and analysed using the
varied flow rates along with method flow rate.
5.4.7.1 Effect of Variation of Flow Rate:
The method is robust only in flow condition (0.7 mL/min
and 0.9 mL/min)
(LESS FLOW).
s.no Drug RT AREA TP Rs TF
1 FAMO 2.798 2064214 2928 - 1.287
2 IBU 3.907 6913134 2801.5 3.24 1.139
s.no Drug RT AREA TP Rs TF
1 FAMO 2.282 1325238.5 2959.6 - 1.255
2 IBU 3.132 4655425.5 2722.3 3.054 1.134
On evaluation of the results, it can be concluded that
the variation in flow rate has not affected the method
significantly. Hence it indicates that the method is
robust even by change in the flow rate ±10 %.
5.4.7.2 Effect of Variation of Mobile Phase Ratio:
The Organic composition in the Mobile phase was
varied. Standard was prepared and analysed using the
varied Mobile phase composition along with the actual
mobile phase composition in the method.
The results were reported in Table:
Less organic
s.no Drug RT AREA TP Rs TF
1 FAMO 2.715 1932647.25 2786.37 - 1.295
2 IBU 3.698 6571296.0 2995.9 3.089 1.149
More organic (40:60)
s.no Drug RT AREA TP Rs TF
1 FAMO 2.515 1709983.3 2786.37 - 1.295
2 IBU 3.448 5864329.5 2995.9 3.089 1.149
International Journal of Pharmacy and Biological Sciences G.Sandhyarani* & M.Sarangapani
www.ijpbs.com or www.ijpbsonline.com
67
ISSN: 2230-7605 (Online); ISSN: 2321-3272 (Print)
Int J Pharm Biol Sci.
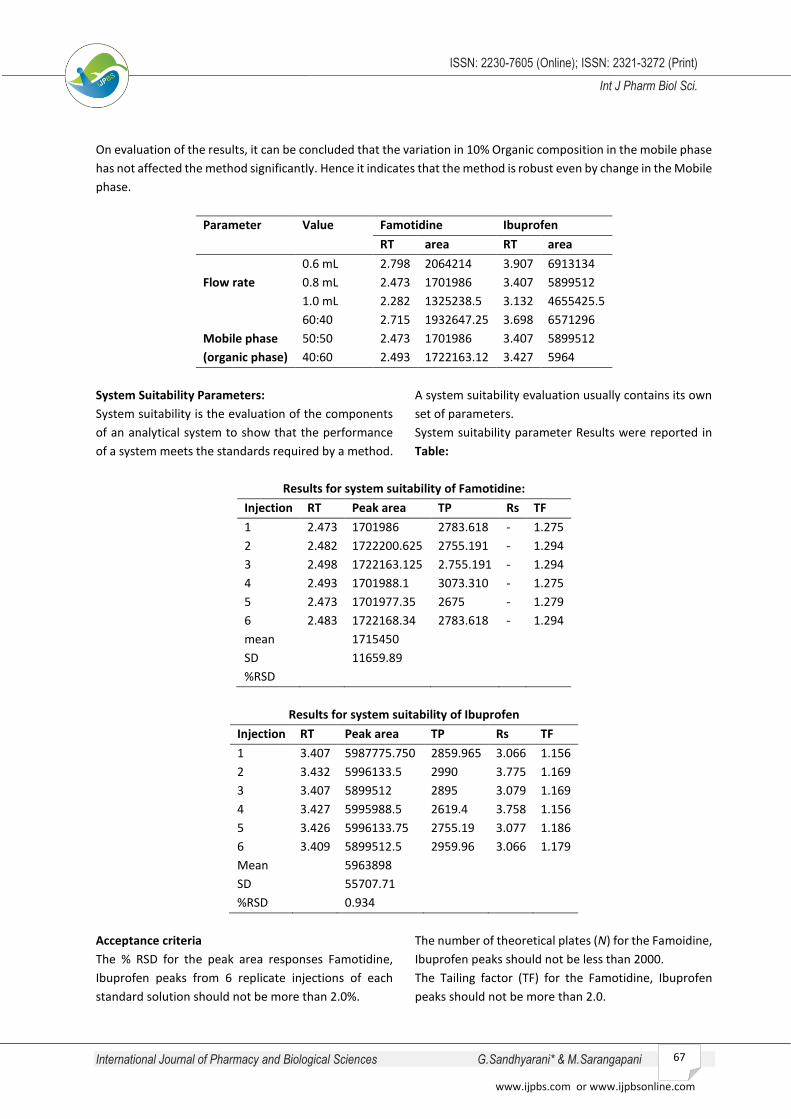
On evaluation of the results, it can be concluded that the variation in 10% Organic composition in the mobile phase
has not affected the method significantly. Hence it indicates that the method is robust even by change in the Mobile
phase.
Parameter Value Famotidine Ibuprofen
RT area RT area
Flow rate
0.6 mL 2.798 2064214 3.907 6913134
0.8 mL 2.473 1701986 3.407 5899512
1.0 mL 2.282 1325238.5 3.132 4655425.5
Mobile phase
(organic phase)
60:40 2.715 1932647.25 3.698 6571296
50:50 2.473 1701986 3.407 5899512
40:60 2.493 1722163.12 3.427 5964
System Suitability Parameters:
System suitability is the evaluation of the components
of an analytical system to show that the performance
of a system meets the standards required by a method.
A system suitability evaluation usually contains its own
set of parameters.
System suitability parameter Results were reported in
Table:
Results for system suitability of Famotidine:
Injection RT Peak area TP Rs TF
1 2.473 1701986 2783.618 - 1.275
2 2.482 1722200.625 2755.191 - 1.294
3 2.498 1722163.125 2.755.191 - 1.294
4 2.493 1701988.1 3073.310 - 1.275
5 2.473 1701977.35 2675 - 1.279
6 2.483 1722168.34 2783.618 - 1.294
mean 1715450
SD 11659.89
%RSD
Results for system suitability of Ibuprofen
Injection RT Peak area TP Rs TF
1 3.407 5987775.750 2859.965 3.066 1.156
2 3.432 5996133.5 2990 3.775 1.169
3 3.407 5899512 2895 3.079 1.169
4 3.427 5995988.5 2619.4 3.758 1.156
5 3.426 5996133.75 2755.19 3.077 1.186
6 3.409 5899512.5 2959.96 3.066 1.179
Mean 5963898
SD 55707.71
%RSD 0.934
Acceptance criteria
The % RSD for the peak area responses Famotidine,
Ibuprofen peaks from 6 replicate injections of each
standard solution should not be more than 2.0%.
The number of theoretical plates (N) for the Famoidine,
Ibuprofen peaks should not be less than 2000.
The Tailing factor (TF) for the Famotidine, Ibuprofen
peaks should not be more than 2.0.
International Journal of Pharmacy and Biological Sciences G.Sandhyarani* & M.Sarangapani
www.ijpbs.com or www.ijpbsonline.com
68
ISSN: 2230-7605 (Online); ISSN: 2321-3272 (Print)
Int J Pharm Biol Sci.
The resolution (Rs)between the two drugs should be
more than 2.0
Observation
The % RSD for the retention times and peak areas of
Famotidine, Ibuprofen were found to be less than 2%.
The number of theoretical plates of Famotidine,
Ibuprofen is found to be within the limit i.e. more than
2000. The tailing factor for Famotidine, Ibuprofen are
found to be within the limits. The tailing. The resolution
for Famotidine, Ibuprofen is found to be satisfactory
and within the limits.
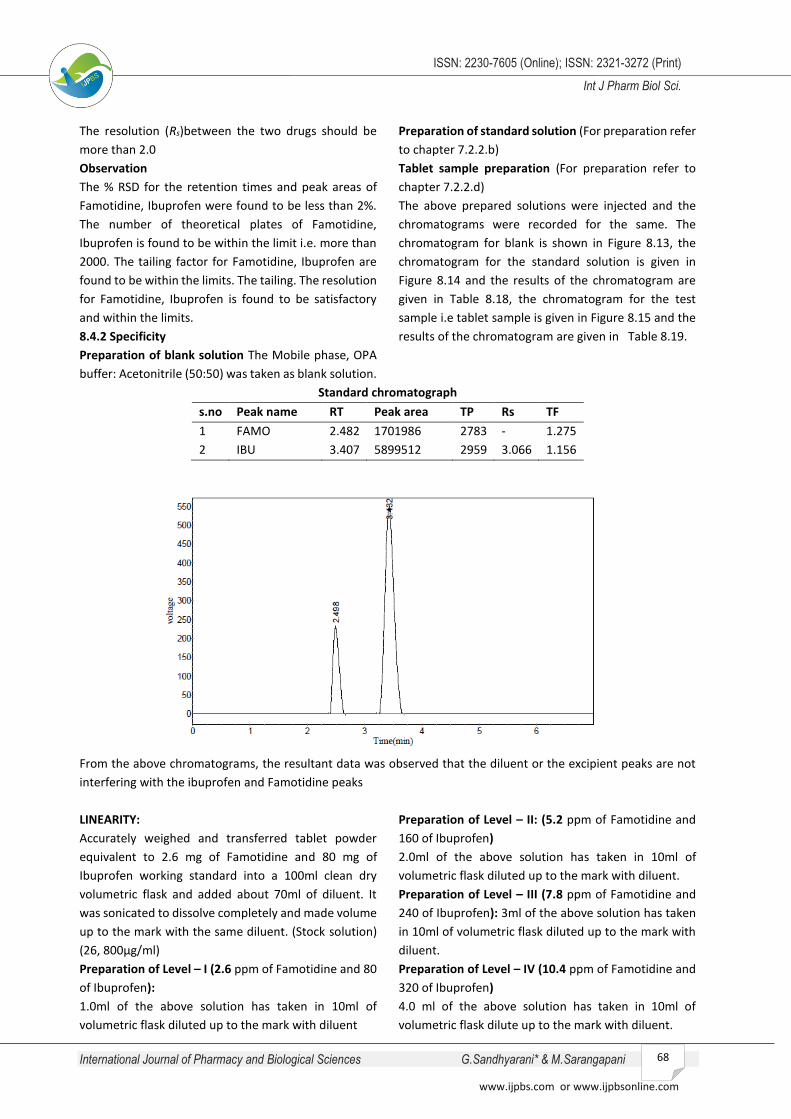
8.4.2 Specificity
Preparation of blank solution The Mobile phase, OPA
buffer: Acetonitrile (50:50) was taken as blank solution.
Preparation of standard solution (For preparation refer
to chapter 7.2.2.b)
Tablet sample preparation (For preparation refer to
chapter 7.2.2.d)
The above prepared solutions were injected and the
chromatograms were recorded for the same. The
chromatogram for blank is shown in Figure 8.13, the
chromatogram for the standard solution is given in
Figure 8.14 and the results of the chromatogram are
given in Table 8.18, the chromatogram for the test
sample i.e tablet sample is given in Figure 8.15 and the
results of the chromatogram are given in Table 8.19.
Standard chromatograph
s.no Peak name RT Peak area TP Rs TF
1 FAMO 2.482 1701986 2783 - 1.275
2 IBU 3.407 5899512 2959 3.066 1.156
From the above chromatograms, the resultant data was observed that the diluent or the excipient peaks are not
interfering with the ibuprofen and Famotidine peaks
LINEARITY:
Accurately weighed and transferred tablet powder
equivalent to 2.6 mg of Famotidine and 80 mg of
Ibuprofen working standard into a 100ml clean dry
volumetric flask and added about 70ml of diluent. It
was sonicated to dissolve completely and made volume
up to the mark with the same diluent. (Stock solution)
(26, 800µg/ml)
Preparation of Level – I (2.6 ppm of Famotidine and 80
of Ibuprofen):
1.0ml of the above solution has taken in 10ml of
volumetric flask diluted up to the mark with diluent
Preparation of Level – II: (5.2 ppm of Famotidine and
160 of Ibuprofen)
2.0ml of the above solution has taken in 10ml of
volumetric flask diluted up to the mark with diluent.
Preparation of Level – III (7.8 ppm of Famotidine and
240 of Ibuprofen): 3ml of the above solution has taken
in 10ml of volumetric flask diluted up to the mark with
diluent.
Preparation of Level – IV (10.4 ppm of Famotidine and
320 of Ibuprofen)
4.0 ml of the above solution has taken in 10ml of
volumetric flask dilute up to the mark with diluent.

International Journal of Pharmacy and Biological Sciences G.Sandhyarani* & M.Sarangapani
www.ijpbs.com or www.ijpbsonline.com
69
ISSN: 2230-7605 (Online); ISSN: 2321-3272 (Print)
Int J Pharm Biol Sci.
Preparation of Level – V (13.0 ppm of Famotidine and
400 of Ibuprofen):
5.0 ml of the above solution has taken in 10ml of
volumetric flask diluted up to the mark with diluent.
Procedure: Each level of solution was injected into the
chromatographic system and the peak areas were
measured. Plotted a graph of peak area versus
concentration (on X-axis concentration and on Y-axis
Peak area) and the correlation coefficient was
calculated.
Sample preparation for linearity:
Preparation Volume from standard stock
transferred in mL
Volume madeup in mL(with
diluents)
Concentration
obtained
Famotidne Ibuprofen
1 1.0 10 319799 1677519
2 2.0 10 1003211 3739380
3 3.0 10 1755032 6084698
4 4.0 10 2551909 8174726
5 5.0 10 3150848 10315646
S.NO CONCENTRATION PEAK AREA
1 2.6 319799
2 5.2 1003211
3 7.8 1755032
4 10.4 2551909
5 13 3150848
Graph for linearity data of famotidine
𝑦 = 277338.3𝑋 − 407079
R2 = 0.9991
Linearity data for Ibuprofen
S.NO CONCENTRATION PEAK AREA
1 80 1677519
2 160 3739380
3 240 6084698
4 320 8174726
5 400 10315646
0
319799
1003211
1755032
2551909
3150848
0
500000
1000000
1500000
2000000
2500000
3000000
3500000
0 2 4 6 8 10 12 14
AB
SO
RB
AN
CE
CONCENTRATION
CALIBRATION CURVE

International Journal of Pharmacy and Biological Sciences G.Sandhyarani* & M.Sarangapani
www.ijpbs.com or www.ijpbsonline.com
70
ISSN: 2230-7605 (Online); ISSN: 2321-3272 (Print)
Int J Pharm Biol Sci.
Graph for linearity data of ibuprofen
y=27139.5X-515086
R2 = 0.9998
Acceptance Criteria: Correlation coefficient should be not less than 0.999
From the linearity data in Table 8.29, the correlation coefficient for linear curve obtained between Concentration
vs. Area for standard preparations of Famotidine and ibuprofen are 0.999, 0.9998, respectively. The relationship
between the concentration of Famotidine and ibuprofen and area of Famotidine and ibuprofen is linear in the range
examined since all points lie in a straight line as shown in Figures 8.21, 8.22 and 8.23 respectively and the correlation
coefficient is well within limits.
REFERENCES: Younis M. H et. al., developed two new UV
spectrophotometric methods and validated for tablet dosage
form (DUEXIS). The first method, the absorbance correction
method was based on the measurement of the absorbance at
two wavelengths namely 287 nm at which
1) Narendra nyola et. al., developed a new UV-Visible
spectrophotometric method for the determination of
Ibuprofen and famotidine combination dosage form. A
simple, selective, accurate method was developed and
validated.
2) Asiya patel et. al., developed two spectrophotometric
methods for simultaneous estimation of ibuprofen and
famotidine in combined dosage form.
3) Dimal A. Shah et. al., developed an isocratic RP HPLC
assay method for the determination of ibuprofen and
famotidine in combined dosage form.
4) Narendra Nyola et. al., developed a new simple,
accurate, precise and reproducible RP- HPLC method for
simultaneous estimation of ibuprofen and famotidine in
tablet dosage forms using c18 column (phenomex 250×
4.6 mm ,5 µm) in isocratic method.
5) Mohith K. Joshi et. al., developed a simple RP HPLC
method for the determination of ibuprofen and
famotidine in synthetic mixture.
6) Yarram Ramakoti Reddy et. al., developed a stability-
indicating LC method was developed for the
simultaneous determination of ibuprofen and
famotidine in pharmaceutical dosage form.
7) Rajeshri Patel et. al., developed a simple High
Performance Thin Layer Chromatography Method for
the Simultaneous Estimation of Ibuprofen and
Famotidine in marketed formulation.
0
1677519
3739380
6084698
8174726
10315646
0
2000000
4000000
6000000
8000000
10000000
12000000
0 100 200 300 400 500
AB
SO
RB
AN
CE
concentration
CALIBRATION CURVE

International Journal of Pharmacy and Biological Sciences G.Sandhyarani* & M.Sarangapani
www.ijpbs.com or www.ijpbsonline.com
71
ISSN: 2230-7605 (Online); ISSN: 2321-3272 (Print)
Int J Pharm Biol Sci.
*Corresponding Author: G.Sandhyarani*
Email: [email protected]