METABOLISM OF GALACTOSE - Journal of Biological Chemistry · 630 Metabolism of Galactose. I been...
19
METABOLISM OF GALACTOSE I. CUTANEOUS BLOOD SUGARS AFTER GALACTOSE INGESTION BY VICTOR JOHN HARDING AND GORDON A. GRANT (From the Department of Pathological Chemistry, University of Toronto, Toronto, Canada) (Received for publication, November 10, 1932) Our knowledge of the fate of galactose after its oral ingestion has been limited by the analytical methods at our disposal. As a reducing sugar, the galactose could be traced by earlier workers only by methods common to those for glucose. The use of bakers’ yeast enabled these two sugars to be separated. By this means, Blanc0 (l), Corley (Z), and Harding and van Nostrand (3) re- duced the number of assumptions used in the interpretation of galactose metabolism. Roe and Schwartzman (4) by using Bene- dict’s (5) reagent for blood sugar after fermentation have mini- mized the occurrence of non-sugar reducing substances in the fraction analyzed as galactose. In two papers from this laboratory methods have been developed for the determination of galactose in bloods and urines. Both “galac” yeast (6) and Sacchuromyces marzianus (7) quantita- tively remove galactose from Folin-Wu blood filtrates and from urines previously treated with HzS04 and Lloyd’s reagent. The total reducing power of these liquids can be fractionated into (a) fermentable sugars, (b) galactose, and (c) residual reducing sub- stances. It is thus possible to follow the course of galactose in blood and urine after its oral ingestion in man, and to trace its influence, if any, on the other fractions. We have been able to gather further information on its behavior under varying condi- tions and to clarify many minor points of dispute. Our progress has been helped by our ability to apply this method of sugar fractionation to small amounts of cutaneous blood. All previous work either has been with venous blood, if the separation of fermentable sugar from the remaining reducing substances has 629 by guest on May 10, 2019 http://www.jbc.org/ Downloaded from
-
Upload
phungtuong -
Category
Documents
-
view
217 -
download
0
Transcript of METABOLISM OF GALACTOSE - Journal of Biological Chemistry · 630 Metabolism of Galactose. I been...

METABOLISM OF GALACTOSE
I. CUTANEOUS BLOOD SUGARS AFTER GALACTOSE INGESTION
BY VICTOR JOHN HARDING AND GORDON A. GRANT
(From the Department of Pathological Chemistry, University of Toronto, Toronto, Canada)
(Received for publication, November 10, 1932)
Our knowledge of the fate of galactose after its oral ingestion has been limited by the analytical methods at our disposal. As a reducing sugar, the galactose could be traced by earlier workers only by methods common to those for glucose. The use of bakers’ yeast enabled these two sugars to be separated. By this means, Blanc0 (l), Corley (Z), and Harding and van Nostrand (3) re- duced the number of assumptions used in the interpretation of galactose metabolism. Roe and Schwartzman (4) by using Bene- dict’s (5) reagent for blood sugar after fermentation have mini- mized the occurrence of non-sugar reducing substances in the fraction analyzed as galactose.
In two papers from this laboratory methods have been developed for the determination of galactose in bloods and urines. Both “galac” yeast (6) and Sacchuromyces marzianus (7) quantita- tively remove galactose from Folin-Wu blood filtrates and from urines previously treated with HzS04 and Lloyd’s reagent. The total reducing power of these liquids can be fractionated into (a) fermentable sugars, (b) galactose, and (c) residual reducing sub- stances. It is thus possible to follow the course of galactose in blood and urine after its oral ingestion in man, and to trace its influence, if any, on the other fractions. We have been able to gather further information on its behavior under varying condi- tions and to clarify many minor points of dispute. Our progress has been helped by our ability to apply this method of sugar fractionation to small amounts of cutaneous blood. All previous work either has been with venous blood, if the separation of fermentable sugar from the remaining reducing substances has
629
by guest on May 10, 2019
http://ww
w.jbc.org/
Dow
nloaded from

630 Metabolism of Galactose. I
been attempted by bakers’ yeast, or has depended on the determi- nation of total reducing substances in cutaneous blood.
Analytical Methods
Fractionation of Reducing Substances in Cutaneous Blood
Folin-Wu Preparation of Cutaneous Blood-O.5 cc. of cutaneous blood’ is drawn into a capillary pipette, washed into a centrifuge tube with 7.5 cc. of 0.66 per cent sodium tungstate solution, and 2.0 cc. of 0.16 N H&SO4 are added. The mixture is well stirred with a thin glass rod, allowed to stand 10 to 15 minutes, and centrifuged.
Total Reducing Substances-Two 1.0 cc. portions of the Folin- Wu centrifugate are removed and placed in 6 X 2 inch test-tubes. To each is added 1.0 cc. of the Harding and Downs (8) modifica- tion of the Shaffer-Hartmann sugar reagent. The tubes are stoppered with absorbent cotton, heated exactly 10 minutes in a rapidly boiling water bath, cooled to 30”, 1.0 cc. of 1 per cent KI solution is added, and 1.0 cc. of 1 N HzS04. The excess I2 is titrated with 0.0025 N thiosulfate, with the use of starch in satu- rated phenol red as indicator. A control experiment with water instead of Folin-Wu centrifugate is carried out alongside the determination. This method is accurate to ho.02 cc. of thiosul- fate, corresponding to less than 4 mg. of glucose per 100 cc. of blood.
The Harding and Downs modification of the Shaffer-Hartmann reagent is very similar to that described by Spannuth and Power (9). It possesses the advantage over previously described modifi- cations in giving lower figures for the non-fermentable reducing fractions of blood and urine, and in only requiring one control tube for each batch of sugar determinations.
Fermentable Sugar-O.25 gm. (wet weight) of washed bakers’ yeast is added to the remainder of the Folin-Wu centrifugate and incubated 10 minutes at 37” with constant stirring. The yeast is centrifuged and the supernatant liquid poured into a clean dry centrifuge tube. Any stray cells in this liquid are removed by a second centrifugation. Two 1.0 cc. portions are then removed
1 Suitable pipettes have been made for us by Messrs. Eimer and Amend, New York.
by guest on May 10, 2019
http://ww
w.jbc.org/
Dow
nloaded from

V. J. Harding and G. A. Grant 631
for analysis, by the method described in the previous paragraph. The difference represents fermentable sugar.
Galactose-0.5 gm. (wet weight) of washed galac yeast or Saccharomyces marxianus is added to the remaining portion of the Folin-Wu centrifugate and incubated 20 minutes at 37” with constant stirring. The yeast is removed by centrifugation and two 1.0 cc. portions are removed for analysis as just described.
TABLE I
Galactose Tolerance Tests (Series A)
Subject
R. F ................ H. P ................ G. B ................ s. c ................. w. s ................ W. F ................ R. G ................ J. S ................. T. T ................ G. H ................ M. M., ............. G. A. G ............. G. R ................ C. E. D ............. A. R. A ............. R. J .................
Blood glucose, mg. per 100 cc. Blood glucose, mg. per 100 cc. Blood ga:agegtyce, mg. per Blood ga:agegtyce, mg. per
Min. I Min. Min. I Min.
0 0 15 30 45 60 90 120 15 30 45 60 90 120 15 30 45 60 90 120 15 30 45 60 90 120 ------- --_--__-----_ -----_
90 89 98 96 92 90 89 98 96 92 83 834078 0 4078 0 98 95 98 95 92 84 92 92 84 92 5 5 9 00 9 00 94 93 94 93 88 90 94 88 90 94 0 0 11 00 11 00 85 97 87 84 82 85 97 87 84 82 75 75 10 9 11 0 0 10 9 11 0 0 81 91 92 90 85 81 91 92 90 85 79 79 4 12 13 10 4 12 13 10 0 0 86 96 86 96 90 85 76 90 85 76 11 11 13 0 8 13 0 8 90 91 90 91 89 85 87 89 85 87 19 19 19 12 0 19 12 0 99 126 125 114 101 99 126 125 114 101 85 850900 0 0900 0 83103 108114 81 83 103 108 114 81 72 72 0 21 18 18 0 21 18 18 0 0 84 90 89 84 87 84 90 89 84 87 74 74 20 32 28 21 20 32 28 21 0 0 80 87 82 80 79 80 87 82 80 79 74 74 16 23 22 8 16 23 22 8 0 0 91 91 100 100 93 90 92 93 90 92 22 22 31 00 31 00 90 96 88 99 83 90 96 88 99 83 86 86 0 21 24 12 0 21 24 12 0 0 89 111 83 83 88 89111 83 83 88 91 91 20 62 65 42 20 62 65 42 8 8 80 108 91 83 82 80108 91 83 82 77 77 16 45 54 40 16 45 54 40 6 6 83 83 92 79 70 92 79 70 51 70 0 51 70 0
Urine galac- tose
WJ.
56 89
147 158 211 232 249 260 326 436 471 627 693
1090 1248 1766
This gives the residual reducing substances. The difference gives galactose.
Fractionation of Reducing Substances in Venous Blood and Urine
Venous blood was fractionated in accordance with the methods just given for cutaneous blood. Urines were fractionated by the methods of Harding and Grant (6). All results reported in this paper are given as glucose. All difference values of 0.03 cc. of thiosulfate or less are reported as zero.
by guest on May 10, 2019
http://ww
w.jbc.org/
Dow
nloaded from
632 Metabolism of Galactose. I
EXPERIMENTAL
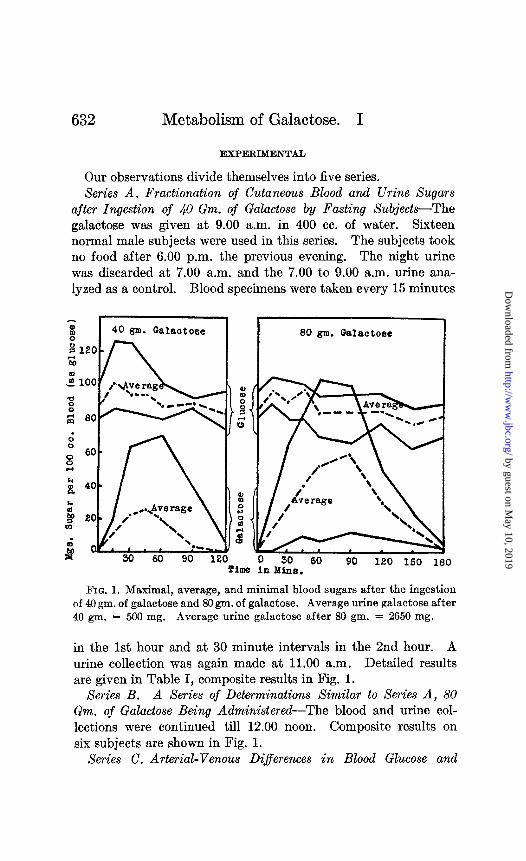
Our observations divide themselves into five series. Series A. Fractionation of Cutaneous Blood and Urine Sugars
after Ingestion of 40 Gm. of Galactose by Fasting SubjectsThe galactose was given at 9.00 a.m. in 400 cc. of water. Sixteen normal male subjects were used in this series. The subjects took no food after 6.00 p.m. the previous evening. The night urine was discarded at 7.00 a.m. and the 7.00 to 9.00 a.m. urine ana- lyzed as a control. Blood specimens were taken every 15 minutes
I 1 1 40 gm. Galactose 1
30 60 SO Time in Yins.
120 150 180
FIG. 1. Maximal, average, and minimal blood sugars after the ingestion of 40 gm. of galactose and 80 gm. of galactose. Average urine galactose after 40 gm. = 500 mg. Average urine galactose after 80 gm. = 2650 mg.
in the 1st hour and at 30 minute intervals in the 2nd hour. A urine collection was again made at 11.00 a.m. Detailed results are given in Table I, composite results in Fig. 1.
Series B. A Series of Determinations Similar to Series A, 80 Gm. of Galactose Being Administered-The blood and urine col- lections were continued till 12.00 noon. Composite results on six subjects are shown in Fig. 1.
Series C. Arterial-Venous Diferences in Blood Glucose and
by guest on May 10, 2019
http://ww
w.jbc.org/
Dow
nloaded from
V. J. Harding and G. A. Grant 633
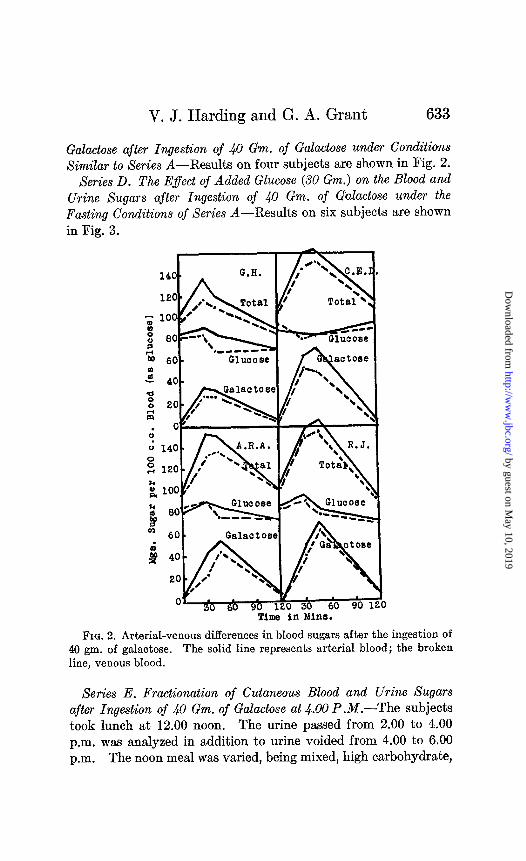
Galactose after Ingestion of 40 Gm. of Galactose under Conditions XimiEar to Series A-Results on four subjects are shown in Fig. 2.
Series D. The Effect of Added Glucose (30 Gm.) on the Blood and Urine Sugars after Ingestion of ~$0 Gm. of Galactose under the Fasting Conditions oj Series A-Results on six subjects are shown in Fig. 3.
/ ~818CtOSel /i ‘A I
Time in Mine.
Fro. 2. Arterial-venous differences in blood sugars after the ingestion of 40 gm. of galactose. The solid line represents arterial blood; the broken line, venous blood.
Series E. Fractionation of Cutaneous Blood and Urine Sugars after Ingestion of 40 Gm. of Galactose at 4.00 P.M.-The subjects took lunch at 12.00 noon. The urine passed from 2.00 to 4.00 p.m. was analyzed in addition to urine voided from 4.00 to 6.00 p.m. The noon meal wsls varied, being mixed, high carbohydrate,
by guest on May 10, 2019
http://ww
w.jbc.org/
Dow
nloaded from

634 Metabolism of Galactose. I
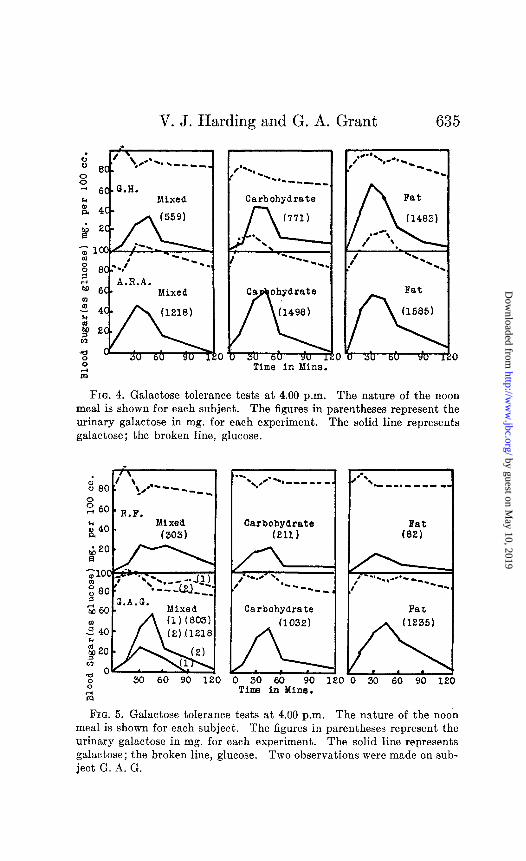
or high fat. The details of the carbohydrate and fat meal are given by Harding and Selby (10). Results on four subjects are shown in Figs. 4 and 5. The curves during fasting for the same individuals occur in Table I.
We have given a fixed dose of galactose, rather than one fluc- tuating with body weight, or body surface, though the latter may
_^^ I H.P.fl)l H.P. (2) J-:V< f 1 1 #L 9
% 1
,
Urine G B 1s 260 mge
. ..!r?ir. I1 1 ;
, I , , , ‘-.-
Urine GY ;IlS 326 mge. .
l S R.J. (1)
I. I A* r’
R.-J. (2) \ -.
‘5 a’ NC
.I l c, .( Urine Cc rla otose
176 mg.
u s 3u Minute Interval1 3
FIQ. 3. Showing the effect of ingestion of 30 gm. of glucose with 40 gm. of galactose on blood and urine glucose and galactose. (1) indicates 40 gm. of galactose; (%), 40 gm. of galactose + 30 gm. of glucose. The solid line represents galactose; the broken line, glucose.
seem more logical and scientific. From time to time argu- ments have been advanced in favor of varying the intake of glu- cose in the glucose tolerance tests. The results obtained with such regulated amounts of glucose have, however, proved dis- appointing from the standpoint of uniformity. The blood sugar
by guest on May 10, 2019
http://ww
w.jbc.org/
Dow
nloaded from
V. J. Harding and G. A. Grant
Carbohydrate
Time in Mins.
FIG. 4. Galactose tolerance tests at 4.00 p.m. The nature of the noon meal is shown for each subject. The figures in parentheses represent the urinary galactose in mg. for each experiment. The solid line represents galactose; the broken line, glucose.
. :: 00 ’ \ l .-
+ --q-m.
z 6o R.F.
i40 r Mixed (303)
0" 0" 30 60 90 1 30 60 90 1
I
a-. l \ ,c---,,,, -- _ .
I Carbohydrate (211)
1 Carbohydrate Fat (1032)
ILL 0 30 60 90 1
Time in Mine.
,0-s
** - - - . - - - - wm
Fat (82)
I 0 30 60 90 120
FIG. 5. Galactose tolerance tests at 4.00 p.m. The nature of the noon meal is shown for each subject. The figures in parentheses represent the urinary galactose in mg. for each experiment. The solid line represents galactose; the broken line, glucose. Two observations were made on sub- ject G. A. G.
by guest on May 10, 2019
http://ww
w.jbc.org/
Dow
nloaded from
636 Metabolism of Galactose. I
curves show just as great a variation as after a fixed intake of 50 or 100 gm. The same would appear to be true with galactose. If the results of Harding and van Nostrand, who used a fixed intake of 50 gm. of galactose, are compared with those of Roe and Schwartzman, who used a regulated dose of 1 gm. per kilo of body weight, it will be seen that both show large fluctuations. Our choice of 40 gm. as the fixed intake of galactose rather than 50 gm. has been influenced by the recent German and English work on galactose tolerance tests in hepatic disorders.
DISCUSSION
Blood Galactose--In a small series of experiments Harding and Grant have shown the absence of galactose in normal blood from fasting subjects. These results are confirmed in the present work. After galactose ingestion, however, galactose was observed in all bloods. The amount in some cases was very small and its pres- ence transient. It was always present in the 30 or 60 minute sample. This result is supplementary to that of Harding and van Nostrand whose methods did not enable them to detect very small amounts of galactose in venous bloods, although there was a marked increase in the non-fermentable reducing fraction of the urine. Only hourly specimens were taken by Harding and van Nostrand. This and the possibility of arterial-venous differences may explain the apparent lack of agreement.
Galactose tolerance tests for disorders of hepatic function were first suggested in 1906 by Bauer (11). The criterion was the amount of galactosuria. Such tests received little or no general acceptance in England or America; indeed, so little was their supposed clinical value that in 1925, Greene, Snell, and Walters (12), reviewing the then existent hepatic function tests, dismissed the use of galactose in half a line. Rowe (13) and Rowe and Chandler (14) however believed galactose tolerance tests help- ful in certain endocrine disturbances. In 1922, Kahler and Machold (15) determined cutaneous blood sugar at hourly in- tervals after the ingestion of 40 gm. of galactose. They set a definite limit of a rise of 30 mg. of sugar per 100 cc. of blood as normal. Their standard normal rise appears to have been ac- cepted by Davies (16) and Elmer and Scheps (17)) although Bauer and Wozasek (18) had previously pointed out in 1923 that the
by guest on May 10, 2019
http://ww
w.jbc.org/
Dow
nloaded from

V. J. Harding and G. A. Grant 637
total blood sugar might increase by 60 mg. per 100 cc. in occasional cases. Such might still be considered normal and were certainly unconnected with hepatic disorders.
The observations of Series A show that the average blood galac- tose found after a 40 gm. ingestion reaches 30 mg. In two of these however it is over 60 mg. The use of figures for total sugar in- stead of galactose can occasionally be misleading. Subjects J. S. and T. T. show marked elevations of glucose. These added to the galactose would give increases of total sugar of 37 mg. in- stead of 8 mg. of galactose, and 52 mg. of total sugar instead of 18 mg. of galactose respectively. The range of normal variation of either total blood sugar or galactose is evidently wide, and due consideration must be given to such a range in the clinical evalua- tion of galactose tolerance tests.
The position of the peak may perhaps be of value. It occurs during the 1st hour. This applies to either galactose or total sugar. At the end of 90 minutes the direction of the curve is downward, and has reached the normal fasting zero (or very nearly) in 120 minutes. Kahler and Machold do not give fig- ures for the varying time intervals, but all their normals and those of Bauer and Wozasek show marked diminution from the peak blood sugar at the end of 2 hours. After 50 gm. of galactose were given, thirteen out of fourteen subjects of Harding and van Nostrand showed a blood galactose peak on the 1st hour, if any increase at all was noted. The one exception showed a peak on the 2nd hour. The total venous blood sugar of Foster’s (19) subject was also falling between 45 and 75 minutes after an intake of 40 gm. of galactose. It would thus seem a reliable conclusion that, in either arterial or venous blood, the total sugar and the true galactose have reached peak value during the 1st hour and fall to fasting level at the end of 2 hours, if the dose of galactose is moderate in amount. In ordinary clinical galactose tolerance tests it would seem amply sufficient to take 30 minute blood samples.
After the administration of 80 gm. of galactose, both galactemia and galactosuria increase (Fig. 1) (Foster (20) ; Rowe and Chand- ler (14)); Reinhold and Karr (21) and Corley (22) believed this to be so, though all but the latter were compelled to rely on the increase in total sugar as a basis for their conclusion. The high
by guest on May 10, 2019
http://ww
w.jbc.org/
Dow
nloaded from
Metabolism of Galactose. I
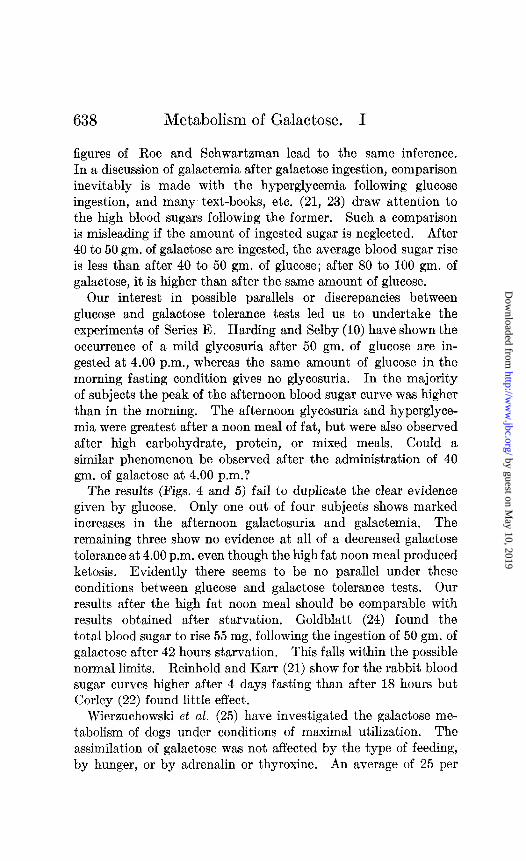
figures of Roe and Schwartzman lead to the same inference. In a discussion of galactemia after galactose ingestion, comparison inevitably is made with the hyperglycemia following glucose ingestion, and many text-books, etc. (21, 23) draw attention to the high blood sugars following the former. Such a comparison is misleading if the amount of ingested sugar is neglected. After 40 to 50 gm. of galactose are ingested, the average blood sugar rise is less than after 40 to 50 gm. of glucose; after 80 to 100 gm. of galactose, it is higher than after the same amount of glucose.
Our interest in possible parallels or discrepancies between glucose and galactose tolerance tests led us to undertake the experiments of Series E. Harding and Selby (10) have shown the occurrence of a mild glycosuria after 50 gm. of glucose are in- gested at 4.00 p.m., whereas the same amount of glucose in the morning fasting condition gives no glycosuria. In the majority of subjects the peak of the afternoon blood sugar curve was higher than in the morning. The afternoon glycosuria and hyperglyce- mia were greatest after a noon meal of fat, but were also observed after high carbohydrate, protein, or mixed meals. Could a similar phenomenon be observed after the administration of 40 gm. of galactose at 4.00 p.m.?
The results (Figs. 4 and 5) fail to duplicate the clear evidence given by glucose, Only one out of four subjects shows marked increases in the afternoon galactosuria and galactemia. The remaining three show no evidence at all of a decreased galactose tolerance at 4.00 p.m. even though the high fat noon meal produced ketosis . Evidently there seems to be no parallel under these conditions between glucose and galactose tolerance tests. Our results after the high fat noon meal should be comparable with results obtained after starvation. Goldblatt (24) found the total blood sugar to rise 55 mg. following the ingestion of 50 gm. of galactose after 42 hours starvation. This falls within the possible normal limits. Reinhold and Karr (21) show for the rabbit blood sugar curves higher after 4 days fasting than after 18 hours but Corley (22) found little effect.
Wierzuchowski et al. (25) have investigated the galactose me- tabolism of dogs under conditions of maximal utilization. The assimilation of galactose was not affected by the type of feeding, by hunger, or by adrenalin or thyroxine. An average of 25 per
by guest on May 10, 2019
http://ww
w.jbc.org/
Dow
nloaded from
V. J. Harding and G. A. Grant 639
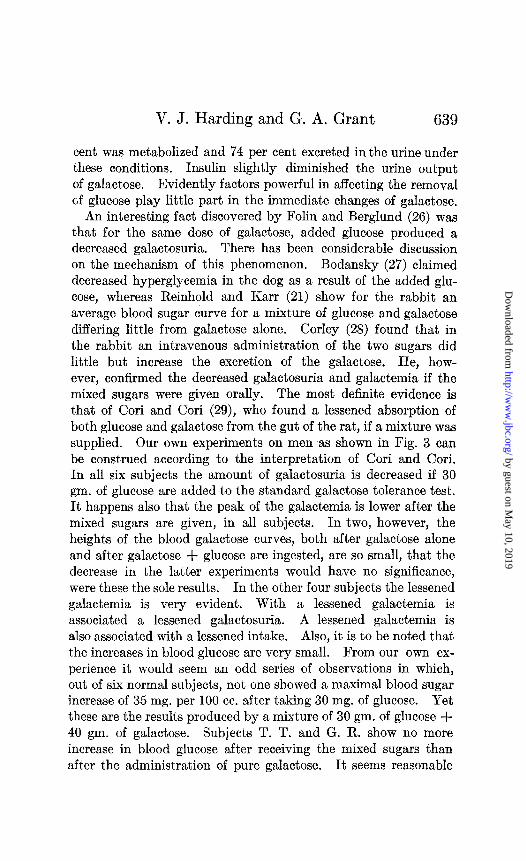
cent was metabolized and 74 per cent excreted in the urine under these conditions. Insulin slightly diminished the urine output of galactose. Evidently factors powerful in affecting the removal of glucose play little part in the immediate changes of galactose.
An interesting fact discovered by Folin and Berglund (26) was that for the same dose of galactose, added glucose produced a decreased galactosuria. There has been considerable discussion on the mechanism of this phenomenon. Bodansky (27) claimed decreased hyperglycemia in the dog as a result of the added glu- cose, whereas Reinhold and Karr (21) show for the rabbit an average blood sugar curve for a mixture of glucose and galactose differing little from galactose alone. Corley (28) found that in the rabbit an intravenous administration of the two sugars did little but increase the excretion of the galactose. He, how- ever, confirmed the decreased galactosuria and galactemia if the mixed sugars were given orally. The most definite evidence is that of Cori and Cori (29), who found a lessened absorption of both glucose and galactose from the gut of the rat, if a mixture was supplied. Our own experiments on men as shown in Fig. 3 can be construed according to the interpretation of Cori and Cori. In all six subjects the amount of galactosuria is decreased if 30 gm. of glucose are added to the standard galactose tolerance test. It happens also that the peak of the galactemia is lower after the mixed sugars are given, in all subjects. In two, however, the heights of the blood galactose curves, both after galactose alone and after galactose + glucose are ingested, are so small, that the decrease in the latter experiments would have no significance, were these the sole results. In the other four subjects the lessened galactemia is very evident. With a lessened galactemia is associated a lessened galactosuria. A lessened galactemia is also associated with a lessened intake. Also, it is to be noted that the increases in blood glucose are very small. From our own ex- perience it would seem an odd series of observations in which, out of six normal subjects, not one showed a maximal blood sugar increase of 35 mg. per 100 cc. after taking 30 mg. of glucose. Yet these are the results produced by a mixture of 30 gm. of glucose + 40 gm. of galactose. Subjects T. T. and G. R. show no more increase in blood glucose after receiving the mixed sugars than after the administration of pure galactose. It seems reasonable
by guest on May 10, 2019
http://ww
w.jbc.org/
Dow
nloaded from

640 Metabolism of Galactose. I
to conclude that comparatively little glucose reached the blood stream.
It has been concluded that galactose is a well utilized sugar when given in moderate amounts (3, 4). In the rat, however, its rate of forming glycogen is much slower than that of either glucose or fructose (30). On the other hand the respiratory quo- tient approaches unity after its ingestion (31), an increase which does not appear to be due to the liberation of CO2 due to lactic acid formation, according to Campbell, Maltby, and Soskin (32),
TABLE II
Residual Reducing Substances in Blood after Removal of Fermentable Sugar and Galactose
Subject
R. F ............. G. H ............. M. M ............. w. s .............. A. R. A ...........
“ ......... G. H ............. J. S ............. R. F ............. H. P ..............
T , -
-
Glucose, mg. per 100 cc.
D min
12 12 14 15 15
12 18 15 14 15
1
-
5 min
11 14 13 17 15
15 14 14 17 16
T
. i _ _
-
- 10 min 4
14 14 12 15 17
14 18 13 15 15
:5 min
13 10 12 15 15
10 19 13 15 13
I. 6 --
0 min
13 10 12 17 14
14 19 15 15 14
.l _
-
- I
20 min _ - 10 14 14 15 14
13 19 16 14 14
-
After 46 gm. galactose
After 86 gm. galactose
The figures also illustrate the level of the non-sugar reducing substances in whole blood as determined by the new copper reagent.
though Wierzuchowski et al. (25) report an increase in blood lac- tic acid under conditions of maximal utilization. Further light on galactose utilization might be obtained by a study of arterial- venous differences. Cutaneous blood is now commonly accepted as representing arterial blood in composition (33). Foster (19) records two experiments showing a marked absorption by the tissues after galactose ingestion but his figures are those of total sugar, and the difference may well be due to blood glucose. Our results on four subjects are shown in Fig. 2. In all subjects there is a well defined arterial-venous difference in total sugar. Part is due to glucose; part is due to galactose. In two of the subjects
by guest on May 10, 2019
http://ww
w.jbc.org/
Dow
nloaded from
V. J. Harding and G. A. Grant 641
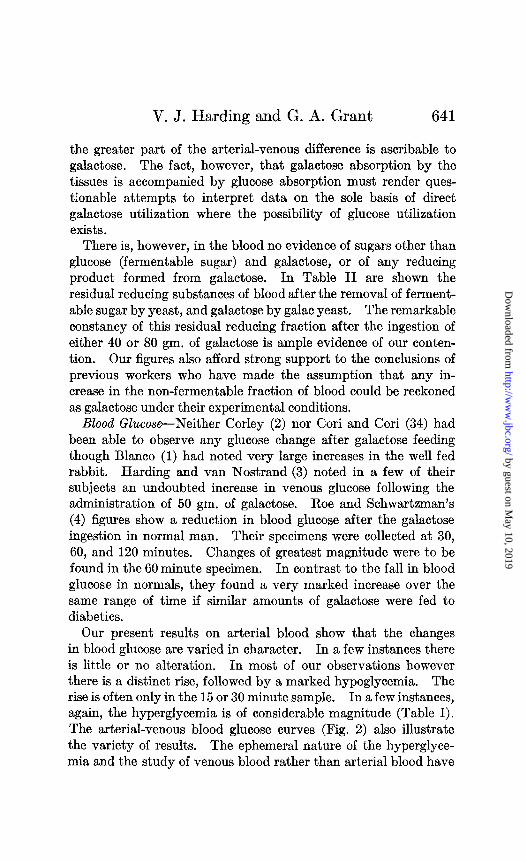
the greater part of the arterial-venous difference is ascribable to galactose. The fact, however, that galactose absorption by the tissues is accompanied by glucose absorption must render ques- tionable attempts to interpret data on the sole basis of direct galactose utilization where the possibility of glucose utilization exists.
There is, however, in the blood no evidence of sugars other than glucose (fermentable sugar) and galactose, or of any reducing product formed from galactose. In Table II are shown the residual reducing substances of blood after the removal of ferment- able sugar by yeast, and galactose by galac yeast. The remarkable constancy of this residual reducing fraction after the ingestion of either 40 or 80 gm. of galactose is ample evidence of our conten- tion. Our figures also afford strong support to the conclusions of previous workers who have made the assumption that any in- crease in the non-fermentable fraction of blood could be reckoned as galactose under their experimental conditions.
Blood Glucose-Neither Corley (2) nor Cori and Cori (34) had been able to observe any glucose change after galactose feeding though Blanco (1) had noted very large increases in the well fed rabbit. Harding and van Nostrand (3) noted in a few of their subjects an undoubted increase in venous glucose following the administration of 50 gm. of galactose. Roe and Schwartzman’s (4) figures show a reduction in blood glucose after the galactose ingestion in normal man. Their specimens were collected at 30, 60, and 120 minutes. Changes of greatest magnitude were to be found in the 60 minute specimen. In contrast to the fall in blood glucose in normals, they found a very marked increase over the same range of time if similar amounts of galactose were fed to diabetics.
Our present results on arterial blood show that the changes in blood glucose are varied in character. In a few instances there is little or no alteration. In most of our observations however there is a distinct rise, followed by a marked hypoglycemia. The rise is often only in the 15 or 30 minute sample. In a few instances, again, the hyperglycemia is of considerable magnitude (Table I). The arterial-venous blood glucose curves (Fig. 2) also illustrate the variety of results. The ephemeral nature of the hyperglyce- mia and the study of venous blood rather than arterial blood have
by guest on May 10, 2019
http://ww
w.jbc.org/
Dow
nloaded from
642 Metabolism of Galactose. I
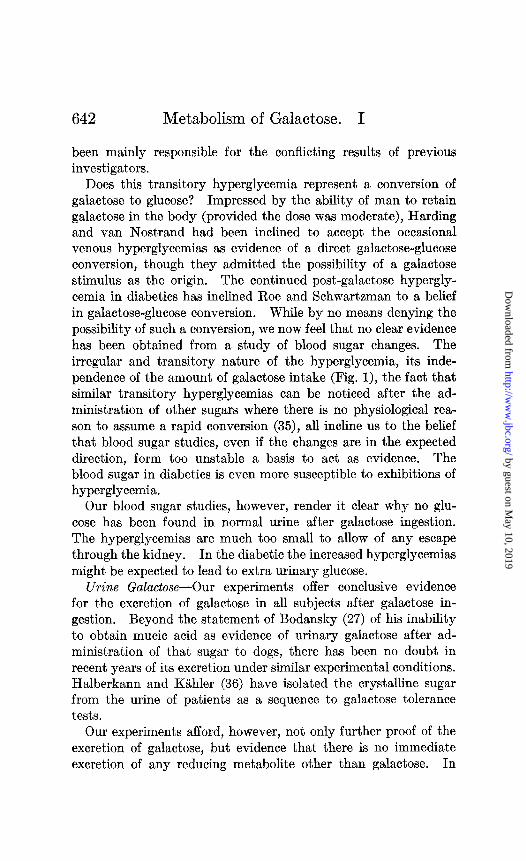
been mainly responsible for the conflicting results of previous investigators.
Does this transitory hyperglycemia represent a conversion of galactose to glucose? Impressed by the ability of man to retain galactose in the body (provided the dose was moderate), Harding and van Nostrand had been inclined to accept the occasional venous hyperglycemias as evidence of a direct galactose-glucose conversion, though they admitted the possibility of a galactose stimulus as the origin. The continued post-galactose hypergly- cemia in diabetics has inclined Roe and Schwartzman to a belief in galactose-glucose conversion. While by no means denying the possibility of such a conversion, we now feel that no clear evidence has been obtained from a study of blood sugar changes. The irregular and transitory nature of the hyperglycemia, its inde- pendence of the amount of galactose intake (Fig. l), the fact that similar transitory hyperglycemias can be noticed after the ad- ministration of other sugars where there is no physiological rea- son to assume a rapid conversion (35), all incline us to the belief that blood sugar studies, even if the changes are in the expected direction, form too unstable a basis to act as evidence. The blood sugar in diabetics is even more susceptible to exhibitions of hyperglycemia.
Our blood sugar studies, however, render it clear why no glu- cose has been found in normal urine after galactose ingestion. The hyperglycemias are much too small to allow of any escape through the kidney. In the diabetic the increased hyperglycemias might be expected to lead to extra urinary glucose.
Urine Galactose-Our experiments offer conclusive evidence for the excretion of galactose in all subjects after galactose in- gestion. Beyond the statement of Bodansky (27) of his inability to obtain mucic acid as evidence of urinary galactose after ad- ministration of that sugar to dogs, there has been no doubt in recent years of its excretion under similar experimental conditions. Halberkann and Kahler (36) have isolated the crystalline sugar from the urine of patients as a sequence to galactose tolerance tests.
Our experiments afford, however, not only further proof of the excretion of galactose, but evidence that there is no immediate excretion of any reducing metabolite other than galactose. In
by guest on May 10, 2019
http://ww
w.jbc.org/
Dow
nloaded from
V. J. Harding and G. A. Grant 643
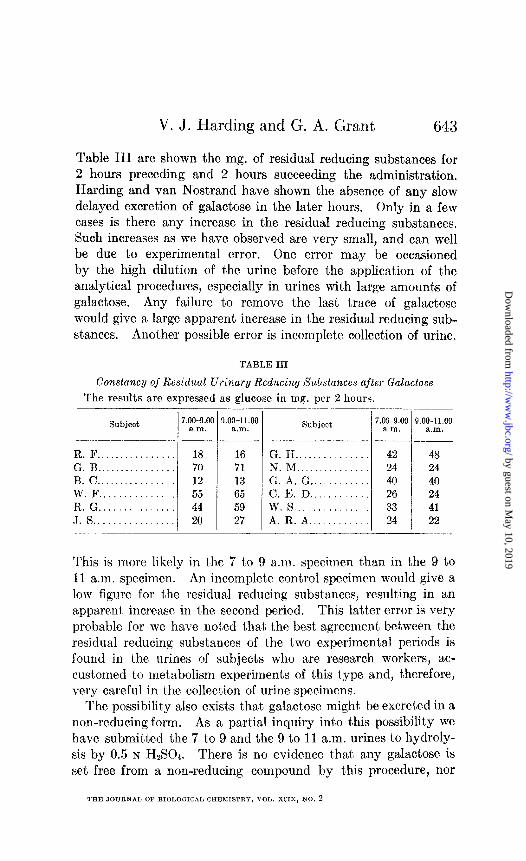
Table III are shown the mg. of residual reducing substances for 2 hours preceding and 2 hours succeeding the administration, Harding and van Nostrand have shown the absence of any slow delayed excretion of galactose in the later hours. Only in a few cases is there any increase in the residual reducing substances. Such increases as we have observed are very small, and can well be due to experimental error. One error may be occasioned by the high dilution of the urine before the application of the analytical procedures, especially in urines with large amounts of galactose. Any failure t’o remove the last trace of galactose would give a large apparent increase in the residual reducing sub- stances. Another possible error is incomplete collection of urine.
TABLE III
Constance/ of Residual Urinary Reducing Substances after Galaclose
The results a,re expressed as glucose in mg. per 2 hours.
Subject 7.00~g.oc a.m.
-_I .- R.F.. .............. 18 G. B ................ 70 B. c ................ 12 W.F ............... 55 R. G ............... 44 J. 8 ................ 20
I c
_
__- l.OO-11.00
a.m. --
16 71 13 65 59 27
Subject
G. H .............. N. M .............. G. A. G ........... C. E. D ........... w. 8 .............. A. R. A ...........
7.00~9.00 a.ln.
42 24 40 26 33 24
9.00-11.00 a.m.
.___
48 24 40 24 41 22
This is more likely in ths 7 t,o 9 a.m. specimen than in the 9 to 11 a.m. specimen. An incomplete control specimen would give a low figure for t,he residual reducing substances, resulting in a’n a,ppasent, increase in the second period. This lat,ter error is very probable for we have notled that tha best agreement, between. t)hc residual reducing substances of t,he two experimental periods is found in t,he urines of subjects who are research workers, ac- cust,omed to metabolism experiments of this t,ype and, t,herefore, very careful in the collection of urine specimens.
The possibility also es&s that, galactose might, be excreted in a non-reducing form. As a partial inquiry into this possibility we have submitt,ed the 7 to 9 and the 9 to 11 a.m. urines to hydroly- sis by 0.5 N HzS04. There is no evidence that any galactose is set free from a non-reducing compound by t’his procedure, nor
by guest on May 10, 2019
http://ww
w.jbc.org/
Dow
nloaded from

644 Metabolism of Galactose. I
of the product,ion of any large cxccss of reducing compounds in the 9 t’o 11 a.m. urine. These observations add weight to the argument of Harding and van Nostrand that galactose is a well utilized sugar.
Our experiments also supply further data on the question of a renal threshold for galactose. Folin and Berglund (26) had pointed out the practical non-existence of a threshold, on the basis t,hat very small doses of galactose produced extra urinary reducing substances. Goldblatt (24) also observed the excretion of galactose without noticing any rise in blood sugar. Rowe and Chandler (14), however, maintained the presence of a renal t,hreshold. Harding and van Nostrand (3) found excretory non- fermentable substances with little or no rise in venous blood sugar. The present results on arterial blood galactose and the 15 minute collection of samples make us positive that urinary galactose can occur with very little rise in blood galactose. In several of our experiments blood galactose does not rise over 10 mg. The smallest increase in blood galactose combined with its excretion occurred in Series D. Subject T. T. (not shown in Fig. 2), after the administration of 30 gm. of glucose + 40 gm. of galactose, had only 4 mg. of galactose per 100 cc. of arterial blood and the total 2 hour urinary excretion was 215 mg. If any renal threshold exists for galactose, it must be extremely low.
SUMMARY
A met,hod is described for the estimation of glucose, galactose, and residual reducing substances in 0.5 cc. of cutaneous blood.
The limits of blood galactose are noted after the ingestion of 40 gm. of galactose.
The peak of blood galactose in such galactose tolerance tests is from 30 t,o 60 minutes (inclusive). At the end of 2 hours the blood galactose has reached zero, or is only a very few mg. per 100 cc. The height of the peak of blood galactose is not usually more than 30 mg. per 100 cc. but occasional increases to 60 mg. are found in normal men.
The excretion of urinary galactose varies up to 2 gm. After ingestion of 80 gm. of galactose, both the height of the peak
and the duration of the blood galactose are increased. Urinary galactose is also increased.
by guest on May 10, 2019
http://ww
w.jbc.org/
Dow
nloaded from

V. J. Harding and G. A. Grant 645
Distinct arterial-venous differences in blood galactose can be found.
Galactose tolerance tests at 4.00 p.m. instead of under the usual fasting morning conditions show no unusual variations, even when the noon meal is carbohydrate or fat.
The addition of 30 gm. of glucose to 40 gm. of galactose lowers the height of both the galactemia and the galactosuria. The hyperglycemia also seems less than would be expected after the ingestion of 30 gm. of glucose alone.
Rises in blood glucose are often noted after the ingestion of galactose. The hyperglycemia does not appear dependent on the amount of galactose intake. The rise in blood glucose affords no proof of a direct rapid galactose-glucose conversion.
There is no evidence of the immediate formation in blood or urine of any reducing substance as an intermediate galactose metabolite.
Further evidence for the non-existence of a renal threshold for galactose is given.
BIBLIOGRAPHY
1. Blanco, J. G., .I. Biol. Chem., 79, 667 (1928). 2. Corley, R. C., J. Biol. Chem., 74, 1 (1927). 3. Harding, V. J., and van Nostrand, F. H., J. Biol. Chem., 86, 765 (1929-
30). 4. Roe, J. H., and Schwartzman, A. S., J. Biol. Chem., 96, 717 (1932). 5. Benedict, S. R., J. Biol. Chem., 92, 141 (1931). 6. Harding, V. J., and Grant, G. A., J. Biol. Chem., 94, 529 (1931). 7. Harding, V. J., Nicholson, T. F., and Grant, G. A., J. Biol. Chem., 99,
625 (1932-33). 8. Harding, V. J., and Downs, C. E., Canad. Chem. and Metal., 16, 12
(1932). 9. Spannuth, J. R., and Power, M. H., J. Biol. Chem., 93,343 (1931).
10. Harding, V. J., and Selby, D. L., Biochem. J., 26, 1815 (1931). 11. Bauer, R., Wien. med. Woch., 66, 2537 (1906). 12. Greene, C. H., Snell, A., and Walters, W., Arch. Int. Med., 36, 248 (1925). 13. Rowe, A. W., Endocrinology, 12, 1 (1928); 13, 327 (1929). 14. Rowe, A. W., and Chandler, J., Endocrinology, 8, 803 (1924). 15. Kahler, H., and Machold, K., Wien. klin. Woch., 36, 414 (1922). 16. Davies, D. T., Lancet, 1, 380 (1927). 17. Elmer, A. W., and Scheps, M., Lancel, 2, 187 (1930). 18. Bauer, R., and Wozasek, O., Wien. Arch. inn. Med., 16, 287 (1923). 19. Foster, G. L., Proc. Sot. Ezp. Blol. and Med., 19, 408 (1922).
by guest on May 10, 2019
http://ww
w.jbc.org/
Dow
nloaded from

Metabolism of Galactose. I
20. Foster, G. L., J. Biol. Chem., 66, 291, 303 (1923). 21. Reinhold, J. G., and Karr, W. G., J. Biol. Chem., 72, 345 (1927). 22. Corley, R. C., J. Biol. Chem., 76, 31 (1928). 23. Peters, J. P., and Van Slyke, D. D., Quantitative clinical chemistry, 1,
81, 86 (1931). Nagasuye, S., J. Biochem., Japan, 6, 449 (1925). Deuel, H. J., Jr., Gulick, M., and Butts, J. S., J. Biol. Chem., 98, 333 (1932).
24. Goldblatt, M. W., Biochem. .T., 19, 948 (1925). 25. Wierzuchowski, M., Pieskow, W., and Owsiany, E., Biochem. Z., 230,
146 (1931). Wierxuchowski, M., and Laniewski, M., Biochem. Z., 230, 173 (1931). Wierzuchowski, M., Biochem. Z., 230, 187 (1931); 237, 92 (1931).
26. Folin, O., and Berglund, H., J. BioZ. Chem., 51, 213 (1922). 27. Bodansky, M., J. BioZ. Chem., 66, 387 (1923). 28. Corley, R. C., J. BioZ. Chem., 74, 19 (1927). 29. Cori, C. F., and Cori, G. T., PTOC. Sot. Exp. Bfol. and Med., 26, 406
(1928). 30. Cori, C. F., J. BioZ. Chem., 70, 577 (1926). 31. Deuel, H. J., Jr., J. Biol. Chem., 76,367 (1927). Deuel, H. J., Jr., and
Chambers, W. H., J. BioZ. Chem., 66, 7 (1925). Cathcart, E. P., and Markowitz, J., J. Physiol., 63, 309 (1927).
32, Campbell, W. R., andMaltby, E. J., J. Clin. Inv., 6,303 (1928). Camp- bell, W. R., and Soskin, S., J. CZin. Znv., 6,291 (1928).
33. Friedenson, M., Rosenbaum, M. K., Thalheimer, E. J., and Peters, J. P., J. BioZ. Chem., 80, 269 (1928).
34. Cori, C. F., and Cori, C. T., Proc. Sot. Exp. Biol. and Med., 26,402 (1928). 35. Fishberg, E. H., J. BioZ. Chem., 86, 665 (1930). 36. Halberkann, J., and Kiihler, H., 2. physiol. Chem., 164, 34 (1926).
by guest on May 10, 2019
http://ww
w.jbc.org/
Dow
nloaded from

Victor John Harding and Gordon A. GrantGALACTOSE INGESTION
CUTANEOUS BLOOD SUGARS AFTER METABOLISM OF GALACTOSE: I.
1933, 99:629-646.J. Biol. Chem.
http://www.jbc.org/content/99/2/629.citation
Access the most updated version of this article at
Alerts:
When a correction for this article is posted•
When this article is cited•
alerts to choose from all of JBC's e-mailClick here
ml#ref-list-1
http://www.jbc.org/content/99/2/629.citation.full.htaccessed free atThis article cites 0 references, 0 of which can be
by guest on May 10, 2019
http://ww
w.jbc.org/
Dow
nloaded from