METABOLIC PHYSIOLOGY, DIGESTIVE … PHYSIOLOGY, DIGESTIVE EFFICIENCY AND ENERGETICS OF SOME...
120
METABOLIC PHYSIOLOGY, DIGESTIVE EFFICIENCY AND ENERGETICS OF SOME AUSTRALIAN PYTHONS Gavin S. Bedford, B.Ec (Flinders) Grad. Dip. Sc. Faculty of Science Northern Territory University A thesis submitted to the Northern Territory University in partial fulfilment of the requirements for the degree of Master of Science November, 1996
Transcript of METABOLIC PHYSIOLOGY, DIGESTIVE … PHYSIOLOGY, DIGESTIVE EFFICIENCY AND ENERGETICS OF SOME...
METABOLIC PHYSIOLOGY, DIGESTIVE EFFICIENCY AND ENERGETICS OF
SOME AUSTRALIAN PYTHONS
Gavin S. Bedford, B.Ec (Flinders) Grad. Dip. Sc.
Faculty of Science
Northern Territory University
A thesis submitted to the Northern Territory University in partial
fulfilment of the requirements for the degree of Master of Science
November, 1996
Statement of Sources
This thesis is my original work and has not been submitted, in whole or in part, for a degree at any other University. Nor does it contain, to the best of my knowledge and belief, any material published or written by another person, except as acknowledged in the text.
Signed , ;,; .. / I
/if__/ Gavin S. Bedford
ii

Acknowledgments
There is no-one to whom I am more indebted than Associate Professor Keith
Christian. He has made this project possible, and has helped in every
possible way from start to finish. I thank him for his patience, guidance,
advice and above all friendship.
I would like to thank Anna Padovan for her continued insistence and
obsession that we go fishing, no doubt it helped us to maintain our sanity in
the past few years. You can now stop catching bigger fish than me!
A few people made some constructive comments on this thesis, so I would
like to thank them in no specific order as every little bit helped. They include
Keith Christian, Tony O'Grady, Tim Schultz, Jonno Webb, Peter Harlow and
Rick Shine.
I would specifically like to thank Rick Shine and Peter Harlow for
encouragement over at least the past seven years.
A number of other people devoted much time and assistance where
possible, to them I am grateful, they include: Anna Padovan, Trevor and
Francoise Sullivan, Greg and Reg Fyfe, Thomas Madsen, Gary O'Connor,
Tim Schultz, Tony O'Grady, Peter Mirtcshin, Greg Johnston, Alan Thorne,
Steve and Terri Irwin, Wes Mannion, Peter Frappell. Dave Scammel, Peter
Whitehead, and others have helped from the Parks and Wildlife Commission
of the NT. To anyone who has helped in any number of ways and I have
failed to mention please accept my apology.
To mum and dad - one step at a time!
Permits.
Animals were collected under Parks and Wildlife Commission of the N.T.
permit number DASC9546. Animal Ethics Experimentation Committee
approval was granted.
iii
Abstract
Seven python taxa, two elapid species and one acrochordid were used
in laboratory experiments over two years. This study examined the metabolic
rates among species and temperatures, and also between seasons. Pythons
were used in feeding experiments to determine the extent of specific dynamic
action (SDA) at four temperatures. Digestive efficiency and energy budgets
were also determined for the pythons at each temperature.
Python metabolic rate follows the general allometric pattern for reptiles
but it is lower than in most other reptiles. The thermal sensitivity of metabolism is
similar to other reptiles. Standard metabolic rate (SMR) did not differ between
seasons or on a daily cycle. Preferred body temperatures are similar between
seasons for most pythons, although they did change for some non python
species.
An increase in metabolic rate associated with feeding in animals is
known as specific dynamic action. In this study the maximum increase due to
SDA was 42 times SMR, but the typical increase was about 7 times SMR. The
increase due to SDA, relative to SMR, was insensitive to temperature. The
magnitude of SDA was related to meal size when relatively small meals were
consumed (< 25% body mass), but the magnitude of SDA plateaued for relative
meal sizes >25% of body mass. This plateau occurred for a range of relative
food masses between 25 and 51 .1% body mass. The increase in peak
metabolic rate after feeding relative to SMR did not differ between the four
experimental temperatures. This may indicate that in pythons, activity of
digestive enzymes are temperature dependent and have a thermal sensitivity
similar to standard metabolic rate.
Digestive efficiency (DE) of pythons was much higher than all other
reptiles. Hair was removed from the initial analysis because it is indigestible. DE
iv
was insensitive to temperature, and was about 99% at all temperatures
examined.
The energy available to pythons from a meal decreased with increasing
temperature. This decline in energy available was due to increasing energy
costs associated with SMR and SDA. Empirical equations allow estimation of
the energy allocated to each of the components of the energy budget including
SMR, SDA, shedding, growth and activity. Pythons assimilate more energy per
gram of food ingested at low digesting temperatures due to the reduced
metabolic cost of SDA. This result suggests that digestion at lower temperatures
may be advantageous if food is scarce. However, at high temperatures,
digestion time is reduced, allowing more food to be ingested within a given time
compared to digestion at low temperatures. Although at high temperatures the
metabolic cost of SDA is high, it is possible for pythons to assimilate more
energy compared to digestion at lower temperatures by consuming more food
per unit time. This suggests that digestion at higher temperatures may be
advantageous if food is abundant.
v
---------------------------·-•-m-------------------
Table of Contents
Statement of Sources ii
Acknowledgements iii
Abstract iv
Table of Contents vi
List of Figures ix
List of Tables xi
Chapter 1 Generallntroduction .......................................................................... 1
Chapter 2 Standard Metabolic Rate in Pythons ......................................... 6
INTRODUCTION ................................................................................................... 6
METHODS ............................................................................................................ 8
RESULTS ............................................................................................................ 14
Standard metabolic rate comparisons among
species
Standard metabolic rate comparisons between
seasons
Daily cycles in metabolic rate at each
temperature
Seasonal preferred body temperature
Comparing preferred body temperatures among
species in the wet season
Comparing preferred body temperatures among
species in the dry season
Thermal sensitivity (010) in standard metabolic
rate
Allometric ralationships of standard metabolic rate
Comparison of SMR among species using mass
14
15
16
18
18
18
20
21
corrected data 21
DISCUSSION ..................................................................................................... 23
vi

Summary 30
Chapter 3 Metabolic and Thermogenic Effects of Feeding
by Pythons ........................................................................................... 32
INTRODUCTION ................................................................................................. 32
METHODS ........................................................................................................... 35
RESULTS ............................................................................................................ 38
Post-feeding - General trends
Increase in metabolic rate after feeding
Peak metabolic rate among species
Analysis of extremely large PMR/SMR ratios
Temperature increase after feeding
Specific dynamic action and mass of food
Relative meal sizes using pooled temperatures
Factorial increase in peak metabolic rate compared to body
mass
Duration of significant metabolic increase after feeding at two
38
39
42
42
43
44
44
44
temperatures 46
DISCUSSION ..................................................................................................... 46
Summary 54
Chapter 4 Digestive Efficiency in Some Australian
Pythons .................................................................................................. 55
INTRODUCTION ................................................................................................. 55
METHODS ........................................................................................................... 56
RESULTS ............................................................................................................ 59
Indigestible portion of food 59
Digestive efficiency 60
DISCUSSION ..................................................................................................... 63
Summary 65
vii
Chapter 5 Energy Budgets For Some Australian Pythons ........... ....... 66
INTRODUCTION ................................................................................................. 66
METHODS ........................................................................................................... 67
RESUL TS ............................................................................................................ 74
Energy in shed skin
Costs of metabolism after feeding
74
74
Python energetics at ambient temperatures 80
Cost of digestion for large meals 80
DISCUSSION ..................................................................................................... 83
Summary 88
Chapter 6 Synopsis and Research Implications ..................................... . 89
References 91
viii
List of Figures
Figure 3.1 General trend for metabolic rate after feeding at 24°C.
One standard error is represented by bars ...................................... 40
Figure 3.2 General trend for metabolic rate after feeding at 33°C.
One standard error is represented by bars ...................................... 40
Figure 3.3 General trend of the difference between body temperature and
ambient temperature as a function of days after feeding at 24°C.
One standard error is represented by bars ...................................... 41
Figure 3.4 General trend of the difference between body temperature and
ambient temperature as a function of days after feeding at 33°C.
One standard error is represented by bars ..................................... .41
Figure 3.5 Trends for peak metabolic rate and standard metabolic rate as a
function of chamber temperature. SMR (triangles) and PMR
(points) are shown on a log scale for V02 ml min-1 ...................... .45
Figure 3.6 Meal size categories compared to the ratio of PMRISMR
indicating the metabolic response to feeding reaches a plateau
with relative meal sizes >25% of body mass. Bars represent one
standard error ....................................................................................... 45
Figure 3.7 Standard metabolic rate ( Vo2 mL h-1) for pythons and for other
snakes, with their respective peak metabolic rates after feeding at
30°C. SMR of pythons are lower than other snake SMR, but
python PMR is higher than that of other snakes .............................. 51
ix
Figure 5.1 Percentage of energy used for growth (triangles) and activity
(crosses) as a function of chamber temperature, using the pooled
means from Table 5.3 .......................................................................... 78
Figure 5.2 Growth (g) for pooled species at each temperature (°C) after
the digestion of a 100 gram rodent. Taken from the data
presented in Table 5.3 ......................................................................... 79
Figure 5.3 Energy flow at 24 and 33°C for a python fed a 1 00 gram rat
(showing percentage (%) and energy (kJ) flows). The
energy costs (SMR and TSMRf) and benefits (growth and
activity) are shown, as taken from Table 5.4 .................................... 86
X
Table1.1
Table 2.1
Table 2.2
Table 2.3
Table 2.4
List of Tables
Quick reference definitions of the symbols used throughout the
following chapters ............................................................................... 3
Standard metabolic rate compared among species at each of
four temperatures (24, 27, 30 and 33°C) using ANCOVA and
ANOVA (mass corrected data). There were no differences
among species at any of the four temperatures. The results of
the two methods are similar ............................................................ 15
Standard metabolic rate between seasons at each of four
temperatures (24, 27, 30 and 33°C) analysed using ANCOVA
and ANOVA (mass corrected data). The results of the two
methods are similar. The probability values support the null
hypothesis that seasons do not differ at each temperature.
Probability values are not corrected for multiple
comparisons ...................................................................................... 15
Comparison of standard (SMR) and resting (RMR) metabolic
rates for ten taxa of Australian snakes using paired t-tests.
Mass and oxygen consumption ( Vo2 mL h'1) are presented as
means. In general, probability values support the null
hypothesis that there is no difference between SMR and RMR.
Probability values were not corrected for multiple comparisons .
............................................................................................................. 16
Preferred body temperatures (Tbpret,° C) of the snake taxa used
in this study during the dry and wet seasons. The climate of
their geographic distribution is broadly characterised. Means
xi
Table 2.5
Table 2.6
Table 2.7
Table 2.8
Table 2.9
Table 3.1
are presented with sample size, and standard deviations in
parentheses. Probability values are not corrected for multiple
comparisons ...................................................................................... 19
Thermal sensitivity of metabolism with increasing temperature.
The table shows 0 10 values calculated over the entire
temperature range 24 - 33°C ......................................................... 20
Thermal sensitivity of metabolism with increasing temperature.
The table shows 0 10 values calculated over two subsets of the
thermal range: temperatures below 30°C (24-30°C), and above
30°C (30-33°C) ............................................................................... -.. 21
Allometric equation MR =a M b was used to obtain SMA in
Vo2 mL·1 h., ...................................................................................... 21
Metabolic rates from the literature and this study in mass
corrected terms. Mass and metabolic rates are presented as
means ................................................................................................. 22
Energy saving per day from the change in thermoregulatory
behaviour between seasons for two snake species, assuming
Tbpret could be maintained for 12 hours per day ........................ 27
The ratio of the peak metabolic rate (PMR) and standard
metabolic rate (SMR) for all species at each of the four
temperatures ·compared using paired t-tests. The mean factorial
increase in metabolism associated with feeding for each
species is given. Sample sizes are noted and P values are
xii

Table 3.2
Table 3.3
Table 4.1
Table 4.2
Table 5.1
Table 5.2
given in bold ...................................................................................... 42
Difference between body temperatures (Tb) and chamber
temperatures two days after feeding. Means (°C) are presented
for the four cabinet temperatures with standard deviations in
parentheses ....................................................................................... 43
Metabolic rate each day after feeding was compared to SMR
with respect to two categories of meal size: meals <1 0% body
mass, and meals >25% body mass at 24 and 33°C. The larger
the relative meal mass, the longer post feeding metabolic rate
is elevated above standard metabolic rate .................................. 46
Digestive efficiency (DE%) and metabolizable energy (ME%)
were calculated including hair and excluding (*) hair. Means for
each snake taxa are presented with standard deviations in
parentheses ....................................................................................... 61
Mean passage time for each species at each temperature (°C).
Means are shown with sample size (n) and standard deviation
in parentheses .................................................................................. 62
Mean increase in metabolic rate (post-feeding metabolic rate I
SMA) at each temperature for each day following ingestion.
Days 1 - 5 include pooled data across python taxa. Data for
days 5 - 7 were taken from a smaller sample (n = 9). The table
lists sample size (n) and standard errors are shown in
brackets .............................................................................................. 70
The components of the energy budgets (from Kitchell and
Windell 1972) .................................................................................... 71
xiii

Table 5.3
Table 5.4
Energy budgets for each taxon of python at the four
experimental temperatures over a period of 14 days, including
each of the costs and the percentage of food used in growth.
Means are presented .............. : ........................................................ 76
Energy budgets for each taxon of python at the four
experimental temperatures over a period of 14 days, including
each of the costs and the percentage of food energy used in
growth and activity. Means are presented ................................... 82
xiv
Chapter 1
General Introduction
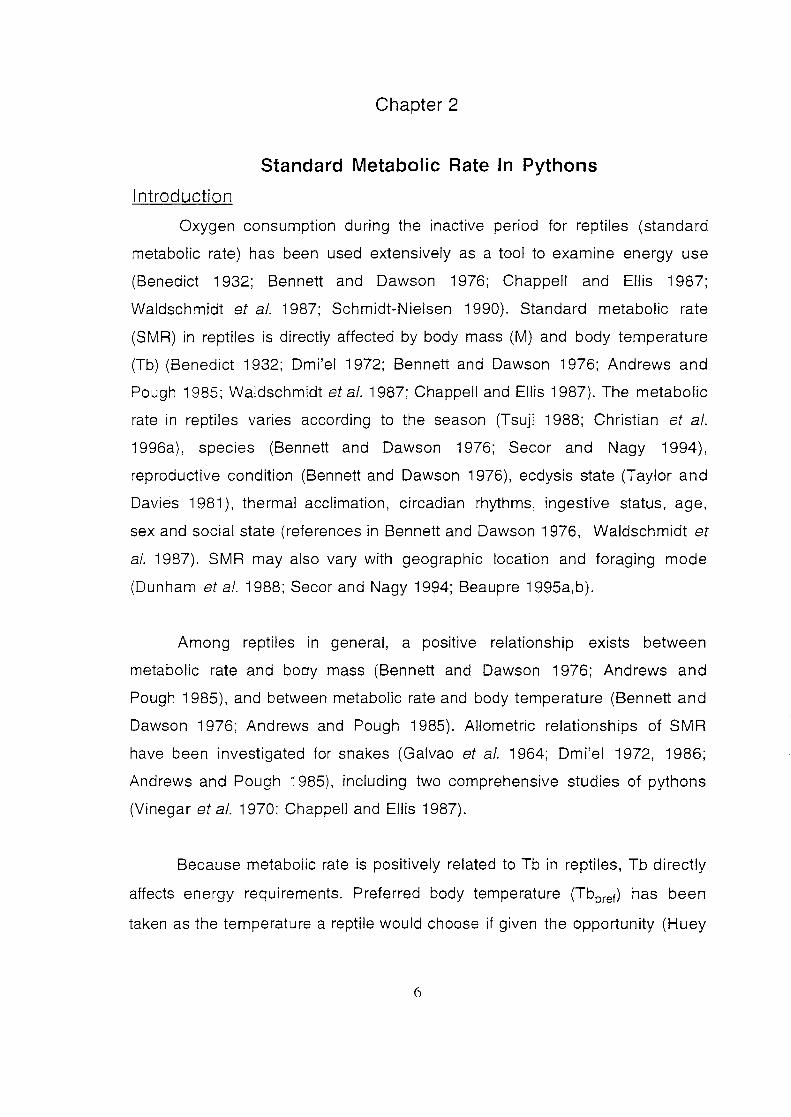
Reptiles are ectothermic vertebrates that occupy diverse temporal and
spatial niches, and have long been considered biologically distinct from
endotherms with respect to the amount of heat produced by the body (Lavoisier
and Laplace 1780, in Cassel and Casselman 1990). Thermoregulation by
reptiles has been a constant source of study si.nce the initial work recognising
shuttling behaviour of desert reptiles on the hot desert sands (Cowles and
Bogert 1944). The physiology of reptiles, such as standard metabolic rate,
digestion and activity metabolism, has only attracted serious research interest
in the past quarter of a century (Bennett and Dawson 1976; Waldschmidt eta/.
1987; Secor 1995).
Reptiles differ from endotherms in a number of significant physiological
attributes (reviewed by Bartholomew 1982). The body temperature of an
endotherm is maintained through endogenous means, ie: metabolic heat
maintains the body at a relatively high and constant temperature over a wide
range of ambient temperatures (Brody 1945; Schmidt-Nielsen 1990; Gilchrist
1995). When ambient temperatures rise above the thermal neutral zone,
energy metabolism is used to facilitate physiological processes which attempt
to overcome the increase in body temperature (Prosser 1991 ). Energy for
panting and sweating is used for evaporative cooling when the body is hot.
Similarly, endotherms use energy to increase metabolic heat production to
maintain a high body temperature (T b) by mechanisms such as shivering when
ambient temperature falls below the thermal neutral zone (Kleiber 1975;
Schmidt-Nielsen 1990; Cassel and Casselman 1990).

In reptiles metabolic rate is dependent, in part, on body temperature
(Avery 1982). Body temperatures, and therefore metabolic rate, are affected by
ambient temperature (Avery 1982). The pioneering work of Cowles and Bogert
(1944) demonstrated that reptiles can control body temperatures by their
behaviour. In addition to behavioural mechanisms, however, some reptiles are
able to influence body temperature to some extent by physiological
mechanisms (Benedict 1932; Vinegar et a/. 1970; Friar et a/. 1972;
Bartholomew 1982; Standora eta/. 1982).
Endotherms have resting metabolic rates 4-1 0 times higher than those
of reptiles of similar size (Else and Hulbert 1981; Hulbert and Else 1989). Also
ectotherms have little or no body insulation (eg: fat, fur or feathers), and the
heat created as a result of metabolism is readily lost to the environment (Porter
and Gates 1969; Bennett and Dawson 1976; Bartholomew 1982). Despite
these attributes, significant endogenous heat production has been recorded in
at least two reptile groups, the sea turtles and pythons (Bartholomew 1982). A
body temperature significantly higher than ambient temperature can be
attained through muscular activity in these groups (Friar eta/. 1972; Standora
et a/. 1982). It has been suggested that some varanid lizards are able to
maintain body temperature higher than ambient temperature (Bartholomew
and Tucker 1964), but the evidence is relatively weak (Christian pers. com.).
Pythons can increase metabolism and create significant amounts of heat
through 'shivering' for extended periods during incubation of eggs (Benedict
1932; Hutchison et a/. 1966; Vinegar et a/. 1970; Van Mierop and Barnard
1976, 1978; Harlow and Grigg 1984; Slip and Shine 1988a). In addition, the
metabolism of some pythons increases after feeding through the process of
specific dynamic action (SDA) (Benedict 1932; Vinegar eta/. 1970; Secor et a/.
1994; Secor 1995). Specific dynamic action is the metabolic increase due to
the digestive activity of the gut (Waldschmidt eta/. 1987; Secor 1995). In some
python species (Benedict 1932; Marcellini and Peters 1982; Secor pers.
comm.), but not in others (Slip and Shine 1988b), the increase in metabolism
due to SDA is coupled with an increase in body temperature.
The aim of this study was to investigate whether or not there is an
increase in metabolic rate and body temperature after feeding by some species
of Australian pythons. With a few exceptions (Slip and Shine 1988a,b,c,d,e,f;
Shine 1991; Cogger 1992; Shine and Fitzgerald 1996; Madsen and Shine
1996a,b; Shine and Madsen 1996), the general ecology of most species of
Australian python is poorly known. Little is known about the physiology of
Australian pythons (Harlow and Grigg 1984; Chappell and Ellis 1987).
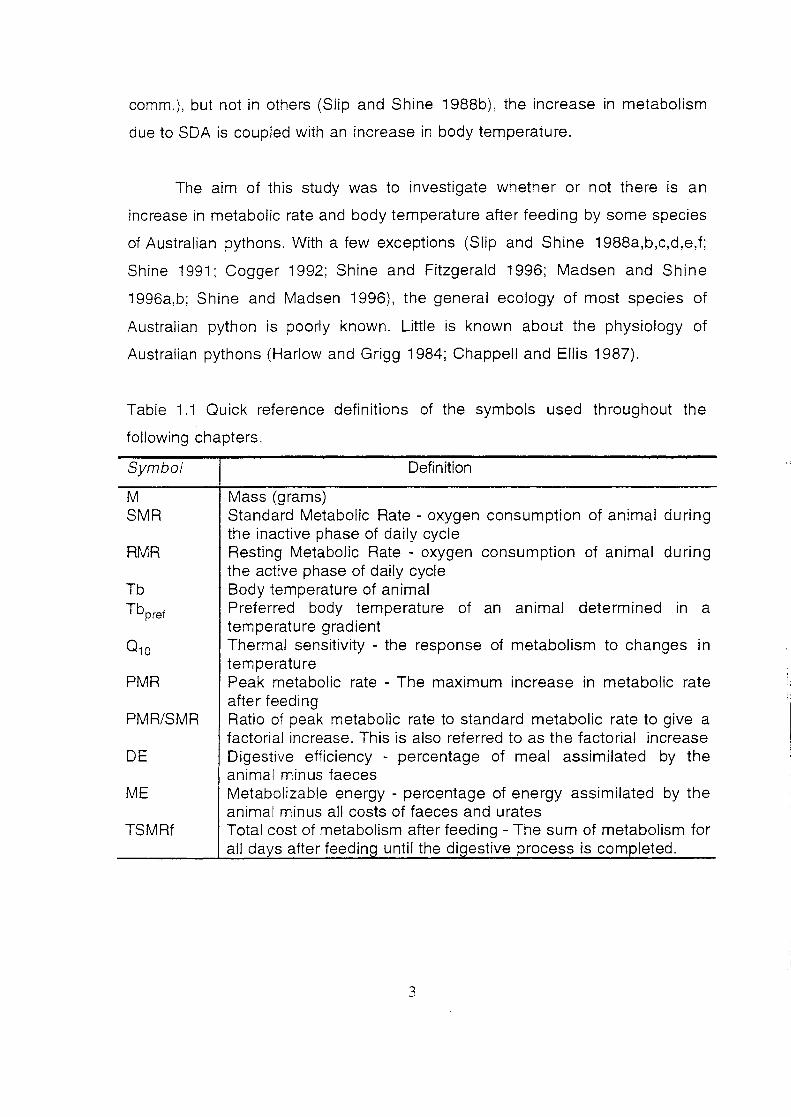
Table 1.1 Quick reference definitions of the symbols used throughout the
following chapters.
Symbol
M SMR
RMR
Tb
Tbpref
PMR
PMR/SMR
DE
ME
TSMRf
Definition
Mass (grams) Standard Metabolic Rate- oxygen consumption of animal during the inactive phase of daily cycle Resting Metabolic Rate - oxygen consumption of animal during the active phase of daily cycle Body temperature of animal Preferred body temperature of an animal determined in a temperature gradient Thermal sensitivity - the response of metabolism to changes in temperature Peak metabolic rate - The maximum increase in metabolic rate after feeding Ratio of peak metabolic rate to standard metabolic rate to give a factorial increase. This is also referred to as the factorial increase Digestive efficiency - percentage of meal assimilated by the animal minus faeces Metabolizable energy - percentage of energy assimilated by the animal minus all costs of faeces and urates Total cost of metabolism after feeding -The sum of metabolism for all days after feedin until the di estive process is completed.
3
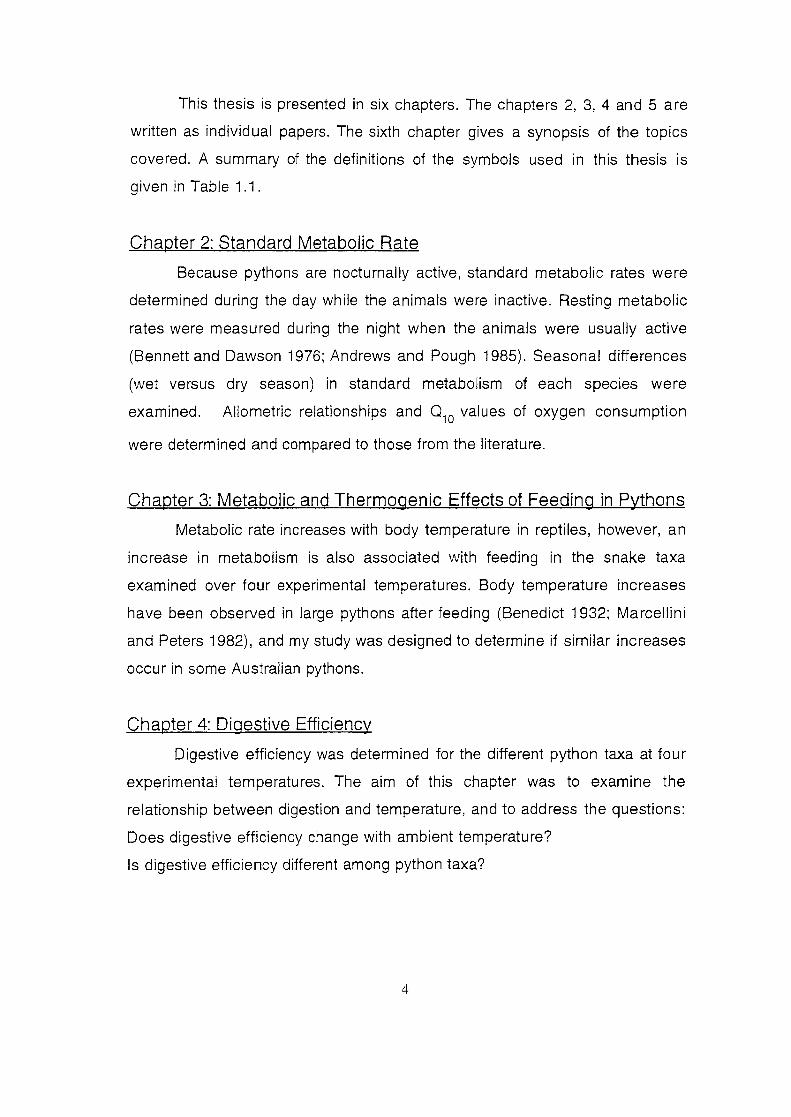
This thesis is presented in six chapters. The chapters 2, 3, 4 and 5 are
written as individual papers. The sixth chapter gives a synopsis of the topics
covered. A summary of the definitions of the symbols used in this thesis is
given in Table 1.1 .
Chapter 2: Standard Metabolic Rate
Because pythons are nocturnally active, standard metabolic rates were
determined during the day while the animals were inactive. Resting metabolic
rates were measured during the night when the animals were usually active
(Bennett and Dawson 1976; Andrews and Pough 1985). Seasonal differences
(wet versus dry season) in standard metabolism of each species were
examined. Allometric relationships and 0 10 values of oxygen consumption
were determined and compared to those from the literature.
Chapter 3: Metabolic and Thermogenic Effects of Feeding in Pythons
Metabolic rate increases with body temperature in reptiles, however, an
increase in metabolism is also associated with feeding in the snake taxa
examined over four experimental temperatures. Body temperature increases
have been observed in large pythons after feeding (Benedict 1932; Marcellini
and Peters 1982), and my study was designed to determine if similar increases
occur in some Australian pythons.
Chapter 4: Digestive Efficiency
Digestive efficiency was determined for the different python taxa at four
experimental temperatures. The aim of this chapter was to examine the
relationship between digestion and temperature, and to address the questions:
Does digestive efficiency change with ambient temperature?
Is digestive efficiency different among python taxa?
4

Chapter 5: Energy Budgets of Pythons
From information presented in the preceding chapters, an energy
budget was determined for each of the python taxa examined. The effects of
temperature and foraging mode are discussed with respect to these energy
budgets.
Chapter 6: Synopsis and Research Implications
This chapter reviews the specialised low energy attributes of pythons
and how the strategies outlined have implications for management and further
research.
5
Chapter 2
Standard Metabolic Rate In Pythons
Introduction
Oxygen consumption during the inactive period for reptiles (standard
metabolic rate) has been used extensively as a tool to examine energy use
(Benedict 1932; Bennett and Dawson 1976; Chappell and Ellis 1987;
Waldschmidt et a/. 1987; Schmidt-Nielsen 1990). Standard metabolic rate
(SMR) in reptiles is directly affected by body mass (M) and body temperature
(Tb) (Benedict 1932; Dmi'el 1972; Bennett and Dawson 1976; Andrews and
Pough 1985; Waldschmidt eta/. 1987; Chappell and Ellis 1987). The metabolic
rate in reptiles varies according to the season (Tsuji 1988; Christian et a/.
1996a), species (Bennett and Dawson 1976; Secor and Nagy 1994),
reproductive condition (Bennett and Dawson 1976), ecdysis state (Taylor and
Davies 1981 ), thermal acclimation, circadian rhythms, ingestive status, age,
sex and social state (references in Bennett and Dawson 1976, Waldschmidt et
a/. 1987). SMR may also vary with geographic location and foraging mode
(Dunham eta/. 1988; Secor and Nagy 1994; Beaupre 1995a,b ).
Among reptiles in general, a positive relationship exists between
metabolic rate and body mass (Bennett and Dawson 1976; Andrews and
Pough 1985), and between metabolic rate and body temperature (Bennett and
Dawson 1976; Andrews and Pough 1985). Allometric relationships of SMR
have been investigated for snakes (Galvao et a/. 1964; Dmi'el 1972, 1986;
Andrews and Pough 1985), including two comprehensive studies of pythons
(Vinegar eta/. 1970; Chappell and Ellis 1987).
Because metabolic rate is positively related to Tb in reptiles, Tb directly
affects energy requirements. Preferred body temperature (Tbpret) has been
taken as the temperature a reptile would choose if given the opportunity (Huey
6
1982). Preferred body temperature of reptiles varies between species (Dill
1972; Bennett and Dawson 1976; Heatwole and Taylor 1987; Rosen 1991;
Shine 1991) and seasonally (Hirth and King 1969; Scott eta/. 1982; Slip and
Shine 1988c; Rosen 1991; Christian and Bedford 1995) in many but not all
reptiles (Roberts 1964). By changing their seasonal body temperatures through
active thermoregulation, reptiles can influence their seasonal energy balance
(Christian eta/. 1996a,b).
Few studies have investigated the seasonality of activity and its
relationship to preferred body temperature and associated energy use (Avery
1982; Scott eta!. 1982; Secor and Nagy 1994; Christian eta/. 1996a,b). Most
such studies have focused on diurnal lizards (Bennett and Dawson 1976; Tsuji
1988; Christian eta!. 1983; reviewed in Christian and Bedford 1995). However,
evidence suggests that some snakes also exhibit a seasonal shift in Tbpret and
associated energy expenditure (Hirth and King 1969; Scott et a/. 1982; Slip
and Shine 1988c; Beaupre 1995b).
The foraging mode of lizards strongly influences SMR, such that 'actively
foraging' species use significantly more energy at rest than do 'sit and wait'
lizards (Bennett and Gleeson 1979; Huey and Pianka 1981 ). A similar pattern
was also observed among some snake species, with 'active' foraging species
having higher SMR than 'sit and wait' foragers (Anderson and Karasov 1981;
Secor and Nagy 1994). Indeed, Secor and Nagy (1994) found that the SMR of
a diurnal, 'active' foraging colubrid snake (Masticophis) was twice as high as
that of a 'sit and wait' foraging sidewinder rattlesnake (Crotalis). My study takes
advantage of the fact that Australia has ecological analogues to these colubrid
and viperid species. For example, all pythons excluding Aspidites
melanocephalus appear to rely primarily on 'sit and wait' predation, as does
the death adder (Acanthophis prae!ongus) (Mirtschin and Davis 1992). In
contrast, the black-headed python (Aspidites melanocepha/us) appears to be
an active foraging species (pers. obs.), and the western brown snake
7
(Pseudonaja nucha/is) is an 'active' foraging species of snake (Mirtschin and
Davis 1 992). Some python species use both foraging modes when conditions
allow, although the genus More/ia appears to be exclusively 'sit and wait' (Slip
and Shine 1988d; pers. obs.).
I chose to focus primarily on pythons for this study because some
pythons show significant increases in metabolic rates after feeding (Benedict
1932). However, these animals are also of interest because they exhibit
differing foraging modes, from the 'active' foraging A. melanocephalus to the
'sit and wait' foraging Morelia s. spilota (Shine 1991 ). Pythons also display
significant geographic variation in thermoregulatory strategies (Shine 1991;
Greer 1997 in prep.).
The principal aims of this chapter are to report SMA of several Australian
python taxa and to examine these with respect to seasonal variation, daily
variation, allometric scaling and thermal sensitivity. I also investigate whether
the preferred body temperature varies between seasons, and if so, the degree
to which this variation affects the animals' overall rate of energy use.
Methods
Study animals
I measured the SMA of seven taxa of Australian pythons, two species of
Australian elapid snakes and one acrochordid snake. The python taxa were:
children's python (Liasis childreni), stimson python (Liasis stimsoni), carpet
python(Morelia spilota variegata), diamond python(More/ia s. spilota), black
headed python (Aspidites melanocepha/us), water python (Liasis fuscus) and
olive python (Liasis o/ivaceus). The two elapid species were the northern death
adder (Acanthophis praelongus) and the western brown snake (Pseudonaja
nucha/is). Standard metabolic rates were also determined for the file snake
(Acrochordus arafurae) during the late wet season (March/April).
8

Five of the python species (Uasis childreni, L. fuscus, L. olivaceus,
Aspidites melanocephalus, More!ia spilota variegata) were caught by hand in
the wet/dry tropics and were housed in an outside animal house in individual
cages which were subject to the environmental conditions and photoperiod of
Darwin, Northern Territory, Australia. The stimson pythons (Liasis stimsoni)
were caught near Alice Springs in central Australia but were housed in Darwin
as long-term captives. Long-term captive-bred diamond pythons (Morelia s.
spi/ota) were obtained from the region of Sydney, New South Wales, where the
climate is characterised as sub-humid (Slip and Shine 1988a,b,c,d,e; Ayers
1992). Death adders were caught from the Hayes Creek area 130 km south of
Darwin. The western brown snakes (P. nucha/is) were caught in the Darwin
region. File snakes were captured during the late wet season while they were
migrating upstream at Scott Creek Crossing, Marrakai Station, 70 km east of
Darwin.
Seasonal tropical climate
The wet season (December to March) is characterised by high humidity
and minimum and maximum temperatures of 25.3°C and 33.1 oc (means from
Darwin). The dry season (May to October) has a cooler minimum of about
19.0°C and a maximum of 30.4°C (unpublished data compiled and supplied by
the Bureau of Meteorology, Darwin). Approximately 80% of the mean annual
rainfall of 1600 mm falls in the four month "wet season" from December to
March (Taylor and Tulloch 1985).
Measurement of 0 2 consumption
Standard metabolic rates were determined by measurement of oxygen
consumption in an open flow system. Animals were weighed to the nearest
gram (Bonso: Hong Kong) and individually placed in clear perspex chambers
with tight fitting lids (32.5 x 32.5 x 15 em). An air inlet hose entered near the
base of the box and the exit hose through which the air sample was drawn was
placed in the opposite corner on the lid of the chamber. The flow of air through
9
each of the animal chambers was maintained by Reciprotor 506r (Denmark)
pumps. The volume of air was measured by Toptrak (Sierra Instruments, USA)
flow meters of 1 L or 10 L capacity. Three animals were monitored concurrently
in a temperature-controlled cabinet (Forma Scientific or Thermoline). Resting
metabolic rates (RMR) and SMR were measured at four experimental
temperatures (24, 27, 30 and 33°C). The variation of temperature within the
cabinet was ± 0.5°C (Christian eta/. 1996a).
Air was drawn from the room in a 10 mm PVC tube, through the chamber
containing the animal, through a drying column (silica gel), through the air
pump, and out into the room. A thin flexible PVC sample hose was inserted 30
em into the larger hose so that the air was sampled before the bulk of it emptied
into the room. Flow meters were calibrated periodically using a soap bubble
burette (Long and Ireland 1985), but the factory calibration was accurate in all
cases. Flow was varied according to the size of the animal and temperature,
ranging from 80 ml min·1 for animals less than 100 grams at 24°C up to 1.5 L
min·1 for animals over 4 kg at 33°C.
Air samples from the animal chamber and the room air (at 1.8 meters
above the floor) were drawn through an R-2 pump (Ametek, Pittsburgh, PA.),
into an Applied Electrochemistry S-3A/Il oxygen analyser (Ametek, Pittsburgh,
PA.). Before passing into the oxygen sensor, both samples (animal and control
room air) were further dried with a column of desiccant (Drierite, USA), then
passed through a column of C02 absorbent (Dragersorb 800, Germany),
following the methods of Christian et a/. (1996a). Oxygen consumption was
converted to units of energy using a factor of 19.35 J ml Oi1 (Nagy 1983;
Schmidt-Nielsen 1990). Oxygen concentration in room air was taken as 20.94
% (Schmidt-Nielsen 1990).
Each of the chambers was sampled for two hours in every six hour
period. A controller-activated solenoid switch (ECC50; SMC Corporation,
10
Japan) was connected to determine which samples were pumped into the
oxygen analyser. Initially all oxygen measurements were recorded on a three
channel ABB SE120 paper chart recorder, but for the last 20 months of the
study I recorded all data with a Maclab (8e, ADinstruments: Australia) system
connected to a Macintosh LC4 75 computer. Data were collected at the rate of
one record every 25 seconds. The Maclab system recorded flow rates and
oxygen consumption. SMR was determined for each species in both the wet
and dry seasons. RMR was determined for the wet season only.
Measurements of preferred body temperature (TbpretJ
Animals were placed individually in a temperature gradient during the
wet and the dry season to determine the preferred body temperature (Tbpret)·
The thermal gradient consisted of a large aquarium (1.8m long x 0.5m high
and 0.4m wide). At one end of the gradient was either a 150 watt clear globe or
a 120 watt infrared globe (Phillips SEI20). The temperature in the gradient
ranged from 22.5°C to 65°C. Crumpled paper was placed in the bottom of the
thermal gradient so that nocturnal pythons could hide under cover, but still
obtain heat from the substrate. Body temperatures were taken from each
animal over three to five days at random intervals during the day using a
Raynger 2EM infrared thermometer (Raytek Inc. USA). Spot checks of core
body temperatures taken with a Fluke 51 type K thermocouple thermometer
(Fluke USA, Inc.) revealed negligible (<0.2°C) difference between cloacal and
surface temperatures (as measured with the infrared thermometer). All animals
were measured when in a fasted state (Secor and Diamond 1995).
Thermal sensitivity and allometry
Thermal sensitivity (010) is the rate at which oxygen consumption
increases as temperature increases by 1 ooc (Bennett and Dawson 1976). This
was determined over a range of 24-33°C using pooled data of all python taxa,
because sample sizes were too small for individual taxon comparisons.
I 1
0 10 levels were determined using the equation:
Log 0 10 = (log V02 (2) -log Vo2 (I) x 10/ (t2-t1))"1 (I)
(Schmidt-Nielsen 1990) where t1 and t2 are the low and high temperatures at
which the Vo2(i) and Vo2 (2) were measured.
Allometric relationships were determined at each of the four
temperatures using pooled data so that a large range of body mass could be
analysed using the equation:
. b SMR (as Y02 ml h"1) =aM
where mass is in grams, a is an empirically determined constant for the
metabolic rate of a I gram animal, and b is the slope of the regression line for
oxygen consumption on a double logarithmic scale (Bennett and Dawson
1976).
Energy saving due to a change in Tbpret
Two species of snakes which exhibited a shift in Tbpref between seasons
were used to quantify the magnitude of the energy saving resulting from the
shift. The mean metabolic rates of the snakes were determined at each
temperature then converted to an energy value (kJ d"1), and presented in
percentage terms.
Statistical analyses
Oxygen consumption data were analysed in 30-minute blocks
corresponding with the period when oxygen consumption was lowest.
Data were tested for normality using a Kolomogorov-Smirnov test. Each
species was tested individually over the four temperatures of 24, 27, 30 and
11
33°C for the wet and the dry seasons separately, and all the data were
normally distributed. All data were subjected to Bartlett's test for homogeneity
of variances. Because oxygen consumption rate varies with body mass, the
use of mass as a covariate is appropriate. All analyses of variance and
covariance were calculated using log-transformed data unless stated
otherwise (Zar 1984). Probability is given within 95% confidence intervals.
The assumption of independence of samples for analysis of variance
(Zar 1984) was violated in some parts of this study. My data on SMR between
seasons are based primarily on independent samples (i.e.; different individuals
tested in each season), but for a few species I was unable to obtain sufficient
animals. In these cases, I measured oxygen consumption rates on the same
snakes in each season. This non independence does not necessarily
introduce any significant problems in statistical analysis, so long as either: a)
animals are only used once (equal n' s) at any temperature, or b) variances
across repeated measures of the same individual are similar in magnitude to
the variances between individuals (Leger and Didrichson 1994).
Data for SMR among species and between seasons were treated as
independent samples because both of the above-mentioned conditions were
met, and the data were analysed using analysis of covariance (ANCOVA).
Mass correcting the data was used as an alternative to ANCOVA to compare
among species and between seasons at each temperature. The data were
corrected for mass using the equation "mass specific metabolic rate" = log 1 0
(SMR/Body Mass\ where x is the slope of the allometric equation for
metabolism (Garland eta!. 1987; Potvin eta/. 1990). Mass corrected data were
analysed using analysis of variance (ANOVA). These two similar methods
were used for ease of comparison with published results.
Standard and resting metabolic rates were analysed using paired t-tests
for all species at all temperatures. A. arafurae were measured once with their
13

bodies supported in water and a second time out of the water. Standard and
resting metabolic rates were compared for A. arafurae in and out of the water at
2JCC using paired t-tests.
Preferred body temperatures among species and between seasons
were analysed using a 2 factor analysis of variance (ANOVA). 0 10 and
allometric equations were determined by regression analysis.
Some metabolic data for pythons and boas in the literature have been
mass-corrected (Garland eta/. 1987) and these data were compared (at a body
temperature of 30°C) to the results of this study. A one-sample t- test was used
for this comparison, with the metabolic rate from the literature as an expected
value.
Results
Standard metabolic rate comparisons among species
To determine if there is a species difference in SMR the data were
compared at each of the four experimental temperatures. There were no
differences among species with respect to SMR at each temperature (Table
2.1 ). Similarly, when the data were corrected for mass using the methods of
Garland eta/. (1987) and analysed using ANOVA, no significant species effect
was found in SMR at any of the four temperatures (Table 2.1 ).
14
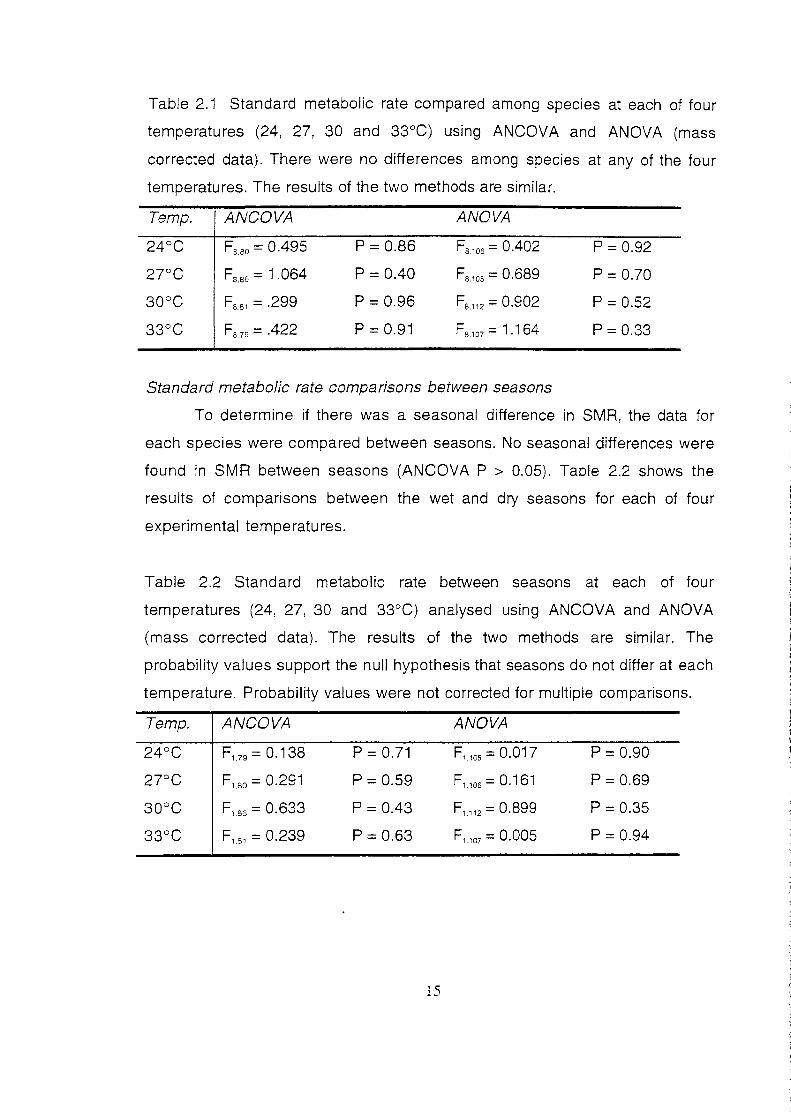
Table 2.1 Standard metabolic rate compared among species at each of four
temperatures (24, 27, 30 and 33°C) using ANCOVA and ANOVA (mass
corrected data). There were no differences among species at any of the four
temperatures. The results of the two methods are similar.
Temp. ANCOVA ANOVA
24°C Fa. so = 0.495 p = 0.86 Fa,oe = 0.402 p = 0.92
27°C Fa.se = 1.064 p = 0.40 Fs.1os = 0.689 p = 0.70
30°C F88 , = .299 p = 0.96 Fs.112 = 0.902 p = 0.52
33°C Fa 79 = .422 p = 0.91 F8 , 07 = 1.164 p = 0.33
Standard metabolic rate comparisons between seasons
To determine if there was a seasonal difference in SMR, the data for
each species were compared between seasons. No seasonal differences were
found in SMR between seasons (ANCOVA P > 0.05). Table 2.2 shows the
results of comparisons between the wet and dry seasons for each of four
experimental temperatures.
Table 2.2 Standard metabolic rate between seasons at each of four
temperatures (24, 27, 30 and 33°C) analysed using ANCOVA and ANOVA
(mass corrected data). The results of the two methods are similar. The
probability values support the null hypothesis that seasons do not differ at each
temperature. Probability values were not corrected for multiple comparisons.
Temp. ANCOVA ANOVA
24°C F,yg = 0.138 p = 0.71 F1105 = 0.017 p = 0.90
27°C F, 80 = 0.291 p = 0.59 F,_, 06 = 0.161 p = 0.69
30°C F,86 = 0.633 p = 0.43 F,,,2 = 0.899 p = 0.35
33°C F, 8 , = 0.239 p = 0.63 F, 1o7 = 0.005 p = 0.94
15

Daily cycles in metabolic rate at each temperature
Rates of oxygen consumption for each species were monitored over the
inactive (SMR) and active (RMR) phases of the daily cycle. These two periods
were compared using paired t-tests and the results are presented in Table 2.3.
Resting metabolic rate was significantly higher than SMR in A. arafurae at
30°C (P = 0.025) but not at the lower temperature of 27°C (P >0.05). RMR was
higher than SMR for L. fuscus (P = 0.026) at 33°C. The RMR for M.s. variegata
was higher than SMR at 2JCC (P = 0.046).
Table 2.3 Comparison of standard (SMR) and resting (RMR) metabolic rates for
ten taxa of Australian snakes using paired t-tests. Mass and oxygen
consumption ( Y02 ml h'1) are presented as means. In general, probability
values support the null hypothesis that there is no difference between SMR
and RMR. Probability values were not corrected for multiple comparisons.
SRecies
A. arafurae
....
A. melanoc.
A. praelongus
L. chi/dreni
27 4
27 4
30 4
24 3
27 3
30 3
33 3
24 3
27 3
30 3
33 3
24 8
27 6
30 8
33 6
1047.7
1047.7
1047.7
1027.5
1027.5
1027.5
1027.5
105.5
105.5
105.5
105.5
331.7
372.6
331.7
372.5
SMR
V02mlh.,
28.38
32.64
24.66
37.80
55.20
74.88
103.56
3.84
5.40
5.04
7.32
15.54
18.00
18.24
25.80
47.40
64.44
96.36
1.20
3.24
1.98
3.30
11.52 7.56
18.18 9.36
24.24 12.96
34.02 21.42
16
RMR
V02mlh.,
30.24
32.46
44.52
31.08
46.38
69.84
89 .. 52
4.32
5.22
4.74
5.94
16.98
17.88
21.90
32.94
p
5.76 0.87
21.18 0.96
23.76 0.03*
19.14 0.22
36.00 0.32
55.92 0.43
84.48 0.24
1.14 0.71
1.56 0.87
2.16 0.29
2.34 0.21
13.08 0.17
8.16 0.78
14.10 0.08
23.28 0.54

L. fuscus
L. macu/osus
L. o/ivaceus
24 4
27 4
30 4
33 4
24 3
27 3
30 3
33 3
24 6
27 6
30 5
33 6
L. stimsoni 24 3
27 3
30 5
33 4
M. s. spilota 24 4
27 4
30 4
33 4
M. s. variegata 24 8
27 7
30 7
P. nucha/is
all data at
each
temperature
33 5
24 3
27 3
30 3
33 3
24 51
27 52
30 52
1306.9
1306.9
1306.9
1306.9
139.4
139.4
139.4
139.4
3000.7
3000.7
3323.2
3000.7
360.7
360.7
349.9
371.8
1516.5
1516.5
1516.5
1516.5
1938.4
2170.0
2173.5
2828.7
214.1
214.1
214.1
214.1
1252.1
1146.0
1090.3
33 44 1186.0
* indicates a significant result.
18.90 7.20
23.28 10.14
29.34 11.16
52.50 19.86
5.04 5.52
5.94 1.50
7.38 1.92
9.24 2.40
44.94 24.36
77.04 49.02
111.42 48.42
103.5
21.60
18.72
20.22
29.52
43.08
63.24
81.30
78.18
50.52
67.74
12.90
4.80
9.96
6.84
7.92
3.72
48.60
9.84
49.92
64.08 64.32
57.84 58.14
125.52 112.44
7.92 2.28
11.16 4.32
14.4 4.20
15.90 5.04
27.00 27.06
36.42 38.04
41.76 42.90
59.16 63.42
** compares file snakes out of the water.
17
19.32 7.20 0.79
27.30 10.02 0.40
35.88 14.22 0.11
66.30 19.68 0.03*
5.34 1.86 0.47
6.12 1.08 0.82
7.62 1.92 0.15
10.02 3.30 0.34
61.50 30.66 0.05
76.98 42.24 0.99
119.40 61.98 0.39
112.92
14.10
18.36
17.64
21.00
36.72
52.50
55.38
83.64
53.58
76.32 0.14
6.96 0.58
4.92 0.92
5.58 0.43
3.60 0.11
14.46 0.47
14.10 0.23
24.18 0.12
5.58 0.51
55.14 0.45
67.08 65.64 0.05*
57.12 58.14 0.60
148.38 132.12 0.13
13.08 10.02 0.37
12.42 7.74 0.59
20.58 12.24 0.32
17.34 7.08 0.37
28.44 29.76 0.53
35.58 36.66 0.50
41 .40 44.04 0.87
62.82 71 .16 0.11
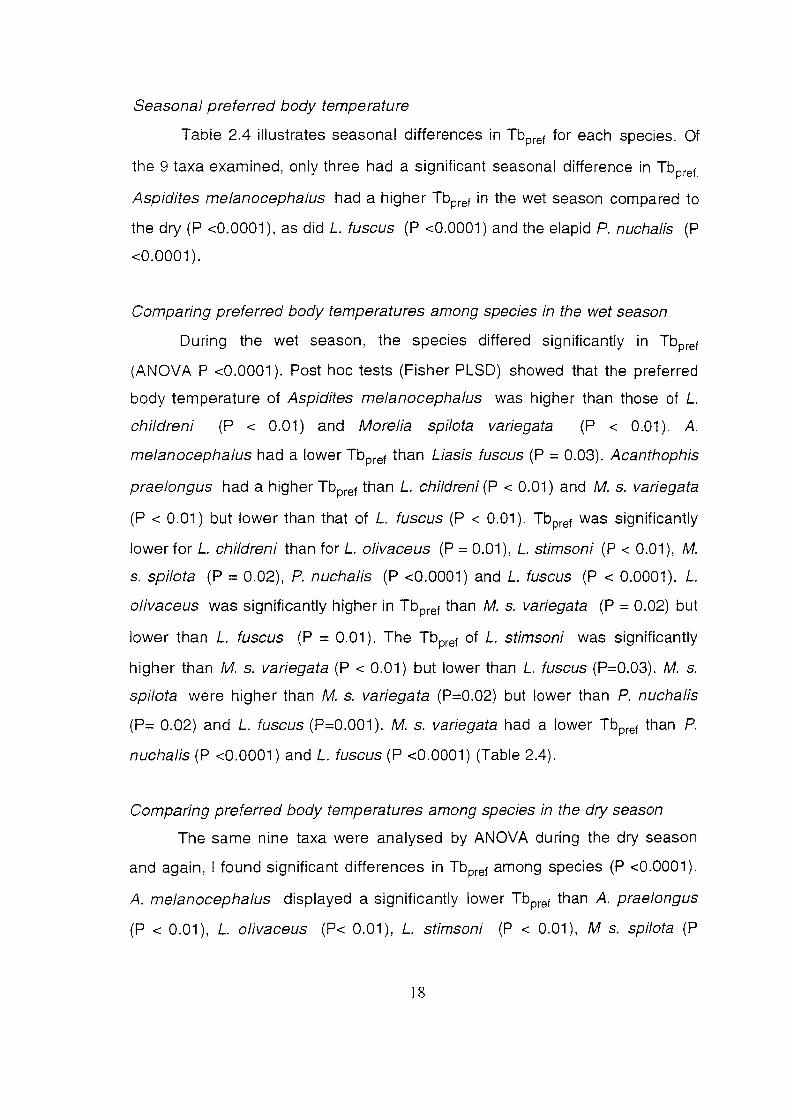
Seasonal preferred body temperature
Table 2.4 illustrates seasonal differences in Tbpret for each species. Of
the 9 taxa examined, only three had a significant seasonal difference in Tbpref.
Aspidites melanocepha/us had a higher Tbpref in the wet season compared to
the dry (P <0.0001 ), as did L. fuscus (P <0.0001) and the elapid P. nucha/is (P
<0.0001).
Comparing preferred body temperatures among species in the wet season
During the wet season, the species differed significantly in Tbpret
(AN OVA P <0.0001 ). Post hoc tests (Fisher PLSD) showed that the preferred
body temperature of Aspidites melanocephalus was higher than those of L.
childreni (P < 0.01) and More/ia spilota variegata (P < 0.01 ). A.
melanocephalus had a lower Tbpret than Liasis fuscus (P = 0.03). Acanthophis
praelongus had a higher Tbpret than L. childreni (P < 0.01) and M. s. variegata
(P < 0.01) but lower than that of L. fuscus (P < 0.01 ). Tbpret was significantly
lower for L. childreni than for L. olivaceus (P = 0.01 ), L. stimsoni (P < 0.01 ), M.
s. spilota (P = 0.02), P. nucha/is (P <0.0001) and L. fuscus (P < 0.0001 ). L.
olivaceus was significantly higher in Tbpref than M. s. variegata (P = 0.02) but
lower than L. fuscus (P = 0.01 ). The Tbpret of L. stimsoni was significantly
higher than M. s. variegata (P < 0.01) but lower than L. fuscus (P=0.03). M. s.
spilota were higher than M. s. variegata (P=0.02) but lower than P. nucha/is
(P= 0.02) and L. fuscus (P=0.001 ). M. s. variegata had a lower Tbpret than P.
nucha/is (P <0.0001) and L. fuscus (P <0.0001) (Table 2.4).
Comparing preferred body temperatures among species in the dry season
The same nine taxa were analysed by ANOVA during the dry season
and again, I found significant differences in Tbpref among species (P <0.0001).
A. melanocephalus displayed a significantly lower Tbpret than A. praelongus
(P < 0.01 ), L. olivaceus (P< 0.01 ), L. stimsoni (P < 0.01 ), M s. spilota (P
18

<0.0001 ), P. nucha/is (P = 0.03) and L. fuscus (P < 0.01 ). L. childreni had
significantly lower Tbpref than L. stimsoni (P = 0.02) and M. s. spilota (P = 0.03), but L. childreni were not significantly different from the other species. L.
stimsoni exhibited a significantly higher Tbpref than M. s. variegata (P < 0.01 ),
P. nucha/is (P < 0.01) L. fuscus (P = 0.03). M. s. spilota had a higher Tbpref
than M. s. variegata (P < 0.01) and P. nucha/is (P = 0.01 ).
Table 2.4 Preferred body temperatures (Tbpret oc) of the snake taxa used in
this study during the dry and wet seasons. The climate of their geographic
distribution is broadly characterised. Means are presented with sample size of
the number of individuals used, and standard deviations in parentheses.
Probability values are not corrected for multiple comparisons.
Species Climate
Mean oc Aspidites Tropical melanocephalus Liasis childreni Tropical
L. fuscus Tropical
L. olivaceus Tropical
L. stimsoni Arid-Temperate
Morelia s. spilota Sub-humid
M.s. variegata Temperate-Tropical
P. nucha/is Tropical
A. praelongus Tropical
28.1 (4, 3.4) 29.5 (3, 3.2) 30.0 (6, 3.9) 30.6 (4, 2.8) 31.5 (3, 2.9 31.3 (3, 2.8) 29.1 (3, 2.2) 29.6 (3, 2.1) 30.3 (3, 4.5)
19
Wet Tbpref Wet vs Dry (oC)
31.7 P<0.01 (3, 2.5) 29.3 p = 0.85 (3, 3.3) 33.0 p < 0.01 (4, 2.2) 31.2 p = 0.30 (3, 1.7) 31.5 p = 0.96 (3, 3.0) 31.0 p = 0.48 (4, 1.6) 29.5 p = 0.54 (4, 2.4) 32.5 p < 0.01 (3, 1 .9) 33.7 p = 0.25 (3,3.1)
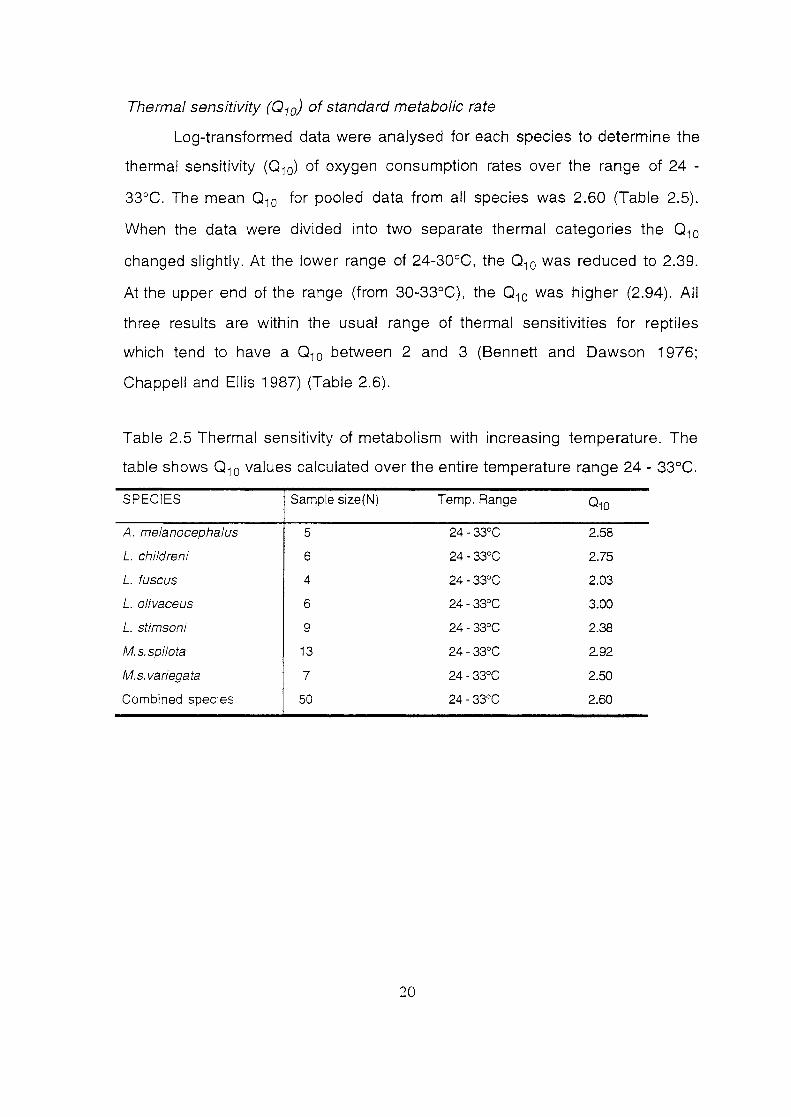
Thermal sensitivity (010) of standard metabolic rate
Log-transformed data were analysed for each species to determine the
thermal sensitivity (010) of oxygen consumption rates over the range of 24 -
33°C. The mean 0 10 for pooled data from all species was 2.60 (Table 2.5).
When the data were divided into two separate thermal categories the 0 10
changed slightly. At the lower range of 24-30°C, the 0 10 was reduced to 2.39.
At the upper end of the range (from 30-33°C), the 0 10 was higher (2.94). All
three results are within the usual range of thermal sensitivities for reptiles
which tend to have a 0 10 between 2 and 3 (Bennett and Dawson 1976;
Chappell and Ellis 1987) (Table 2.6).
Table 2.5 Thermal sensitivity of metabolism with increasing temperature. The
table shows 0 10 values calculated over the entire temperature range 24 - 33°C.
SPECIES Sample size(N) Temp. Range 010
A. melanocephalus 5 24- 33°C 2.58
L. childreni 6 24- 33°C 2.75
L. fuscus 4 24- 33°C 2.03
L. o/ivaceus 6 24- 33°C 3.00
L. stimsoni 9 24- 33°C 2.38
M.s.spilota 13 24- 33°C 2.92
M.s. variegata 7 24- 33°C 2.50
Combined species 50 24- 33°C 2.60
20
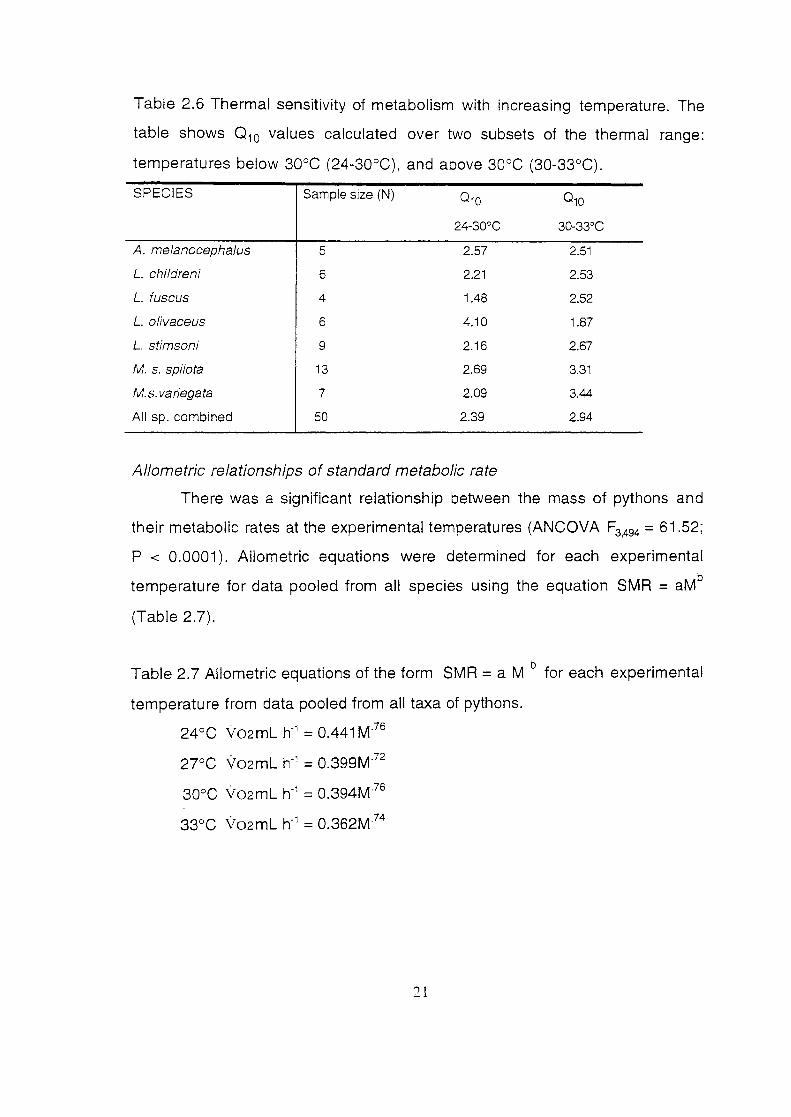
Table 2.6 Thermal sensitivity of metabolism with increasing temperature. The
table shows 0 10 values calculated over two subsets of the thermal range:
temperatures below 30°C (24-30°C), and above 30°C (30-33°C).
SPECIES Sample size (N) 010 010
24-30°C 30-33°C
A. melanocephalus 5 2.57 2.51
L. childreni 6 2.21 2.53
L. fuscus 4 1.48 2.52
L. olivaceus 6 4.10 1.87
L. stimsoni 9 2.16 2.67
M. s. spilota 13 2.69 3.31
M.s. variegata 7 2.09 3.44
All sp. combined 50 2.39 2.94
Allometric relationships of standard metabolic rate
There was a significant relationship between the mass of pythons and
their metabolic rates at the experimental temperatures (ANCOVA F3494 = 61.52;
P < 0.0001 ). Allometric equations were determined for each experimental
temperature for data pooled from all species using the equation SMR = aMb
(Table 2.7).
Table 2.7 Allometric equations of the form SMR =a M b for each experimental
temperature from data pooled from all taxa of pythons.
24 oc Yo2 mL h"1 = 0.441 M·76
2JCC Yo2mL h"1 = 0.399M"72
30°C V02mL h"1 = 0.394M'76
33°C Vo2mL h"1 = 0.362M74
21

Comparison of SMA among species using mass corrected data
Using SMR data from the literature, information on several boid species
was compared to the results obtained in my study using one-group t-tests.
Table 2.8 presents the metabolic data in original and mass-corrected form.
Appendix 1 presents the results oft-tests, but only trends are mentioned here
because there were too many non-independent tests, without Bonferroni
correction.
Table 2.8 Metabolic rates from the literature and this study in mass corrected
terms. Mass and metabolic rates are presented as means.
Species Mass Metabolic Rate Mass corrected Reference (grams) 0 mLh' 0 2 mL min'gexp
Python curtis 3000 56.01 3.350 Chappell & Ellis 1987 P. regius 800 19.01 3.114 Chappell & Ellis 1987 P. reticulatus 18000 397.16 5.516 Chappell & Ellis 1987 P. sebae 22000 362.42 3.631 Chappell & Ellis 1987 P. molurus 14000 241.73 3.562 Chappell & Ellis 1987 More!ia spilota 2000 64.91 3.128 Chappell & Ellis 1987 Epicrates cenchria 700 16.35 3.103 Chappell & Ellis 1987 Boa constrictor 13000 183.93 3.615 Chappell & Ellis 1 987 Coral/us caninus 700 11.50 3.213 Chappell & Ellis 1 987 C. enhydris 1000 22.28 3.161 Chappell & Ellis 1987 Lichanura trivirgata 300 8.44 2.942 Chappell & Ellis 1987 Acrantophis dumerili 3000 53.32 3.365 Chappell & Ellis 1987 Candoia carinatus BOO 14.10 3.207 Chappell & Ellis 1 987 Eryx co/ubrinus 150 5.12 2.797 Chappell & Ellis 1987 Boa constrictor 9900 207.9 3.458 Benedict 1932 Epicrates angulifer 12400 384.4 3.364 Benedict 1932 P. molurus 14800 266.4 3.555 Vinegar eta!. 1970 P. reticulatus 30200 875.8 3.493 Benedict 1932 P. molurus 12370 222.66 3.534 Hutchison et at. 1966 Aspidites 974 48.16 2.920 this study melanocepha/us Liasis childreni 320 18.25 2.756 this study L. fuscus 1479 41.90 3.123 this study L. macu/osus 141 7.266 2.667 this study L. olivaceus 2761 91.14 3.142 this study L. stimsoni 347 17.62 2.806 this study Morelia s. spilota 1250 55.39 3.011 this study M.s. variegata 1467 47.67 2.943 this study Acrochordus arafurae 1050 28.6 3.138 this study Acanthophis antarcticus 102 6.14 2.594 this study Pseudona ·a nucha/is 214 14.39 2.565 this stud
Australian pythons have metabolic rates lower than at least seven of the
nine species of boas examined (Coral/us caninus. C. enhydris, Candoia
carinatus, Epicrates angulifer, E. cenchria, E. colubrina and Lichanura
trivirgata), and the larger Australian python species (L. fuscus, L. olivaceus, A.
melanocepha/us, M. s. spilota and M. s. variegata) all had lower metabolic
rates than another species of boa, A. dumerili (Appendix 1 ). Only Boa
constrictor had a metabolic rate similar to the Australian python taxa. However,
A. arafurae had a metabolic rate lower than E. angulifer, but similar to the other
boa species. Six of the seven Australian python taxa in my study had lower
metabolic rates than P. regius, but most had similar metabolic rates to the
other python taxa examined (Benedict 1932; Hutchinson eta/. 1966; Chappell
and Ellis 1987).
Discussion
Standard metabolic rate did not vary among species or seasons. On a
daily cycle there was no difference between standard and resting metabolic
rate for 30 of 33 comparisons, and all significant P values were > 0.02, so the
significance may have been due to chance or artefactual. These patterns of
standard metabolic rate appear inflexible compared to other reptiles (Beaupre
1993; Secor and Nagy 1994). However in other pythons, the daily cycle in
metabolic rate also does not change between day and night (Benedict 1932;
Chappell and Ellis 1987). Preferred body temperatures were higher in the wet
than the dry season in three species examined, and two of those that had a
shift in Tbpret were active foragers. The allometric relationships and thermal
sensitivity in the animals reported here were similar to other reptiles, but
metabolic rate and preferred body temperature were lower than those of most
reptiles (Bennett and Dawson 1976).
Several species of diurnally active squamates show seasonal variation
in activity level (Christian eta/. 1995), preferred body temperatures (Christian
23
and Bedford 1995, 1996), and standard metabolic rates (Scott et a/. 1982;
Beaupre 1995b; Christian and Conley 1994; Christian et a/. 1996a,b). In
contrast, the metabolic rates and preferred body temperatures of most pythons
examined in my study did not change with season. This lack of seasonal
change in metabolic rate may be related to the fact that the SMR's of the
pythons examined in this study are lower than those of most other reptiles
(Benedict 1932; Vinegar eta/. 1970; Andrews and Pough 1985; Chappell and
Ellis 1987). Hence, pythons may already be operating at such a low level of
energy expenditure that there are no significant advantages in depressing
metabolic rate during the dry season, as has been documented in other
reptiles of the region (Christian eta/. 1996a,b).
Metabolic rates of many reptiles vary with some circadian rhythm
(Bennett and Dawson 1976). Generally, RMR of reptiles is 1 .2 to 1.5 times
higher than SMR (Bennett and Dawson 1976; Andrews and Pough 1985). In
the few python and boa species previously examined, no significant difference
has been found between SMR and RMR (Benedict 1932; Chappell and Ellis
1987). Only three species in this study (M.s.variegata, L. fuscus, A. arafurae)
had a significantly higher RMR , and in each case this difference was only at a
single temperature. In each case, this temperature corresponded fairly closely
to the wet season preferred body temperature of the species in question (for M.
s. variegata 29.5°C, for L. fuscus 33.0°C and for A. arafurae 27°C). Thus,
these temperatures may act as a catalyst for these species to remain active
during the day, and therefore maintain a higher resting metabolic rate.
Chappell and Ellis (1987) used multiple regression analysis of
metabolism ( Yo2 ml min-1) with respect to body mass and ambient
temperature and found that these two factors alone explained 97% of the
variance for interspecific differences. Metabolic rates were 39% lower in the
python family compared to other snakes at a Ta of 30°C (Andrews and Pough
1985; Chappell and Ellis 1987). Analysis of the pooled interspecific data for
24
metabolism results in values of the exponent slope 'b' in the equations MR =
aMb within the range 0.77 - 0.83, for all reptiles (Bennett and Dawson 1976),
iguanids (Nagy 1983), squamates (Andrews and Pough 1985) and boidae
(Chappell and Ellis 1987). The exponent for all species in my study varied with
temperature, but were at the lower reported value of 0.77 (Bennett and Dawson
1976).
A 0 10 of less than 2 indicates metabolism which is partially temperature
independent, and a 0 10 of one represents homeostasis or total thermal
independence (Schmidt-Nielsen 1990). The overall 0 10 for reptiles falls within
the range 1.5 - 3.1 at the preferred body temperature of the reptiles studied to
date (Bennett and Dawson 1976; Chappell and Ellis 1987). The allometric
equations and 0 10 values indicate that the snakes in this study are not different
from other groups of reptiles in the way metabolism varies with mass or
temperature (Bennett and Dawson 1976). However, pythons are different from
other reptiles in having low preferred body temperatures and low metabolic
rates. From the allometric data presented here, and the comparison of mass
corrected data from the literature, I conclude that these Australian pythons have
particularly low metabolic rates and are lower than most other boid species. A
reduced metabolic rate has the benefit of reduced energetic costs.
Acrochordus arafurae has been characterised as having a very low
metabolic rate from both ecological (Shine and Lambeck 1986; Shine 1986)
and physiological data (Seymour eta/. 1981 ). The SMR of this species was not
significantly different from any of the snakes analysed, however their SMR was
relatively low compared to the general allometric equation for snakes (Bennett
and Dawson 1976). It is possible that the metabolic rate was characterised as
very low from a study in the dry season (Seymour eta/. 1981 ). During the dry
season the water temperature would fall with the ambient temperatures,
compared to the wet season. The fall in water temperature may induce
25
metabolic depression, as occurs in some terrestrial reptiles of the region during
the dry season (Christian eta/. 1996a,b). Comparison of the data presented
here with measurements of file snakes captured in the dry season would clarify
this point.
Acrochordus arafurae is aquatic and I was hypothesised that in order to
achieve a low resting metabolism these snakes would need to be in water. If
the snakes were not in water, muscles which were not designed for a terrestrial
existence might be under greater stress resulting in an elevated metabolic rate.
However, metabolic rate was similar for animals in or out of the water.
Most snake species examined in this study were predominantly 'sit and
wait' foragers, except P. nucha/is which is known to be an 'active' forager (pers
obs.). The foraging mode of A. melanocephalus has not been determined, but
from observation it may also be an active foraging species (pers obs.). The only
python species which have been studied in an ecological context are the
More/ia complex which are exclusively 'sit and wait' foragers (Slip and Shine,
1988 b,d; Shine and Fitzgerald, in press) and L. fuscus (Shine 1991) which is
occasionally an active foraging species. The SMR's of these taxa were similar.
My results offer a striking contrast to some of the patterns previously
described based on studies from other countries. For example, the SMR of a
diurnal, 'active' foraging colubrid snake (Masticophis) was twice that of a 'sit
and wait' foraging sidewinder rattlesnake (Crota/is) (Secor and Nagy 1994).
No such species differences in SMR were found between wide-foragers and
ambush predators among the Australian snakes that I studied. Low food
availability and other resource uncertainties characterise most Australian
habitats (Flannery 1994) and may make low SMR and the conservation of
energy necessary in most kinds of snakes that exploit these environments.
26
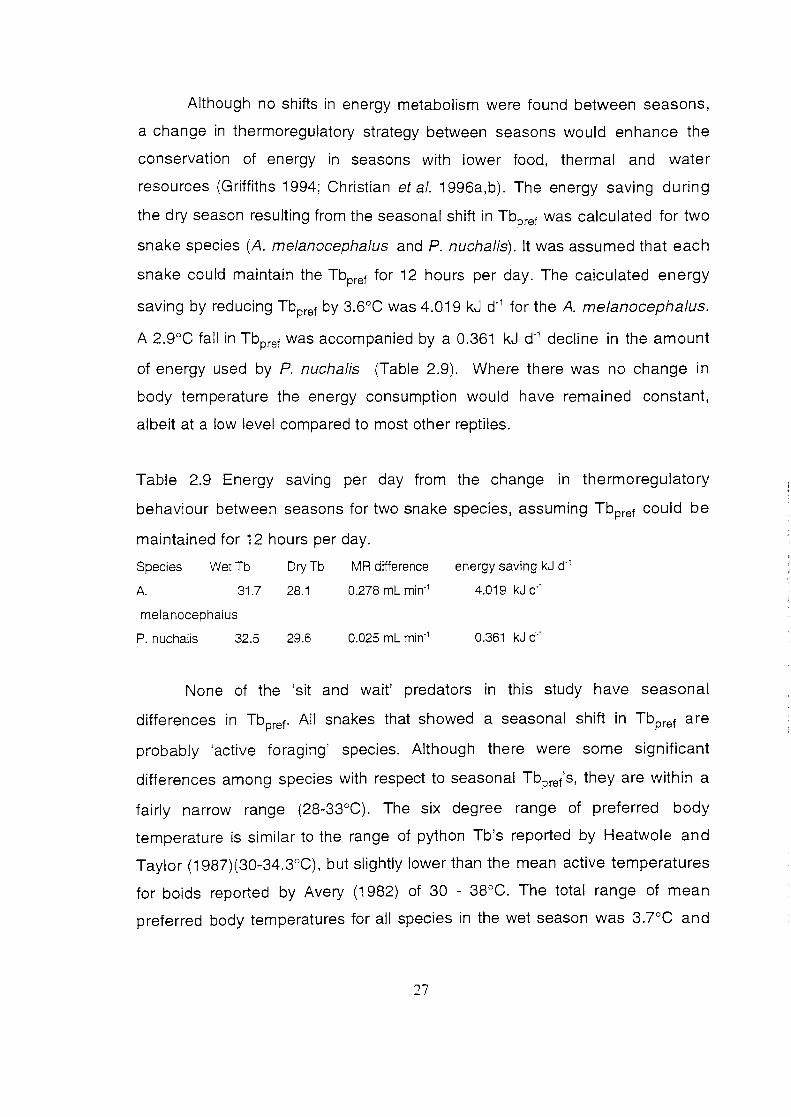
Although no shifts in energy metabolism were found between seasons,
a change in thermoregulatory strategy between seasons would enhance the
conservation of energy in seasons with lower food, thermal and water
resources (Griffiths 1994; Christian eta!. 1996a,b). The energy saving during
the dry season resulting from the seasonal shift in Tbpref was calculated for two
snake species (A. me!anocephafus and P. nucha/is). It was assumed that each
snake could maintain the Tbpret for 12 hours per day. The calculated energy
saving by reducing Tbpret by 3.6°C was 4.019 kJ d., for the A. melanocephalus.
A 2.9°C fall in Tbpret was accompanied by a 0.361 kJ d., decline in the amount
of energy used by P. nucha/is (Table 2.9). Where there was no change in
body temperature the energy consumption would have remained constant,
albeit at a low level compared to most other reptiles.
Table 2.9 Energy saving per day from the change in thermoregulatory
behaviour between seasons for two snake species, assuming Tbpret could be
maintained for 12 hours per day.
Species WetTb DryTb MR difference energy saving kJ d.,
A. 31.7 28.1 0.278 ml min·1 4.019 kJ d'1
melanocephalus
P. nuchalis 32.5 29.6 0.025 ml min·1 0.361 kJ d"1
None of the 'sit and wait' predators in this study have seasonal
differences in Tbpret· All snakes that showed a seasonal shift in Tbpret are
probably 'active foraging' species. Although there were some significant
differences among species with respect to seasonal Tbpret's, they are within a
fairly narrow range (28~33°C). The six degree range of preferred body
temperature is similar to the range of python Tb's reported by Heatwole and
Taylor (1 987)(30-34.3°C), but slightly lower than the mean active temperatures
for boids reported by Avery (1 982) of 30 ~ 38°C. The total range of mean
preferred body temperatures for all species in the wet season was 3.7°C and
27

for the dry season 4.4°C. These small thermal ranges do not represent a great
deal of difference between even the most thermally divergent species
examined here, and at all temperatures all these species could still catch and
consume prey (pers. obs.).
Most boids have a low active body temperature (Regal 1966; Cogger
and Holmes 1960; Slip and Shine 1988c). Low Tbpret's have ecological
consequences such as a lower metabolic rate (therefore lower energy
expenditure), and longer nocturnal periods suitable for activity. In some tropical
areas boids would be able to remain active over a 24 hour period.
The Tbpret's of five python taxa did not change with season in this study.
These included snakes in the small childrens python complex (L.childreni and
L.stimsoni), the carpet/diamond python complex (Morelia s. spilota and M. s.
variegata), and the large L. olivaceus (Table 2.5). Three tropical species (L.
childreni, M. s. variegata, L. olivaceus) would be able to achieve a preferred
body temperature at some time during the day throughout year, in northern
Australia (Christian and Bedford 1995, 1996). Because the arid zone is more
thermally variable, it would be difficult for L. stimsoni to attain a high and stable
body temperature year round. During winter it is cold (air temperatures <1 ooc at times during the day), and activity is reduced (Fyfe pers comm). Hence,
although L. stimsoni and M. s. spilota may have similar year-round Tbpret's
compared to other pythons, it is unlikely they would be able to attain high body
temperatures during the cold months.
Previous studies have found that the Tbpret of the "temperate-zone"
Morelia s. spilota, is lower than that of the tropical python species (McCracken
1988; Slip and Shine 1988c). Some M. s. spilota used in this study had lived in
the tropics for several years. It may be that their thermoregulatory behaviour
and physiology changed in the foreign environment. The seasonal difference
28
in Tbpref of L. fuscus in the laboratory was unexpected in light of the recent
telemetry data reported by Shine and Madsen (1996) who found no
appreciable difference in Tb between seasons. The seasonal difference in
body temperatures in my study may reflect an energy conservation strategy
which was not needed in wild L. fuscus, due to an abundance of prey (Madsen
and Shine 1996a,b).
The maintenance of a low but constant SMR, and a Tbpref within a
narrow range throughout the year, represents a trade-off strategy. This strategy
would enable a python to feed and move at any time of the year, while as a 'sit
and wait' forager, maintain a low energy mode. Many other reptiles have
metabolic rates and body temperatures that are high during the season when
food and resources are freely available. However, when the resources are not
available (i.e. due to a change in season), SMR and Tbpref fall in a number of
reptiles to reduce the energetic cost (Christian et a/. 1996a,b). If the animals
stayed at a high metabolic rate and body temperature, the energetic cost would
possibly be prohibitive and the net result may be starvation (Christian et a/.
1996b). Therefore, some seasonally active reptiles use a boom and bust
strategy, obtaining most energy while they can, then reduce all costs when
food energy from the environment is not available (Christian et a/. 1996a,b).
Pythons however, use a constant low, energy strategy to take advantage of
unpredictable seasonal resources.
The mass corrected data indicate that the results from this study are
similar to those of Chappell and Ellis (1987) for Morelia spilota. The large
python species of P. molurus and P. sebae have metabolic rates which were
similar to the species in this study. A. arafurae was only significantly different
from one boid indicating that the metabolic rate of this species is similar to most
species in the family boidae. Chappell and Ellis (1987) found that differences
among species and genera and even families were due mostly to mass and
29
temperature. In the analysis of mass-corrected data, most differences occur
between Australian pythons and the subfamily boidae, with seven Australian
python taxa having lower metabolic rates than eight of the nine boa species
presented by Chappell and Ellis (1987). These results could indicate a
metabolic divergence at a familial level.
Summary
Pythons maintain a low, constant SMR throughout the year. This pattern
may be advantageous for a 'sit and wait' predator with a food supply which is
unreliable and low (Flannery 1994). Energetic benefits accrue from the
opportunistic exploitation of food items during times when the animal could be
dormant. Therefore, pythons are short term risk takers by foregoing a much
reduced metabolic rate while dormant in the hope of obtaining some food
during times of scarce food resources (Call and Holohan 1983). Thus they rely
on long term benefits to exceed long term costs, by being low energy
specialists. This strategy is viable as long as the benefits of remaining active
exceed the costs of remaining active and exceed the benefits of reducing
metabolic rate during dormancy. The trade-off for pythons is that they have a
low metabolic rate in the wet season when SMR in some other reptiles is
relatively high (Christian eta/. 1995), but they maintain that level of SMR and
Tbpret in the dry season when many other reptiles are not active. The 'sit and
wait' foraging pattern of pythons is an important component of this energy
strategy because they do not use much energy in activity when food is scarce.
Only during digestion is metabolic rate elevated for pythons, but energy gain
exceeds the energetic cost of digestion (Chapters 3, 4 and 5). This state of
constant ecological readiness has been recorded in tropical pythons (Shine
and Madsen 1996) and also in temperate pythons such as M. s. spilota (Slip
and Shine 1988c). There can be a significant energy saving by decreasing
Tbpref a few degrees, and Tb reduction may be a strategy available to pythons
when food and water resources are very limited. The results presented here
30

are limited to data obtained in the laboratory. Field studies are required to fully
understand the relationships between prey availability and python activity and
metabolism.
31

Chapter 3
Metabolic and Thermogenic Effects
of Feeding by Pythons
Introduction
The standard metabolic rate of most reptiles is approximately one
seventh the metabolic rate of similar sized mammals and birds (Dawson and
Hulbert 1970; Else and Hulbert 1981; Hulbert and Else 1989). Endotherms
have more mitochondria per cell and relatively larger metabolically active
organs such as heart, liver and kidneys which result in a capacity for
metabolism that is 3 - 7 fold greater than that of reptiles (Else and Hulbert 1981;
Hulbert and Else 1989).
Significant heat production through metabolism appears to be confined
to the mammals and birds. Because the metabolic rate of reptiles is low, and
environmental conductance of heat high, the use of metabolic thermogenesis
is generally insignificant (Else and Hulbert 1981 ). In reptiles the incidence of
muscular heat appears restricted to two groups: the sea turtles and pythons.
Large sea turtles have body temperatures up to 2ooc higher than the
surrounding water (Friar et a/. 1972; Standora et a/. 1982). This high body
temperature is not an artefact of the thermal inertia of a large body mass (Neill
and Stevens 1973), but rather is created mostly through muscular activity and
regulated by the turtles (Friar eta/. 1972; Standora eta/. 1982).
Some pythons can heat their bodies through muscular activity, known as
'shivering thermogenesis' while brooding eggs (Benedict 1932; Hutchison et
a/. 1966; Vinegar eta!. 1970; Van Mierop and Barnard 1976, 1978; Harlow and
Grigg 1984; Slip and Shine 1988a; Barker and Barker 1994). Shivering
thermogenesis increases the temperature of the body and subsequently the
egg mass by up to 11 ac above ambient temperature (Vinegar et a/. 1970;
Harlow and Grigg 1984; Slip and Shine 1988a). To facilitate the increase in
body temperature during brooding, metabolic rate may increase substantially,
up to 22 times the standard metabolic rate (SMR) in More/ia s. spilota and P.
molurus (Benedict 1932; Vinegar eta/. 1970; Harlow and Grigg 1984).
An increase in metabolic rate associated with feeding in animals was
first recognised by Lavoiser and Seguin in 1789 (Cassel and Casselman
1990) and has since been found in many species of reptiles (Benedict 1932;
Waldschmidt et a/. 1987; Wang et a/. 1995). This has been termed 'specific
dynamic action' (SDA) and represents a change in the gut associated with the
digestion of food (Bennett and Dawson 1976; Bartholomew 1982; Schmidt
Nielsen 1990).
In endotherms the metabolic increase after feeding is about 10% above
SMR, although it can be as much as 25-50% in some mammals (Brody 1945;
Kleiber 1975). Similarly, a moderate increase in metabolism has been seen in
some lizards and crocodilians after feeding. For example, Roberts (1964)
reported a 32% increase above SMR after feeding in Uta stansburiana. An
increase of 1 00% was observed after feeding in Sce/oporus undulatus
(Waldschmidt eta/. 1987), and an increase of 200% was observed in Alligator
mississippiensis (Coulson and Hernandez 1979).
Snakes appear to show a more substantial increase in metabolism after
feeding. Some large pythons increase SMR by 3-7 times the unfed level one to
two days after feeding (Benedict 1932). Secor and Diamond (1995) found that
the metabolism of P. molurus increased up to 45 times the unfed SMR level
after feeding, but increases of 7 - 17 times the unfed level were more typical.
Among snakes, the extent of the increase in metabolic rate due to SDA may
depend on foraging mode, with the 'active foraging' colubrid Masticophis
33
flagellum having a lower SDA than the 'sit and wait' foraging viperid Crotalus
cerastes (Secor and Nagy 1994).
A thermophilic response has also been associated with feeding in some
boidae (Regal 1966; Kitchell 1969; Slip and Shine 1988b), although some
pythons select a cooler microclimate in which to digest (Benedict 1932; Barnett
pers. comm.; pers. obs.). An increase in body temperature after feeding may be
ecologically relevant in some reptiles because it can aid the digestive process
by decreasing passage time, increasing digestive efficiency or both (discussed
further in Chapter 4) (Greenwald and Kanter 1979; Nalleau 1983). In addition
to increases in Tb by behavioural thermoregulation, it is possible that the high
SDA of pythons could result in thermogenesis. If so, it is also possible that this
physiological thermogenic response could have the same advantages to
digestive processes as a behavioural thermophillic response. The body
temperature of Python molurus after feeding is a few degrees warmer than
ambient temperature without any external heat source (Benedict 1932;
Marcellini and Peters 1982; Secor pers. comm.). However, no thermogenic
response after feeding was detected in another species of python (M. s.
spilota: Slip and Shine 1988b) or in a colubrid snake (Greenwald and Kanter
1979).
The aim of this chapter was to determine the extent and duration of the
increase in metabolic rate due to SDA after feeding in seven Australian python
taxa, two elapid species at four temperatures (24, 27, 30 and 33°C), and one
Acrochordid species at one temperature (30°C). A second objective was to
determine whether the increase above. SMR was associated with an
appreciable increase in body temperature that may facilitate digestion.
34
Methods
Feeding of snakes
The python taxa studied include the childrens python (Liasis childreni),
stimson python (Liasis stimsoni), carpet python (Morelia spilota variegata),
diamond python (Morelia s. spilota), black headed python (Aspidites
melanocephalus), water python (Liasis fuscus) and olive python (Liasis
olivaceus). The two elapid species were the northern death adder
(Acanthophis prae/ongus) and the western brown snake (Pseudonaja
nucha/is). The file snake used was Acrochordus arafurae.
Snakes were fasted for a minimum of 14 days before being used in
experiments (Secor 1995; Secor and Diamond 1995). In some instances the
interval was much longer: a number of animals were stubborn feeders and fed
only intermittently, sometimes going for 5-6 months between meals. Most
feeding experiments were done in the wet season. Each animal was weighed
and fed 3.6 - 51.1% of their body mass in rodents. An initial attempt to feed all
animals a similar amount of food (Secor 1995) became untenable because the
animals were often reluctant to feed.
Oxygen consumption
Two temperature-controlled cabinets (Forma Scientific model 37 44,
(Ohio, USA) temperature variation ± 0.5°C, Thermoline Rl 250 Smithfield,
Australia rated at ± 0.2°C) were used. The internal temperatures of the cabinets
were adjusted by a thermostat and checked frequently against a thermocouple
thermometer (Fluke 51, USA).
Because snakes used were relatively small (mean mass 1058.1 g;
range 32.0 - 5800.0 g) they achieved thermal equilibrium with the cabinet after
a few hours. Animals were fed late in the afternoon and measurements began
12 hours later. Oxygen consumption data were collected in the same manner
35
as the data for SMR (see Chapter 2). Each animal was fed and monitored at
one of the four prescribed temperatures for the following 5 to 10 days.
To determine gut passage time, animals were maintained at one of the
prescribed temperatures until they defecated. After defecation the date and the
mass of the animals were recorded. Faeces were removed for analysis (see
Chapter 4).
Animal body temperatures
Snake body and chamber temperatures adjacent to the python, were
measured using a Raynger (Raytek, USA) infrared thermometer. Python body
extremities differed in temperature when measured in field conditions (Webb
and Heatwole 197i ), but laboratory-based python body temperatures varied
very little (< 0.2°C) along the length of the body. Because there was some
variation in the cabinet temperature between top and bottom shelves,
throughout this study the temperature of the snake was taken and also the
temperature of the chamber adjacent to the snake. This removed the variation
in cabinet temperature and gives a more accurate indication of the temperature
change each individual snake experienced. However, the experimental
temperatures are the temperatures to which the cabinets were set.
Statistical analyses
Graphs of pooled data were used initially to ascertain general trends.
Paired t-tests were used to compare the metabolic rate of post-absorptive
animals with the metabolic rate measurements of each day after feeding. Plots
of metabolic rate versus days after feeding revealed a peak on day two, thus,
peak metabolic rate (PMR) was defined as the metabolic rate two days after
feeding. The PMR's among species at each temperature were compared using
analysis of covariance, with mass as a covariate. The difference between the
body temperature of the fed snake and the cabinet was analysed using a
paired t-test for each species at each temperature.
36
There were insufficient data points for the same animals over all
temperatures to analyse the data using repeated measures. Some animals
were used more than once. Thus, I have analysed the data as if they were
independent, after determining that they met the criterion specified by Leger
and Diedrichson (1994) of intraspecific variances being as great as
interspecific variances.
The magnitude of the increase in metabolic rate was determined by
dividing peak metabolic rate after feeding by standard metabolic rate (ratio of
PMR/SMR). Some pythons had extremely large PMR/SMR ratios. In order to
determine whether these extremely high values were due to large increases in
metabolism after feeding (PMR) or unusually low pre-fed SMA values, the data
were examined as follows. After visual inspection of the ratios, they were
divided into two groups: pythons which had a peak metabolic rate less than 1 2
times SMR, and pythons with a PMR more than 12 times SMR. A linear
regression was applied to log 10 transformed body mass against log 1 0
transformed SMR. The residual deviations from the regression line represent
mass-independent values that were then analysed by ANOVA with respect to
the two groups described above. If the residual values of the pythons with
PMR/SMR ratios >12 times SMR were significantly lower than the residuals of
the pythons with smaller ratios then this analysis would indicate that the
extremely large ratios were due to low SMR values. A linear regression was
also applied to log10 transposed body mass against log10 transformed PMR,
and the residuals were analysed as above. If the residual values of the pythons
with PMR/SMR ratios > 12 times SMR were significantly higher than the
residuals of the pythons with smaller ratios then this analysis would indicate
that the extremely large ratios were due to high PMR values.
All ratio data were arcsin-transformed and analysed using analysis of
variance (Zar 1984). The data were pooled from all python taxa and all
37
temperatures and divided into five arbitrary categories of relative meal size.
These categories were 0 - 9.9%, 10 - 14.9%, 15 - 19.9%, 20 - 24.9%, and
above 25% of snake body mass in food. The categories were compared to the
factorial increase in metabolic rate after feeding using analysis of variance.
The duration of elevated metabolic rate after consuming meals of
different in relative size was examined. Peak metabolic rate resulting from
relative meal sizes less than 10% and above 25% snake body mass at 24 and
33°C compared to SMR using paired t-tests. This sub-set of the data represents
the extremes of meal size and temperatures.
Post hoc Tukeys means separation tests were used to identify where
differences occurred within significant results of AN OVA and ANCOV A. These
results are generally presented.
Results
Post feeding - General trends
For all snake species examined, post feeding metabolic rate increased
and peaked after 2 days, then declined in subsequent days. This trend
occurred at all four temperatures examined (Figures 3.1 - 3.2). However,
metabolic rates at the lower temperatures were significantly higher than SMR
for a number of days and did not begin to decline substantially until about days
4 or 5 (Figure 3.1 ). In contrast, metabolic rate at the two higher temperatures
(Figure 3.2) increased sharply to a peak on the second day then dropped
swiftly in subsequent days. An increase in body temperature was associated
with this increase in metabolic rate after feeding at all four temperatures. The
temperature increase after feeding showed a pattern similar to the increase in
metabolic rate (Fig. 3.3- 3.4).
The ratio of PMR/SMR did not differ significantly among temperatures (P
> 0.05). The mean increase in metabolic rate after feeding was 5.8, 7.7, 7.4,
38
and 5.6 times SMR at 24, 27, 30 and 33°C respectively. A plot of SMR and
PMR (log Vo2mL min.1) indicates that PMR increases at the same rate as SMR
with increasing temperature (Figure 3.5).
Increase in metabolic rate after feeding
Paired t-tests were used to compare the peak metabolic rate after
feeding with the SMR before feeding at each temperature. Liasis fuscus and M.
s. spi/ota had significantly higher metabolic rates after feeding compared to
SMR at the four experimental temperatures (Table 3.1 ). Liasis stimsoni also
had a significantly higher post feeding metabolic rate at three of the
temperatures, as did L. childreni. Aspidites melanocepha/us had significantly
elevated post feeding metabolic rates at 27°C, and L. olivaceus had higher
metabolic rates after feeding at three temperatures (27,30 and 33°C). Morelia
s. variegata and the elapid Pseudonaja nucha/is did not show a significant
increase in metabolic rate after feeding (Table 3.1 ). Acrochordus arafurae also
exhibited a significantly higher post feeding metabolic rate.
39

2.2
2
I 1.8 I !
'7 1.6 .5 E 1.4 /I _J
E 1.2 CIJ
l 0
-> . l
.8
~~ .6
.4 H
.2 :: l J.
0 0 2 3 4 5 6 7
Days after Feeding
Figure 3.1 General trend for metabolic rate after feeding at 24°C. One standard error is represented by bars.
6
5
-.'5 4 E _J
E 3 (\J
0 ·>
2
1
0 0 1 2 3 4 5
Days after feeding
Figure 3.2 General trend for metabolic rate after feeding at 33°C. One standard error is represented by bars.
40
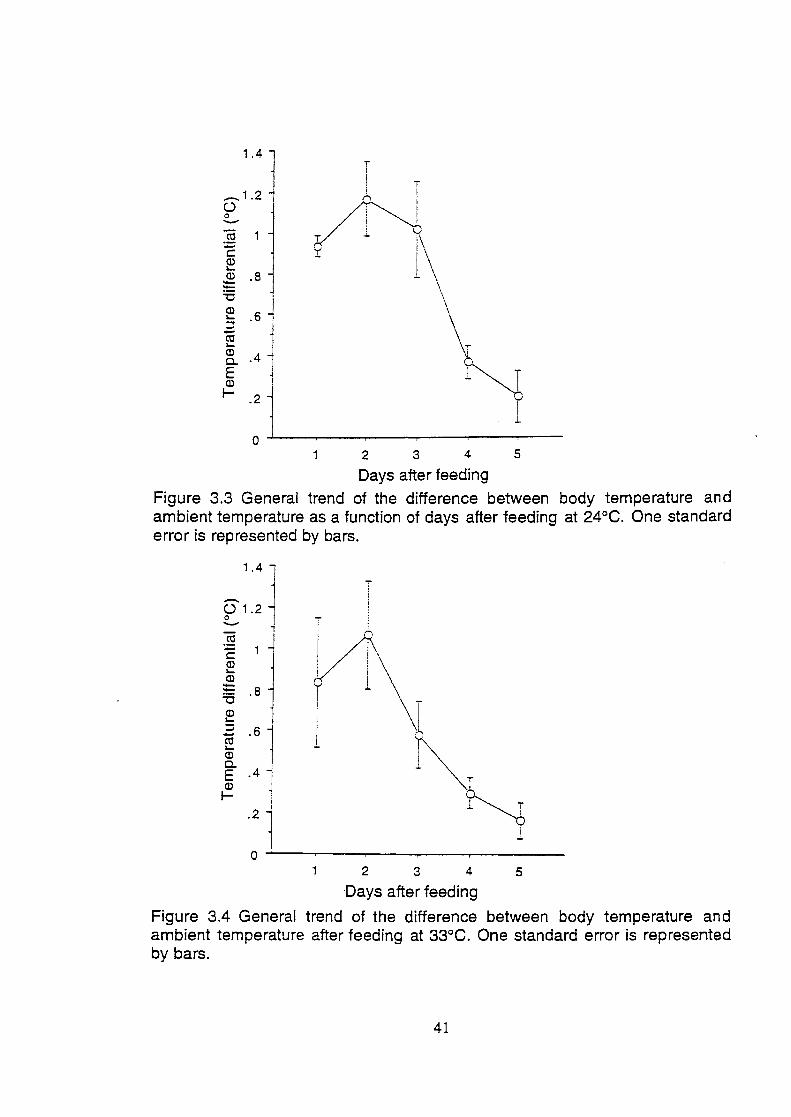
1.4
_1.2 () 0 --~ 1 c (]) ._
.B: .8 -:0 ~ .6 :::l -m ._ (]) c. .4 E (])
1- .2
~ -;/ J. ~ r I\
- \
1 0 ~--~--~----~--~----~---
2 3 4 5
Days after feeding Figure 3.3 General trend of the difference between body temperature and ambient temperature as a function of days after feeding at 24°C. One standard error is represented by bars.
1.4
m :.:: 1 c (]) ._ (]) -:a .8
~ -E .6 ._ (]) c. E .4
~ .2
'
I
i i ~
\-.1
~ 0 ~--~----~--~----~--~----
2 3 4 5
Days after feeding
Figure 3.4 General trend of the difference between body temperature and ambient temperature after feeding at 33°C. One standard error is represented by bars.
41
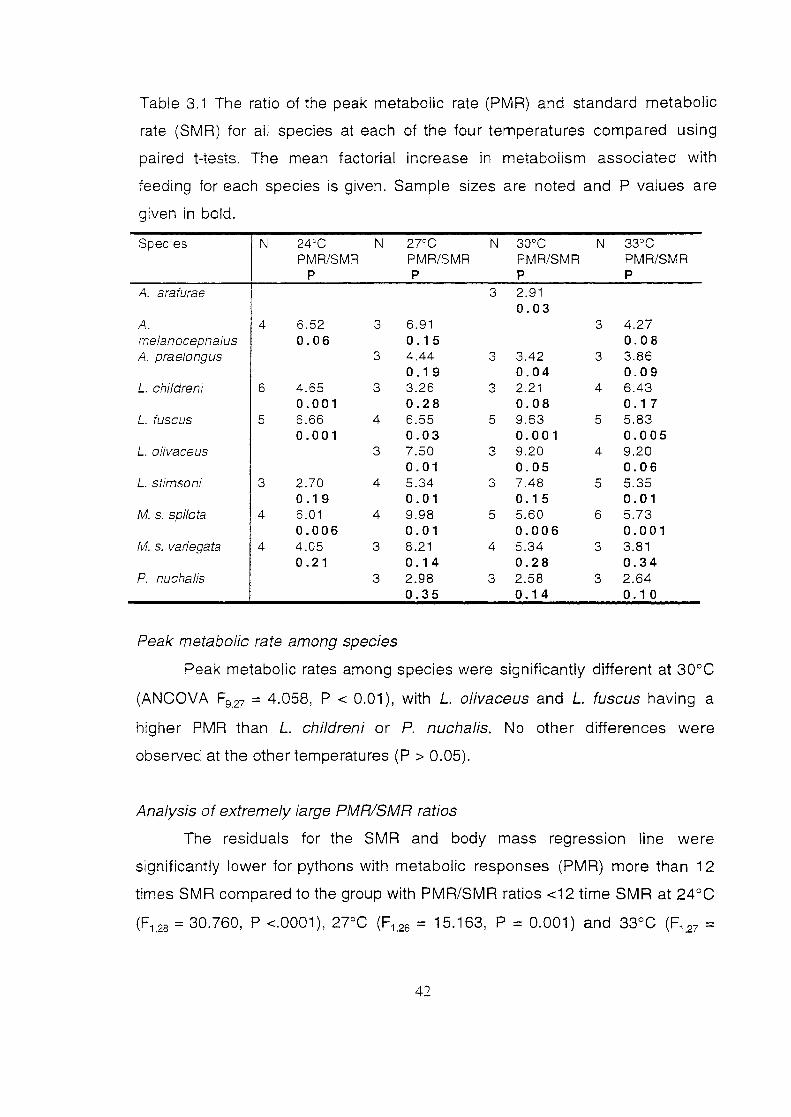
Table 3.1 The ratio of the peak metabolic rate (PMR) and standard metabolic
rate (SMR) for all species at each of the four temperatures compared using
paired t-tests. The mean factorial increase in metabolism associated with
feeding for each species is given. Sample sizes are noted and P values are
given in bold.
Species N 24''C N 27°C N 30°C N 33°C PMR/SMR PMR/SMR PMR/SMR PMR/SMR
p p p p
A. arafurae 3 2.91 0. 03
A. 4 6.52 3 6.91 3 4.27 me!anocephalus 0.06 0.1 5 0. 0 8 A. praelongus 3 4.44 3 3.42 3 3.86
0.19 0. 04 0. 0 9 L. childreni 6 4.65 3 3.26 3 2.21 4 6.43
0. 001 0.28 0. 08 0.17 L. fuscus 5 6.66 4 6.55 5 9.63 5 5.83
0. 001 0.03 0. 001 0.005 L. olivaceus 3 7.50 3 9.20 4 9.20
0.01 0.05 0.06 L. stimsoni 3 2.70 4 5.34 3 7.48 5 5.35
0.1 9 0.01 0.15 0.01 M. s. spilota 4 6.01 4 9.98 5 5.60 6 5.73
0.006 0.01 0.006 0.001 M. s. variegata 4 4.05 3 8.21 4 5.34 3 3.81
0.21 0.14 0.28 0.34 P. nucha/is 3 2.98 3 2.58 3 2.64
0.35 0.14 0.1 0
Peak metabolic rate among species
Peak metabolic rates among species were significantly different at 30°C
(ANCOVA F9.27 = 4.058, P < 0.01 ), with L. olivaceus and L. fuscus having a
higher PMR than L. childreni or P. nucha/is. No other differences were
observed at the other temperatures (P > 0.05).
Analysis of extremely large PMRISMR ratios
The residuals for the SMR and body mass regression line were
significantly lower for pythons with metabolic responses (PMR) more than 12
times SMR compared to the group with PMR/SMR ratios <12 time SMR at 24°C
(F1.28 = 30.760, P <.0001 ), 2rC (F1,26 = 15.163, P = 0.001) and 33°C (F1_27 =
42
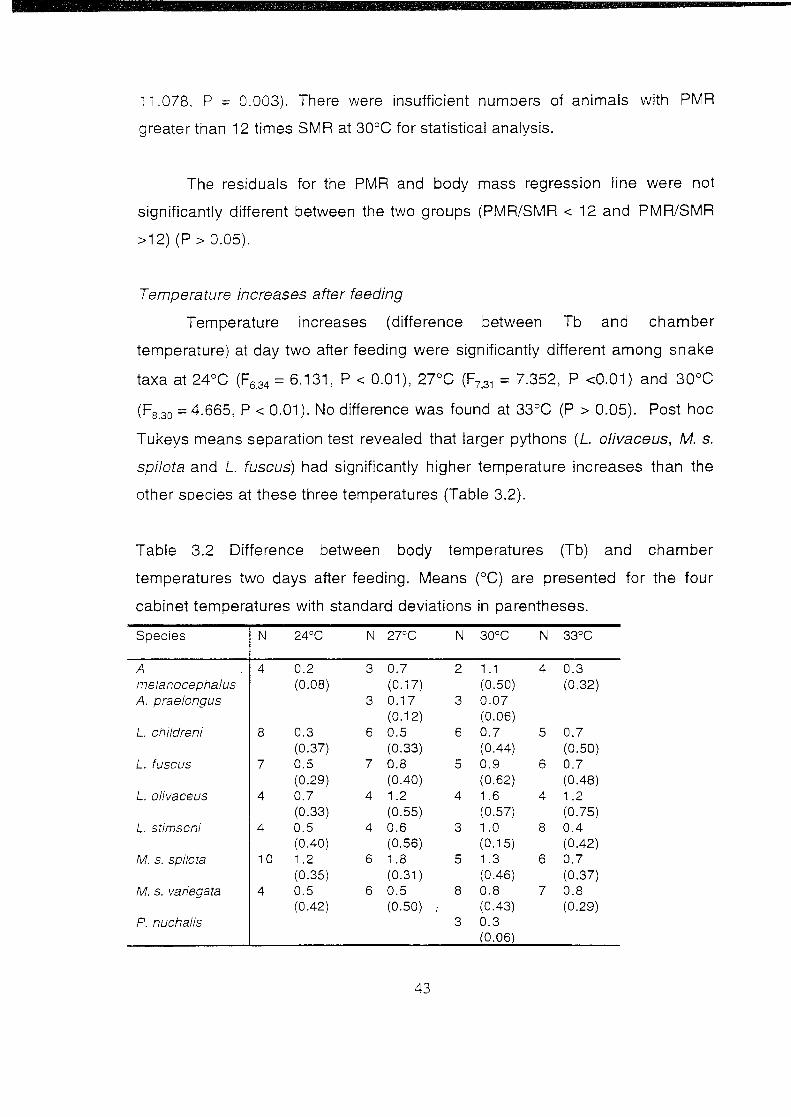
11.078. P = 0.003). There were insufficient numbers of animals with PMR
greater than 12 times SMR at 30°C for statistical analysis.
The residuals for the PMR and body mass regression line were not
significantly different between the two groups (PMR/SMR < 12 and PMR/SMR
> 12) (P > 0.05).
Temperature increases after feeding
Temperature increases (difference between Tb and chamber
temperature) at day two after feeding were significantly different among snake
taxa at 24°C (F6,34 = 6.131, P < 0.01 ), 2JDC (F7.31 = 7.352, P <0.01) and 30°C
(F8_30 = 4.665, P < 0.01 ). No difference was found at 33°C (P > 0.05). Post hoc
Tukeys means separation test revealed that larger pythons (L olivaceus, M. s.
spilota and L. fuscus) had significantly higher temperature increases than the
other species at these three temperatures (Table 3.2).
Table 3.2 Difference between body temperatures (Tb) and chamber
temperatures two days after feeding. Means (°C) are presented for the four
cabinet temperatures with standard deviations in parentheses.
Species N 24°C N 27°C N 30°C N 33°C
A 4 0.2 3 0.7 2 1 .1 4 0.3 melanocephalus (0.08) (0.17) (0.50) (0.32) A. praelongus 3 0.17 3 0.07
(0.12) (0.06) L. childreni 8 0.3 6 0.5 6 0.7 5 0.7
(0.37) (0.33) (0.44) (0.50) L. fuscus 7 0.5 7 0.8 5 0.9 6 0.7
(0.29) (0.40) (0.62) (0.48) L. olivaceus 4 0.7 4 1.2 4 1.6 4 1.2
(0.33) (0.55) (0.57) (0.75) L. stimsoni 4 0.5 4 0.6 3 1.0 8 0.4
(0.40) (0.56) (0.15) (0.42) M. s. spilota 10 1.2 6 1.8 5 1.3 6 0.7
(0.35) (0.31) (0.46) (0.37) M. s. variegata 4 0.5 6 0.5 8 0.8 7 0.8
(0.42) (0.50) (0.43) (0.29) P. nucha/is 3 0.3
(0.06)
43

Specific dynamic action and the mass of food
Regression analysis revealed no significant relationship between the
increase in metabolic rate after feeding and meal size (g) at any of the
experimental temperatures (P > 0.05).
Relative meal size using pooled temperatures
There was no difference between the PMR/SMR ratio at any of the
experimental temperatures (P > 0.05). Because there was no difference in the
magnitude of the metabolic increase after feeding among temperatures, the
data for all species and all experimental temperatures were pooled. Extremely
large metabolic increases after feeding were associated with a low standard
metabolic rate (above), and these were removed from the analysis. The largest
category of meal size (over 25% of body mass) included meals up to 51.1%
body mass in food, which is 2.5 times the 20 - 24.9% category, but there was
no difference in the magnitude of the metabolic increase after feeding between
these two meal size categories (P > 0.05). The metabolic increase with these
two categories was greater than all three smaller categories (F496 = 7.48; P <
0.01 ), which were not significantly different from one another (P >0.05) (Figure
3.6).
Factorial increase in peak metabolic rate compared to body mass
The data were again pooled and pythons were categorised according to
body mass as small ( <300g), medium (300 to 1 OOOg) and large (> 1 OOOg).
There was no significant difference in the factorial increase after feeding
among the three body size groups at three of the four temperatures (P >0.05).
However, at 33°C, smaller animals had a greater factorial increase than larger
pythons in the other two categories (F2 29 = 4.62, P = 0.04).
44
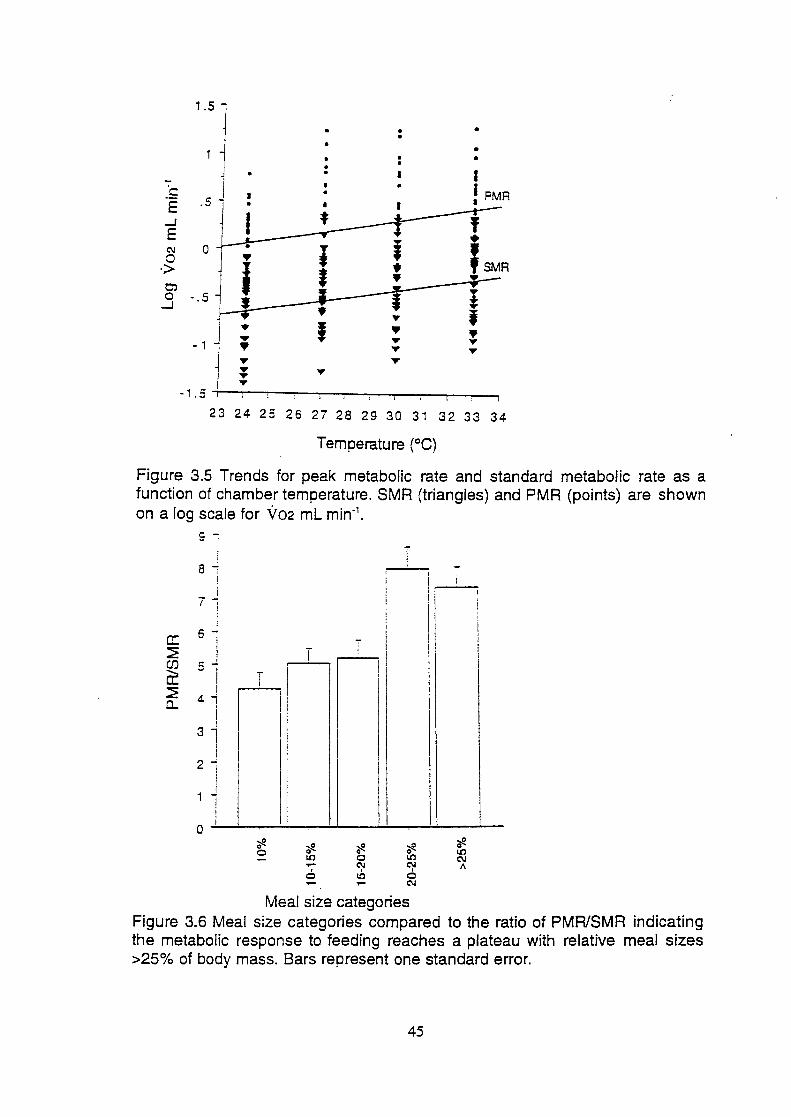
1.5] • • •
• • • • . •
• • I I -~ . 5 J • I PMR I • E • •
..J I E C\1 0 0
·> C) 0 .. 5 -l
l ,. ... ; • • • ,. ..,..
- 1 1 • ..,.. ..,.. ..... ..,.. • ..,.. ..,.. ..,..
-1.5
23 24 25 26 27 28 29 30 31 32 33 34
Temperature (°C)
Figure 3.5 Trends for peak metabolic rate and standard metabolic rate as a function of chamber temperature. SMR (triangles) and PMR (points) are shown on a log scale for Vo2 mL min·1•
8 -i ;
7..:., I
' ! -j
J I
I I
1 I
I 3
I
l I
2
i 1
0
T
' i I
i n1 II T
~ ~ ~ ~ 0
0 0 0 0 .,... LO 0 LO C\1 C\1
6 r.O I
0 ?"' ,.. C\1
Meal size categories
i I :n I ,
i I
I I I i I I
~ 0 LO C\1 II
Figure 3.6 Meal size categories compared to the ratio of PMRISMR indicating the metabolic response to feeding reaches a plateau with relative meal sizes >25% of body mass. Bars represent one standard error.
45
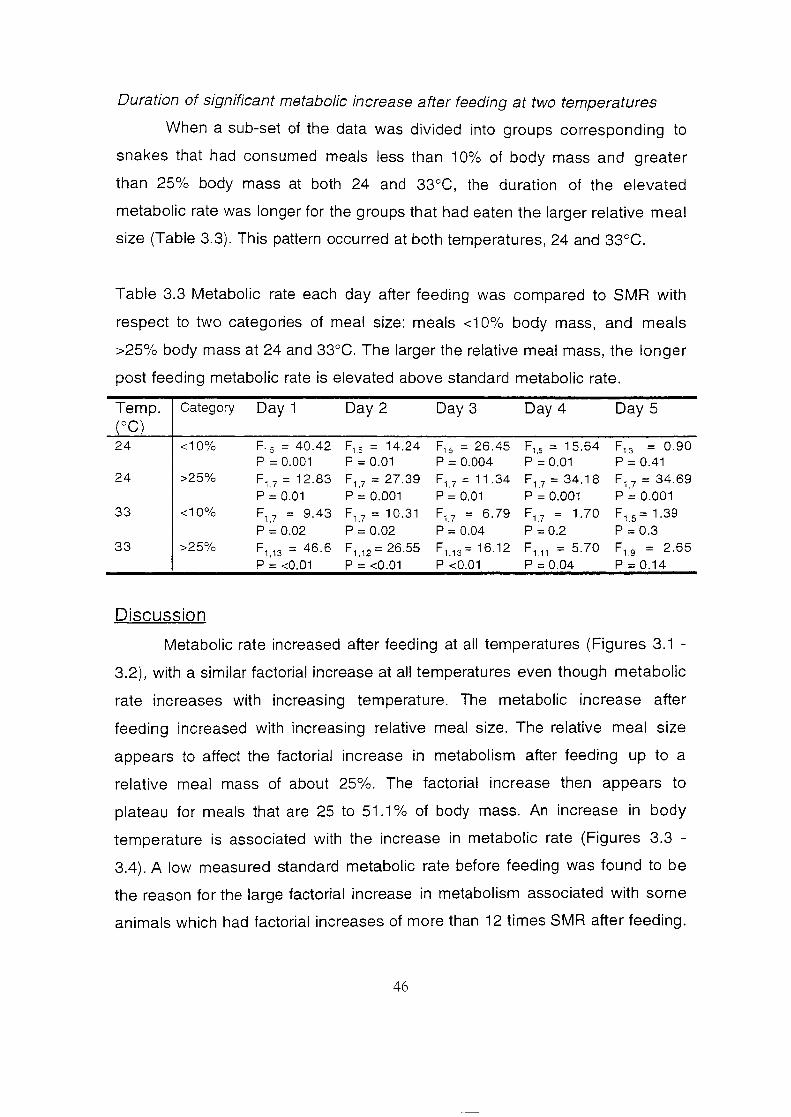
Duration of significant metabolic increase after feeding at two temperatures
When a sub-set of the data was divided into groups corresponding to
snakes that had consumed meals less than 1 0% of body mass and greater
than 25% body mass at both 24 and 33°C, the duration of the elevated
metabolic rate was longer for the groups that had eaten the larger relative meal
size (Table 3.3). This pattern occurred at both temperatures, 24 and 33°C.
Table 3.3 Metabolic rate each day after feeding was compared to SMR with
respect to two categories of meal size: meals <1 0% body mass, and meals
>25% body mass at 24 and 33°C. The larger the relative meal mass, the longer
post feeding metabolic rate is elevated above standard metabolic rate.
Temp. Category Day I Day 2 Day 3 Day 4 Day 5 (oC) 24 <10% F,.5 = 40.42 F,.5 = 14.24 F 1.5 = 26.45 F,,5 = 15.64 F,.3 = 0.90
p = 0.001 p = 0.01 p = 0.004 p = 0.01 p = 0.41 24 >25% F 1.7 = 12.83 F 1.7 = 27.39 F 1.7 = 11.34 F 1.7 = 34.18 F 1.7 = 34.69
p = 0.01 p = 0.001 p = 0.01 p = 0.001 p = 0.001 33 <10% F1,7 = 9.43 F 1.7 = 10.31 F1.7 = 6.79 F,,7 = 1.70 F 1.5 = 1.39
p = 0.02 p = 0.02 p = 0.04 p =0.2 p = 0.3 33 >25% F 1.13 = 46.6 F 1.12 = 26.55 F 1.13 =16.12 F 1.11 = 5.70 F1,9 = 2.65
p = <0.01 p = <0.01 p <0.01 p = 0.04 P=0.14
Discussion
Metabolic rate increased after feeding at all temperatures (Figures 3.1 -
3.2), with a similar factorial increase at all temperatures even though metabolic
rate increases with increasing temperature. The metabolic increase after
feeding increased with increasing relative meal size. The relative meal size
appears to affect the factorial increase in metabolism after feeding up to a
relative meal mass of about 25%. The factorial increase then appears to
plateau for meals that are 25 to 51.1% of body mass. An increase in body
temperature is associated with the increase in metabolic rate (Figures 3.3 -
3.4). A low measured standard metabolic rate before feeding was found to be
the reason for the large factorial increase in metabolism associated with some
animals which had factorial increases of more than 12 times SMR after feeding.
46
The low SMR was thought to have been due to metabolic depression in the
pythons, possibly a result of starvation.
The magnitude of the increase in metabolic rate after feeding was
similar at each temperature resulting in a parallel relationship between SMR
and PMR with increasing temperature (Figure 3.6). Digestive enzyme activity of
pythons may be temperature dependent, similar to the 0 10 of standard
metabolic rate. With increasing temperature, peak metabolic rate for a given
meal size was associated with a reduction in the duration in which metabolic
rate was elevated.
Secor (1995) found the magnitude of SDA was directly correlated with
the food mass, but no mention was made of the duration of elevated
metabolism after feeding. The findings in this study were that metabolic rate did
increase significantly with relative meal size. However, large meals (> 20%)
were associated with a large but constant increase in PMR. Associated with
increasing relative meal size was an increase in the duration of elevated
metabolic rate. At both 24 and 33°C, pythons which had consumed large meals
had metabolic rates after feeding which were elevated above SMR for longer
than those which had consumed small meals.
Figure 3.7 shows the SMRs measured for pythons (Chapter 2) and the
SMR for other snakes as calculated from an allometric equation (Andrews and
Pough 1985) at 30°C. Peak metabolic rates after feeding are also shown for
pythons (7.4 times greater than SMR), and for other snakes (3.1 times greater
than SMR; mean of five species, Secor and Nagy 1994; this study). The SMR of
pythons is lower than other snakes, but the PMR after feeding is higher than
other snakes. This indicates that the low SMR of pythons has a cost associated
with 'gearing up' the gut during digestion (Secor 1995).
47
A. melanocephalus, M. s. variegata and P. nucha/is did not significantly
increase metabolic rate after feeding. A. me/anocephalus and P. nucha/is are
both active foraging species, similar in this respect to the colubrid, Masticophis,
examined by Secor and Nagy (1994). Secor and Nagy found that standard
metabolism for the active foraging Masticophis was 1.6 times higher than that
of a 'sit and wait' species, Crotalus. A smaller increase in metabolic rate
associated with digestion by 'active foragers' compared to 'sit and wait' species
(Secor and Nagy 1994) may be due to the higher SMR starting point (ie; 1.6
times higher before feeding). However, I found no significant interspecific
differences in SMR at any of the experimental temperatures.
Extremely large factorial increases after feeding (> 12 times SMR) were
associated with unusually low SMR values rather than unusually high PMR
values. Benedict (1932) and Secor (1995) fed P. molurus similar relative meal
sizes (29 and 25% respectively). The factorial increase in metabolic rate
measured by Benedict (1932) was only about 8 times SMR compared to 17
times SMR measured by Secor (1995). The results of Benedict (1932) are
more consistent with this study. Benedict (1932) found that SMR was not
different for at least 42 days of fasting in a large (>6 kg) python. However,
longer term fasting resulted in a 2/3 reduction in metabolic rate after 1 00 days
(Benedict 1932). In the present study the peak metabolic increase was not
different between snakes that had very large factorial increases (> 12 times
SMR) and those that had factorial increases <12 times SMR. The magnitude of
the increase after feeding in pythons is determined by the denominator in the
ratio PMRISMR. A small reduction in SMR results in a large increase in
metabolic rate after feeding. This highlights a problem of using ratios m
analysis (Zar 1984).
If the small animals Secor (1995) used had depressed metabolic rates
due to starvation, the factorial increase in metabolic rate after feeding could
possibly be as high as 50 times SMR. This figure was estimated from the
48
minimum level of metabolism due to starvation in P. mo/urus (Benedict 1932),
and the estimated maximum metabolic increase after feeding (this study).
Secor (1995) measured a maximum increase in metabolic rate after feeding of
45 times SMR (Secor 1995). The maximum increase in this study was 41.3 x
SMR at 24°C by a 994 g M. s. spilota, but other large increases included 35.2 x
SMR at 33°C by a 246 g L. childreni and 30.7 x SMR at 27°C by a 2415 g L.
o/ivaceus. These three large factorial increases are by different species at
different temperatures with different masses.
This decline in metabolic rate with starvation (Benedict 1932) is an
involuntary response which is seen in many animals. For small endotherms
this starvation induced metabolic depression can occur soon after digestion
(Schmidt-Nielsen 1990). In healthy pythons, metabolic depression due to
starvation may occur after about 4 - 6 weeks in adult animals (Benedict 1932).
In pythons, standard metabolic rate should be measured within two weeks after
digestion of the previous meal which would be approximately three weeks after
feeding.
Animals were fed at a specified temperature then allowed to digest the
meal. After the animal had defecated it was placed outside in the animal house
for about 2 weeks, and SMR was then measured. In all cases in which the ratio
of fed metabolic rate to SMR is large, the above-mentioned process was
reversed, with SMR being measured before feeding, and several months after
the last meal. Metabolic rate did not return to the "SMR level" even after 15
days in the small P. molurus (Secor and Diamond 1995). This suggests that the
animals were in some form of metabolic depression when the original
"standard metabolic rate" values were measured. In most cases in this study
SMR had returned to original preted levels by 7 - 10 days after feeding,
depending on temperature. Bennett and Dawson (1976) found that the effects
of SDA were mostly short term (1-2 days) except for the large carnivorous
reptiles. Digestion time can be defined as the duration of elevated metabolism
49
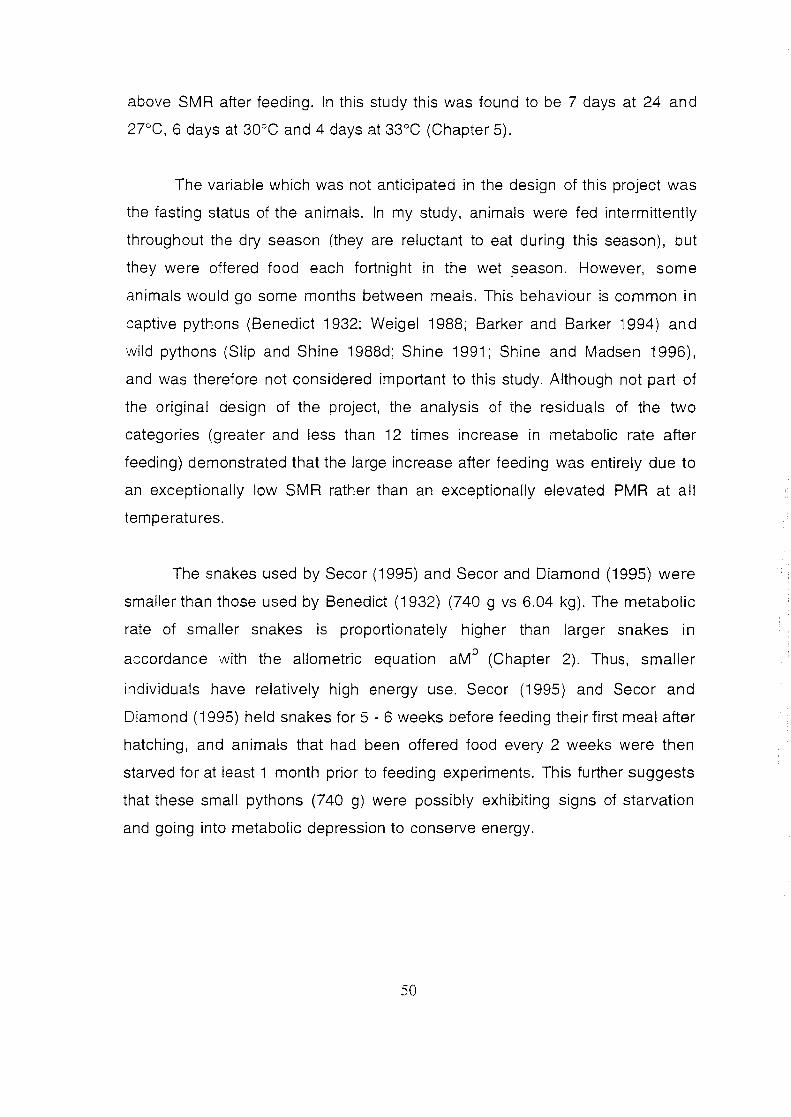
above SMA after feeding. In this study this was found to be 7 days at 24 and
27°C, 6 days at 30°C and 4 days at 33°C (Chapter 5).
The variable which was not anticipated in the design of this project was
the fasting status of the animals. In my study, animals were fed intermittently
throughout the dry season (they are reluctant to eat during this season), but
they were offered food each fortnight in the wet _season. However, some
animals would go some months between meals. This behaviour is common in
captive pythons (Benedict 1932; Weigel 1 988; Barker and Barker 1994) and
wild pythons (Slip and Shine 1988d; Shine 1991; Shine and Madsen 1996),
and was therefore not considered important to this study. Although not part of
the original design of the project, the analysis of the residuals of the two
categories (greater and less than 12 times increase in metabolic rate after
feeding) demonstrated that the large increase after feeding was entirely due to
an exceptionally low SMR rather than an exceptionally elevated PMR at all
temperatures.
The snakes used by Secor (1995) and Secor and Diamond (1995) were
smaller than those used by Benedict (1932) (740 g vs 6.04 kg). The metabolic
rate of smaller snakes is proportionately higher than larger snakes in
accordance with the allometric equation aMb (Chapter 2). Thus, smaller
individuals have relatively high energy use. Secor (1995) and Secor and
Diamond ( 1995) held snakes for 5 - 6 weeks before feeding their first meal after
hatching, and animals that had been offered food every 2 weeks were then
starved for at least 1 month prior to feeding experiments. This further suggests
that these small pythons (7 40 g) were possibly exhibiting signs of starvation
and going into metabolic depression to conserve energy.
50
14l
J python PMR
~ I
I 1 0 ..., I I - ...
.r:: I -l
I
8 ...l E I C\1 0 ' I ·> I
6 ....!
I
4 J I snake SMR
1 2 '"i
J r- python SMR
0 I I I I
0 200 400 600 800 1000
mass (g)
Figure 3. 7 Standard metabolic rate ( Vo2 mL h"1) for pythons and for other
snakes, with their respective peak metabolic rates after feeding at 30°C. SMA
of pythons are lower than other snake SMA, but python PMA is higher than that
of other snakes.
51
The increase in metabolic rate after feeding was associated with an
increase in Tb above ambient temperature. The three largest species of
pythons had higher temperature differentials than the other species. No snakes
coiled tightly after feeding. Larger snakes not only produce more metabolic
heat, but they would have a smaller surface area to volume ratio and therefore
would lose heat to the surrounding environment more slowly (Porter and Gates
1969). An increase in body temperature after feeding in the absence of
external heat has been noted previously for P. molurus, and it was believed to
be the result of shivering (Marcellini and Peters i 982). In the python Morelia s
spilota (Slip and Shine i 988b) and the colubrid Elaphe (Greenwald and
Kanter i 979) there was no difference between ambient and body temperature.
Using mass corrected data, Liasis fuscus had substantially higher
metabolic rates two days after feeding than the basal metabolic rate of the
echidna (Tachyglossus acu/eatus). It was therefore not surprising that body
temperature was higher than cabinet temperature.
It is possible that the 1-2°C increase in Tb after feeding can be of
ecological significance. A number of L. stimsoni regurgitated food at 24°C, but
not at any other temperature. If this increase in temperature after feeding could
be used, the 1-2°C increase in body temperature may be enough to aid the
retention and digestion of food by both this python and possibly M. s. spilota in
a cold climate, or even tropical animals during a cold period.
Pythons are unique among ectotherms in being able to raise
metabolism through two separate methods. Muscular contraction ('shivering')
is used by brooding pythons to raise body and egg temperatures when
ambient temperatures fall, and this temperature increase is a result of a
metabolic increase of up to 22 times SMR (Vinegar et a/. 1970; Harlow and
Grigg 1984). The second mechanism by which pythons increase metabolism,
SDA, usually results in only a moderate increase in metabolism in other
52

animals. Typically SMR is set by the internal organs (Else and Hulbert 1981;
Hulbert and Else 1989; Konarzewski and Diamond 1995), and changes
moderately with feeding and reproduction. The gut of pythons atrophies when
they are unfed, but it rebuilds rapidly after feeding (Secor and Diamond 1995)
resulting in high values of SDA.
In the present study, metabolic rate increased with increasing relative
mass of food, up to 25% of body mass, above which the metabolic increase
maintains a plateau. Increasing relative meal size is associated with an
increase in the duration over which metabolism is significantly elevated above
SMR. This supports the suggestion that digestive resources are finite, and
during the digestion of a large food item the digestive processes may be
operating at a maximal level. If the food mass is relatively small, it can be
digested quickly, without the need for all gastric resources. Thus the maximum
metabolic rate would not be achieved after a small meal. If the mass of food is
greater than 25% of body mass, the peak metabolic increase remains about
the same with increasing meal size (at least to 50% body mass), but the
duration of digestion is significantly increased. Secor and Diamond (1995)
found digestion rate at 28 - 30°C to be sequential. That is, when a number of
rats were eaten, digestion of the second rat to be eaten would not begin until
the first was digested. If digestive resources were unlimited, then all rats
should be digested at the same rate regardless of the order in which they were
consumed. This suggests that digestive resources are finite.
53
Summary
This chapter indicates that both metabolic rate and body temperature
increase after feeding at four experimental temperatures. The extent of the
increase in body temperature was not large in most instances, but was
associated with feeding. The increase in metabolic rate was substantial after
feeding in pythons and some other snake species. However, the net increase
was not as extensive as has been reported (Secor and Diamond 1995).
Extremely large factorial increases in this study were associated with low
SMR's rather than extremely high peak metabolic rates. I suggest that a similar
explanation may account for the extremely high factorial increases previously
reported. The ratio of the peak metabolic rate to SMR was similar across all
temperatures. Larger meals were associated with increased digestion time,
and increasing relative meal size was associated with an increase in metabolic
rate after feeding up to a meal size of 25% of body mass. Peak metabolic rate
did not increase as relative meal size increased from 25% to 50% of body
mass. A critical factor in this study was the time when SMR was measured. Like
many animals, pythons exhibit metabolic depression with starvation (Benedict
1932). I would recommend that SMR be determined within 14 days after the
digestion of the previous meal, and this digestive process would take 7 - 1 0
days, depending on temperature.
54
Introduction
Chapter 4
Digestive Efficiency In Some
Australian Pythons
Energy budgets can be used to assess the ways in which energy
availability influences the rates of physiological processes such as
reproduction, growth and maintenance (Kitchell and Windell 1972; Harwood
1979; Congdon et a/. 1982; Lillywhite 1987). Digestive efficiency (DE) is an
important biological attribute of any species, and it links the physiological and
ecological components of the energy budget. Digestive efficiency is a measure
of the total ingested energy which is available for assimilation by an animal
(Kleiber 1975). Among reptiles, carnivores usually have higher digestive
efficiency than herbivores (Andrews and Asato 1977; Christian et a/. 1984;
Bjorndal 1987; Troyer 1987; Bjorndal and Bolton 1990). Digestive efficiency
increases with increasing temperature in some reptiles (Greenwald and Kanter
1979), but in other cases the reverse is true (Waldschmidt et a/. 1986; 1987,
Avery eta/. 1993). Temperature, sex, season, food intake rate, body mass and
food types have all been associated with differences in digestive efficiency
(Troyer 1987; Avery eta/. 1993; Meienberger eta/. 1993).
The few studies that have assessed the digestive efficiency of snakes
have found high values, similar to the upper efficiency level of some lizards
(Greenwald and Kanter 1979; Zimmerman and Tracy 1989; Xiang eta!. 1996).
Digestive efficiency is known to differ among (Smith 1976) and within species
of snakes (Vinegar et a/. 1970, Greenwald and Kanter 1979). Digestive
efficiency is insensitive to changes in temperature in the corn snake (E!aphe
55
gutata), and passage time in some snake species decreases with increasing
temperature (Smith 1976; Greenwald and Kanter 1979; Nalleau 1983).
Digestive efficiencies of some colubrid snakes are between 84-89%
(Smith 1976; Greenwald and Kanter 1979). The only reported value of
digestive efficiency for a python species (P. molurus), is an estimate of between
93 - 98% of available ingested energy at a body temperature of 2JCC (Vinegar
et a/. 1970). At low temperatures, most snakes regurgitate food to prevent
putrefaction in the gut (Regal 1966). For example, Vipera aspis regurgitated
100% of food at 1 0°C, but only 56% was regurgitated at 15°C (Naulleau 1983).
The aims of this study were to determine the digestive efficiency of
seven taxa of pythons and to examine the relationships between body
temperature, digestive efficiency, passage time and meal size.
Methods
Feeding of Pythons
I measured the digestive efficiency of seven taxa of Australian pythons.
These included: childrens pythons (Liasis childreni) (L.c.), stimson pythons
(Liasis stimsoni) (L.s.), carpet pythons(More/ia spilota variegata) (M.s.v.),
diamond pythons(More/ia s. spilota) (M.s.s.), black headed pythons(Aspidites
melanocephalus) (A.m.), water pythons(Liasis fuscus) (L.f.) and olive
pythons(Liasis olivaceus) (L.o.). These animals were maintained in captivity
(Chapter 2).
Snakes were fasted for longer than 14 days after their last meal before
experiments were commenced (Secor 1995; Secor and Diamond 1995). A
number of animals fed only intermittently, with fasts of up to 6 months between
meals. Most feeding experiments were conducted in the wet season. Each
animal was weighed and fed an equivalent of 3.6 - 58% of their body mass in
rodents. Experiments were conducted at four experimental temperatures
56
(Chapters 2 and 3). Snakes were kept at any one of the four experimental
temperatures inside constant temperature cabinets from the time they were fed
until they defecated. Digestion time is always presented in days after feeding
until defecation.
Calorimetry
After defecation, snake faeces and urates were removed and dried to
constant mass at 75°C (Kitchell and Windell 1972; Brafield and Llewellyn
1982). The whitish urates are a by-product of metabolism (Harwood 1979) and
were generally expelled a few days before the faeces. Dried faecal and urate
mass was measured (Bonso 323 balance, Hong Kong) to the nearest 0.1 g.
Prior to calorimetry, faeces were ground to a fine consistency with a medium
mortar and pestle and small amounts (< 0.2 g) were weighed in a weighing
boat on a Sartorius type 1507 balance. The faeces and urates were then
pressed into pellets in a 15 tonne press (Perkin-Elmer, England) using 13
tonnes pressure for one minute. Pellets were reweighed, kept in a desiccator,
and then were placed in a semi-micro bomb calorimeter (Parr Instruments Inc.
model 1421 Moline, II.), where they were ignited using standard bomb
calorimeter practices (Parr instruction Manual; Paine 1971 ). The heat of
combustion for the calorific grade benzoic acid was used as a standard (26.44
kJ g-1 ; Parr instruments Inc.), with the contribution of fuse wire taken into
account. The hair of rodents was considered indigestible in this study because
of the intact structure and appearance of hair in faeces. The hair was therefore
physically removed from each faecal sample before bomb calorimetry. The wet
mass energy conversion of mice was assumed to be 8.954 kJ g·1 (Brisbin
1970). This value includes hair and would possibly be slightly lower with hair
removed. However because the mass of hair as a percentage of mouse mass
is small no correction has been made to the energy value of mice given by
Brisbin (1970). A standard energy content of 11.121 kJ g·1 (Vinegar eta/. 1970)
was assumed for the urate which included uric acid. The energetic content of
57
uric acid multiplied by the mass of urates resulted in a high amount of energy in
urates in this study.
Analyses
Digestive efficiency represents a minimum percentage of energy
absorbed by the animal (Kleiber 1975; Smith 1976; Greenwald and Kanter
1979) and is generally expressed in percentage terms with the equation:
DE= (Energy content of food -Energy content of faeces) x 100
Energy content of food
(Greenwald and Kanter 1979).
Equation (1) was modified to exclude indigestible components:
*DE= ((Energy content of food -(Energy content of faeces- H) x 100
(Energy content of food - H)
(1)
(2)
where H is the energy content of hair. This was done to reduce the error due to
the inclusion of indigestible energy (Harwood 1979). Equations (1) and (2)
were used to calculate two values of DE for comparison.
Metabolizable energy (ME) is the percentage of ingested energy which
has a physiological fuel value (Greenwald and Kanter 1979). This value
removes faeces and urates from ingested energy. ME is defined by the
equation:
(3)
Where I is the energy ingested, F is energy content of faeces and U is energy
content of urates. Equation 3 was also modified to remove the indigestible
component from the original food item, to give the equation:
*ME - (I- ((F -H)+ U)/ ) X 100 - (1-H)
(4)
58

Because digestive efficiency and metabolizable energy are percentages
or ratios, they were analysed using arcsin transformations (Zar 1984). Paired t
tests were used to compare the two methods of calculating DE and ME.
Passage time (the time from ingestion of food until defecation) was compared
among species and temperatures using analysis of variance. Regression
analysis was used to determine the relationship between meal size as a
percentage of body mass and passage time. Digestion time increases with
increasing meal size at each temperature (Chapter 3), so it was thought that
meal size and temperature would affect passage time. There were too few
samples in each category at each temperature to analyse the data in the
categories outlined in chapter 3, so meal sizes were placed into three
categories according to the percentage of body mass the snake consumed:
small meals (< 1 0%), medium meals (1 0 - 20%) and large meals (> 20%). A
linear regression was determined for passage time against experimental
temperatures. The residual deviations from the regression line give an
indication of the passage time corrected for temperature. The residual
deviations from the regression line represent temperature-independent values
that were then analysed using ANOVA with respect to the three groups
described above. If the pythons in the large meal category had significantly
higher residuals than those in the smaller meal categories then this analysis
would indicate that the passage time of large meals is longer than the passage
of smaller meal categories independent of temperature.
Results
Ingestible Portion of Food
Using a lime solution, hair was removed from a sample of rodents
ranging in mass from 23 - 500 g. The hair was then rinsed, dried to constant
temperature and weighed. The mass of hair was significantly correlated (P <
0.0001) with the mass of the rodent:
59
hair mass= -0.211 + 0.017 x rodent mass; R2 = 0.998. (5)
This equation was used to estimate the mass of hair of the rodents used
in feeding trials, and this mass was subtracted from both the meal and the
faecal mass. Hair has an energetic content higher than faecal samples
(Vinegar et a!. 1970), and it constitutes a high proportion of the total faecal
pellet.
Digestive Efficiency
Temperature did not significantly (ANOVA P > 0.05) influence DE for any
taxa studied using either equation 1 or 2. Comparisons of species at each
temperature revealed a significant difference in DE only at 33°C (ANOVA F6,35 =
2.729; P = .03). Fisher PLSD tests revealed that Aspidites melanocephalus
had a lower DE than all other species, and the DE of L. childreni was lower
than that of L. olivaceus and L. stimsoni at this temperature (Table 4.1 ).
Digestive efficiency was significantly higher for all species at all
temperatures (paired t, P = <0.0001) when hair was removed from the analysis,
compared to the original method in which hair was included in the calculation
of DE. There were no statistically significant differences among species at any
of the four temperatures (ANOVA P > 0.05) if hair was removed from the
analysis. If hair is included in faecal analysis, metabolizable energy is not
significantly different among species at three of the four temperatures (24, 27
and 33°C). At 30°C, the ME of L. childreni was significantly lower than that of L.
olivaceus, M. s. spilota, L. fuscus. The ME of M. s. variegata was also lower
than that of L. fuscus. If hair was removed from the analysis, ME was not
significantly different among species at three of the four temperatures (P >.05).
At 30°C, L. childreni had a lower ME than the five other python taxa examined
(L. fuscus, L. o/ivaceus, L. stimsoni, M. s. spilota and M. s. variegata).
60
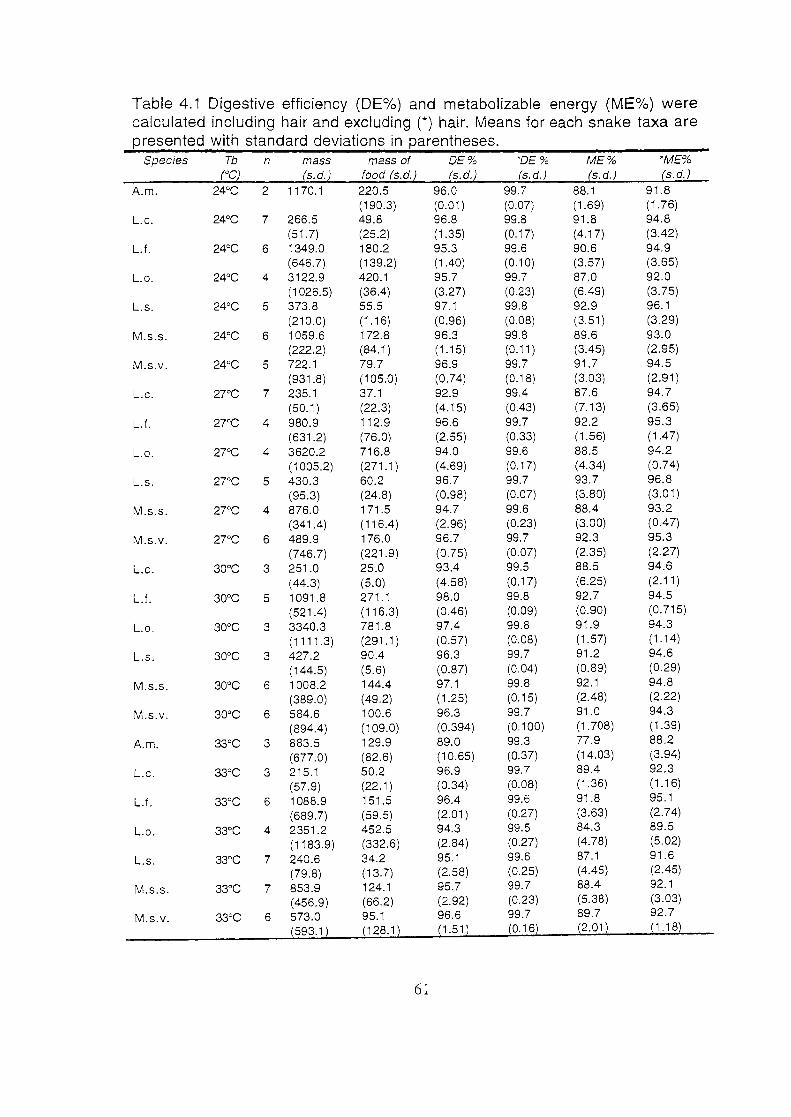
Table 4.1 Digestive efficiency (DE%) and metabolizable energy (ME%) were calculated including hair and excluding (*) hair. Means for each snake taxa are presented with standard deviations in parentheses.
Species Tb n mass mass of DE% *DE% ME% *ME%
CCJ (s.d.) food (s.d.2 (s.d.2 (s.d.) (s.d.) (s.d.)
A.m. 24°C 2 1170.1 220.5 96.0 99.7 88.1 91.8 (190.3) (0.01) (0.07) (1.69) (1.76)
L.c. 24°C 7 266.5 49.8 96.8 99.8 91.8 94.8 (51.7) (25.2) (1.35) (0.17) (4.17) (3.42)
L.f. 24°C 6 1349.0 180.2 95.3 99.6 90.6 94.9 (646.7) (139.2) (1.40) (0.10) (3.57) (3.65)
L.o. 24°C 4 3122.9 420.1 95.7 99.7 87.0 92.0 (1026.5) (36.4) (3.27) (0.23) (6.49) (3.75)
L.s. 24°C 5 373.8 55.5 97.1 99.8 92.9 96.1 (210.0) (1.16) (0.96) (0.08) (3.51) (3.29)
M.s.s. 24°C 6 1059.6 172.8 96.3 99.8 89.6 93.0 (222.2) (84.1) (1.15) (0.11) (3.45) (2.95)
M.s.v. 24°C 5 722.1 79.7 96.9 99.7 91.7 94.5 (931.8) (105.0) (0.74) (0.18) (3.03) (2.91)
L.c. 27°C 7 235.1 37.1 92.9 99.4 87.6 94.7 (50.1) (22.3) (4.15) (0.43) (7.13) (3.65)
L.f. 27"C 4 980.9 112.9 96.6 99.7 92.2 95.3 (631.2) (76.0) (2.55) (0.33) (1.56) (1.47)
L.o. 27°C 4 3620.2 716.8 94.0 99.6 88.5 94.2 (1 005.2) (271.1) (4.69) (0.17) (4.34) (0.74)
L.s. 27"C 5 430.3 60.2 96.7 99.7 93.7 96.8
(95.3) (24.8) (0.98) (0.07) (3.80) (3.01)
M.s.s. 2TC 4 876.0 171.5 94.7 99.6 88.4 93.2
(341.4) (116.4) (2.96) (0.23) (3.00) (0.47)
M.s.v. 27"C 6 489.9 176.0 96.7 99.7 92.3 95.3
(746.7) (221.9) (0.75) (0.07) (2.35) (2.27)
L.c. 30°C 3 251.0 25.0 93.4 99.5 88.5 94.6
(44.3) (5.0) (4.58) (0.17) (6.25) (2.11)
L.f. 30°C 5 1091.8 271.1 98.0 99.8 92.7 94.5
(521.4) (116.3) (0.46) (0.09) (0.90) (0.715)
L.o. 30°C 3 3340.3 781.8 97.4 99.8 91.9 94.3
(1111.3) (291.1) (0.57) (0.08) (1.57) (1.14)
L.s. 30°C 3 427.2 90.4 96.3 99.7 91.2 94.6
(144.5) (5.6) (0.87) (0.04) (0.89) (0.29)
M.s.s. 30°C 6 1008.2 144.4 97.1 99.8 92.1 94.8
(389.0) (49.2) (1.25) (0.15) (2.48) (2.22)
M.s.v. 30°C 6 584.6 100.6 96.3 99.7 91.0 94.3
(894.4) (109.0) (0.394) (0.100) (1.708) (1.39)
A.m. 33°C 3 883.5 129.9 89.0 99.3 77.9 88.2
(677.0) (82.6) (10.65) (0.37) (14.03) (3.94)
L.c. 33°C 3 215.1 50.2 96.9 99.7 89.4 92.3
(57.9) (22.1) (0.34) (0.08) (1.36) (1.16)
L.f. 33°C 6 1088.9 151.5 96.4 99.6 91.8 95.1
(689.7) (59.5) (2.01) (0.27) (3.63) (2.74)
L.o. 33°C 4 2351.2 452.5 94.3 99.5 84.3 89.5
(1183.9) (332.6) (2.84) (0.27) (4.78) (5.02)
L.s. 33°C 7 240.6 34.2 95.1 99.6 87.1 91.6
(79.8) (13.7) (2.58) (0.25) (4.45) (2.45)
M.s.s. 33°C 7 853.9 124.1 95.7 99.7 88.4 92.1
(456.9) (66.2) (2.92) (0.23) (5.38) (3.03)
M.s.v. 33°C 6 573.0 95.1 96.6 99.7 89.7 92.7
(593.1) (128.1) ( 1.51 l (0.16) (2.01) (1.18)
61
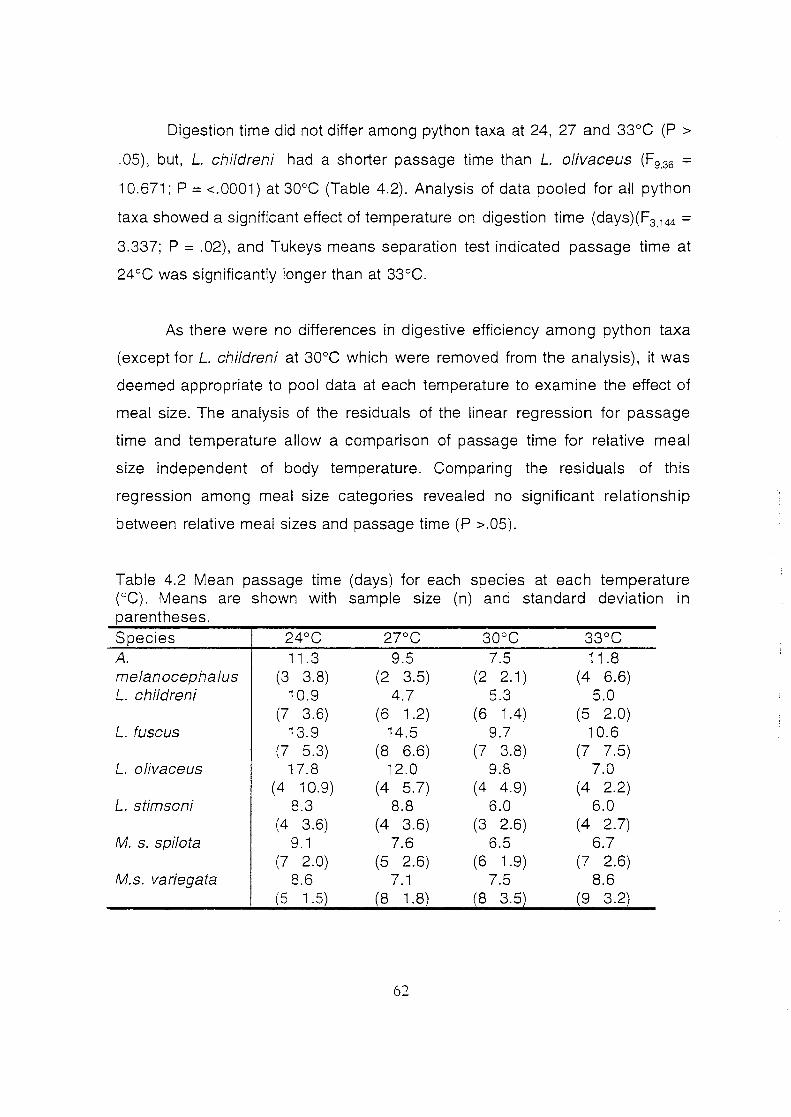
Digestion time did not differ among python taxa at 24, 27 and 33°C (P >
.05), but, L. childreni had a shorter passage time than L. olivaceus (F9_36 = 10.671; P = <.0001) at 30°C (Table 4.2). Analysis of data pooled for all python
taxa showed a significant effect of temperature on digestion time (days)(F3.144 =
3.337; P = .02), and Tukeys means separation test indicated passage time at
24°C was significantly longer than at 33°C.
As there were no differences in digestive efficiency among python taxa
(except for L. childreni at 30°C which were removed from the analysis), it was
deemed appropriate to pool data at each temperature to examine the effect of
meal size. The analysis of the residuals of the linear regression for passage
time and temperature allow a comparison of passage time for relative meal
size independent of body temperature. Comparing the residuals of this
regression among meal size categories revealed no significant relationship
between relative meal sizes and passage time (P >.05).
Table 4.2 Mean passage time (days) for each species at each temperature (°C). Means are shown with sample size (n) and standard deviation in parentheses. Species 24°C 27°C 30°C 33°C A. 11.3 9.5 7.5 11.8 melanocephalus (3 3.8) (2 3.5) (2 2.1) (4 6.6) L. childreni 10.9 4.7 5.3 5.0
(7 3.6) (6 1.2) (6 1.4) (5 2.0) L. fuscus 13.9 14.5 9.7 10.6
(7 5.3) (8 6.6) (7 3.8) (7 7.5) L. o/ivaceus 17.8 12.0 9.8 7.0
(4 1 0.9) (4 5.7) (4 4.9) (4 2.2) L. stimsoni 8.3 8.8 6.0 6.0
(4 3.6) (4 3.6) (3 2.6) (4 2.7) M. s. spilota 9.1 7.6 6.5 6.7
(7 2.0) (5 2.6) (6 1.9) (7 2.6) M.s. variegata 8.6 7.1 7.5 8.6
(5 1 .5) (8 1.8) (8 3.5) (9 3.2)
62
Discussion
Digestive efficiency in pythons was very high regardless of species,
meal size or temperature. In this study digestive efficiency was extremely high
after the removal of the indigestible portion from the analysis. Passage time did
not vary with meal sizes but varied with experimental temperature, with higher
temperatures resulting in shorter passage times.
Food is generally defined as "any substance that can be taken into the
body by a living organism and changed into energy and body tissue" (Hanks
1990). If an item cannot be digested and converted into utilisable products,
then it is not really food. Digestive efficiency (DE) has conventionally been
described using equation 1 (Harwood 1979; Waldschmidt et a/. 1987).
Because hair is indigestible by pythons, it was removed from the calculations
for digestive efficiency using the modified equation 2. The proportion of hair in
faeces is very high (> 90% of faecal mass), and if faeces are treated as
homogeneous then the energy content of faeces is higher than if the hair is
removed. This results in an error in the calculation of energy available for
assimilation. The calculation of the amount of hair in faeces overestimates the
amount of energy available for assimilation by 5 - 7%. The difference between
the energy content of food and the energy content of faeces in equation 2, was
higher than has been reported for any other reptile (Vinegar eta/. 1970; Smith
1976; Xiang eta!. 1996). This reflects the effect of excluding the indigestible
hair from the analysis.
Calculations of digestive efficiency in pythons including hair in the faecal
sample were similar to values obtained for Python molurus (Vinegar et a/.
1970), but higher than reported for most other reptiles (Kitchell and Windell
1972; Smith 1976; Greenwald and Kanter 1979). A recent study on
insectivorous lizards found a very high DE ranging between 91 - 93% (Xiang et
a/. 1996). Neither temperature nor meal size influenced DE, as was the case
63
for other snake species (Smith 1976), which may reflect the efficient nature with
which snakes digest food.
ME values were 9 and 7% less than DE values when snakes were
maintained at 20 and 31 oc respectively (Greenwald and Kanter 1979).
Metabolizable energy was 3% lower than DE in corn snakes in the laboratory
(Smith 1976). For lizards with high DE fed on crickets, ME was about 5-7% less
than DE (Xiang et a/. 1996). In this study the ME was 3 - 7% less than DE
values, using either equation 3 or 4. Much of the energy from ingested food
items is available for physiological processes.
Digestive efficiency of a single blackheaded python was very low
compared to other blackheaded pythons at 33°C (86% vs 93%). On several
occasions this individual regurgitated rodents which were covered with
hundreds of nematodes ( Ophiascaris sp.). Gastric parasites may decrease the
digestive efficiency of snakes.
Passage time decreased with increasing temperature in these pythons,
and this pattern is typical for reptiles (Greenwald and Kanter 1979;
Waldschmidt et a/. 1 987; Xiang eta/. 1996). However, passage time is a poor
indicator of digestive rate in some species (especially pythons) which can
either retain faeces in the large intestine for months (Secor and Diamond 1995;
Fyfe pers. comm, pers. obs.), or defecate when presented with new
surroundings (Stow and Shine 1994).
The relative meal size did not affect passage time, although digestion
time as measured by the elevated metabolic rate after feeding (Chapter 3) was
significantly longer with larger relative meal sizes. The faeces of pythons is
generally solid and appears to retain little water (pers. obs.). The retention of
faeces by pythons regardless of meal size or temperature may serve to reduce
faecal water loss.
64
The high efficiency with which food is digested in pythons would partially
compensate for a low volume of food if pythons wait for days or months
between meals (Secor 1995; Slip and Shine 1988d). Digestion time
represents an energetic cost, but extended passage time beyond digestion
time does not represent an energetic cost, as the elevated metabolic rate
associated with digestion has returned to SM R levels.
Summary
Digestive efficiency was redefined in this chapter to exclude the
indigestible portion of energy ingested. Calculated in this manner digestive
efficiency is very high. However, I believe this to be more representative of the
true digestive properties of pythons at the temperatures examined. For a 'sit
and wait' predator which may fast for months, a very high digestive efficiency
may be a necessary adaptation to a low energy survival strategy. Relative meal
size does not affect passage time, however, at lower temperatures the passage
time is extended.
An increase in body temperature after feeding would have physiological
and ecological benefits because although digestive efficiency is not affected by
temperature, passage time is almost twice as fast at 33°C as it is at 24°C.
Therefore pythons could digest efficiently and quickly and consume more prey
items in a short time at the higher temperature. This may explain why pythons
exhibit a thermophilic response to feeding (Slip and Shine 1988b).
Conversely, at low temperatures digestion time is longer but digestive
efficiency is still high, and this may favour the selection of lower body
temperatures if food is scarce because of the lower metabolic costs of digestion
(Chapter 5). Being able to maximise the energy in food by either utilising a high
temperature when food is abundant or a low temperature when food is scarce
illustrates the effectiveness and flexibility of pythons as low energy specialists.
65
Introduction
Chapter 5
Energy Budgets For Some
Australian Pythons
Models for the energy flow of birds and domestic mammals have
received considerable attention for over half a century (Brody 1945; Helms
1968; Kleiber 1975; in Smith 1976; Bell 1990; Afik and Karasov 1995).
Recently a number of energy models for terrestrial ectothermic vertebrates
have been determined (Vinegar eta/. 1970; Kitchell and Windell 1979; Smith
1976; Greenwald and Kanter 1979; Congdon et al. 1982).
Energy budgets are useful management tools, for both wild and captive
animals (Brody 1945), because they delineate the patterns of energy allocated
for different physiological functions such as growth, reproduction, maintenance,
and activity, possibly including important ecological activities such as prey
capture and territory defence (Kitchell and Windell 1972; Smith 1976). In
ectotherms, metabolic energy expenditure changes in response to variables
including: temperature, sex, season, food availability, elevation, foraging mode
and time of day (Bennett and Dawson 1976). Different species may show very
different patterns of energy allocation (e.g., Smith 1976; Secor and Nagy
1994). Two species of colubrid snakes exhibited different energy flows due to
different foraging modes (Smith 1976).
An overview of an animal energy budget can be given by the equation:
I = G + R + E (Welch 1968)
66
where I is the energy in food ingested, G is energy expended on growth, R is
respiratory energy and E is energy egested. Few studies of this type have been
completed for snakes (Smith 1976; Kitchell and Windell 1972). A complete
energy budget has only been delineated for one species of python (Python
curtus), in which three sibling P. curtus hatchlings had different growth rates
over three years (Vinegar eta/. 1970).
In this chapter I determine the major components of the energy budget (1,
G, Rand E) for a number of Australian python taxa from laboratory studies, and
investigate the patterns of energy allocation at each of four experimental
temperatures (24, 27, 30 and 33°C). Captive animals were maintained over a
three month period at naturally cycling ambient temperatures and their growth
patterns were quantified.
Methods
Four major components of the energy budget, namely, standard
metabolic rate (SMR), total cost of metabolism during digestion (TSMRf),
growth and activity were used to investigate patterns of energy flow at different
experimental temperatures and at variable ambient temperatures for a number
of python taxa. To construct the energy budget, I use the results from previous
chapters. The data are presented as means, but standard deviations are not
presented unless the results have not been previously presented. Peak
metabolic rate was defined as the factorial increase in metabolism above SMR
on day two after feeding. Total cost of metabolism during digestion (TSMRf)
was the metabolic increase including SMR for the duration of digestion.
Digestion was deemed to cease when a stable low metabolic rate was re
established. No significant species effects were evident in the SMR of pythons,
therefore data from the python taxa were pooled and the temperature
dependent standard metabolic rates were determined using empirical
equations derived from oxygen consumption for each temperature, taken from
67
Chapter 2. The thermal sensitivity (010) of metabolism to temperature of the
pythons in this study was 2.60 (Chapter 2). Metabolic increase with feeding
represents a significant energetic cost to pythons. The metabolic increases
each day during digestion were determined in Chapter 3, but the total
metabolic cost of digestion was calculated here (see below). Excess available
energy is energy available to the python from a food item for growth,
reproduction and activity, when all costs including SMR and TSMRf have been
removed. Ingested energy is all energy ingested minus that which is
indigestible, and assimilated energy is energy which can be used by the body.
Digestive efficiency and excess available energy were determined from
ingested energy (Chapter 4).
The cost of digestion is the energy needed to digest food. After feeding
the magnitude of the metabolic increase above SMR was insensitive to
temperature when all data for pythons were pooled (Chapter 3). This means
that SMR and PMR are intrinsically linked, and a higher metabolic rate due to
temperature results in an overall higher metabolic rate during digestion.
In this study PMR was up to 42 times SMR, and similarly high values
have been reported elsewhere (45 times SMR; Secor 1995). However, such
large values of the ratio of PMR to SMR indicate that SMR has been measured
during a period of extremely low SMR or metabolic depression, possibly
related to starvation (Chapter 3). To remove the effects of a substantially low
SMR, the 95% confidence interval around the mean PMR was used to discard
metabolic increases which were considered exceptionally high or low. The
PMR, averaged 5.8 times SMR at 24°C, 7.7 at 2JCC, 7.4 at 30°C and 5.6 times
SMR at 33°C.
The duration of elevated metabolic rate associated with digestion varies
with temperature (see Figures 3.1 - 3.2, Chapter 3). The metabolic response to
feeding was monitored for five days after feeding to determine the peak
68
response. However, the duration of elevated metabolism varied with
temperature, and in most cases was longer than five days (Chapter 3). A grand
mean of the increase in metabolic rate for each day after feeding was used to
determine the total cost of digestion at each temperature. The magnitude of the
metabolic increase on days subsequent to day five was determined from a
subset (n = 9) of animals which were monitored for 9 days after feeding. At
24°C and 2JCC the duration of the elevated metabolism after feeding was 7
days, after which metabolism declined to a stable level. Higher temperatures
reduced the duration of the elevated metabolism after feeding. Metabolism was
elevated for 6 days at 30°C and 4 days at 33°C. Hence, the total cost of
digestion was determined using these time periods. The total cost of energy
used in digestion was calculated from the addition of the number of times
metabolic rate increased above SMR for each day during digestion (Table 5.1 ).
The energy budgets for all python taxa were determined at natural
fluctuating shaded temperatures. Captive pythons in each of the taxa were fed
a known quantity of rodents, 6 times over 3 months of the wet season. The
components used in the calculation of the energy budgets are defined in Table
5.2.
69
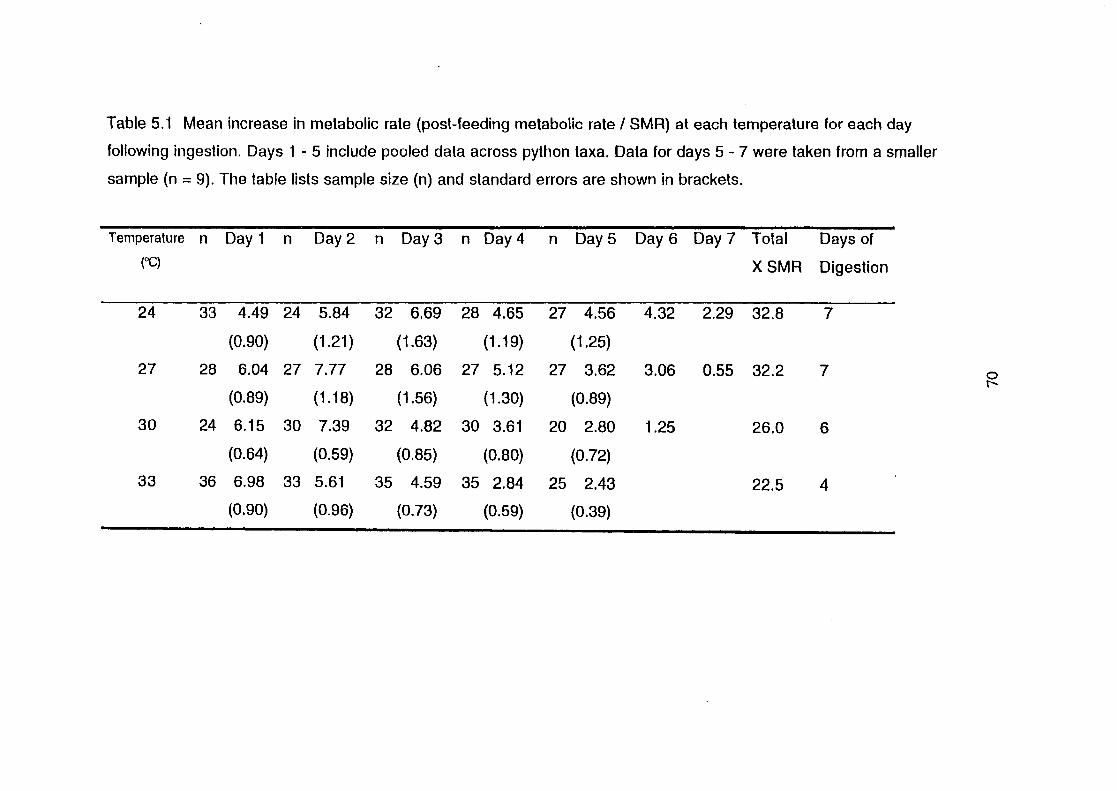
Table 5.1 Mean increase in metabolic rate (post-feeding metabolic rate I SMR) at each temperature for each day
following ingestion. Days 1 - 5 include pooled data across python taxa. Data for days 5-7 were taken from a smaller
sample (n = 9). The table lists sample size (n) and standard errors are shown in brackets.
Temperature n Day 1 n Day2 n Day3 n Day4 n Day5 Day 6 Day7 Total Days of ("C) XSMR Digestion
24 33 4.49 24 5.84 32 6.69 28 4.65 27 4.56 4.32 2.29 32.8 7
(0.90) (1.21) (1.63) (1.19) (1.25)
27 28 6.04 27 7.77 28 6.06 27 5.12 27 3.62 3.06 0.55 32.2 7
(0.89) (1.18) (1.56) (1.30) (0.89)
30 24 6.15 30 7.39 32 4.82 30 3.61 20 2.80 1.25 26.0 6
(0.64) (0.59) (0.85) (0.80) (0.72)
33 36 6.98 33 5.61 35 4.59 35 2.84 25 2.43 22.5 4
(0.90) (0.96) (0.73) (0.59) (0.39)
0 t--

Table 5.2 The components of the energy budgets (from Kitchell and Windell
1972).
Process
Energy Ingested (kJ)
Energy Egested (kJ)
Energy Excreted (kJ)
Energy Ecdysis (kJ)
Energy Metabolism (kJ)
Energy Digestion (kJ)
Digestive Efficiency (%)
Digestive Efficiency * (%)
Growth (kJ)
Growth *(kJ)
Conversion
Gross Efficiency(%)
Net Efficiency (%)
Symbol
I
F
u s SMR
(TSMRt)
1-Fj DE,= 1 x 100
DE = (!-hair) -F / . 100 2 l-ha1r X
Definition
food consumed
faecal waste
urinary waste
shed skin
standard metabolic rate
metabolic cost of digestion
percentage efficiency
percentage efficiency minus
indigestible portion
G = (I - hair) x (DE, /1 00) - growth = ingested energy
(SMR + TSMR1) minus energy costs
G* = (I - hair) x (DE2 /1 00) - growth = ingested energy
(SMR + TSMR1+ S) minus energy costs
AE,, AE2
AE, = 8 / 1 X 100 I converted to G, not
corrected for F, U and S
I converted to G, corrected
for F. U and S
Equations 1 - 3 below set out the energy available for assimilation by
pythons. Equation four estimates the amount of energy available for activity
after assimilation. In the following equations, Mf is mass of food. In the
allometric equation MR =a Mb (Chapter 2), M is the mass of the snake, and a
and b are constants empirically determined to represent the SMR of a 1 g
animal and the slope of the regression for total metabolism (ml 0 2 g- 1h-1 ) on a
double logarithmic scale (Bennett and Dawson 1976)(Chapter 2). Allometric
equations can be used to determine SMR of pythons at each of the
experimental temperatures in this study, however, I have used measured
values. It should be recognised that SMR varies with body size, so where
71
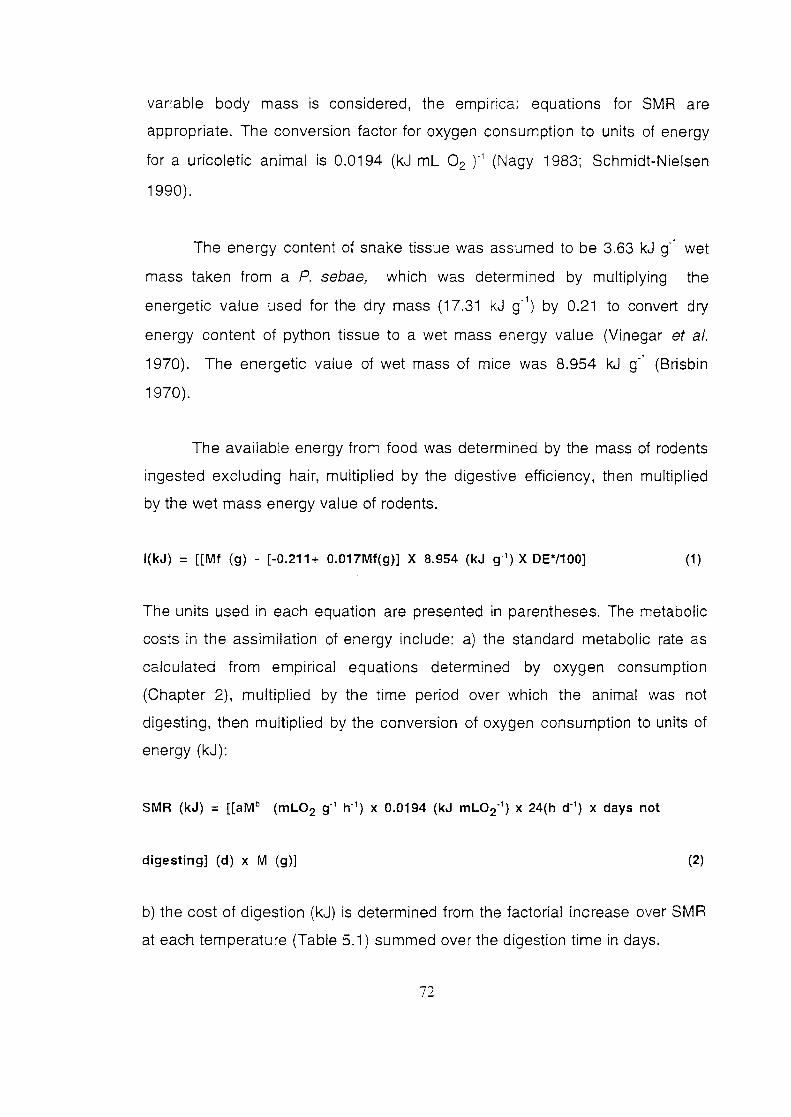
variable body mass is considered, the empirical equations for SMR are
appropriate. The conversion factor for oxygen consumption to units of energy
for a uricoletic animal is 0.0194 (kJ ml 0 2 )" 1 (Nagy 1983; Schmidt-Nielsen
1990).
The energy content of snake tissue was assumed to be 3.63 kJ g·1 wet
mass taken from a P. sebae, which was determined by multiplying the
energetic value used for the dry mass (17.31 kJ g· 1) by 0.21 to convert dry
energy content of python tissue to a wet mass energy value (Vinegar et a/.
1970). The energetic value of wet mass of mice was 8.954 kJ g-1 (Brisbin
1970).
The available energy from food was determined by the mass of rodents
ingested excluding hair, multiplied by the digestive efficiency, then multiplied
by the wet mass energy value of rodents.
l(kJ) = [[Mf (g) - [-0.211+ 0.017Mf(g)] X 8.954 (kJ g·1 ) X DE*/100] (1)
The units used in each equation are presented in parentheses. The metabolic
costs in the assimilation of energy include: a) the standard metabolic rate as
calculated from empirical equations determined by oxygen consumption
(Chapter 2), multiplied by the time period over which the animal was not
digesting, then multiplied by the conversion of oxygen consumption to units of
energy (kJ):
digesting] (d) x M (g)] (2)
b) the cost of digestion (kJ) is determined from the factorial increase over SMR
at each temperature (Table 5.1) summed over the digestion time in days.
72
k
TSMRf(kJ) = I [aMb(mL02 g·1h"1) x factorial increase in metabolism on the i th
/=1
day X 24 (h d"1) X 0.0194 (kJ mlo2 ·1) X M(g)] (3)
where i denotes each day after feeding for which metabolism is elevated, and k
is the final day for which metabolism is elevated. Growth (kJ) was calculated by
multiplying the difference between initial and final mass by the conversion
factor of 3.63 kJ g·1 for wet python tissue (Vinegar eta/. 1970). Energy available
for activity was calculated as energy ingested (excluding hair) minus the
metabolic costs of: faeces, urates, SMR, TSMR1 and the energy expended in
growth.
The amount of energy devoted to activity can then be calculated from the
equation:
Energy used for activity (kJ) = I (kJ) - [F(kJ) + U(kJ) + SMR(kJ) + TSMRf(kJ) +
G(kJ)] (4)
Statistical Analysis
Analysis of variance was used on arcsin-transformed data to analyse the
percentage of energy assimilated by snakes at the four temperatures.
Regression analyses were used to determine the relationship between shed
skin and mass of snake.
As a measure of the extent of metabolic elevation after feeding, the
metabolic increase each day after feeding was divided by SMR at each
temperature for all taxa. The data were divided into the five meal size
categories: 0 - 9.9%, 10 - 14.9%, 15 - 19.9%, 20 - 24.9% and > 25% of body
mass in food. The ratios (arcsin transformed) corresponding to the meal size
73

categories were compared on each day after feeding using analysis of
variance to determine the effect of meal size on the duration of elevated
metabolism after feeding.
Results
Energy in shed skin
Another variable in the energy budget of reptiles is the cost of shedding
skin. This was not measured in the laboratory study, but shed skin was
incorporated into the calculation of the wet season feeding experiments. The
energy content of shed skins was assumed to be 23.577 kJ g-1 (Smith 1976).
The mass of shed skin was calculated from the regression of the mass of a
sample of shed python skins on python mass. The mass of shed skins was
significantly correlated with body mass(~= .824);(ANOVA F123 = 103.13; P <
0.0001 ). The energy content of shed skin was calculated by using the
regression equation as follows:
s (kJ) = [0.685 + 0.003 X M(g)] X 23.577(kJg-1) (5)
Costs of metabolism after feeding
Table 5.3 shows the energy used for growth and activity after the
energetic costs have been subtracted from the energy obtained from food
ingested at each temperature. A time period of 14 days was used in this energy
budget to demonstrate the effect of, not only the cost of digestion on the net
benefit of ingested energy, but also the cost of daily metabolism while post
absorptive. The energy used by resting pythons was determined over the time
period where the animal was not digesting. The total cost of digestion
(excluding SMR) is shown in the column TSMRf. Digestive efficiency is shown
in the table, and this was multiplied by the mass of food to determine the
amount of food which could be used by the body. The table also shows the
percentage energy used for activity and the percentage of available energy
74
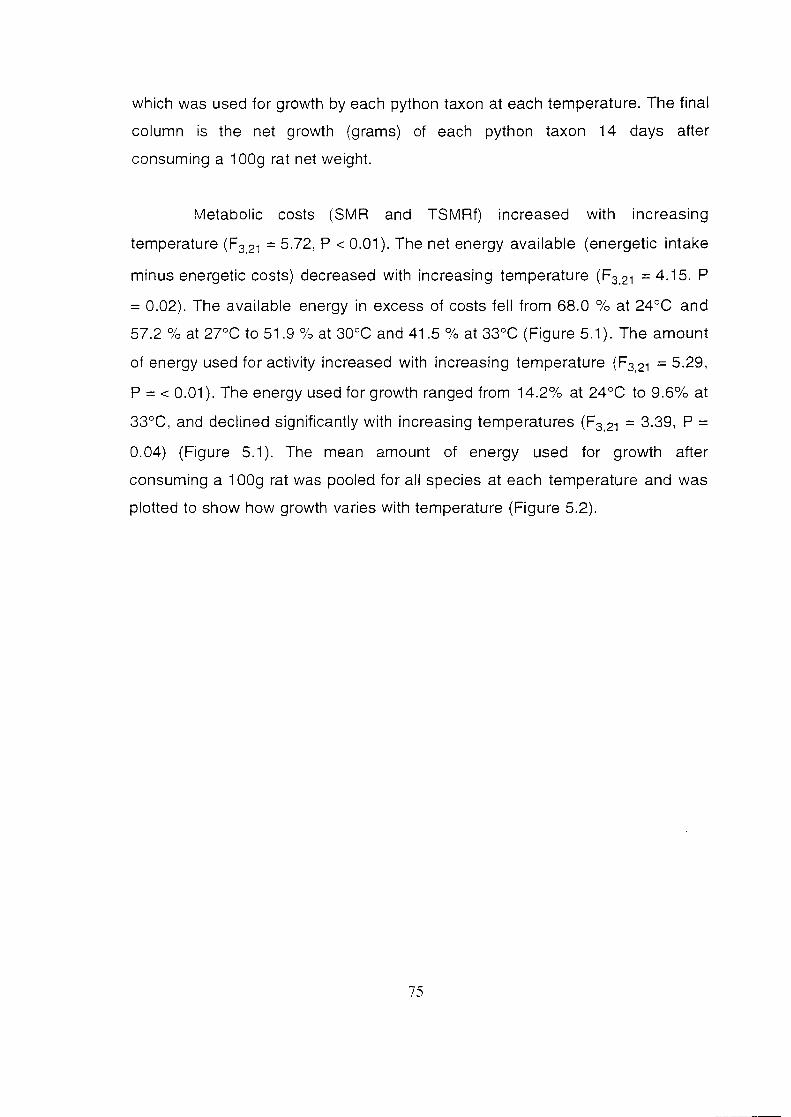
which was used for growth by each python taxon at each temperature. The final
column is the net growth (grams) of each python taxon 14 days after
consuming a 1 OOg rat net weight.
Metabolic costs (SMA and TSMRf) increased with increasing
temperature (F3,21 = 5.72, P < 0.01). The net energy available (energetic intake
minus energetic costs) decreased with increasing temperature (F3 21 = 4.15, P
= 0.02). The available energy in excess of costs fell from 68.0 % at 24°C and
57.2% at 2?DC to 51.9% at 30°C and 41.5% at 33°C (Figure 5.1). The amount
of energy used for activity increased with increasing temperature (F3,21 = 5.29,
P = < 0.01 ). The energy used for growth ranged from 14.2% at 24°C to 9.6% at
33°C, and declined significantly with increasing temperatures (F3.21 = 3.39, P =
0.04) (Figure 5.1 ). The mean amount of energy used for growth after
consuming a 1 OOg rat was pooled for all species at each temperature and was
plotted to show how growth varies with temperature (Figure 5.2).
75
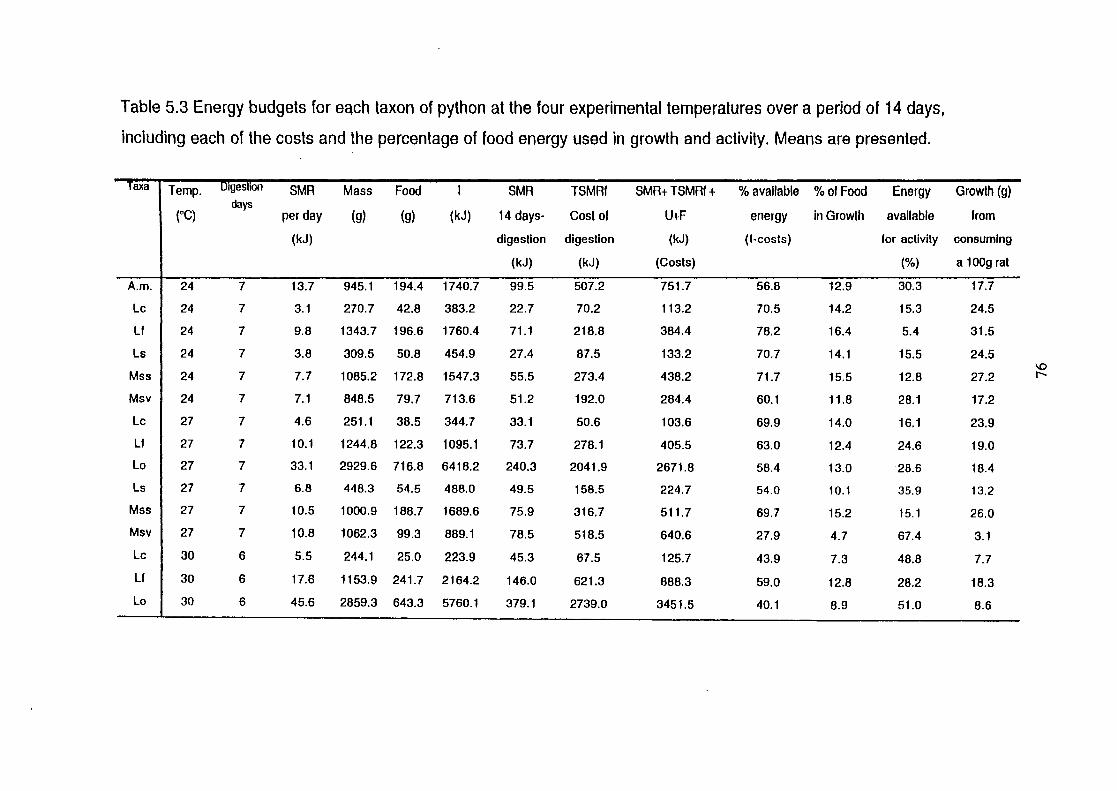
Table 5.3 Energy budgets for each taxon of python at the four experimental temperatures over a period of 14 days,
including each of the costs and the percentage of food energy used in growth and activity. Means are presented.
ax a Temp. 1ges ton SMA Mass Food SMA TSMAI SMA+ TSMAI+ %available %of Food Energy Growth (g)
(CC) days
per day (g) (g) (kJ) 14 days- Cost of U+F in Growth available from energy
(kJ) digestion digestion (kJ) (1-cosls) for activity consuming
(kJ) (kJ) (Costs) (%) a 100g rat
A.m. 24 7 13.7 945.1 194.4 1740.7 99.5 507.2 751.7 56.8 12.9 30.3 17.7
Lc 24 7 3.1 270.7 42.8 383.2 22.7 70.2 113.2 70.5 14.2 15.3 24.5
lf 24 7 9.8 1343.7 196.6 1760.4 71.1 218.8 384.4 78.2 16.4 5.4 31.5
ls 24 7 3.8 309.5 50.8 454.9 27.4 87.5 133.2 70.7 14.1 15.5 24.5 \0
Mss 24 7 7.7 1085.2 172.8 1547.3 55.5 273.4 438.2 71.7 15.5 12.8 27.2 (--
Msv 24 7 7.1 848.5 79.7 713.6 51.2 192.0 284.4 60.1 11.8 28.1 17.2
Lc 27 7 4.6 251.1 38.5 344.7 33.1 50.6 103.6 69.9 14.0 16.1 23.9
Lf 27 7 10.1 1244.8 122.3 1095.1 73.7 278.1 405.5 63.0 12.4 24.6 19.0
Lo 27 7 33.1 2929.6 716.8 6418.2 240.3 2041.9 2671.8 58.4 13.0 ·28.6 18.4
Ls 27 7 6.8 448.3 54.5 488.0 49.5 158.5 224.7 54.0 10.1 35.9 13.2
Mss 27 7 10.5 1000.9 188.7 1689.6 75.9 316.7 511.7 69.7 15.2 15.1 26.0
Msv 27 7 10.8 1062.3 99.3 889.1 78.5 518.5 640.6 27.9 4.7 67.4 3.1
lc 30 6 5.5 244.1 25.0 223.9 45.3 67.5 125.7 43.9 7.3 48.8 7.7
lf 30 6 17.6 1153.9 241.7 2164.2 146.0 621.3 888.3 59.0 12.8 28.2 18.3
Lo 30 6 45.6 2859.3 643.3 5760.1 379.1 2739.0 3451.5 40.1 8.9 51.0 8.6

ax a Temp. tgesllon SMA Mass Food SMA TSMAI SMA+ TSMAI+ %available %of Energy Growth (g)
(OC) days
per day (g) (g) (kJ) 14 days· Cost of U t F (kJ) Food in available from energy
(kJ) digestion digestion (Costs) (1-costs) Growth for activity consuming
(kJ) (kJ) (%) a 100g ral
Ls 30 6 7.1 927.2 90.2 807.7 59.0 162.5 266.6 67.0 13.3 67.0 21.8
Mss 30 6 16.9 981.6 156.8 1404.0 140.3 377.4 592.1 57.8 12.1 57.8 17.1
Msv 30 6 9.7 540.3 69.4 621.4 80.9 233.5 351.0 43.5 8.6 43.5 9.0
Am 33 4 23.4 862.7 123.0 1101.3 263.2 430.9 828.5 24.8 6.3 24.8 3.6
Lc 33 4 5.0 242.5 75.9 679.6 51.6 187.4 292.3 57.0 12.7 57.0 17.7
Lf 33 4 21.8 1251.8 141.7 1268.8 226.2 343.4 691.4 45.5 9.9 45.5 10.9
Lo 33 4 44.6 3023.0 542.5 4857.5 463.0 1450.0 2435.6 49.9 11.9 49.9 14.3
Ls 33 4 6.3 275.4 49.9 446.8 65.1 134.9 238.5 46.6 10.0 46.6 11.3 t"--r:-Mss 33 4 26.9 941.9 124.8 1117.5 278.7 401.3 769.8 31.1 6.7 31.1 4.9
Msv 33 4 14.9 833.6 101.4 907.9 154.6 276.3 587.5 35.3 9.4 35.3 7.9
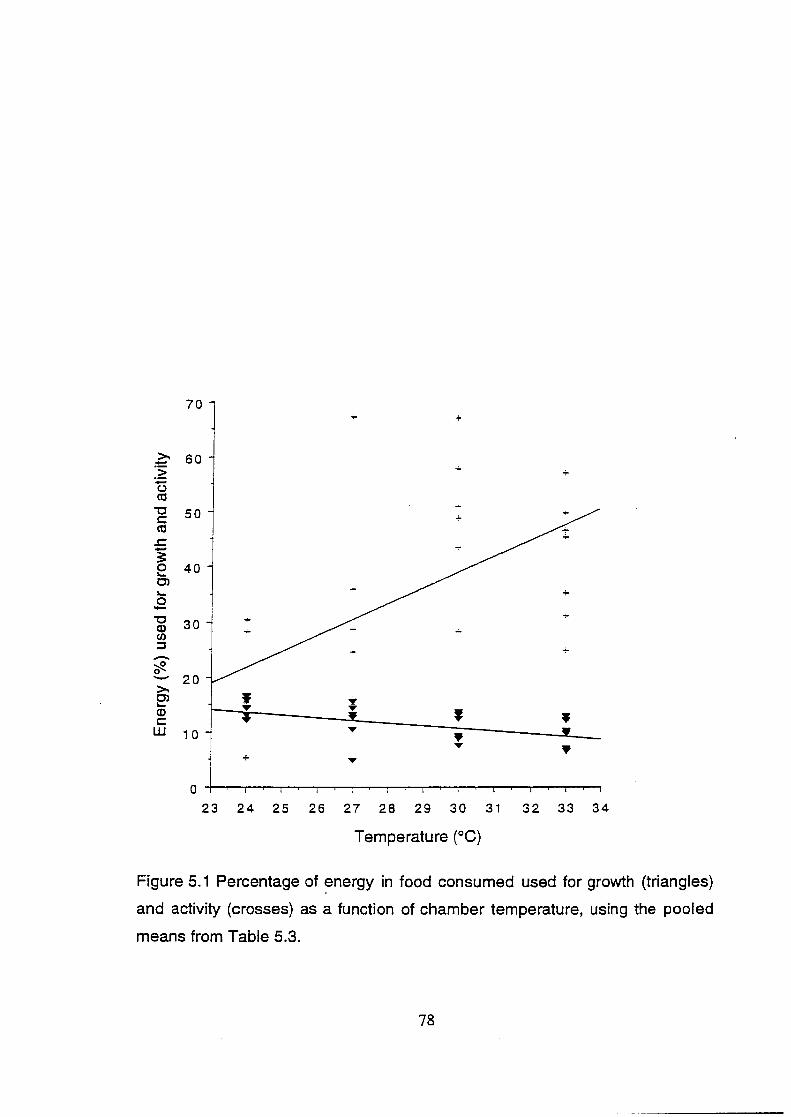
70 1 ~ 60 ·s;
+ +
:;:: u ca
"C 50 c::: ca .r::
~ 40 Cl I... 0 -~ 30 en ::::1
;g 0 - 20 >-e> (]) c::: w 10
+
23 24 25 26 27 28 29 30 31 32 33 34
Temperature (°C)
Figure 5.1 Percentage of energy in food consumed used for growth (triangles)
and activity (crosses) as a function of chamber temperature, using the pooled
means from Table 5.3.
78

22.5
20 j I ! I - 7.5
~ ,_ C)
0 1 5 0 .,... E 12.5 0 ,_ -- 10 C) -.J::. -3: 7.5 e
C!J 5
2.5
0
I i I I
J II I I
I ! I
I I
I I I I
I l I I I
] I
I I
I i
l I
l 24 2.7 30 33
Temperature
Figure 5.2 Growth (g) for pooled species at each temperature (°C) after the
digestion of a 100 g rodent. Taken from the data presented in Table 5.3.
79
Python energetics at ambient temperatures
The energy budget for each taxon fed a known quantity of food in natural
shaded temperatures is presented in Table 5.4. Food consumed is presented
in units of mass (g) and energy (kJ). Digestive efficiency (%) is given after
exclusion of the indigestible hair portion (Chapter 4). The amount of energy
available was calculated as the energy of food multiplied by digestive
efficiency. Standard metabolic rate was determined for that portion of the three
month period in which pythons were not digesting food (54 days). Total
metabolic cost of digestion (TSMRf) was calculated as the sum of the daily
metabolism during the six days of digestion for each of the six meals (36 days).
The metabolic costs of SMR and TSMRf were subtracted from the available
energy to give net available energy (kJ). The energy value of the change in
body mass is also shown in Table 5.4. This energy associated with the mass
change was deemed to be growth if the net value was positive or part of activity
energy if negative. The final column is therefore the energy available for activity
after all costs and growth were taken into account.
Cost of digestion for large meals
Metabolic cost of digestion does not increase substantially with meal
size beyond a relative meal mass of 25% of body mass (Chapter 3), except due
to increased time at higher metabolic rates. Even including the increased cost
of digestion due to increased time, the relative cost is reduced as meal size
increases. The increase in the cost of digestion due to increased time of
elevated metabolism after eating large meals was analysed using analysis of
variance on pooled data for the ratio of the increase in metabolic rate each day
after feeding and SMR. There was no significant difference in duration of
elevated metabolism between the two larger relative meal sizes (P > 0.05),
similarly no significant difference was found between the smaller relative meal
sizes (P > 0.05). However, there was a significant difference between the larger
and smaller groups on day four after feeding, indicating larger meals take
longer to digest than smaller meals (P < 0.02). This increase in duration of
80
elevated metabolism with relatively larger meals equates to an extra cost of 2.3
times SMR for 24 hours.
An example of the energy gain with larger food items can be taken from
the data on L. tuscus which ate on average 196.6 grams of rat with net
available energy of 1339.3 kJ (see Table 5.3). If the mass of food eaten were to
increase to 400 g, the cost of digestion would increase due to increased time of
elevated metabolism after feeding, but because the food mass represents more
than 20% body mass the metabolic increase will be relatively small compared
to the net energy gain (2.3 x daily SMR = 22.1 kJ). Growth of the L. tuscus
would be 3087.2 kJ after all costs are removed, including 22.1 kJ due to
increased time at an elevated metabolic rate because of the large relative meal
size. Therefore, a doubling of food mass results in net energy gain increasing
by a factor of 2.3 (3087.2 kJ I 1339.3 kJ). This indicates there may be
economies of scale (Call and Holohan 1983) in eating larger prey.
81
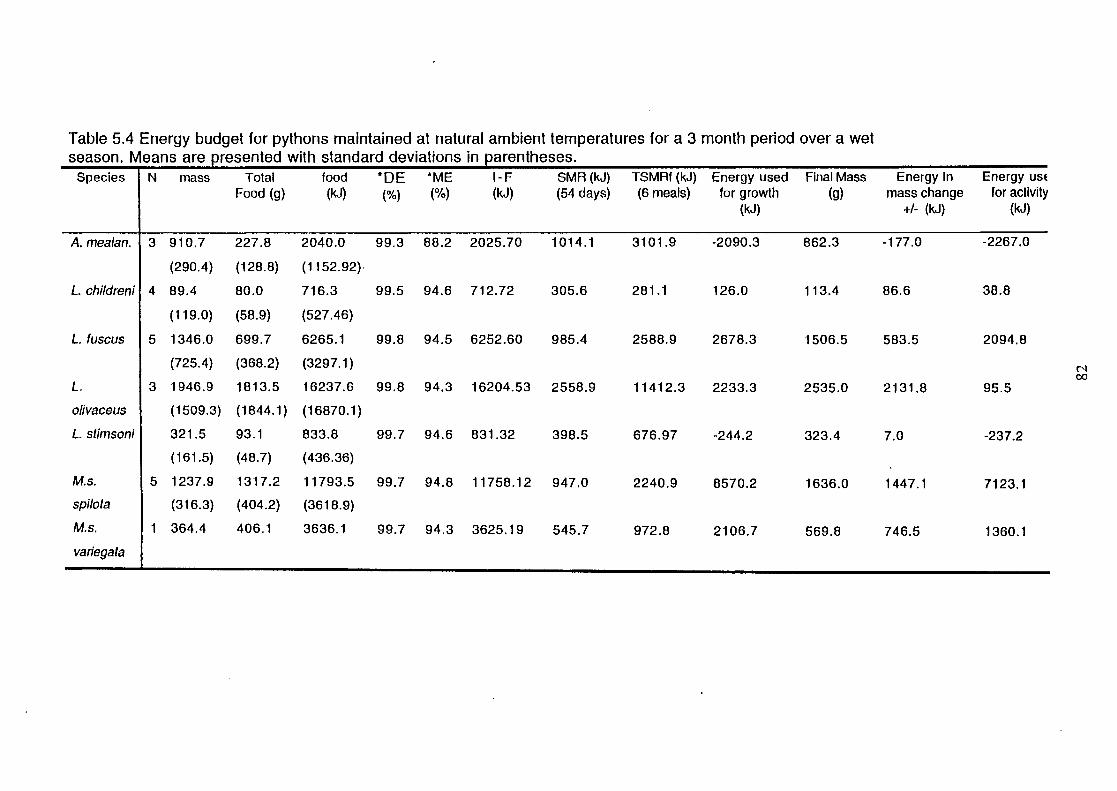
Table 5.4 Energy budget for pythons maintained at natural ambient temperatures for a 3 month period over a wet season. Means are resented with standard deviations in arentheses.
Species N mass Total food *DE *ME 1-F SMA (kJ) TSMRf (kJ) Energy used Final Mass Energy in Energy USE
Food (g) (kJ) (%) (%) (kJ) (54 days) (6 meals) for growth (g) mass change for activity (kJ) +1- (kJ) (kJ)
A. meafan. 3 910.7 227.8 2040.0 99.3 88.2 2025.70 1014.1 3101.9 -2090.3 862.3 -177.0 -2267.0
(290.4) (128.8) (1152.92)·
L. childreni 4 89.4 80.0 716.3 99.5 94.6 712.72 305.6 281.1 126.0 113.4 86.6 38.8
(119.0) (58.9) {527.46)
L. fuscus 5 1346.0 699.7 6265.1 99.8 94.5 6252.60 985.4 2588.9 2678.3 1506.5 583.5 2094.8
(725.4) (368.2) (3297.1) C"l 00
L. 3 1946.9 1813.5 16237.6 99.8 94.3 16204.53 2558.9 11412.3 2233.3 2535.0 2131.8 95.5
ofivaceus (1509.3) (1844.1) (16870.1)
L. slimsoni 321.5 93.1 833.8 99.7 94.6 831.32 398.5 676.97 -244.2 323.4 7.0 -237.2
(161.5) (48.7) (436.36)
M.s. 5 1237.9 1317.2 11793.5 99.7 94.8 11758.12 947.0 2240.9 8570.2 1636.0 1447.1 7123.1
spifota (316.3) (404.2) (3618.9)
M.s. 1 364.4 406.1 3636.1 99.7 94.3 3625.19 545.7 972.8 2106.7 569.8 746.5 1360.1
variegata

Discussion
Differences in aspects of energy budgets may reflect differences in
maintenance or utilisation of physiological functions in the natural environment.
The general pattern which emerged from the energy budgets of pythons was
that the amount of net energy available (after costs are removed), decreases
with increasing temperature (Table 5.3). The energy available as a percentage
of food consumed fell from a mean of 68.0 % at 24°C to 41.5 % at 33°C. This
decrease is due to increasing costs of SMR and metabolic costs of digestion.
The cost of digestion is a large component of the costs.
Secor (1995) and Secor and Diamond (1995) found increasing peak
metabolism with increasing meal size. In the present study increasing peak
metabolic rates were associated with increasing relative meal size up to about
25% body mass. Peak metabolic costs associated with digestion were 7.5
times SMR with relative meal sizes > 25% (see Chapter 3). However, larger
meals resulted in an elevated metabolism for a longer period. Temperature
was also directly associated with the duration of the metabolic increase after
feeding. Hence. the metabolic increase after feeding is dependent on a
number of variables. This becomes a central problem in the formation of an
energy budget which incorporates changes in factors such as meal size or
temperature, because the cost of digestion represents the major energetic
costs in the energy budget. For large relative meal sizes (25 - 50% of python
mass), costs increase at a lower rate compared to relative meal sizes < 25%,
resulting in the net energy benefit increasing with increasing meal size. This
would enable pythons to maximise available energy if food is abundant by
digesting larger relative meals.
In an environment where prey is abundant, it would be advantageous to
digest relatively large meals at a high temperature because large volumes of
food can be processed, increasing the amount of energy available for growth.
83
However, if prey abundance is low it would still be beneficial to eat relatively
large meals but the selection of lower temperatures for digestion would
maximise the net available energy. Pythons can take advantage of the energy
supply when prey is abundant, but if prey is scarce, they can reduce their daily
energy expenditure through atrophy of the gut. The cost of digestion of meals
between 25 - 50% body mass increase at a lower rate than the gains from
increasing relative meal size. Therefore, if the food mass ingested doubles
from 200 grams to 400 grams in a 1 kg L. fuscus, the resulting net gain in
energy is greater than a doubling of the net available energy. The increase in
maximum available energy is enhanced by the ability to consume large prey.
The energy advantages which accrue from increasing relative meal size above
25% body mass enhance the low energy strategies already employed by
pythons, including: low standard metabolic rate, low preferred body
temperature, high digestive efficiency and the selection of either low or high
body temperatures during digestion depending on the abundance of the food
resource.
The cost of digestion and SMR change with temperature. Although
digestion time is increased at low temperatures, and this is reflected in the
duration over which total cost of metabolism during digestion is calculated, the
overall cost of digestion is still lower compared to the shorter period at higher
temperatures (Chapters 2 and 3).
Energy used for growth was reduced at higher temperatures, because
activity and associated costs (SMR and TSMRf) increase at higher
temperatures. Digestion at higher temperatures results in a reduced passage
time. Pythons are sedentary while digesting (Slip and Shine 1988d; Shine
1991 ). Digestion at higher temperature results in more time which can be
assigned to 'waiting for prey' rather than digesting food. The time available for
'foraging' is almost doubled at 33°C compared to 24°C. The intake of prey
could therefore almost be doubled over the same time period. Using the model
84
for energy flow described above, if a python eats a 100 g rat the resulting
growth would be 13.9 g at 24°C, but only 9.8 g at 33°C. However, digestion
time at 33°C is almost half that of 24°C. If two meals were consumed in this
time period at the higher temperature, this would result in a net advantage of
5.7g growth because 9.8 g multiplied by 2 meals gives 19.6 g growth,
compared to 13.9 grams at 24°C (example taken from means of Table 5.3). The
relative amount of energy used in growth as a percentage of the energy
ingested ranged from 4. 7 % to 16.4 %. These values are near the low end of
the range of values for P. curtus on a rodent diet (6.3 to 32.6 % of energy
ingested; Vinegar eta/. 1970). Growth was elevated at the lower temperatures
(Table 5.3; Fig. 5.1) and this is also shown in the flow diagrams (Figure 5.3)
using a 1 OOg rat as an example food item consumed by a 1 kg python. This
figure illustrates the energy flow at 24 and 33°C.
In the energy budgets of animals maintained over the wet season the
energy available for activity varied from a net loss of energy of -2267.0 kJ,
corresponding to a loss of mass (48.7 g) for A. melanocepha/us, to a gain of
2134.8 kJ for L. olivaceus and 1445.1 kJ for M. s. spi!ota (588.1 grams and
398.1 grams respectively). The differences were directly related to the amount
of food consumed over the experimental period (Smith 1976), with some
animals consuming a lot of food and others very little.
85
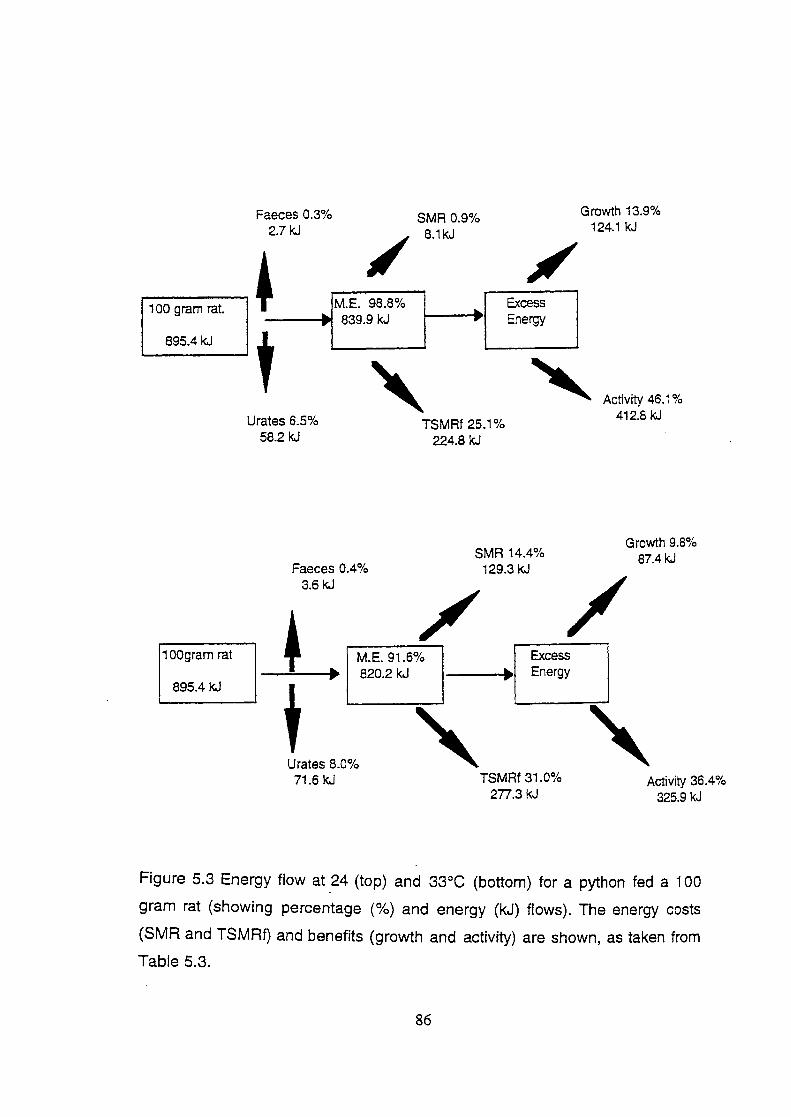
100 gram rat.
895.4 kJ
100gram rat
895.4 kJ
Faeces 0.3% 2.7 kJ
----... 839.9 kJ
~ Urates 6.5%
58.2 kJ
Faeces 0.4% 3.6 kJ
SMA 0.9% 8.1kJ
TSMAf 25.1% 224.8 kJ
Excess Energy
SMA 14.4% 129.3 kJ
/
Growth 13.9% 124.1 kJ
Activity 46.1% 412.8 kJ
Growth 9.8% 87.4 kJ
/ t M.E. 91.6% Excess ...
t Urates 8.0% 71.6 kJ
820.2 kJ ... Energy
TSMAf 31.0% Activity 36.4% 277.3 kJ 325.9 kJ
Figure 5.3 Energy flow at 24 (top) and 33°C (bottom) for a python fed a 100
gram rat (showing percentage (%) and energy (kJ) flows). The energy costs
(SMR and TSMRf) and benefits (growth and activity) are shown, as taken from
Table 5.3.
86
The energy used for activity by M. s. spilota was high (Table 5.4). The
elevated cost of activity for this temperate python is elevated possibly due to
the foreign tropical environment. The growth rates of pythons in the laboratory
and at ambient shaded conditions suggest that growth rate may fluctuate,
depending on long term benefits of meals and the long term costs of
maintenance. By being low energy specialists, pythons are able to endure long
periods of relatively low food availability. However they may still maintain a
long term positive growth rate only if they are able to get enough food to
exceed the long term costs.
87
Summary
The energy used for growth and activity can be determined from an
energy budget analysis if the temperature, mass of food and mass of animal
are known for some time period. SMR and TSMRf represent the major
energetic costs in the energy budgets of pythons at each temperature. The
energy in excess of costs and the portion of energy used for growth are
reduced at higher temperatures because energetic costs increase. At the
higher temperatures digestion time was reduced. There are economies of
scale with increasing relative meal sizes because the costs of digestion
increase at a slower rate than the benefits which accrue from a meal over 25%
body mass. This results in a higher net energy gain for pythons that consume
larger relative meal sizes. Because pythons can process food almost twice as
fast at 33°C as at 24°C, there is a comparative advantage for pythons to
consume large prey when smaller prey are also available (as well as an
absolute advantage in consuming large prey). There could be a net benefit
from processing relatively larger meals faster at high temperatures if food is
abundant, but not if food is so scarce that the snakes cannot take advantage of
the faster passage times. In that case, digestion at higher temperatures would
be disadvantageous because of the higher energy costs of maintenance and
digestion. The equations used in this chapter illustrate the many components of
the energy budget of pythons. These components include digestion,
maintenance, growth and activity. More data are needed to refine each
component of the energy budget for each taxa. However, this study has
demonstrated the relative costs of the various energy components and it has
highlighted the relationships between temperature, relative meal size and prey
availability.
88
Chapter 6
Synopsis and Research Implications
Pythons are sedentary 'sit and wait' predators (Slip and Shine 1988d;
Shine 1991) that eat intermittently (Secor 1995). They have low metabolic
rates compared to other reptiles (Andrews and Pough 1985; Chappell and Ellis
1987). The data presented in the previous four chapters suggest pythons are
low energy specialists. Standard metabolic rate does not vary, either over a
daily cycle or between seasons for most of the python taxa examined.
Similarly, most python taxa did not exhibit a shift in preferred body temperature
between seasons. With a low SMR and constant preferred body pythons may
conserve energy yet still maintain some constant state of readiness to subdue
and digest prey (Chapter 2).
Pythons appear to be low energy specialists, a benefit of this
specialisation includes low energy consumption. One reason for the low
energy consumption is that the cost of maintaining an active gut is reduced
after digestion through atrophy of the gut (Secor 1995; Secor and Diamond
1995). Pythons also have high digestive efficiency. A major cost for pythons is
a high specific dynamic action. After prey is consumed, there is a substantial
increase in metabolic rate. In some cases the increase is up to 45 times SMR
(Secor 1995). Although I recorded some very large increases in metabolism
after feeding, relative to SMR, increases of 5 -7 times SMR appear typical
(Benedict 1932; Chapter 3). The extremely large increases in metabolism
relative to SMR are due to unusually low SMR values before feeding rather
than extraordinary metabolic peaks after feeding. It appears that a metabolic
depression occurs when pythons are deprived of food over some extended
period. Benedict (1932) found that SMR declined by two thirds over 100 days.
The factorial increase in metabolism due to SDA is similar relative to SMR
89
across temperatures. At small relative meal sizes a trend exists between the
relative size of meal and the increase in metabolism due to SOA. This result is
similar to another report for P. molurus (Secor 1995). However, SDA reached
a plateau for meal sizes greater than 25% body mass. A slight increase in body
temperature is associated with an increase in metabolism after feeding
(Chapter 3). It is unclear whether or not this is ecologically significant, with
further study required on the field energetics of pythons consuming large meals
in a temperate climate.
Python metabolic rates are allometrically similar to other reptiles, and
their 0 10 of metabolism (2.60) is also similar to other reptiles (Andrews and
Pough 1985; Chappell and Ellis 1987). However, the SMR of pythons are
lower than those of other reptiles. The low SMR and sedentary foraging mode
result in a low cost of living compared to many other reptiles. At high
temperatures, a large portion of the energy content of the food item being
digested is expended during the digestive process. However, at high
temperatures, digestion time is faster, and more food can be consumed over a
period of weeks. Digestion at high temperatures would be costly if prey is
scarce, but pythons also have the ability to digest at low temperatures and
assimilate the maximum available energy per meal. The ability to maximise net
energy gain under a range of ecological conditions demonstrates the flexibility
of pythons as low energy specialists (Chapters 4 and 5).
The equations, derived in the previous chapters are useful tools for
determining ·some of the ecologically relevant physiological attributes of
pythons such as SMR, SDA, shedding, digestive efficiency and assimilation,
growth and activity (Chapter 5). Further research investigating activities of
pythons in the field under conditions of abundant and scarce food would allow
an evaluation of the relationships among behavioural thermoregulation,
digestive physiology and foraging strategies.
90
References
Afik 0 and Karasov W H (1995). The trade-offs between digestion rate and
efficiency in warblers and their ecological implications. Ecology
76:2247-2257.
Anderson R A and Karasov W H (1981 ). Contrasts in energy intake and
expenditure in sit and wait and widely foraging lizards. Oecologia
49:67-72.
Andrews R M and Pough F H (1985). Metabolism of squamate reptiles:
allometric and ecological relationships. Physiol. Zool. 58:214-231.
Andrews R M and Asato T (1977). Energy utilisation of a tropical lizard. Camp.
Biochem. Physiol. 58A:57-62.
Avery R A (1982). Field studies of body temperatures and thermoregulation. C
Gans and F H Pough eds. Biology of the Reptilia. V 12. Physiology C.
Academic Press. London. pp 92-165.
Avery H W, Spotila J R, Congdon J 0, Fischer R U, Standora E A and Avery S
B. (1993). Roles of diet protein and temperature in the growth and
nutritional energetics of juvenile slider turtles, Tracemys scripta.
Physiol. Zool. 66:902-925.
Ayers 0 Y (1992). Effects of body size and posture on the thermal biology of
diamond pythons, Morelia s. spilota (Serpentes: Boidae). unpub. B. Sc.
(Hans.) Biological Sciences. University of Sydney. pp 101.
91
Barker D G and Barker T M (1994). Pythons of the World: Volume 1, Australia.
The Herpetocultural Library. Advanced Vivarium Systems, Inc.
Lakeside, California, U.S.A. pp 171.
Bartholomew G A (1982). Physiological control of body temperature. C Gans
and F H Pough eds. Biology of the Reptilia. Vol. 12. Physiology C.
Academic Press. London. pp 167-211.
Bartholomew G A and Tucker (1964). Size, body temperature, thermal
conductance, oxygen consumption, and heart rate in Australian
varanid lizards. Physiol. Zool. 37:341-354.
Beaupre S J (1993). An ecological study of oxygen consumption in the mottled
rock rattlesnake, Crotalus lepidus lepidus, and the black - tailed
rattlesnake, Crotalus mo/ossus molossus, from two populations.
Physiol. Zool. 66:437-454.
Beaupre S J (1995a). Comparative ecology of the mottled rock rattlesnake,
Crotalus lepidus, in Big Bend National Park. Herpetologica. 51:45-56.
Beaupre S J (1995b). Effects of geographically variable thermal environment
on bioenergetics of mottled rock rattlesnakes. Ecology 76:1655-1665.
Bell G P (1990). Birds and mammals on an insect diet: A primer on diet
composition analysis in relation to ecological energetics. In Studies in
Avian Biology No. 13, eds. Morrison M L, Ralph C J, Werner J and Jehl
J R jr. Cooper Ornithological Society. Lawrence, Kansas. pp 416-422.
Benedict F G (1932). The Physiology of Large Reptiles. Publ. Carnegie lnstit.
Washington (425), pp 1-539.
92
Bennett A F and Dawson W R (1976). Metabolism. In Biology of the Reptilia.
Vol 5. eds. C. Gans and W R Dawson. Academic Press London. pp
127-223.
Bennett A F and Gleeson (1979). Metabolic expenditure and the cost of
foraging in the lizard Cnemidophorus murinus. Copeia 1979:573-577.
Bjorndal K A (1987). Digestive efficiency in a temperate herbivorous reptile
Gopherus polyphemus. Copeia 1987:714-720.
Bjorndal K A and Bolton A B (1990). Digestive processing in a herbivorous
freshwater turtle: consequences of small-intestine fermentation.
Physiol. Zool. 63:1232-1247.
Brafield A E and Llewellyn M J (1982). Animal Energetics. Blackie and Son
Ltd. USA.
Brisbin I L Jr (1970). A determination of live-weight caloric conversion factors
for laboratory mice. Ecology 51:541-544.
Brody S (1945). Bioenergetics and Growth. Hafner, New York. pp 1023.
Call S T and Holahan W L (1983). Microeconomics. Wadsworth Publishing Co.
California. USA. pp 499.
Cassel J and Casselman B (1990). Regulation of body heat: The evolution of
concepts and associated research. In Thermoregulation: Physiology
and Biochemistry. eds. Schonbaum E and Lomax P, Permagon Press,
Inc. New York, pp 17-50.
l)j
Chappell M A and Ellis T M (1987). Resting metabolic rates in boid snakes:
allometric relationships and temperature effects. J. Camp. Physiol.
157:227-235.
Christian K A and Bedford G S ("1995). Seasonal changes in thermoregulation
by the frillneck lizard, Ch/amydosaurus kingii, in tropical Australia.
Ecology 76:"124-132.
Christian K A and Bedford G S (1996). Thermoregulation by the spotted tree
monitor, Varanus sca/aris, in the seasonal tropics of Australia. J.
Therm. Bioi. 21:67-73.
Christian K A and Conley K E (1994). Activity and resting metabolism of
varanid lizards compared with 'typical' lizards. Aust. J. Zoo!. 42:185-93.
Christian, K. A., A. D. Griffiths, and G. S. Bedford. (1996b). Physiological ecology of
frillneck lizards in a seasonal tropical environment. Oecologia 1 06:49-56.
Christian K A, Tracy C R and Porter W P (1983). Seasonal shifts in body
temperature and use of microhabitats by the Galapagos land iguana
Ecology 64:463-468.
Christian K A, Tracy C R and Porter W P (1984). Diet, digestion, and food
preferences of Galapagos land iguanas. Herpetologica 40:205-212.
Christian K A, Corbett L K, Green Band Weavers B W (1995). Seasonal activity
and energetics of two species of varanid lizards in tropical Australia.
Oecologia 103:349 -357.
94

Christian K A, Green, B., Bedford, G. S. and Newgrain K (1996a). Seasonal
metabolism of a small, arboreal monitor lizard, Varanus scalaris, in
tropical Australia. J. Zool. 240:383-396.
Cogger H G (1992). Reptiles and Amphibians of Australia. Reed Books Pty.
Ltd. NSW. Aust. pp 775.
Cogger H G and Holmes A (1960). Thermoregulatory behaviour in a specimen
of Morelia spilota variegata Gray (Serpentes: Boidae). Proc. Linn. Soc.
NSW. 85:328-333.
Congdon J D, Dunham A E and Tinkle D W (1982). Energy budgets and life
histories of reptiles. In Biology of the Reptilia. Vol. 13. Physiology D.
Physiological Ecology. Eds. Gans C and Harvey Pough F. Academic
Press, New York USA. pp 233-271.
Coulson R H and Hernandez T (1979). Increase in the metabolic rate of the
alligator fed proteins or amino acid. J. Nutr. 109:538-550.
Cowles R B and Bogert C M (1944). A preliminary study of the thermal
requirements of desert reptiles. Bull. Am. Mus. Nat. Hist. 83:261-296.
Dawson T J and Hulbert A J (1970). Standard metabolism, body temperature
and surface areas of Australian marsupials. Am. J. Physiol. 218:1233-
1238.
Dill C D (1972). Reptilian core temperatures: variation within individuals.
Copeia. 1972:577-579.
Dmi'el R (1972). Relation of metabolism to body weight in snakes. Copeia.
1972:179-181.
95
Dmi'el R (1986). Intra- and interspecific allometry of oxygen consumption in
snakes. J. Herp. 20:265-267.
Dunham A E, Miles 0 B and Reznick 0 N (1988). Life history patterns in
squamate reptiles. In C. Gans and R B Huey, editors. Biology of the
Reptilia. Volume 16. Alan R Liss, New York, New York, USA. pp 441-
522
Else P L and Hulbert A J (1981 ). Comparison of the "mammal machine" and
the "reptile machine": energy production. Am. J. Physiol. 76A:553-557.
Flannery (1994). The Future Eaters. Reed Books Pty. Ltd. Sydney. pp 423.
Friar W, Ackman R G and Mrosovsky N (1972). Body temperature of
Oermoche!ys coriacea: warm turtle from cold water. Science 177:791-
793.
Galvao P E, Tarasantchi J and Guertzenstein P (1964). Heat production of
tropical snakes in relation to body weight and body surface. Am. J.
Physiol. 209:501-506.
Garland T Jr, Else P L, Hulbert A J and Tap P (1987). The effects of endurance
training and captivity on activity metabolism of lizards. Am. J. Physiol.
252:R450-R456.
Gilchrist G W (1995). Specialists and generalists in changing environments. 1.
Fitness landscapes of thermal sensitivity. Am. Nat. 146:252-270.
96
Greenwald 0 E and Kanter M E (1979). The effects of temperature and
behavioural thermoregulation on digestive efficiency and rate in corn
snakes (Efaphe guttata guttata). Physiol. Zool. 52:398-408.
Griffiths A D (1994). The effects of a seasonal environment and fire on the
ecology of frillneck lizards, Ch/amydosaurus kingii, in the wet-dry
tropics of northern Australia. MSc thesis. pp 131.
Hanks P (1990). The collins paperback english dictionary. William Collins
Sons & Co. Ltd. pp 1016.
Harlow P and Grigg G (1984). Shivering thermogenesis in a brooding diamond
python, Python spilotes spifotes. Copeia. 1984:959-965.
Harwood R H (1979). The effects of temperature on the digestive efficiency of
three species of lizards, Cnemidophorus tigris, Gerrhonotus
multicarinatus and Scefoporus occidentalis. Comp. Biochem. Physiol.
63A:417- 433.
Heatwole H F and Taylor J (1987). Ecology of Reptiles. Surrey Beatty and
Sons Pty. Ltd. NSW. pp 325.
Hirth H F and King A C (1969). Body temperatures of snakes in different
seasons. J. Herp. 3:101-102.
Huey R B (1982). Temperature, physiology, and the ecology of reptiles. In
Biology of the Reptilia. Vol. 12. Physiology. eds. C C Gans and F H
Pough eds. Academic Press. London. pp 25-90.
Huey R Band Pianka E R (1981 ). Ecological consequences of foraging mode.
Ecology 62:991-999.
97
Hulbert A J and Else P L (1989). Evolution of mammalian endothermic
metabolism: mitochondrial activity and cell composition. Am. J. Physiol.
256: R63-R69.
Hutchison V H, Dowling H G and Vinegar A (1966). Thermoregulation in a
brooding female Indian python, Python molurus bivittatus. Science
151:694-696 .
. Kitchell J F (1969). Thermophilic and thermophobic responses of snakes in a
thermal gradient. Copeia. 1969:189-191.
Kitchell J F and Windell J T (1972). Energy budget for the lizard, Anolis
carolinensis. Physiol. Zool. 45:178-187.
Kleiber M (1975). The Fire of Life. Kreiger, Huntington, New York. pp 454.
Konarzewski M and Diamond J (1995). Evolution of basal metabolic rate and
organ masses in laboratory mice. Evolution 49:1239-1248.
Leger D W and Didrichsons I A (1994). An assessment of data pooling and
some alternatives. Anim. Behav. 48:823-832.
Lillywhite H B (1987). Temperature, Energetics, and Physiological Ecology. In
Snakes: Ecology and Evolutionary Biology. eds. Siegel R A, Collins J T
and Novak S S. Macmillan Publishing Co. New York, USA. pp 422-
477.
LongS P and Ireland C R (1985). The measurement and control of air and gas
flow rates for the determination of gaseous exchange of living
organisms. In Marshall B, Woodward F. I. (eds.). Instrumentation for
98
Experimental Physiology. Cambridge University Press, Cambridge,
U.K. pp 123-137.
Madsen T and Shine R (1996a) Seasonal migration of predators and prey - a
study of pythons and rats in tropical Australia. Ecology 77:149-1 56.
Madsen T and Shine R (1996b). Determinants of reproductive output in female
water pythons (Liasis fuscus: Pythonidae). Herpetologica 52:146-159.
Marcellini D Land Peters A (1982). Preliminary observations on endogenous
heat production after feeding in Python mo/urus. J Herpetology. 1 6:92-
95.
McCracken HE (1988). Husbandry and diseases of captive reptiles. The John
Keep Refresher Course for Veterinarians. Proceedings 104. University
of Sydney. pp 827-878.
Meienberger C, Wallis I R and Nagy K A (1993). Food intake rate and body
mass influence transit time and digestibility in the desert tortoise
(Xerobates agassizil). Physiol. Zool. 66:847-862.
Mirtschin P and Davis R (1992). Snakes of Australia, Dangerous and
Harmless. Hill of the Content. Melbourne. pp 216.
Nagy K A (1983). Ecological Energetics. In Lizard Ecology: Studies of a model
organism. eds. Huey R B, Pianka E R and Schoener T W. Harvard
University Press. Massachusetts USA. pp 24 - 54.
Naulleau G (1983). The effects of temperature on digestion in Vipera aspis. J.
Herp. 17:166-170.
99
Neill W H and Steven E D (1973). Thermal inertia versus thermoregulation in
"warm" turtles and tunas. Science 184:1008-1010.
Paine R T (1971 ). The measurement and application of the calorie to
ecological problems. Ann. Rev. of Ecol. and System. 2:145-164.
Porter W P and Gates D M (1969). Thermodynamic equilibria of animals with
environment. Ecol. Monogr. 39:245-270.
Potvin C, Lechowicz M J and Tardif S (1990). The statistical analysis of
ecophysiological response curves obtained from experiments involving
repeated measures. Ecology 71:1389- 1400.
Prosser C L (1991) Environmental and Metabolic Animal Physiology. Wiley
Liss and Sons, Inc. New York. pp 578.
Regal P J (1966). Thermophillic response following feeding in certain reptiles.
Copeia. 1966:588-590.
Roberts L A (1964). Oxygen consumption and the question of temperature
acclimation in a population of Uta stansburiana. Abstract. Am. Zool. p
328.
Rosen P C (1991 ). Comparative field study of thermal preferenda in garter
snakes (Thamnophis). J. Herp. 25:301-312.
Schmidt-Neilsen K (1990). Animal Physiology: Adaptation and Environment.
Cambridge University Press, Cambridge. pp 602.
100
Scott J R, Tracy C Rand Pettus D (1982). A biophysical analysis of daily and
seasonal utilisation of climate space by a montane snake. Ecology
63:482-493.
Secor S M (1995). Digestive response to the first meal in hatchling Burmese
pythons (Python molurus). Copeia. 1995:947-954.
Secor S M and Diamond J (1995). Adaptive responses to feeding in Burmese
pythons: pay before pumping. J. Exp. Bioi. 198:1313-1325.
Secor S M and Nagy K A (1994). Bioenergetic correlates of foraging mode for
the snakes Crotalus cerastes and Masticophis flagellum. Ecology 75:
1600-1614.
Secor S M, Stein E D and Diamond J (1994). Rapid upregulation of snake
intestine in response to feeding: A new model of intestinal adaptation.
Am. J. Physiol. 266:G695-G705.
Seymour R S, Dobson G P and Baldwin J (1 981 ). Respiratory and cardoi
vascular physiology of the aquatic snake, Acrochordus arafurae. J.
Camp. Physiol. 144:215-227.
Shine R (1986). Ecology of a low energy specialist: Food habits and
reproductive biology of the Arafura Filesnake (Acrochordidae). Copeia
1986:424-437.
Shine R (1991 ). Australian Snakes: A Natural History. Reed Books Pty. Ltd.
NSW. pp 223.
101
Shine Rand Fitzgerald M (1996). Large snakes in a mosaic rural landscape:
The ecology of carpet pythons, Morelia spilota (Serpentes: Pythonidae)
in coastal eastern Australia. Biolog. Cons. (in press).
Shine R and Lambeck R (1985). A radiotelemetric study of movements,
thermoregulation and habitat utilisation of Arafura filesnakes
(Serpentes: Acrochordidae). Herpetologica 41:351-361.
Shine R and Madsen T (1996). Is thermoregulation unimportant for most
reptiles? An example using water pythons (Liasis fuscus) in tropical
Australia. Physiol. Zool. 69:252-269.
Slip D J and Shine R (1988a). Reptilian endothermy: a field study of
thermoregulation by brooding diamond pythons. J. Zool. Lond.
216:367-378.
Slip D J and Shine R (1988b). Thermophillic response to feeding of the
diamond python, Morelia s. spi/ota (Serpentes: Boidae). Comp.
Biochem. Physiol. 89:645-650.
Slip D J and Shine R (1988c). Thermoregulation of free-ranging diamond
pythons, Morelia spi/ota (Serpentes, Boidae). Copeia 1988:984-995.
Slip D J and Shine R (1988d). Feeding habits of the diamond python, Morelia
s. spilota: Ambush predation by a boid snake. J. Herp. 22:323-330.
Slip D J and Shine R (1988e). The reproductive biology and mating system of
diamond pythons, Morelia spilota (Serpentes: Boidae). Herpetologica
44:396-404.
102
Slip D J and Shine R (1988f). Habitat use, movements and activity patterns of
free-ranging diamond pythons, Morelia spifota spilota (Serpentes:
Boidae): A radiotelemetric study. Aust. Wildl. Res. 15:515-31.
Smith G C (1976). Ecological energetics of three species of ectothermic
vertebrates. Ecology 57:252-264.
Standora E A, Spotila J Rand Foley R E (1982). Regional endothermy in the
sea turtle. Chelonia mydas. J. Therm. Bioi. 7:159-165.
Stow A and Shine R (1993). Cage cleaning, investigatory behaviour and the
induction of defecation in elapid snakes. In Herpetology a Diverse
Discipline, eds. Lunney D and Ayers D. Trans. of the Royal Zool. Soc.
of N.S.W., Surrey Beaty and Sons. pp 311-314.
Taylor 8 M and Davies (1981 ). Changes in the weight dependence of
metabolism during the sloughing cycle of the snake Thamnophis
sirta/is parietalis. Camp. Biochem. Physiol. 69A:113-120.
Taylor J A and Tulloch D (1985). Rainfall in the wet/dry tropics: extreme events
at Darwin and similarities between years during the period 1870-1983
inclusive. Aust. J. Ecol. 10:281-295.
Troyer K (1987). Small differences in daytime body temperature affect
digestion of natural food in a herbivorous lizard (Iguana iguana).
Comp. Biochem. Physiol. 87A:623-626.
Tsuji J S (1988). Seasonal profiles of standard metabolic rate of lizards
(Sceloporus occidentalis) in relation to latitude. Physiol. Zool. 61 :230-
240.
103
Van Mierop L H S and Barnard S M (1976). Thermoregulation in a brooding
female Python molurus bivittatus (Serpentes: Boidae). Copeia
1976:398-401.
Van Mierop L H S and Barnard S M (1978). Further observations on
thermoregulation in the brooding female Python molurus bivittatus
(Serpentes: Boidae). Copeia 1978:615-621.
Vinegar A, Hutchison V H and Dowling (1970). Metabolism, energetics, and
thermoregulation during brooding of snakes of the genus Python
(Reptilia, Boidae). Zoologica: New York Zoological Soc. 55:19-50.
Waldschmidt S R, Jones, S M and Porter W P (1986). The effect of body
temperature and feeding regime on activity, passage time, and
digestive coefficient in the lizard Uta stansburiana. Physiol. Zool. 59:
376-383.
Waldschmidt S R, Jones, S M and Porter W P (1987). Reptilia. In Animal
Energetics. Vol. 2, Bivalvia through Reptilia. eds. Pandian T J and John
Vernberg F. Academic Press Inc. USA. pp 553-620.
Wang T, Burggren Wand Nobrega E (1995). Metabolic, ventilatory, and acid
base responses associated with specific dynamic action in the toad
Bufo marinus. Physiol. Zool. 68:192-205.
Webb G and Heatwole H (1971 ). Patterns of heat distribution within the bodies
of some Australian pythons. Copeia. 1971 :209-220.
Weigel J (1988). Care of Australian reptiles in captivity. Reptile Keepers
Association. NSW. Aust. pp 143.
104
Welch H E (1968). Realationships between assimilation efficiencies and
growth efficiencies for aquatic consumers. Ecology 49:755-759.
Xiang J, Weiguo D and Pingyue S (1996). Body temperature, thermal
tolerance and influence of temperature on sprint speed and food
assimilation in adult grass lizards, Takydromus septentriona/is. J
Therm. Bioi. 21:155-161.
Zar J H (1984). Biostatistical Analysis. 2nd ed. Prentice-Hall, Englewood Cliffs,
N.J. pp 718.
Zimmerman L C and Tracy C R (1989). Interactions between the environment
and ectothermy and herbivory in reptiles. Physiol. Zool. 62:374-409.
105
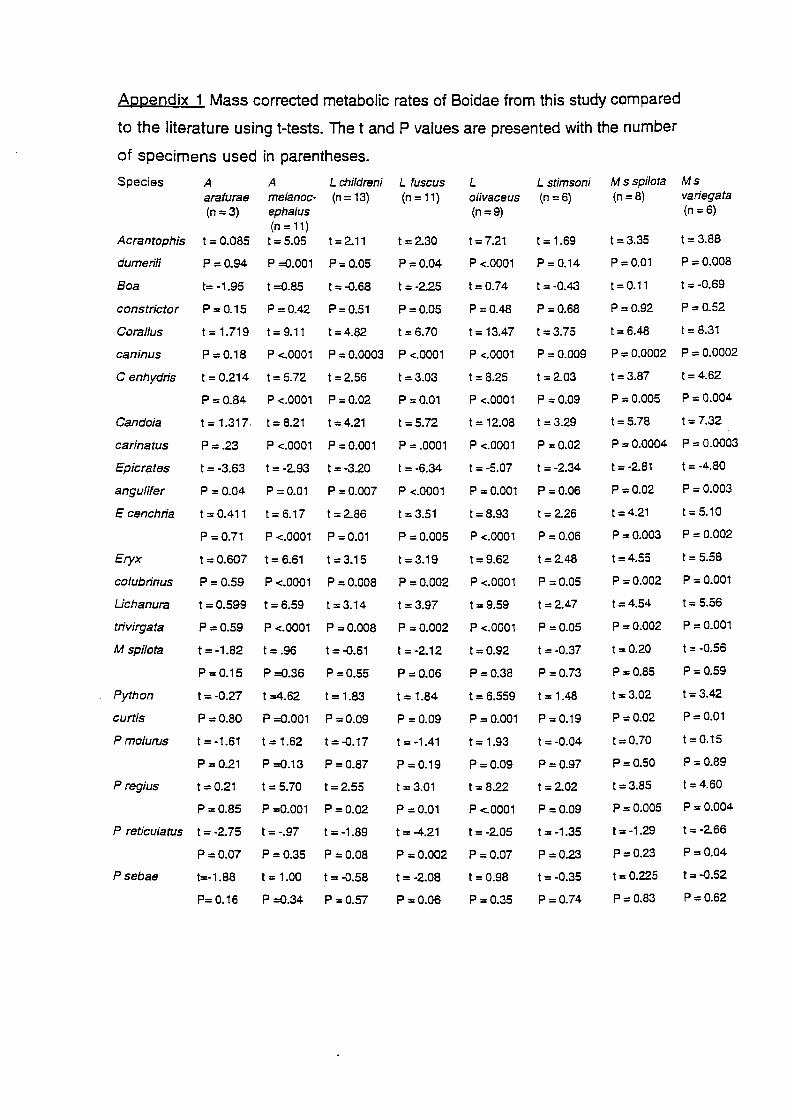
Appendix 1 Mass corrected metabolic rates of Boidae from this study compared
to the literature using t-tests. The t and P values are presented with the number
of specimens used in parentheses.
Species
Acrantophis
dumerili
Boa
constrictor
Co raJ/us
caninus
C enhydris
Candoia
carinatus
Epicrates
angulifer
E cenchria
Eryx
colubrinus
Uchanura
trivirgata
M spilota
Python
curtis
P moluros
P regius
A arafurae (n=3)
t = 0.085
p = 0.94
t= -1.95
p = 0.15
t = 1.719
A L childreni melanoc- (n = 13) ephalus (n = 11) t = 5.05 t = 2.11
p =0.001 p = 0.05
t =0.85 t = -Q.68
P=0.42 P=0.51
t = 9.11 t = 4.82
L fuscus (n = 1 1)
t = 2.30
P=0.04
t = -2.25
?:0.05
t = 6.70
L olivaceus (n = 9)
L stimsoni (n=6)
t = 1.69
p =0.14
I= -0.43
p =0.68
t =3.75
p = 0.18 p <.0001 p = 0.0003 p <.0001
t = 7.21
p <.0001
t =0.74
p = 0.48
1=13.47
p <.0001
I= 8.25
p <.0001
p = 0.009
t = 2.03 t = 0.214 t = 5.72 t = 2.56
p = 0.84 p <.0001 p = 0.02
I =3.03
p =0.01 p =0.09
1=1.317 1=8.21 1=4.21 1=5.72 1=12.08 1=3.29
p = .23 p <.0001 p = 0.001 p = .0001 p <.0001 p = 0.02
t = -3.63 t = -2.93 I= -3.20 t = -6.34 t = -5.07 I = -2.34
p = 0.04 p = 0.01 p = 0.007 p <.0001 p = 0.001 p = 0.06
1=0.411 1=6.17 1=2.86 1=3.51 t=8.93 1=2.26
p = 0.71 p <.0001 p = 0.01 p = 0.005 p <.0001 p :0.06
t=0.607 t=6.61 1=3.15 1=3.19 !:::9.62 1=2.48
p = 0.59 p <.0001 p = 0.008 p = 0.002 p <.0001 p = 0.05
1=0.599 t=6.59 1=3.14 1=3.97 t=9.59 1=2.47
p = 0.59 p <.0001 p = 0.008 p = 0.002 p <.0001 p = 0.05
t = -1.82 t = .96 t = -Q.61 t = -2.12 t = 0.92 I = -0.37
p = 0.15 p =0.36 p = 0.55 P= 0.38 p =0.73
t = -0.27 t =4.62 t = 1.83 t = 6.559 I= 1.48
p = 0.80 p =0.001 p = 0.09 p = 0.001 p = 0.19
t=-1.61 t=1.62 t=-D.17 t = 1.93 t = -0.04
p = 0.21 p =0.13 p = 0.87
t = 0.21 t = 5. 70 t = 2.55
p = 0.85 p =0.001 p = 0.02
P reticulatus t = -2.75 t = -.97 t = -1.89
p =0.06
I= 1.84
p =0.09
1=·1.41
p = 0.19
t = 3.01
p =0.01
I= -4.21
P=0.09
t= 8.22
p <.0001
t = -2.05
p :0.97
t = 2.02
p =0.09
t = -1.35
p =0.23
I= -0.35
p =0.74
Psebae
p = 0.07 p = 0.35 p = 0.08
t=-1.88
P= 0.16
t = 1.00 t = -o.58
p =0.34 p = 0.57
p = 0.002 p = 0.07
t = -2.08
p =0.06
t = 0.98
p =0.35
M sspilota (n=8)
t =3.35
p =0.01
t = 0.11
P=0.92
I= 6.48
Ms variegata (n =6)
t = 3.88
p =0.008
t = -0.69
p =0.52
t = 8.31
p = 0.0002 p = 0.0002
t =3.87 t= 4.62
p = 0.005 p = 0.004
t=5.78 1=7.32
p = 0.0004 p = 0.0003
t = -2.81 t = -4.80
p = 0.02 p = 0.003
t = 4.21 t = 5.1 0
p = 0.003 p = 0.002
I = 4.55 I = 5.58
p = 0.002 p = 0.001
t = 4.54 t = 5.56
p = 0.002 p = 0.001
t = 0.20 t = -0.56
p =0.85
1=3.02
P=0.02
t =0.70
P=O.SO
t = 3.85
p = 0.59
I= 3.42
p = 0.01
t = 0.15
P= 0.89
t = 4.60
p = 0.005 p ::: 0.004
t =-1.29
P:::0.23
t= 0.225
P:::0.83
t = -2.66
P:::0.04
t=-0.52
P=0.62