Mesokurtosis Zonal Nonparametric Signal Analysis for ...
7
Jurnal Kejuruteraan 24(2012): 21-27 Mesokurtosis Zonal Nonparametric Signal Analysis for Dynamic Characterisation of Metallic Material (Pencirian Dinamik Bahan-bahan Logam Menggunakan Kaedah Analisis Isyarat Mesokurtosis Zonal Nonparametric) M. Z. Nuawi, A. R. Bahari, S. Abdullah, A. K. A. M. Ihsan and M. B. Ali ABSTRACT This paper presents the development and application of an alternative statistical signal analysis method called Mesokurtosis Zonal Nonparametric (M-Z-N) in characterising the elastic properties of metallic material. The transient vibration response and acoustic radiation from rectangular bar of various metallic materials excited by impact is statistically analysed to determine the pattern of the signal and to estimate the significance difference among those metallic materials. Prediction of the waveform and a method for reducing noise generation from the impact are derived by an extensive process of a new alternative Z-stem filtering technique that has been developed in this paper. The experimental curves obtained by the determination of M-Z-N coefficient for various impact forces and metallic materials found that the results are statistically significant and can be successfully used for determining the correlation between the characteristic of the curves and the relevant elastic properties of the metallic materials. Experimental test of this analysis method on four metallic materials shows a good agreement between the quadratic coefficients with the elastic properties of the metallic materials. Keywords: Statistical analysis, signal filtering, transient acoustic, vibration response, elastic properties ABSTRAK Kertas kerja ini membentangkan proses pembangunan dan pengaplikasian kaedah analisis isyarat statistik alternatif yang dipanggil Mesokurtosis Zonal Nonparametric (M-Z-N) bagi mencirikan sifat-sifat elastik bahan logam. Sambutan fana isyarat getaran dan radiasi akustik yang terjana apabila bar berbentuk segiempat yang diperbuat daripada pelbagai jenis bahan logam dikenakan pengujaan impak. Ianya dianalisis secara statistik bagi menentukan corak isyarat dan menganggar perbezaan yang ketara di antara bahan-bahan logam tersebut. Penganggaran bentuk gelombang dan kaedah penurasan hingar telah diterbitkan melalui teknik penurasan alternatif Z-tunjang yang telah dibangunkan dalam kertas kerja ini. Lengkung eksperimen yang diperoleh melalui penentuan pekali M-Z-N bagi pelbagai daya impak dan jenis bahan logam menunjukkan perubahan statistik yang ketara dan boleh digunakan bagi menentukan korelasi antara ciri-ciri lengkung dan sifat-sifat elastik bahan logam yang tertentu. Uji kaji eksperimen melalui kaedah analisis ini pada empat jenis bahan logam menunjukkan terdapat korelasi yang baik antara pekali kuadratik yang terhasil dan sifat-sifat elastik bahan logam tersebut. Kata kunci: Analisis statistik; penurasan isyarat; akustik fana; sambutan getaran; sifat-sifat elastik INTRODUCTION A knowledge of elastic properties is fundamental for the complete characterisation of engineering materials (Alfano and Pagnotta 2007) and very important for design and engineering applications. A great number of experimental techniques has been developed to determine elastic properties and can be classified into two groups: static methods and dynamic methods. Static methods referred to the direct measurement of stresses and strains during mechanical testing such as tensile, compressive and flexural test. The static elastic properties are determined from the stress-strain curve. The disadvantages of static characterisation methods such as being slow, requiring many samples and generally more expensive (Ayorinde and Yu 2005). Determining the elastic properties of materials by analysing their dynamic response is a well-known technique (Alfano and Pagnotta 2006). Classification of dynamic methods are based into two groups: resonance and pulse method. Resonance methods consist of setting a sample into mechanical vibration in one or more vibrational modes at one or more frequency at which the vibrational displacements are at a maximum (resonance). Excitation can be performed by drivers having continuously variable frequencies output or by impact. Transducers are used to monitor the vibrations of the sample and analysed in order to determine its characteristic frequencies. Knowing the vibrational mode, frequency, dimensions and mass of the samples, it is possible to calculate the elastic constants of the material (Radovic et al. 2004). Pulse technique is based
Transcript of Mesokurtosis Zonal Nonparametric Signal Analysis for ...

Jurnal Kejuruteraan 24(2012): 21-27
Mesokurtosis Zonal Nonparametric Signal Analysis for Dynamic Characterisation of Metallic Material
(Pencirian Dinamik Bahan-bahan Logam Menggunakan Kaedah Analisis Isyarat Mesokurtosis Zonal Nonparametric)
M. Z. Nuawi, A. R. Bahari, S. Abdullah, A. K. A. M. Ihsan and M. B. Ali
ABSTRACT
This paper presents the development and application of an alternative statistical signal analysis method called Mesokurtosis Zonal Nonparametric (M-Z-N) in characterising the elastic properties of metallic material. The transient vibration response and acoustic radiation from rectangular bar of various metallic materials excited by impact is statistically analysed to determine the pattern of the signal and to estimate the significance difference among those metallic materials. Prediction of the waveform and a method for reducing noise generation from the impact are derived by an extensive process of a new alternative Z-stem filtering technique that has been developed in this paper. The experimental curves obtained by the determination of M-Z-N coefficient for various impact forces and metallic materials found that the results are statistically significant and can be successfully used for determining the correlation between the characteristic of the curves and the relevant elastic properties of the metallic materials. Experimental test of this analysis method on four metallic materials shows a good agreement between the quadratic coefficients with the elastic properties of the metallic materials.
Keywords: Statistical analysis, signal filtering, transient acoustic, vibration response, elastic properties
ABSTRAK
Kertas kerja ini membentangkan proses pembangunan dan pengaplikasian kaedah analisis isyarat statistik alternatif yang dipanggil Mesokurtosis Zonal Nonparametric (M-Z-N) bagi mencirikan sifat-sifat elastik bahan logam. Sambutan fana isyarat getaran dan radiasi akustik yang terjana apabila bar berbentuk segiempat yang diperbuat daripada pelbagai jenis bahan logam dikenakan pengujaan impak. Ianya dianalisis secara statistik bagi menentukan corak isyarat dan menganggar perbezaan yang ketara di antara bahan-bahan logam tersebut. Penganggaran bentuk gelombang dan kaedah penurasan hingar telah diterbitkan melalui teknik penurasan alternatif Z-tunjang yang telah dibangunkan dalam kertas kerja ini. Lengkung eksperimen yang diperoleh melalui penentuan pekali M-Z-N bagi pelbagai daya impak dan jenis bahan logam menunjukkan perubahan statistik yang ketara dan boleh digunakan bagi menentukan korelasi antara ciri-ciri lengkung dan sifat-sifat elastik bahan logam yang tertentu. Uji kaji eksperimen melalui kaedah analisis ini pada empat jenis bahan logam menunjukkan terdapat korelasi yang baik antara pekali kuadratik yang terhasil dan sifat-sifat elastik bahan logam tersebut.
Kata kunci: Analisis statistik; penurasan isyarat; akustik fana; sambutan getaran; sifat-sifat elastik
INTRODUCTION
A knowledge of elastic properties is fundamental for the complete characterisation of engineering materials (Alfano and Pagnotta 2007) and very important for design and engineering applications. A great number of experimental techniques has been developed to determine elastic properties and can be classified into two groups: static methods and dynamic methods.
Static methods referred to the direct measurement of stresses and strains during mechanical testing such as tensile, compressive and flexural test. The static elastic properties are determined from the stress-strain curve. The disadvantages of static characterisation methods such as being slow, requiring many samples and generally more expensive (Ayorinde and Yu 2005).
Determining the elastic properties of materials by analysing their dynamic response is a well-known technique (Alfano and Pagnotta 2006). Classification of dynamic methods are based into two groups: resonance and pulse method. Resonance methods consist of setting a sample into mechanical vibration in one or more vibrational modes at one or more frequency at which the vibrational displacements are at a maximum (resonance). Excitation can be performed by drivers having continuously variable frequencies output or by impact. Transducers are used to monitor the vibrations of the sample and analysed in order to determine its characteristic frequencies. Knowing the vibrational mode, frequency, dimensions and mass of the samples, it is possible to calculate the elastic constants of the material (Radovic et al. 2004). Pulse technique is based

22
on the transit time that is the time spent for the ultrasonic pulse to travel through the specimen from the transmitting to the receiving transducer. Young’s and shear modulus of the material can be determined using the transit time for longitudinal and transversal ultrasonic waves, dimensions and density of the samples (Plachy et al. 2009).
Dynamic techniques provide an advantage over static techniques because of ease of specimen preparation, wide variety of specimen shapes and sizes, great precision, measurement over a wide temperature range and other conditions, and methods are nondestructive thus measurements can be repeated on the same specimen and ease of implementation make it very attractive for both research and industrial contexts.
The present paper is concerned with the dynamic characterisation of elastic properties of metallic materials by the measurement of vibration and acoustic signals from impulsive excitation test. In the following, a description is given on the experimental set up and the procedure used, as well as the development of an alternative signal filtering technique and statistical signal analysis method. Then the detail experimental results are presented followed by a discussion with a special focus on the new alternative statistical signal analysis method called Mesokurtosis Zonal Nonparametric (M-Z-N).
EXPERIMENTAL SET-UP AND PROCEDURE
EXPERIMENTAL SET-UP
The experimental set-up shown in Figure 1 consists of rectangular bars of metallic material (cast iron FCD 500, medium carbon steel S50C, stainless steel AISI 304 and brass) with the size of 250 x 50 x 10 mm (length x
width x thickness), an impact hammer as an impactor, microphone and its power module, accelerometer and two signal pickup systems to measure force, and vibration and acoustic signals. The elastic properties of the specimens are obtained from CES EduPack 2006 and are given in Table 1. The experiment was conducted in a semi anechoic room and the procedure is in accordance with ASTM E1876-07. Accelerometer was placed in contact with the test specimen only as far from the nodal point as necessary to pickup the desired vibration. Microphone was located over an antinode point and closes enough to the test specimen to measure the acoustic waveform. The specimen was impacted using an impact hammer at the center of the specimen. The resultant force, vibration and acoustic readings were recorded simultaneously.
Material Young’s Modulus (GPa)
Shear Modulus (GPa)
Tensile Strength (MPa)
Yield Strength (MPa)
Cast iron FCD 500 90.1 35.5 124.8 81.4
Medium carbon steel S50C 213.9 82.6 637.5 364.8
Stainless steel AISI 304 196.3 77.6 564.7 257.2
Brass 96.9 35.9 204.8 89.6
FIGURE 1. Measurement set-up device for impulsive excitation test
TABLE 1. Elastic properties of the specimen
ALTERNATIVE SIGNAL FILTERING TECHNIQUE
The resulting vibration caused by impulse excitation will produce several frequency peak values which is known as natural frequencies of mechanical vibrations in a structure (structure-borne sound) and radiated vibrations in the surrounding air (airborne sound) (Hertlin and Schultze 2003). The natural frequencies depend uniquely on the specimen’s material, geometry and condition. In this present work, the data selection method used for processing and analysing is the same natural frequency values of vibration and acoustic signals in the observation
process. The different frequency peak values will be treated as noise and will be removed. To obtain the frequency peak values, both of the recorded signals were transformed to the frequency domain using Fast Fourier Transform (FFT) algorithm.
Common digital signal filtering technique requires the determination of cut-off frequencies. This is seen not suitable as the noise frequency components is between the natural frequency components in the vibration and acoustic signals. The vibration and acoustic signals were filtered using Z-stem filter algorithm based on the frequency

23
components in order to remove the unwanted noise. The values of frequency components for vibration and acoustic signals were compared to observe the same natural frequency components and the difference frequency peak values (noise). To filtering out the noise components in the acoustic signal, it is done by treating the natural frequency components in the vibration signal as a reference to obtain a precise acoustic signal. The result from this filtering technique is the acoustic signal that has same natural frequency components with the vibration signal and minimum noise content.
The effectiveness of the Z-stem filter de-noising technique in removing unwanted noise can be calculated by the deviation of the correlation coefficient of the signals between the filtered signals using Z-stem filter and the measured signals that were measured from the experiment. The effectiveness of the Z-stem filter de-noising technique can be observed by the value of e as shown in Equation 1.
(1)
where Rmeasured is the correlation coeffient of the recorded signal and Rfiltered is the correlation coefficient of the filtered signal using Z-stem filtering technique. The correlation coefficient was utilised in order to quantify the similarity of the filtered and unfiltered signal against noise. Equation 2 shows the correlation coefficient, R which represents the normalized measure of the strength of linear relationship between variables (Matlab 2009).
(2)
where xt is the data value at time step t, n is the number of data, k is the lag and x is the mean.
ALTERNATIVE STATISTICAL SIGNAL ANALYSIS METHOD
In this paper, an alternative statistical signal analysis method has been developed, known as Mesokurtosis Zonal Nonparametric (M-Z-N). This method was developed based on the concept of data scattering with respect to the root mean square (r.m.s) value of the signal. This r.m.s parameter is used to quantify the overall energy content of the signal. For discrete data sets, the root mean square value is defined as in Equation 3.
(3)
where xi is the value of the data point and n is the number of data points in a sample sequence. The M-Z-N coefficient is derived and can be calculated by Equation 4 with the included r.m.s values.
measured
measuredfiltered
R1RR
e−
−=
( )( )
( )∑
∑
=
=+
−
−−= N
tt
N
tktt
xx
xxxxR
1
2
1
(4)
where M is number of segment, N is number of data in a segment, xi is discrete data value of i-th sample in a segment and rms is root mean square for a segment. The filtered sound signal was analysed using M-Z-N analysis method in order to observe the information characteristic contained in the signal. The M-Z-N analysis provides M-Z-N coefficient.
RESULTS AND DISCUSSION
Z-STEM FILTER FOR DE-NOISING UNWANTED MODES
Impulsive excitation test has been performed elastically at the center of the specimen without plastic deformation at an impacted area during the contact period. The lowest range of impact force that can be detected by piezoelectric force transducer is 400 N for these metallic materials. Under our experimental conditions as using impact hammer as an impactor, the experiment was conducted in the range of impact force of 400 - 500 N, 600 - 700 N, 800 - 900 N, 1000 - 1100 N, 1200 - 1300 N, 1400 - 1500 N and 1600 - 1700 N. This is the maximum allowable impact force that can be imposed to the specimen, since the higher impact force than 1600 - 1700 N range will caused the specimen to move from the support system.
Figure 2 shows the representations of the transient vibration response and acoustic radiation of the impulse excitation test pieces made of several metallic materials in the range of 800 - 900 N and measured experimentally by the developed apparatus. The selected signal was based on 90 percent attenuation from the maximum amplitude, make the plotted time domain signal in different length of time. We can observe an obvious characteristic in the shapes of the time domain for both signals and all metallic materials. This indicates that the impulse excitation generate high oscillation of vibration and acoustic signals as a result of a dynamic response of impact testing interaction between the tip hammer and specimen’s surface (Shterenlikht et al. 2005). There was no significant difference in the time domain signals characteristic. As the impact energy increases, the peak values of this time domain signals became increase.
The plot of magnitude versus frequency content in Figure 3 obtained after Fast Fourier Transform process shows several modes of vibration and acoustic signals that have same natural frequency peak values were generated during the impact-excited process. For cast iron FCD 500 (see Figure 3a), the five natural frequencies are f1 = 750 Hz, f2 = 2025 Hz, f3 = 3875 Hz, f4 = 6275 Hz and f5 = 9175 Hz. There are also some different modes exist between vibration and acoustic signals for a particular material. These different modes are referred to noise component. For cast iron FCD 500, the noise components are n1 = 16000 Hz
∑=
=n
1i
2ix
n1s.m.r
( )∑ ∑= =
−=−−
M
1j
N
1i
2i rmsx
N1
M1NZM

24
in vibration signal and n1 = 16950 Hz in acoustic signal. This unwanted mode in the acoustic signal need to be
FIGURE 2. Time histories record: (a) cast iron FCD 500 (890 N) (b) stainless steel AISI 304 (890 N) (c) medium carbon steel S50C (890 N) (d) brass (840 N)
filtered by making vibration modes as a reference to get precise acoustic signal for the analysis purposes.
FIGURE. 3. Frequency content of the measured signal: (a) cast iron FCD 500 (890 N) (b) stainless steel AISI 304 (890 N) (c) medium carbon steel S50C (890 N) (d) brass (840 N)
25
Z-stem filter de-noising technique was applied to remove the noise component (unwanted mode) contained in the measured acoustic signal. In the present observations shown in Figure 4a for cast iron FCD 500, the five modes which contained the natural frequency components were retained in the filtered signal. The five natural frequencies of f1 = 750 Hz, f2 = 2025 Hz, f3 = 3875 Hz, f4 = 6275
FIGURE 4. Frequency domain and time series of the filtered acoustic signal: (a) cast iron FCD 500 (890 N) (b) stainless steel AISI 304 (890 N) (c) medium carbon steel S50C (890 N) (d) brass (840 N)
Hz and f5 = 9175 Hz were unchanged by this filtration technique and maintained similar magnitude with the measured signal (see Figure 3a). The noise component with the frequency peak of 16950 Hz in the acoustic signal is no longer present. This means that the unwanted noise component has been eliminated by the Z-stem filter de-noising technique.
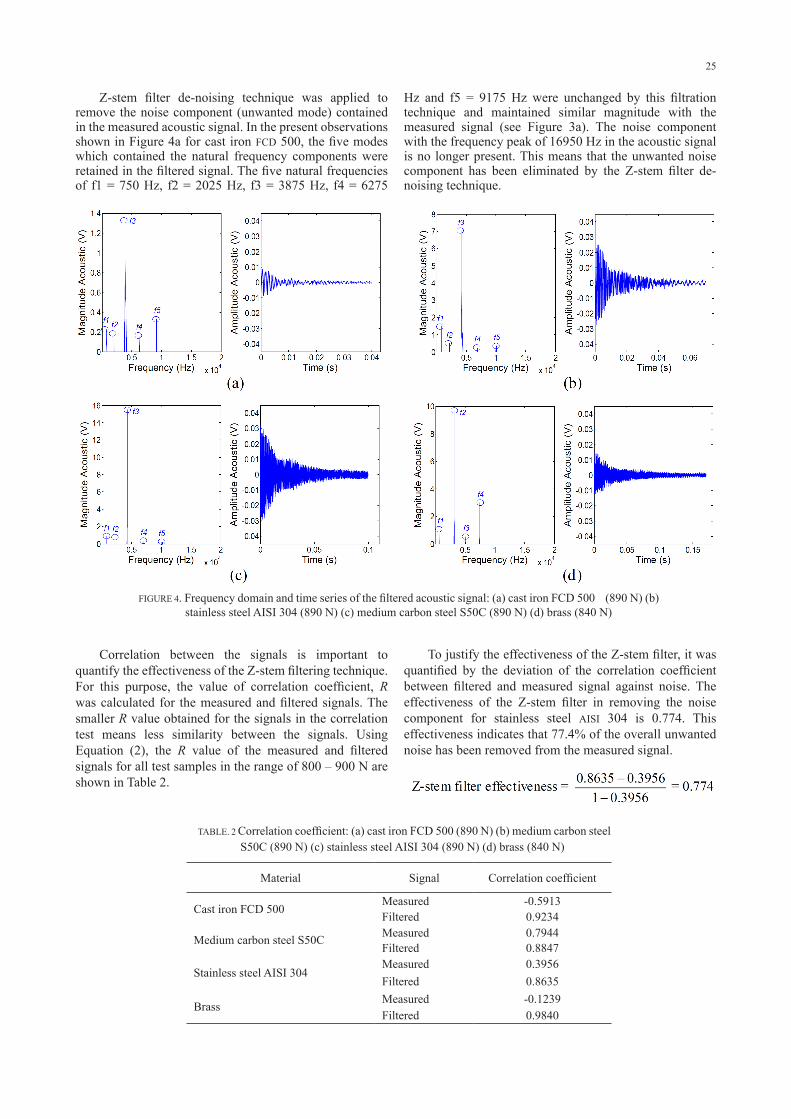
Correlation between the signals is important to quantify the effectiveness of the Z-stem filtering technique. For this purpose, the value of correlation coefficient, R was calculated for the measured and filtered signals. The smaller R value obtained for the signals in the correlation test means less similarity between the signals. Using Equation (2), the R value of the measured and filtered signals for all test samples in the range of 800 – 900 N are shown in Table 2.
Material Signal Correlation coefficient
Cast iron FCD 500Measured -0.5913Filtered 0.9234
Medium carbon steel S50C Measured 0.7944Filtered 0.8847
Stainless steel AISI 304Measured 0.3956Filtered 0.8635
Brass Measured -0.1239Filtered 0.9840
TABLE. 2 Correlation coefficient: (a) cast iron FCD 500 (890 N) (b) medium carbon steel S50C (890 N) (c) stainless steel AISI 304 (890 N) (d) brass (840 N)
To justify the effectiveness of the Z-stem filter, it was quantified by the deviation of the correlation coefficient between filtered and measured signal against noise. The effectiveness of the Z-stem filter in removing the noise component for stainless steel AISI 304 is 0.774. This effectiveness indicates that 77.4% of the overall unwanted noise has been removed from the measured signal.

26
MESOKURTOSIS ZONAL NONPARAMETRIC METHOD IN ANALYSING THE SIGNAL
Mesokurtosis Zonal Nonparametric analysis was performed on the filtered acoustic signal shown in Figure 4. An obvious consequence of the M-Z-N coefficient pattern can be observed. Table 3 shows the analysis results for all impact forces and metallic materials.
0 200 400 600 800 1000 1200 1400 1600 18000
0.5
1
1.5
2
2.5
3
3.5
x 10-4
Impact Force (N)
Aco
ust
ic M
-Z-N
Co
effi
cie
nt
Medium carbon steel S50C fit 1Stainless steel AISI 304 fit 2Cast iron FCD 500 fit 3Brass fit 4
FIGURE 5. Experimental curves of the relation between acoustic M-Z-N coefficient and impact force for different metallic materials
Based on Table 3, it can be seen that the acoustic M-Z-N coefficient for each type of metallic material increases with the increases value of impact force excited at the specimen. The acoustic M-Z-N coefficient increment is due to the increase in the value of root mean square (r.m.s) of the acoustic signal, since higher impact force applied to
TABLE. 3 Acoustic M-Z-N coefficient (a) cast iron FCD 500 (b) stainless steel AISI 304 (c) medium carbon steel S50C (d) brass
the specimen will result in the higher amplitude of acoustic signal. While for all the type of metallic materials, the value of the acoustic M-Z-N coefficient varies in a similar range value of impact force. The difference in the acoustic M-Z-N coefficient is thought to be caused by the different distribution of the discrete values for a particular type of signal. The changes in the acoustic M-Z-N coefficient listed in Table 3 for the four type of metallic materials are plotted in Figure 5.
Figure 5 illustrates the relation between acoustic M-Z-N coefficient and impact force for all metallic materials. As seen in the plots, the resulting curve fit for each type of metallic material is in the form of a quadratic equation. Range of R2 values for the entire quadratic curve is high. The quadratic equation for each type of material is as follows in Table 4.
From the results of M-Z-N analysis, the features can be extracted from the quadratic equation in which the quadratic coefficient plays a dominant role to describe the difference between the metallic materials. The value of the quadratic coefficient is used to obtain the correlation between relevant elastic properties and acoustic signal. Correlating these equations with the elastic properties in Table 1, four findings have been found. Table 5 shows the quadratic coefficient for each type of metallic material with their Young’s modulus, shear modulus, tensile strength and yield strength values.
Table 5 indicates that the quadratic coefficient of the plot for all the samples are in agreement with the relevant elastic properties. The results show a significant interrelationship between the quadratic coefficient and the elastic properties. It was revealed that material having higher Young‘s modulus, shear modulus, tensile strength and yield strength value will produce higher quadratic coefficient. These correlations between elastic properties (Young‘s modulus, shear modulus, tensile strength and yield strength) and acoustic signal based on Table 5 prove that the application of the new developed alternative statistical signal analysis method of M-Z-N on the impulse excitation data can be used to characterise the elastic properties of metallic material.

27
Material Quadratic Coefficient
Young’s Modulus
(GPa)
Shear Modulus
(GPa)
Tensile Strength (MPa)
Yield Strength (MPa)
Cast iron FCD 500 2.059 x 10⁻¹¹ 90.1 35.5 124.8 81.4Brass 2.721 x 10⁻¹¹ 96.9 35.9 204.8 89.6Stainless Steel AISI 304 9.221 x 10⁻¹¹ 196.3 77.6 564.7 257.2Medium carbon steel S50C 9.531 x 10⁻¹¹ 213.9 82.6 637.5 364.8
TABLE 5. Quadratic coefficient and relevant elastic properties
CONCLUSION
In this paper, the presented observations and discussions have shown the applicability of the developed alternative statistical signal analysis method known as Mesokurtosis Zonal Nonparametric (M-Z-N) to characterise the relevant elastic properties of metallic material. The procedure requires the measurement of transient vibration response and acoustic radiation using microphone and accelerometer from the impact-excited specimen by means of impact hammer. The basic analysis function has been applied to extract the frequency components. The main factors affecting the use of raw impact acoustic signal has been eliminated by using an alternative Z-stem filtering technique to remove the noise component. The development of an alternative signal analysis method has been described in detail and the experimental curves of the M-Z-N coefficient for different metallic materials have been plotted to determine the correlation between the M-Z-N coefficient and elastic properties of metallic material. Experimental test of this method on four metallic materials shows a good agreement between the quadratic coefficients with the elastic properties of the metallic material.
REFERENCES
Alfano, M. & Pagnotta, L., 2006. Determining the elastic constants of isotropic materials by modal vibration testing of rectangular thin plates. Journal of Sound and Vibration 293: 426-439.
_________. 2007. A non-destructive technique for the elastic characterization of thin isotropic plates. Original Research Article. NDT & E International 40(2): 112-120.
ASTM E1876-07 Standard Test Method for Dynamic Young’s Modulus, Shear Modulus and Poisson’s Ratio by Impulse Excitation of Vibration.
Ayorinde, E. O. and Yu, L. 2005. On the elastic characterization of composite plates with vibration data. Journal of Sound and Vibration 283: 243-262.
Correlation analysis, “Matlab 2009 User Guide,” The MathWorks, Inc.
Hertlin, I. & Schultze, D. 2003. Acoustic resonance testing: the upcoming volume-oriented NDT method. III Pan-American Conference for Nondestructive Testing.
Plachy, T., Padevet, P. & Polak, M. 2009. Comparison of two experimental techniques for determination of Young’s modulus of concrete specimens. Proceedings of the 5th WSEAS International Conference on Applied and Theoretical Mechanics, pp. 68-71.
Radovic, M., Lara-Curzio, E. & Riester, L., 2004. Comparison of different experimental techniques for determination of elastic properties of solids. Materials Science and Engineering A368: 56–70.
Shterenlikht, A., Hashemi, S. H., Yates, J. R., Howard, I. C. & Andrews, R. M. 2005. Assessment of an instrumented charpy impact machine. International Journal of Fracture 132: 81-97.
M.Z. Nuawi, A.R. Bahari, S. Abdullah, A.K.A.M. Ihsan & M.B. AliDepartment of Mechanical & Materials EngineeringUniversiti Kebangsaan Malaysia 43600 UKM Bangi Selangor, Malaysia
Corresponding author:[email protected], [email protected],[email protected],
[email protected], [email protected]
Received Date: 2 November 2012 Accepted Date: 24 December 2012
TABLE 4. Curve fitting equation
Material Equation R2
Medium carbon steel S50C xxy 8211 10904.410531.9 −− ×+×= 0.981
Stainless steel AISI 304 xxy 10211 10890.310221.9 −− ×+×= 0.990
Cast iron FCD 500 xxy 9211 10172.810059.2 −− ×−×= 0.952
Brass xxy 9211 10006.710721.2 −− ×−×= 0.954