Merriman Curhan Ford & Co. 2 nd Annual IP Video Conference March 3, 2008
9
Merriman Curhan Ford & Co. 2 nd Annual IP Video Conference March 3, 2008
-
Upload
marguerite-lefevre -
Category
Documents
-
view
21 -
download
0
description
Merriman Curhan Ford & Co. 2 nd Annual IP Video Conference March 3, 2008. Opnext. “ Opnext is a leading designer and manufacturer of transmit and receive optical modules and components which enables high-speed telecommunications and data communications networks globally”. - PowerPoint PPT Presentation
Transcript of Merriman Curhan Ford & Co. 2 nd Annual IP Video Conference March 3, 2008

Merriman Curhan Ford & Co.2nd Annual IP Video ConferenceMarch 3, 2008
2
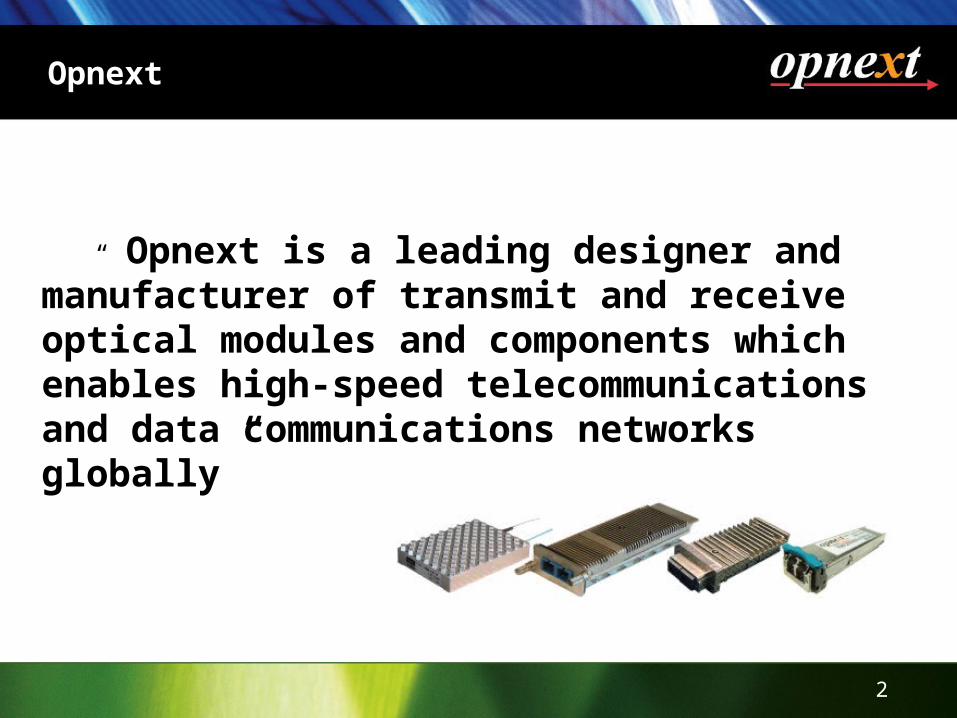
Opnext
“ Opnext is a leading designer and manufacturer of transmit and receive optical modules and components which enables high-speed telecommunications and data communications networks globally”

3
Deployment of Broadband Access Capabilities (CATV/FTTC/FTTP)
+
Proliferation of applications
Demand for Bandwidth is Growing Exponentially
Peer-to-Peer
Storage
Multimedia
Online Gaming
HDVideo
IP-TV
VideoConferencing
Ban
dw
idth
De
man
d
Now Future

4
Total IP Traffic
Source: Cisco January 2008
-
10,000
20,000
30,000
2005 2006 2007 2008 2009 2010 2011
PB
/m
on
th
Mobility
Business Internet Traffic
Business IP WAN Traffic
Consumer Internet
Consumer Non-Internet IPVideo Traffic
5%
13%
6%
43%
33%
• IP Traffic will double every two years• Consumer IP traffic is growing at a 52% CAGR• One third of all Internet Traffic in 2011 will be non-Internet traditional video services

5
MetroSonet/SDH
Rings
ResidentialNetwork
Network Architecture
All Optical Backbone
National IP Network
PON
DSLAM
MSO
xDSL
CorporateNetwork
ONU
CableModem
OLT
HeadEnd
Multi-Servic
eEdge
Router
Video On Demand Servers
Voice ApplicationServers
• • • Internet
PSTN
IP / Optical Infrastructure

6
10G Telecom 10G Datacom 40G Datacom 40G Telecom Other
$487$721
$261$377
$46
$84
$2,548
$2,442
2007 2009
$487$589
$721
$261
$328
$377
$46
$66
$84
$36
2007 2008 2009
Opnext Core Business Continues To Be High-Growth 10G and 40G Segments
Source: Ovum-RHK 2007, LightCounting 2008, and Opnext
Total Optical Component Spending ($mm)Total Optical Component Spending ($mm) 10G and 40G Module Spending ($mm)10G and 40G Module Spending ($mm)
$3,236
$3,766 10G and 40G comprise ~80% of our revenues
63% CAGR
22% CAGR
20% CAGR
24% CAGR
$36
$794$794
$1,218$1,218
$983$983

7
Selected Opnext Customers
Major Telecom CustomersMajor Telecom CustomersMajor Telecom CustomersMajor Telecom Customers
Major Datacom CustomersMajor Datacom CustomersMajor Datacom CustomersMajor Datacom Customers

8
Annual Financial Data
* Excludes asset impairment charge during the year ended Mar-04
Sales(in millions)
$0.0
$50.0
$100.0
$150.0
$200.0
$250.0
Sales $79.4 $138.4 $151.7 $222.9 $210.8
Mar-04 Mar-05 Mar-06 Mar-07 YTD Dec-07
Gross Margin
0.0%
5.0%10.0%
15.0%
20.0%
25.0%30.0%
35.0%
40.0%
Mar-04 Mar-05 Mar-06 Mar-07 YTD Dec-07
Net Income (Loss) Per Share*Fully Diluted
($1.57)
($0.63)
($0.61)
$0.01
$0.29
Mar-04
Mar-05
Mar-06
Mar-07
YTD Dec-07

9
Quarterly Financial Data
*Excludes Stock-based Compensation Expense
Sales(in millions)
$0.0
$20.0
$40.0
$60.0
$80.0
$100.0
Sales $40.4 $55.3 $61.7 $65.4 $67.8 $76.6 $66.4
Jun-06 Sep-06 Dec-06 Mar-07 Jun-07 Sep-07 Dec-07
Gross Margin *
29.0%
30.0%
31.0%
32.0%
33.0%
34.0%
35.0%
36.0%
Jun-06 Sep-06 Dec-06 Mar-07 Jun-07 Sep-07 Dec-07
Net Income (Loss) Per Share*Fully Diluted
($0.08)
$0.02
$0.05
$0.08
$0.09
$0.11
$0.09
Jun-06
Sep-06
Dec-06
Mar-07
Jun-07
Sep-07
Dec-07


![Shawne Merriman Shawne DeAndre Merriman [1] (born May 25, 1984 in Washington, D.C.) is an American football outside linebacker for the San Diego Chargers.](https://static.fdocuments.net/doc/165x107/5697bfa31a28abf838c96b53/shawne-merriman-shawne-deandre-merriman-1-born-may-25-1984-in-washington.jpg)