Medical Technology M&A Review Q1 2015 EV/EBITDA multiples for the OMD comparables in Q1 2015 were...
12
Medical Technology M&A Review Q1 2015 For additional information or inquiries, please contact one of our following team members: www.pmcf.com Bryan Hughes 312.602.3636 [email protected] Brian Gorski 312.602.3623 [email protected] David Sastre 312.602.3570 [email protected] Mike Brooks 312.602.3644 [email protected]
Transcript of Medical Technology M&A Review Q1 2015 EV/EBITDA multiples for the OMD comparables in Q1 2015 were...

Medical Technology M&A Review Q1 2015
For additional information or inquiries, please contact one of our following team members:
www.pmcf.com
Bryan [email protected]
Brian [email protected]
David [email protected]
Mike Brooks [email protected]
About PMCF
P&M Corporate Finance (“PMCF”) is an investment banking firm, focused ex-clusively on middle market transactions, with professionals in Chicago, Detroit, and across the globe through Corporate Finance International associates. Our deep knowledge of the medical technology market covers a wide range of sectors, including contract manufacturing & research, medical devices, in vitro diagnos-tics and life science instruments. Offering a depth of advisory services, PMCF has helped clients worldwide meet their sale, acquisition, financing, and strate-gic alliance goals. Additional information on PMCF can also be found by visiting our website, www.pmcf.com.
Investment Banking Services:• Mergers and Acquisitions
• Sales and Divestitures
• Capital Raising
• Strategic Assessments
CHICAGO225 W. Washington Street, Suite 2700Chicago, IL 60606312.602.3600
DETROITTwo Towne Square, Suite 425Southfield, MI 48076248.223.3300
Select PMCF Medical Technology Transactions
has acquired
Universal Container Corporation
www.pmcf.com
Medical Technology – M&A Review Q1 2015
2
Venture Capital
Activity Overview – Broad Economy
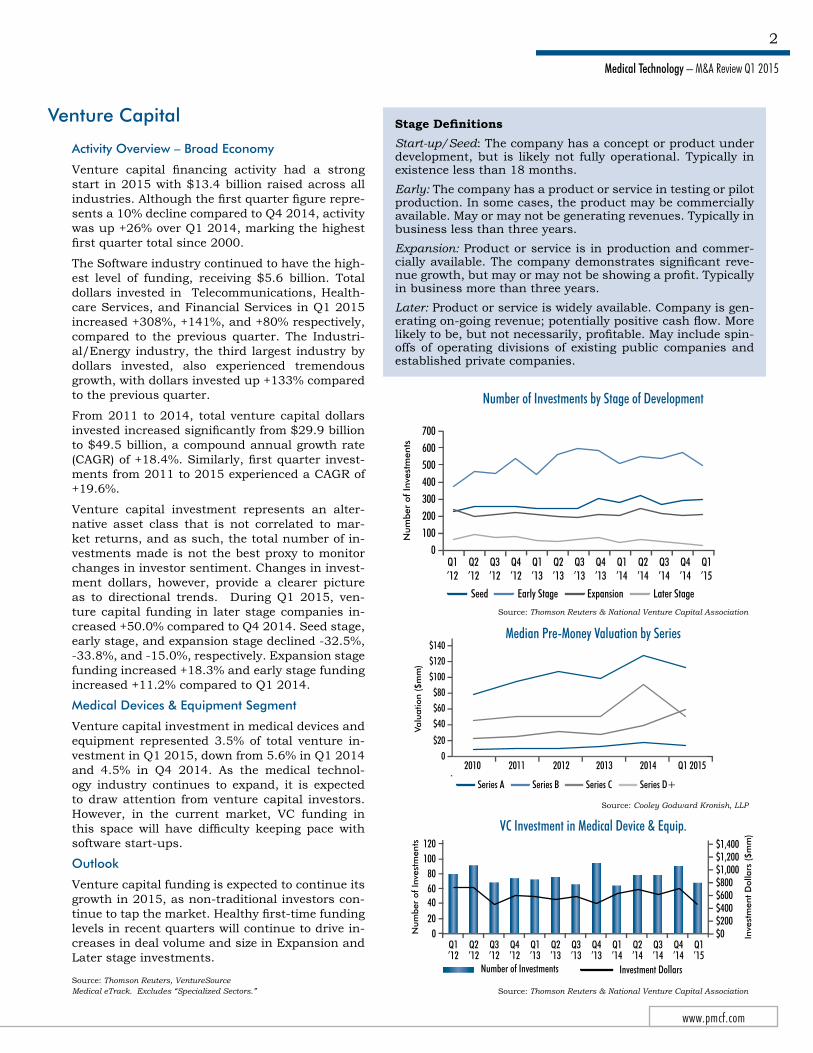
Venture capital financing activity had a strong start in 2015 with $13.4 billion raised across all industries. Although the first quarter figure repre-sents a 10% decline compared to Q4 2014, activity was up +26% over Q1 2014, marking the highest first quarter total since 2000.
The Software industry continued to have the high-est level of funding, receiving $5.6 billion. Total dollars invested in Telecommunications, Health-care Services, and Financial Services in Q1 2015 increased +308%, +141%, and +80% respectively, compared to the previous quarter. The Industri-al/Energy industry, the third largest industry by dollars invested, also experienced tremendous growth, with dollars invested up +133% compared to the previous quarter.
From 2011 to 2014, total venture capital dollars invested increased significantly from $29.9 billion to $49.5 billion, a compound annual growth rate (CAGR) of +18.4%. Similarly, first quarter invest-ments from 2011 to 2015 experienced a CAGR of +19.6%.
Venture capital investment represents an alter-native asset class that is not correlated to mar-ket returns, and as such, the total number of in-vestments made is not the best proxy to monitor changes in investor sentiment. Changes in invest-ment dollars, however, provide a clearer picture as to directional trends. During Q1 2015, ven-ture capital funding in later stage companies in-creased +50.0% compared to Q4 2014. Seed stage, early stage, and expansion stage declined -32.5%, -33.8%, and -15.0%, respectively. Expansion stage funding increased +18.3% and early stage funding increased +11.2% compared to Q1 2014.
Medical Devices & Equipment Segment
Venture capital investment in medical devices and equipment represented 3.5% of total venture in-vestment in Q1 2015, down from 5.6% in Q1 2014 and 4.5% in Q4 2014. As the medical technol-ogy industry continues to expand, it is expected to draw attention from venture capital investors. However, in the current market, VC funding in this space will have difficulty keeping pace with software start-ups.
Outlook
Venture capital funding is expected to continue its growth in 2015, as non-traditional investors con-tinue to tap the market. Healthy first-time funding levels in recent quarters will continue to drive in-creases in deal volume and size in Expansion and Later stage investments.
Stage DefinitionsStart-up/Seed: The company has a concept or product under development, but is likely not fully operational. Typically in existence less than 18 months. Early: The company has a product or service in testing or pilot production. In some cases, the product may be commercially available. May or may not be generating revenues. Typically in business less than three years.Expansion: Product or service is in production and commer-cially available. The company demonstrates significant reve-nue growth, but may or may not be showing a profit. Typically in business more than three years.Later: Product or service is widely available. Company is gen-erating on-going revenue; potentially positive cash flow. More likely to be, but not necessarily, profitable. May include spin-offs of operating divisions of existing public companies and established private companies.
Source: Cooley Godward Kronish, LLP
Source: Thomson Reuters & National Venture Capital Association
Source: Thomson Reuters, VentureSourceMedical eTrack. Excludes “Specialized Sectors.” Source: Thomson Reuters & National Venture Capital Association
Number of Investments by Stage of Development
200
400500
300
100
Q2’14
Q1’14
Q4’13
Q3’13
Q2’13
Q1’13
Q4’12
Q3’12
Q2’12
Q1’12
Q1’15
Num
ber
of In
vest
men
ts
ExpansionSeed Later StageEarly Stage
0
700600
Q3’14
Q4’14
Median Pre-Money Valuation by Series
Series CSeries A Series D+Series B
$40
$80
$60
$20
Q1 20152010 2011
Valu
atio
n ($
mm
)
2012 2013 2014
$120
$140
$100
0
0
40
80
120
20
60
100
Num
ber
of In
vest
men
ts
Number of Investments Investment Dollars
$600
$1,400
$1,000
$400$200
Inve
stm
ent
Dol
lars
($m
m)
$0Q2’14
Q1’14
Q4’13
Q3’13
Q2’13
Q1’13
Q4’12
Q3’12
Q2’12
Q1’12
Q1’15
$1,200
$800
Q3’14
Q4’14
VC Investment in Medical Device & Equip.

Medical Technology – M&A Review Q1 2015
PMCF
3
Medical Device Public Comparables
Diversified Medical Device Public Comparables Summary
Source: S&P Capital IQ, Company Reports
Cash($MM)LTM as of Debt
($MM)Market Cap
($MM)TEV
($MM)TEV/REV
TEV/EBITDA P/ECompany Name
Boston Scientific CorporationCR Bard Inc.Intuitive Surgical, Inc.Johnson & JohnsonMedtronic plcSmith & Nephew plcSt. Jude Medical Inc.Stryker Corporation
High Mean Median Low
3/31/20153/31/20153/31/20153/29/20151/23/201512/31/20141/3/20153/31/2015
242 1,008 1,362
31,319 31,160
93 1,472 4,278
31,319 8,867 1,417
93
4,268 1,640
0 18,983 28,899 1,705 3,866 3,482
28,8997,855 3,674
0
23,770 12,438 18,603
279,717 111,150 15,222 18,320 34,961
279,717 64,273 21,187 12,438
27,796 13,070 17,241
267,381 108,889 16,834 20,759 34,165
267,381 63,267 24,278 13,070
3.8x3.9x8.2x3.6x6.3x3.8x3.7x3.5x
8.2x4.6x3.8x3.5x
16.4x13.2x24.8x10.6x19.1x13.4x11.8x13.0x
24.8x15.3x13.3x10.6x
NM 44.5x45.5x17.6x25.0x32.0x18.9x68.8x
68.8x36.1x32.0x17.6x
As of March 31, 2015
Public trading multiples for the Diversified Medical Device (“DMD”) comparables maintained strong levels in Q1 2015 as average EV/EBITDA multiples were 15.3x in Q1 2015. Although the valuation metric decreased slightly from 15.4x in Q4 2014, Q1 2015 increased +13.3% from a year ago, when EV/EBITDA multiples finished at 13.6x at the end of Q1 2014. Average EV/Revenue multiples increased in Q1 2015, averaging 4.6x compared to 4.4x and 3.9x in Q4 2014 and Q1 2014, respectively.
The PMCF DMD Index slightly outperformed the S&P 500 Growth Index in 2014, finishing +16.1% for the year, compared to +14.0% for the S&P 500 Growth Index. In Q1 2015, the PMCF DMD Index decreased -1.3%, while the S&P 500 Growth Index experienced gains of +2.4%.
15.4x
4.0x
0.0x
5.0x
10.0x
20.0x
Average Enterprise Value/EBITDA Average Enterprise Value/Revenue
Q1 ‘152012 Q1 ‘13 Q2 ‘13 Q3 ‘13 Q4 ‘13 Q1 ‘14 Q2 ‘14
9.8x10.8x 11.0x 11.0x
12.4x14.3x
15.3x
4.6x3.3x 3.5x 3.5x 3.4x 3.6x 4.0x
13.6x
3.9x
15.0x 14.5x
4.4x
Q3 ‘14 Q4 ‘14
Diversified Medical Device Public Trading Multiples
Diversified Medical Device Index
-5%
0%
10%
25%
Jan-14 Mar-14 May-14
S&P 500 Growth IndexPMCF Diversified Medical Device Index
5%
20%
Nov-14
15%
Jul-14 Sep-14 Mar-15Jan-15
www.pmcf.com
Medical Technology – M&A Review Q1 2015
4
Orthopedic Medical Device Public Trading Multiples
Orthopedic Medical Device Index
Medical Device Public Comparables
Orthopedic Medical Device Public Comparables Summary
Source: S&P Capital IQ, Company Reports
Cash($MM)LTM as of Debt
($MM)Market Cap
($MM)TEV
($MM)TEV/REV
TEV/EBITDA P/ECompany Name
Alphatec Holdings, Inc.Exactech Inc.Globus Medical, Inc.NuVasive, Inc.Orthofix International N.V.Smith & Nephew plcStryker CorporationWright Medical Group Inc.Zimmer Holdings, Inc.
High Mean Median Low
As of March 31, 2015
3/31/20153/31/20153/31/20153/31/20153/31/201512/31/20143/31/20153/31/20153/31/2015
1112
2132893093
4,278465
9,282
9,2821,630
21311
79230
3650
1,7053,482
5499,061
9,0611,696
3650
145357
2,3902,214
67315,22234,9611,312
19,979
34,9618,5842,214
145
236368
2,1772,298
64316,83434,1651,395
19,760
34,1658,6532,177
236
1.1x1.5x4.6x2.9x1.6x3.8x3.5x4.6x4.2x
4.6x3.1x3.5x1.1x
8.8x8.3x
13.0x17.8x21.7x13.4x13.0x
NM11.1x
21.7x13.4x13.0x8.3x
NM21.7x26.0x
NMNM
32.0x68.8x
NM28.0x
68.8x35.3x28.0x21.7x
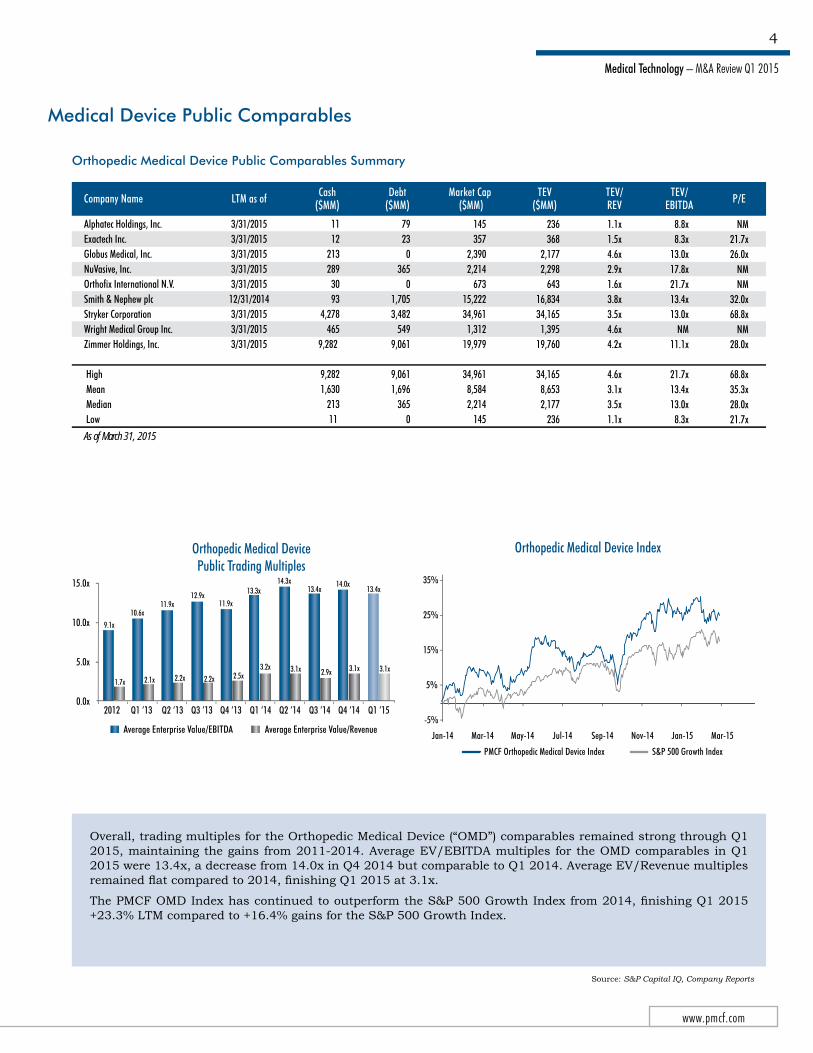
Overall, trading multiples for the Orthopedic Medical Device (“OMD”) comparables remained strong through Q1 2015, maintaining the gains from 2011-2014. Average EV/EBITDA multiples for the OMD comparables in Q1 2015 were 13.4x, a decrease from 14.0x in Q4 2014 but comparable to Q1 2014. Average EV/Revenue multiples remained flat compared to 2014, finishing Q1 2015 at 3.1x.
The PMCF OMD Index has continued to outperform the S&P 500 Growth Index from 2014, finishing Q1 2015 +23.3% LTM compared to +16.4% gains for the S&P 500 Growth Index.
0.0x
5.0x
10.0x
15.0x
Average Enterprise Value/EBITDA Average Enterprise Value/Revenue
13.4x 13.4x
9.1x10.6x
11.9x12.9x
11.9x
13.3x
2.9x 3.1x
1.7x 2.1x 2.2x 2.2x 2.5x3.2x
14.3x
3.1x
Q1 ‘152012 Q4 ‘14Q1 ‘13 Q2 ‘13 Q3 ‘13 Q4 ‘13 Q1 ‘14 Q2 ‘14 Q3 ‘14
14.0x
3.1x
-5%
15%
35%
S&P 500 Growth IndexPMCF Orthopedic Medical Device Index
5%
25%
Jan-14 Mar-14 May-14 Nov-14Jul-14 Sep-14 Mar-15Jan-15

Medical Technology – M&A Review Q1 2015
PMCF
5
Cardiovascular Medical Device Public Comparables Summary
Source: S&P Capital IQ, Company Reports
Cash($MM)LTM as of Debt
($MM)Market Cap
($MM)TEV
($MM)TEV/REV
TEV/EBITDA P/ECompany Name
ABIOMED, Inc.AngioDynamics Inc.Cardiovascular Systems Inc.CryoLife Inc.Edwards Lifesciences Corp.Endologix Inc.LeMaitre Vascular, Inc.Merit Medical Systems, Inc.Sorin SpAThoratec Corp.Vascular Solutions Inc.
High Mean Median Low
As of March 31, 2015
3/31/20152/28/20153/31/20153/31/20153/31/20153/31/20153/31/20153/31/20153/31/20151/5/20153/31/2015
132219332
1,37174171021
23034
1,37118534
10
0149
00
603710
213195
00
603112
00
2,896637
1,234290
15,3181,147
147842
1,4662,272
524
15,3182,4341,147147
2,764765
1,141257
14,5501,145
1301,0451,6402,042
489
14,5502,3611,141
130
13.1x2.2x7.1x1.8x6.2x7.7x1.8x2.1x2.0x4.3x3.9x
13.1x4.7x3.9x1.8x
NM14.5x
NM17.2x25.7x
NM12.1x13.3x14.1x23.9x19.6x
25.7x17.6x15.9x12.1x
NMNMNM
41.0x19.0x
NM36.4x36.3x30.2x47.1x42.1x
47.1x36.0x36.4x19.0x
In Q1 2015, average valuation multiples for the Cardiovascular Medical Device (“CVMD”) comparables surged to their highest level since 2006, averaging 17.6x EV/EBITDA compared to 16.2x in Q4 2014 and 13.9x in Q1 2014. In particular, Thoratec’s and Sorin’s average EV/EBITDA multiples grew to 23.9x and 14.1x, respectively. Aver-age EV/Revenue multiples also increased significantly to 4.7x in Q1 2015, up from 3.8x in Q4 2014 and 3.4x in Q1 2014.
The PMCF CVMD Index continued to widen the performance gap with the S&P 500 Growth Index that started in Q4 2014, finishing Q1 2015 at +66.3% LTM, compared to +14.5% for the S&P 500 Growth Index. Gains in Q1 2015 were driven primarily by strong earnings by Edwards Lifesciences Corp. and Thoratec, Corp. ABIOMED, Inc. also moved ahead on strong earnings and FDA approval of its Impella RP System under a Humanitarian Device Exemption.
0.0x
5.0x
10.0x
15.0x
Average Enterprise Value/EBITDA Average Enterprise Value/Revenue
13.4x
17.6x
12.9x13.4x
10.5x
12.9x14.6x 13.9x
2.9x4.7x
3.0x 3.4x 3.0x 3.1x 3.9x 3.4x
14.3x
3.5x
Q1 ‘152012 Q1 ‘13 Q2 ‘13 Q3 ‘13 Q4 ‘13 Q1 ‘14 Q2 ‘14
20.0x
16.2x
3.8x
Q3 ‘14 Q4 ‘14
Cardiovascular Medical Device Public Trading Multiples
Cardiovascular Medical Device Index
-5%
15%
75%
S&P 500 Growth Index PMCF Cardiovascular Medical Device Index
5%
55%
35%
Jan-14 Mar-14 May-14 Nov-14Jul-14 Sep-14 Mar-15Jan-15
65%
45%
25%
Medical Device Public Comparables

www.pmcf.com
Medical Technology – M&A Review Q1 2015
6
Diversified Diagnostic Public Comparables Summary
Source: S&P Capital IQ, Company Reports
Cash($MM)LTM as of Debt
($MM)Market Cap
($MM)TEV
($MM)TEV/REV
TEV/EBITDA P/ECompany Name
Abbott LaboratoriesBecton, Dickinson and Co.Danaher Corp.Hologic Inc.Johnson & JohnsonLaboratory Corp. of America Novartis AGOrion OyjRoche Holding AGSigma-Aldrich CorporationThermo Fisher Scientific, Inc.
High Mean Median Low
As of March 31, 2015
3/31/20153/31/201512/31/20143/28/20153/29/20153/31/20153/31/20153/31/201512/31/20143/31/20153/28/2015
9,8491,9683,006
67131,319
4467,363
33511,800
946873
31,3196,2341,968
335
8,90313,8383,4733,940
18,9836,946
25,113248
25,920300
14,870
25,92011,1408,903
248
69,91129,98360,0349,245
279,71712,647
237,6483,969
234,42116,51553,304
279,71791,58153,3043,969
69,07941,85360,57412,514
267,38119,163
255,4663,882
250,52615,86967,301
267,38196,69260,5743,882
3.6x3.7x3.0x5.0x3.6x2.5x4.5x3.6x4.9x5.7x3.9x
5.7x4.0x3.7x2.5x
16.7x14.5x13.3x13.8x10.6x12.8x13.1x11.8x12.7x18.8x16.8x
18.8x14.1x13.3x10.6x
41.4x24.7x23.4x
183.8x17.6x21.3x22.5x17.5x24.8x33.2x28.5x
183.8x39.9x24.7x17.5x
Average EV/EBITDA multiples for the Diversified Diagnostic Medical Device (“DDMD”) comparables enjoyed a strong start in 2015, growing from 13.5x at the end of Q4 2014 to 14.1x at the end of Q1 2015. Average EV/Rev-enue also continued an upward trend, ending Q1 2015 at 4.0x compared to 3.8x at the end of 2014.
The PMCF DDMD Index, which closely tracked the S&P 500 Growth Index in 2014, went up +1.4% in Q1 2015, while the S&P 500 Growth Index experienced gains of +2.4%. The PMCF Index is up +6.9% LTM compared to +14.5% for the S&P 500 Growth Index.
0.0x
5.0x
10.0x
20.0x
Average Enterprise Value/EBITDA Average Enterprise Value/Revenue
13.7x 14.1x
10.2x 10.5x 10.4x 10.6x 11.3x12.4x
3.8x 4.0x3.0x 3.0x 3.0x 3.0x 3.2x 3.4x
13.3x
3.7x
Q1 ‘152012 Q1 ‘13 Q2 ‘13 Q3 ‘13 Q4 ‘13 Q1 ‘14 Q2 ‘14
15.0x 13.5x
3.8x
Q3 ‘14 Q4 ‘14
Diversified Diagnostic Public Trading Multiples
Diversified Diagnostic Medical Device Index
-5%
15%
35%
S&P 500 Growth IndexPMCF Diversified Diagnostic Index
5%
25%
Jan-14 Mar-14 May-14 Nov-14Jul-14 Sep-14 Mar-15Jan-15
Medical Device Public Comparables
Medical Technology – M&A Review Q1 2015
PMCF
7
Mergers & Acquisitions
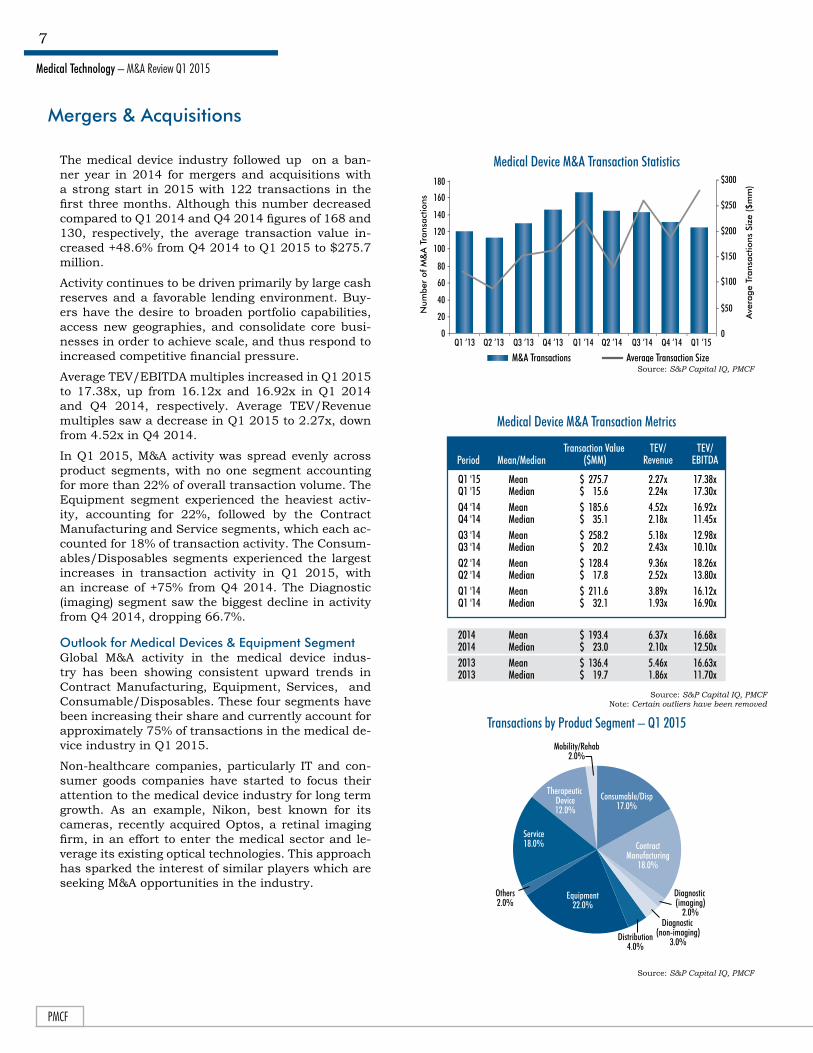
The medical device industry followed up on a ban-ner year in 2014 for mergers and acquisitions with a strong start in 2015 with 122 transactions in the first three months. Although this number decreased compared to Q1 2014 and Q4 2014 figures of 168 and 130, respectively, the average transaction value in-creased +48.6% from Q4 2014 to Q1 2015 to $275.7 million.
Activity continues to be driven primarily by large cash reserves and a favorable lending environment. Buy-ers have the desire to broaden portfolio capabilities, access new geographies, and consolidate core busi-nesses in order to achieve scale, and thus respond to increased competitive financial pressure.
Average TEV/EBITDA multiples increased in Q1 2015 to 17.38x, up from 16.12x and 16.92x in Q1 2014 and Q4 2014, respectively. Average TEV/Revenue multiples saw a decrease in Q1 2015 to 2.27x, down from 4.52x in Q4 2014.
In Q1 2015, M&A activity was spread evenly across product segments, with no one segment accounting for more than 22% of overall transaction volume. The Equipment segment experienced the heaviest activ-ity, accounting for 22%, followed by the Contract Manufacturing and Service segments, which each ac-counted for 18% of transaction activity. The Consum-ables/Disposables segments experienced the largest increases in transaction activity in Q1 2015, with an increase of +75% from Q4 2014. The Diagnostic (imaging) segment saw the biggest decline in activity from Q4 2014, dropping 66.7%.
Outlook for Medical Devices & Equipment SegmentGlobal M&A activity in the medical device indus-try has been showing consistent upward trends in Contract Manufacturing, Equipment, Services, and Consumable/Disposables. These four segments have been increasing their share and currently account for approximately 75% of transactions in the medical de-vice industry in Q1 2015.
Non-healthcare companies, particularly IT and con-sumer goods companies have started to focus their attention to the medical device industry for long term growth. As an example, Nikon, best known for its cameras, recently acquired Optos, a retinal imaging firm, in an effort to enter the medical sector and le-verage its existing optical technologies. This approach has sparked the interest of similar players which are seeking M&A opportunities in the industry.
Source: S&P Capital IQ, PMCF
Medical Device M&A Transaction Statistics
Q1 ‘14 Q2 ‘14 Q3 ‘14 Q4 ‘14 Q1 ‘15Q1 ‘13 Q2 ‘13 Q3 ‘13 Q4 ‘130
40
20
60
80
120
140
100
160
180
0
$50
$100
$200
$150
$250
$300
Ave
rage
Tra
nsac
tions
Siz
e ($
mm
)
Num
ber
of M
&A
Tra
nsac
tions
M&A Transactions Average Transaction Size
Source: S&P Capital IQ, PMCFNote: Certain outliers have been removed
Transaction Value ($MM)
TEV/Revenue
TEV/EBITDA
Q1 '15Q1 '15Q4 '14Q4 '14Q3 '14Q3 '14Q2 '14Q2 '14Q1 '14Q1 '14
2014201420132013
MeanMedianMeanMedianMeanMedianMeanMedianMeanMedian
MeanMedianMeanMedian
2.27x2.24x4.52x2.18x5.18x2.43x9.36x2.52x3.89x1.93x
6.37x2.10x5.46x1.86x
17.38x17.30x16.92x11.45x12.98x10.10x18.26x13.80x16.12x16.90x
16.68x12.50x16.63x11.70x
$ 275.7 $ 15.6 $ 185.6 $ 35.1 $ 258.2 $ 20.2 $ 128.4 $ 17.8 $ 211.6 $ 32.1
$ 193.4
$ 23.0 $ 136.4 $ 19.7
Mean/MedianPeriod
Medical Device M&A Transaction Metrics
Transactions by Product Segment – Q1 2015
Distribution4.0%
Equipment22.0%
Therapeutic Device12.0%
Diagnostic (non-imaging)
3.0%
Diagnostic (imaging)
2.0%
ContractManufacturing
18.0%
Consumable/Disp17.0%
Mobility/Rehab2.0%
Others2.0%
Service18.0%
Source: S&P Capital IQ, PMCF
www.pmcf.com
Medical Technology – M&A Review Q1 2015
8
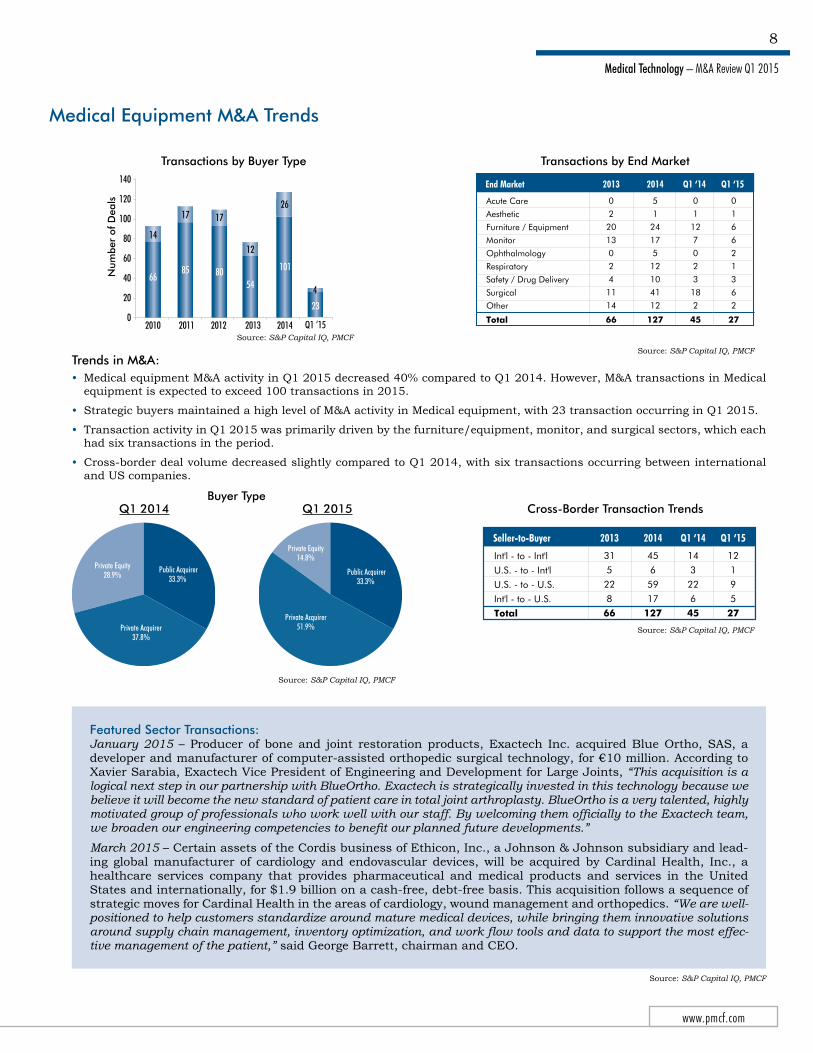
Medical Equipment M&A Trends
Trends in M&A:• Medical equipment M&A activity in Q1 2015 decreased 40% compared to Q1 2014. However, M&A transactions in Medical
equipment is expected to exceed 100 transactions in 2015.
• Strategic buyers maintained a high level of M&A activity in Medical equipment, with 23 transaction occurring in Q1 2015.
• Transaction activity in Q1 2015 was primarily driven by the furniture/equipment, monitor, and surgical sectors, which each had six transactions in the period.
• Cross-border deal volume decreased slightly compared to Q1 2014, with six transactions occurring between international and US companies.
Transactions by Buyer Type Transactions by End Market
Strategic Buyer Financial Buyer
101
5466
85 80
1826
1214
17 17
0
20
40
60
120
80
100
2010 2011 2012 2013 2014
Num
ber
of D
eals
140
23
4
Q1 ‘15
Acute Care
Aesthetic
Furniture / Equipment
Monitor
Ophthalmology
Respiratory
Safety / Drug Delivery
Surgical
Other
Total
5
1
24
17
5
12
10
41
12
127
0
2
20
13
0
2
4
11
14
66
0
1
12
7
0
2
3
18
2
45
2013End Market 2014 Q1 ‘14
0
1
6
6
2
1
3
6
2
27
Q1 ‘15
Q1 2014 Q1 2015Buyer Type
Private Acquirer51.9%
Public Acquirer33.3%
Private Equity14.8% Int'l - to - Int'l
U.S. - to - Int'l
U.S. - to - U.S.
Int'l - to - U.S.
Total
31
5
22
8
66
45
6
59
17
127
2013 2014
12
1
9
5
27
Q1 ‘15Seller-to-Buyer
14
3
22
6
45
Q1 ‘14
Cross-Border Transaction Trends
Featured Sector Transactions:January 2015 – Producer of bone and joint restoration products, Exactech Inc. acquired Blue Ortho, SAS, a developer and manufacturer of computer-assisted orthopedic surgical technology, for €10 million. According to Xavier Sarabia, Exactech Vice President of Engineering and Development for Large Joints, “This acquisition is a logical next step in our partnership with BlueOrtho. Exactech is strategically invested in this technology because we believe it will become the new standard of patient care in total joint arthroplasty. BlueOrtho is a very talented, highly motivated group of professionals who work well with our staff. By welcoming them officially to the Exactech team, we broaden our engineering competencies to benefit our planned future developments.”
March 2015 – Certain assets of the Cordis business of Ethicon, Inc., a Johnson & Johnson subsidiary and lead-ing global manufacturer of cardiology and endovascular devices, will be acquired by Cardinal Health, Inc., a healthcare services company that provides pharmaceutical and medical products and services in the United States and internationally, for $1.9 billion on a cash-free, debt-free basis. This acquisition follows a sequence of strategic moves for Cardinal Health in the areas of cardiology, wound management and orthopedics. “We are well-positioned to help customers standardize around mature medical devices, while bringing them innovative solutions around supply chain management, inventory optimization, and work flow tools and data to support the most effec-tive management of the patient,” said George Barrett, chairman and CEO.
Private Acquirer37.8%
Public Acquirer33.3%
Private Equity28.9%
Source: S&P Capital IQ, PMCF
Source: S&P Capital IQ, PMCF
Source: S&P Capital IQ, PMCF
Source: S&P Capital IQ, PMCF
Source: S&P Capital IQ, PMCF
Medical Technology – M&A Review Q1 2015
PMCF
9
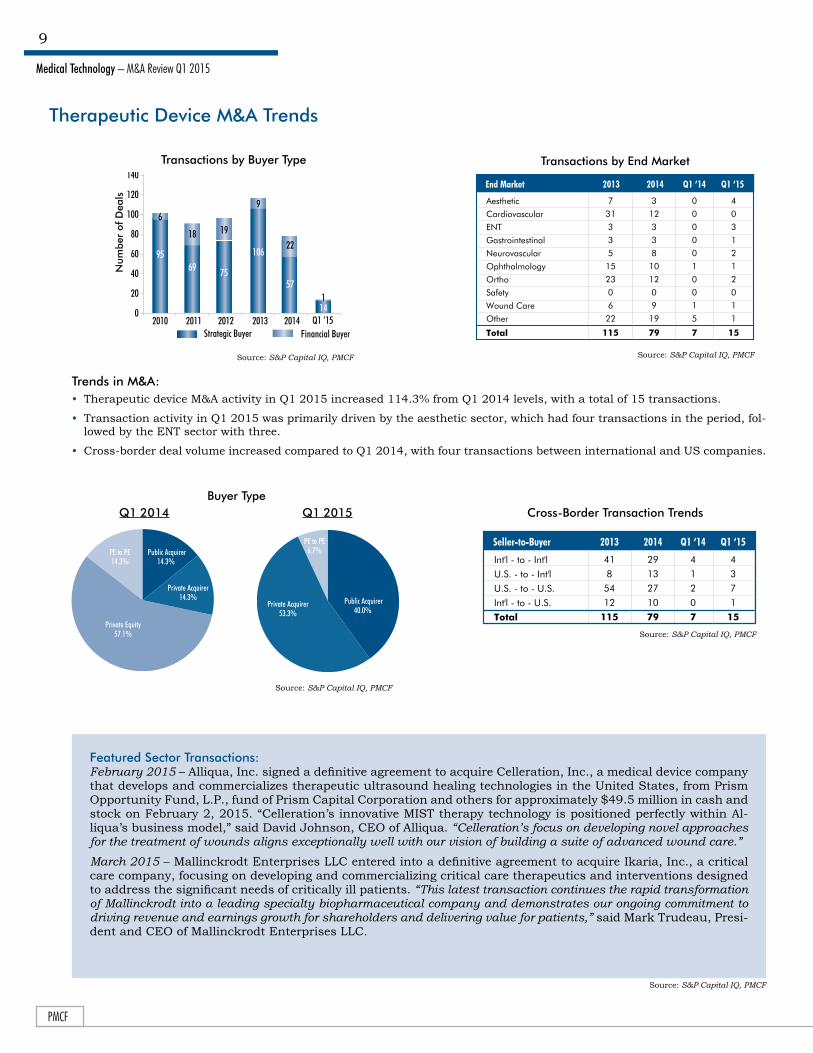
Therapeutic Device M&A Trends
Trends in M&A:• Therapeutic device M&A activity in Q1 2015 increased 114.3% from Q1 2014 levels, with a total of 15 transactions.
• Transaction activity in Q1 2015 was primarily driven by the aesthetic sector, which had four transactions in the period, fol-lowed by the ENT sector with three.
• Cross-border deal volume increased compared to Q1 2014, with four transactions between international and US companies.
Transactions by Buyer Type
Strategic Buyer Financial Buyer
57
1822
0
20
40
60
120
80
100
2010 2011 2012 2013 2014
Num
ber
of D
eals
140
Q1 ‘15141
1069569 75
96
18 19
Featured Sector Transactions:February 2015 – Alliqua, Inc. signed a definitive agreement to acquire Celleration, Inc., a medical device company that develops and commercializes therapeutic ultrasound healing technologies in the United States, from Prism Opportunity Fund, L.P., fund of Prism Capital Corporation and others for approximately $49.5 million in cash and stock on February 2, 2015. “Celleration’s innovative MIST therapy technology is positioned perfectly within Al-liqua’s business model,” said David Johnson, CEO of Alliqua. “Celleration’s focus on developing novel approaches for the treatment of wounds aligns exceptionally well with our vision of building a suite of advanced wound care.”
March 2015 – Mallinckrodt Enterprises LLC entered into a definitive agreement to acquire Ikaria, Inc., a critical care company, focusing on developing and commercializing critical care therapeutics and interventions designed to address the significant needs of critically ill patients. “This latest transaction continues the rapid transformation of Mallinckrodt into a leading specialty biopharmaceutical company and demonstrates our ongoing commitment to driving revenue and earnings growth for shareholders and delivering value for patients,” said Mark Trudeau, Presi-dent and CEO of Mallinckrodt Enterprises LLC.
Source: S&P Capital IQ, PMCF
Source: S&P Capital IQ, PMCF
Q1 2014 Q1 2015Buyer Type
Private Acquirer14.3%
Public Acquirer14.3%
PE to PE14.3%
Private Equity57.1%
Int'l - to - Int'l
U.S. - to - Int'l
U.S. - to - U.S.
Int'l - to - U.S.
Total
41
8
54
12
115
29
13
27
10
79
Seller-to-Buyer
4
1
2
0
7
2013 2014
4
3
7
1
15
Q1 ‘15Q1 ‘14
Cross-Border Transaction Trends
Private Acquirer53.3%
Public Acquirer40.0%
PE to PE6.7%
Source: S&P Capital IQ, PMCF
Source: S&P Capital IQ, PMCF
Transactions by End Market
4
0
3
1
2
1
2
0
1
1
15
Q1 ‘15
Aesthetic
Cardiovascular
ENT
Gastrointestinal
Neurovascular
Ophthalmology
Ortho
Safety
Wound Care
Other
Total
3
12
3
3
8
10
12
0
9
19
79
7
31
3
3
5
15
23
0
6
22
115
0
0
0
0
0
1
0
0
1
5
7
2013End Market 2014 Q1 ‘14
Source: S&P Capital IQ, PMCF
www.pmcf.com
Medical Technology – M&A Review Q1 2015
10
Private Acquirer61.9%
Public Acquirer33.3%
PE to PE4.8%
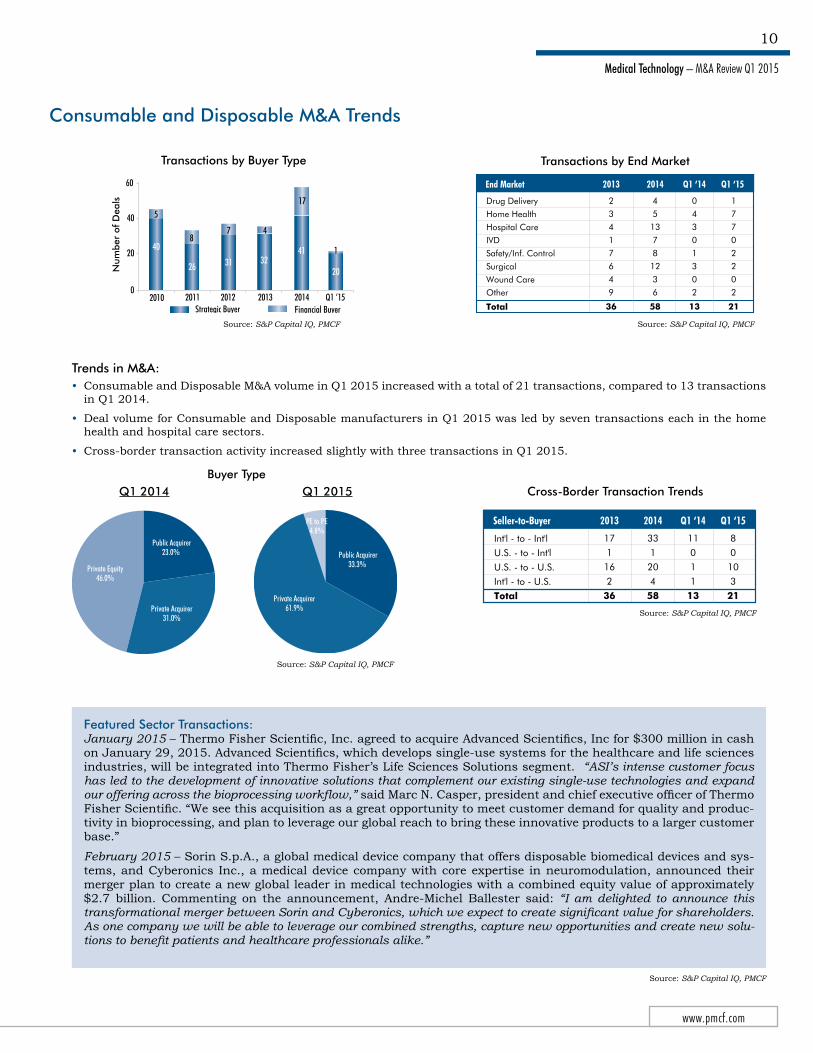
Consumable and Disposable M&A Trends
Trends in M&A:• Consumable and Disposable M&A volume in Q1 2015 increased with a total of 21 transactions, compared to 13 transactions
in Q1 2014.
• Deal volume for Consumable and Disposable manufacturers in Q1 2015 was led by seven transactions each in the home health and hospital care sectors.
• Cross-border transaction activity increased slightly with three transactions in Q1 2015.
Transactions by Buyer Type
Strategic Buyer Financial Buyer
4132
2026 31
17
4
18
7
0
20
40
60
Q1 ‘152011 2012 2013 2014
Num
ber
of D
eals
40
5
2010
Featured Sector Transactions:January 2015 – Thermo Fisher Scientific, Inc. agreed to acquire Advanced Scientifics, Inc for $300 million in cash on January 29, 2015. Advanced Scientifics, which develops single-use systems for the healthcare and life sciences industries, will be integrated into Thermo Fisher’s Life Sciences Solutions segment. “ASI’s intense customer focus has led to the development of innovative solutions that complement our existing single-use technologies and expand our offering across the bioprocessing workflow,” said Marc N. Casper, president and chief executive officer of Thermo Fisher Scientific. “We see this acquisition as a great opportunity to meet customer demand for quality and produc-tivity in bioprocessing, and plan to leverage our global reach to bring these innovative products to a larger customer base.”
February 2015 – Sorin S.p.A., a global medical device company that offers disposable biomedical devices and sys-tems, and Cyberonics Inc., a medical device company with core expertise in neuromodulation, announced their merger plan to create a new global leader in medical technologies with a combined equity value of approximately $2.7 billion. Commenting on the announcement, Andre-Michel Ballester said: “I am delighted to announce this transformational merger between Sorin and Cyberonics, which we expect to create significant value for shareholders. As one company we will be able to leverage our combined strengths, capture new opportunities and create new solu-tions to benefit patients and healthcare professionals alike.”
Source: S&P Capital IQ, PMCF
Source: S&P Capital IQ, PMCF
Q1 2014 Q1 2015Buyer Type
Private Acquirer31.0%
Public Acquirer23.0%
Private Equity46.0%
Source: S&P Capital IQ, PMCF
Int'l - to - Int'l
U.S. - to - Int'l
U.S. - to - U.S.
Int'l - to - U.S.
Total
17
1
16
2
36
33
1
20
4
58
11
0
1
1
13
8
0
10
3
21
Seller-to-Buyer 2013 2014 Q1 ‘15Q1 ‘14
Cross-Border Transaction Trends
Source: S&P Capital IQ, PMCF
Transactions by End Market
Drug Delivery
Home Health
Hospital Care
IVD
Safety/Inf. Control
Surgical
Wound Care
Other
Total
4
5
13
7
8
12
3
6
58
2
3
4
1
7
6
4
9
36
2013End Market 2014
0
4
3
0
1
3
0
2
13
Q1 ‘14
1
7
7
0
2
2
0
2
21
Q1 ‘15
Source: S&P Capital IQ, PMCF

Suite 2700 225 W. Washington Street Chicago, IL 60606-3564
This market overview is not an offer to sell or a solicitation of an offer to buy any security. It is not intended to be directed to investors as a basis for making an investment decision. This market overview does not rate or recommend securities of individual companies, nor does it contain sufficient information upon which to make an investment decision.
P&M Corporate Finance, LLC will seek to provide investment banking and/or other services to one or more of the companies mentioned in this market overview.
P&M Corporate Finance, LLC, and/or the staff who prepared this market update, may own securities of one or more of the companies mentioned in this market overview.
The information provided in this market overview was obtained from sources believed to be reliable, but its accuracy cannot be guaranteed. It is not to be construed as legal, accounting, financial, or investment advice. Information, opinions, and estimates reflect P&M Corporate Finance, LLC’s judgment as of the date of publication and are subject to change without notice. P&M Corporate Finance, LLC undertakes no
obligation to notify any recipient of this market overview of any such change.
The charts and graphs used in this market overview have been compiled by P&M Corporate Finance, LLC solely for illustrative purposes. All charts are as of the date of issuance of this market overview, unless otherwise noted.
This market overview is not directed to, or intended for distribution to, any person in any jurisdiction where such distribution would be contrary to law or regulation, or which would subject P&M Corporate Finance, LLC to licensing or registration requirements in such jurisdiction.
The Diversified Medical Device Index, Orthopedic Medical Device Index, Cardiovascular Medical Device Index, and Diversified Diagnostic Index were developed by PMCF and may not be inclusive of all companies in these industries. They are not intended as composite indexes of these industry sector returns. Index and sector returns are past performance which are not indicators of future results.
www.pmcf.com