Medicaid Audit Overpayments: Challenging...
65
The audio portion of the conference may be accessed via the telephone or by using your computer's speakers. Please refer to the instructions emailed to registrants for additional information. If you have any questions, please contact Customer Service at 1-800-926-7926 ext. 10. Presenting a live 90-minute webinar with interactive Q&A Medicaid Audit Overpayments: Challenging Statistical Sampling and Extrapolation Today’s faculty features: 2pm Eastern | 1pm Central | 12pm Mountain | 11am Pacific WEDNESDAY, MARCH 15, 2017 David R. Ross, Shareholder, O’Connell and Aronowitz, Albany, N.Y. Dr. Patricia L. Maykuth, Ph.D, President, Research Design Associates, Decatur, Ga.
Transcript of Medicaid Audit Overpayments: Challenging...

The audio portion of the conference may be accessed via the telephone or by using your computer's
speakers. Please refer to the instructions emailed to registrants for additional information. If you
have any questions, please contact Customer Service at 1-800-926-7926 ext. 10.
Presenting a live 90-minute webinar with interactive Q&A
Medicaid Audit Overpayments: Challenging
Statistical Sampling and Extrapolation
Today’s faculty features:
2pm Eastern | 1pm Central | 12pm Mountain | 11am Pacific
WEDNESDAY, MARCH 15, 2017
David R. Ross, Shareholder, O’Connell and Aronowitz, Albany, N.Y.
Dr. Patricia L. Maykuth, Ph.D, President, Research Design Associates, Decatur, Ga.
Tips for Optimal Quality
Sound Quality
If you are listening via your computer speakers, please note that the quality
of your sound will vary depending on the speed and quality of your internet
connection.
If the sound quality is not satisfactory, you may listen via the phone: dial
1-866-927-5568 and enter your PIN when prompted. Otherwise, please
send us a chat or e-mail [email protected] immediately so we can
address the problem.
If you dialed in and have any difficulties during the call, press *0 for assistance.
Viewing Quality
To maximize your screen, press the F11 key on your keyboard. To exit full screen,
press the F11 key again.
FOR LIVE EVENT ONLY
Continuing Education Credits
In order for us to process your continuing education credit, you must confirm your
participation in this webinar by completing and submitting the Attendance
Affirmation/Evaluation after the webinar.
A link to the Attendance Affirmation/Evaluation will be in the thank you email
that you will receive immediately following the program.
For additional information about continuing education, call us at 1-800-926-7926
ext. 35.
FOR LIVE EVENT ONLY

Program Materials
If you have not printed the conference materials for this program, please
complete the following steps:
• Click on the ^ symbol next to “Conference Materials” in the middle of the left-
hand column on your screen.
• Click on the tab labeled “Handouts” that appears, and there you will see a
PDF of the slides for today's program.
• Double click on the PDF and a separate page will open.
• Print the slides by clicking on the printer icon.
FOR LIVE EVENT ONLY
MEDICAID OVERPAYMENTS: Challenging State Audit Allegations of Overpayment and the Use of Statistical Sampling and Extrapolation
P r e s e n t e d b y : P a t M a y k u t h , P h . D . , P r e s i d e n t , R e s e a r c h D e s i g n A s s o c i a t e s , I n c . D a v i d R . R o s s , E s q . , S h a r e h o l d e r, O ’ C o n n e l l & A r o n o w i t z , P. C .
M a r c h 1 5 , 2 0 1 7 2 : 0 0 p . m . t o 3 : 3 0 p . m .

Introduction and A Primer on the Legal Issues In Statistical Sampling and Extrapolation
PART 1 OF THE PRESENTATION
6

What is Sampling? Sampling is taking a subset of the claims in a Medicaid provider’s universe of claims for the purpose of auditing them.
How is the sample of claims chosen? Usually via computer software.
The sample must be randomly selected to be valid.
7

What is Extrapolation?
Extrapolation takes the results of an audited sample of claims and projects the dollar amount of the overpayment from the sample over the universe of paid claims.
The audited sample has a known amount of dollars in error so that amount is projected to the universe for a global repayment amount.
8
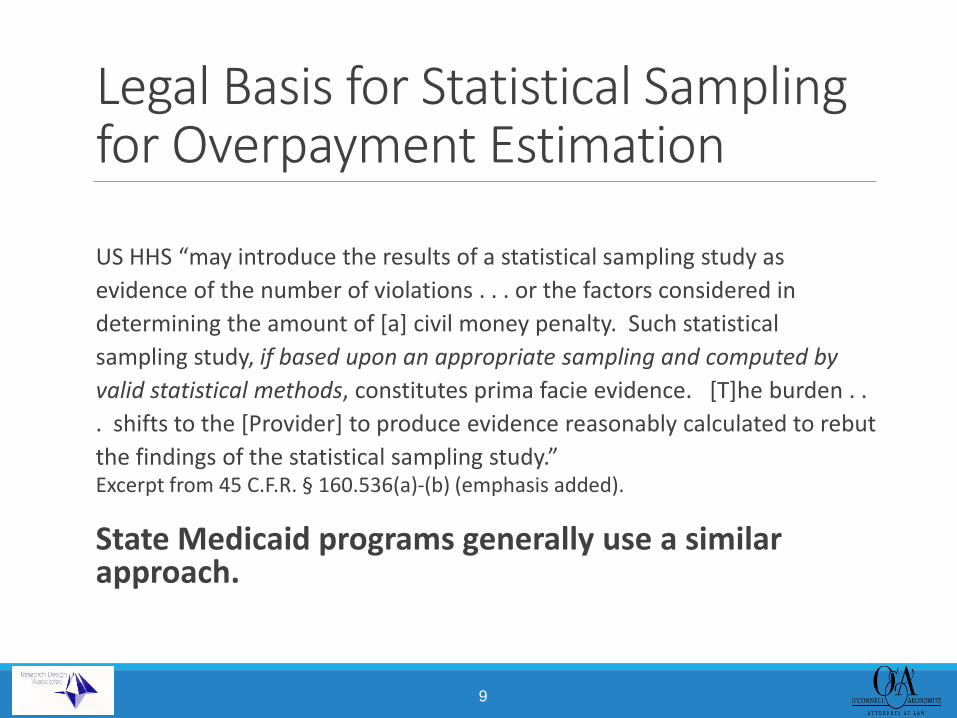
Legal Basis for Statistical Sampling for Overpayment Estimation
US HHS “may introduce the results of a statistical sampling study as
evidence of the number of violations . . . or the factors considered in
determining the amount of [a] civil money penalty. Such statistical
sampling study, if based upon an appropriate sampling and computed by
valid statistical methods, constitutes prima facie evidence. [T]he burden . .
. shifts to the [Provider] to produce evidence reasonably calculated to rebut
the findings of the statistical sampling study.” Excerpt from 45 C.F.R. § 160.536(a)-(b) (emphasis added).
State Medicaid programs generally use a similar approach.
9

Individual States and Statistical Sampling
Unlike Medicare, Medicaid has no universal guidance outlining the rules of the process to be used.
Your state may have simple or detailed rules, or no rules at all. ◦ Texas follows the MPIM and uses RAT-STATS.
◦ California and Florida use “generally accepted statistical standards.”
◦ New York has no rules at all.
The burden of proof is on the Provider to challenge the statistical sampling and extrapolation. ◦ The State’s methodology is presumed valid unless and until the
Provider proves otherwise.
10

What Are the Legal and Scientific Issues Pertaining to Sampling and Extrapolation?
Understanding what those complex issues are is not easy
Do I need an expert? (Hint: you absolutely do) ◦ Lawyers are not enough (and that’s coming from a lawyer)
11

The Role of the Expert: Why You Should Always Have One
A statistical consultant is essential to understanding how the audit was conducted and whether the results are statistically valid. ◦ Laypersons generally cannot understand these concepts absent
training.
The expert will review both the process actually used and the results in your case.
An expert is the only person who will be able to properly answer important questions pertaining to the audit.
12
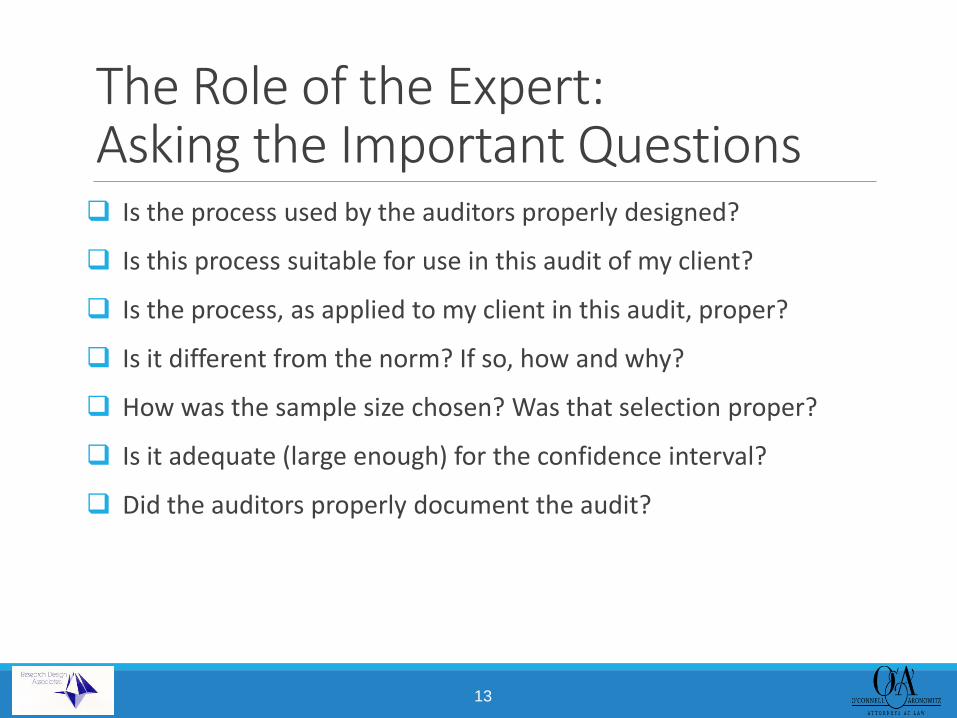
The Role of the Expert: Asking the Important Questions Is the process used by the auditors properly designed?
Is this process suitable for use in this audit of my client?
Is the process, as applied to my client in this audit, proper?
Is it different from the norm? If so, how and why?
How was the sample size chosen? Was that selection proper?
Is it adequate (large enough) for the confidence interval?
Did the auditors properly document the audit?
13

The Role of the Expert: Asking More of the Important Questions Is the software program used for random number generation
certified or widely accepted for this purpose?
Was adequate documentation for replication provided?
Was the software program used working as it was designed? ◦ When in doubt have an expert look at the source code
◦ Can’t get the source code? Argue violation of due process
14

The Role of the Expert: Asking Even More of the Important Questions How were the random numbers selected? Were they generated
by a valid method? ◦ Did the auditors perform appropriate tests for randomness on these
numbers?
Can the results be replicated by the provider? ◦ If not, there is a serious problem.
◦ Retaining the seed is a very important factor.
◦ Is the frame sorted as it was at the time the random numbers were used to pick the sample?
What about the extrapolation calculations themselves?
15

Right Idea, Wrong Answer
16

Dewey Wins the Election!!
Pollsters surveyed via telephone
17

There Are Three Kinds of Lies: Lies, Damned Lies, and Statistics
So which is it? The outcome of any statistical study is determined by that characteristic that is sampled
Why were so many polls in the past presidential election saying contradictory things?
◦ bias
◦ corrupted frame
◦ probability of selection unknown
◦ polling done for advocacy not to answer the question
◦ sampling error
◦ response bias
18
Ultimately, It Comes Down to Two Basic Questions
1. What is the ‘it’ that is being measured by the study?
2. Is the ‘it’ being measured correctly?
19

Human Baby Due Date Average human gestation period is 280 days (9.33 months or 40 weeks)
A 90% confidence level predicts the due date will be between 273 days and 280 days. o Assumptions : sample size 20, average 280 days, lower confidence level 273 days, upper
confidence level 287 days
o No calculable confidence level for 1 person
Complication error: ◦ Only 40% of women give birth on this due day
◦ Accuracy error of 60%
◦ Do not know the distribution
◦ not normal
◦ Do not know the conception date
◦ Measurement error
How believable is it to use this estimate for the birth date of one person?
How useful is it to a person who wants to know what day the baby is going to be born?
20

Right Idea, Wrong Answer Dewey wins election (not!) – they surveyed only people with telephones
Human baby due date example
In 1939, the US government predicted we would be out of domestic oil in 13 years
It was also predicted that the US space program would have 9-10% catastrophic failure rate
Why do these statistical studies fail us?
ANSWER: they are not correctly designed for the question being asked
Your client’s Medicaid audit may also be incorrectly designed
21

A Primer on Sampling and Extrapolation
PART 2 OF THE PRESENTATION
22

What is Statistics? Statistics is a branch of mathematics dealing with:
◦ the collection,
◦ analysis,
◦ interpretation, and
◦ presentation of masses of quantitative data.
23

Terms Universe – dollar amount of claims paid to a Provider in a specific timeframe
Sampling Frame – subset of the universe defined as variables of interest from which the sample will be randomly selected and over which the sample will be extrapolated
Sample – a randomly selected subset of a sampling frame to be audited for overpayments
Unit of Analysis (Sampling Unit) – what is measured in the audit: claim line, claim, beneficiary, provider (must be invariant throughout the audit)
(Please see the List of Terms provided with presentation)
24
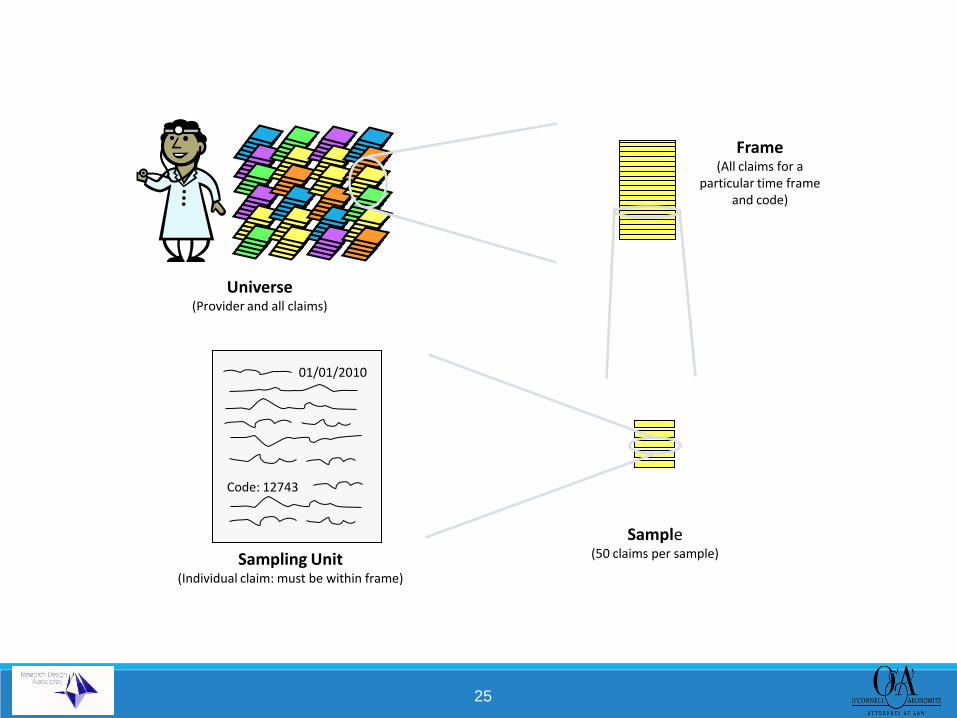
Universe (Provider and all claims)
Frame (All claims for a
particular time frame and code)
Sample (50 claims per sample)
01/01/2010
Code: 12743
Sampling Unit (Individual claim: must be within frame)
25

Corrupted Frame = Bad Sample
Fra Sampling Frame
Universe
Outside Definition
SAMPLE
26

Characteristics of a Valid Medicaid Overpayment Study
27

universe frame
Inferential Statistics Method: following rules required
Sample definition
Simple
Select seed & random number
table
Applied to file that is unbiased
Calculate sample
size
Select probability
sample
Independent observations Randomly selected Normally distributed Representative
Stratified
Audit claims in the field
Prior history of
overpayment error
Define the who, what, time and how overpayment is measured
28

What is a Statistically Valid Random Sample?
For the purpose of today’s discussion, a Statistically Valid Random Sample (SVRS) from a universe of paid Medicaid claims guards against cherry picking or any bias by the auditor and has to:
◦ meet the requirements the methodology – especially assumptions about distribution;
◦ meet chosen sampling error;
◦ be of sufficient size to accurately measure the variable;
◦ be random; and
◦ be representative (without bias).
29

Medicare and Statistical Sampling
Medicare Program Integrity Manual (MPIM) Chapter 81, provides
nineteen pages of guidance “to provide instructions for [auditors] for the use of statistical sampling in their reviews to calculate and project (i.e., extrapolate) overpayment amounts to be recovered.”
1 https://www.cms.gov/Regulations-and-Guidance/Guidance/Manuals/Downloads/pim83c08.pdf
30

Valid Outcomes Require Proper Execution Defined universe and produce
Defined frame and produce
Defined sampling units in a meaningful way for the analysis (the “it”)
Use proper randomization for independence
Accurately measure overpayments ◦ meet the method assumptions
◦ use the correct formulas for estimation
◦ correctly calculate the math
◦ test key assumptions for randomness, independence, normality & representativeness
Accurately report actual findings – tell the truth
31
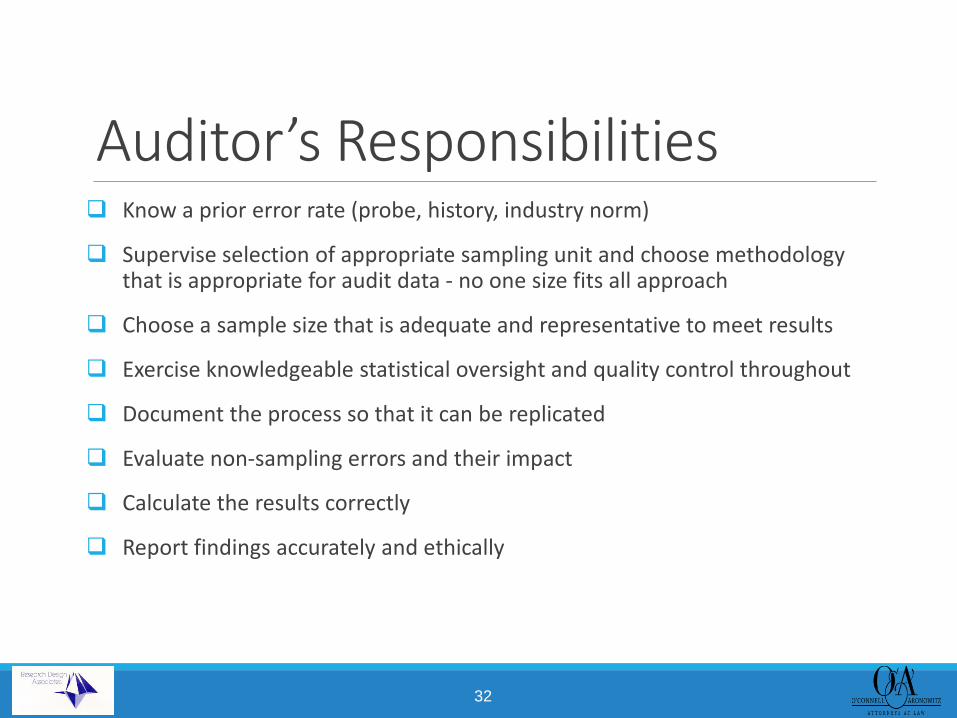
Auditor’s Responsibilities Know a prior error rate (probe, history, industry norm)
Supervise selection of appropriate sampling unit and choose methodology that is appropriate for audit data - no one size fits all approach
Choose a sample size that is adequate and representative to meet results
Exercise knowledgeable statistical oversight and quality control throughout
Document the process so that it can be replicated
Evaluate non-sampling errors and their impact
Calculate the results correctly
Report findings accurately and ethically
32
Audit Design Must Meet Common Sense Test
The believably (acceptability, trustworthiness or merit) of the result has to be made by judgement. The mechanics of calculation of a probability statistic will be valid, but only meaningful if properly executed.
If the auditor lacks in-depth understanding of the medical or billing data distribution; or
If a sample is not random, representative or large enough; or
If the criteria of the probability distribution are not met,
Then you should question the validity of the statistical calculations.
Probability math does not change. In order to avoid silly mistakes, the study design has to make sense and then the methodology has to be properly executed.
33

The Data Must Be… The most common yardstick distribution is the normal (bell shaped) distribution. It includes point estimates and confidence levels commonly used in Medicaid and Medicare audits and voluntary repayments.
These parametric statistics require that the data are:
Independent observations;
Normally distributed;
Random; and
Representative.
34

Statistically Valid Random Sample
35

The Concept of ‘Random’ Comes into play twice in the execution of an audit:
Random and representative sample Tests show the chosen sample is both
Compare mean of the sample to the frame to estimate overpayment.
If the sample mean is different from what would be expected by chance alone then that difference is not random, and the result is the calculated overpayment outcome
36

Random Sample Must be able to replicate and test the sample.
Need: The seed used
The identical computer program
The identical input • Frame size
• Sample size
• Spares
Test to assure both randomness and appearance of randomness
Test for representativeness
37

38

Sample Size Determination Based on Chosen Precision and Confidence
39
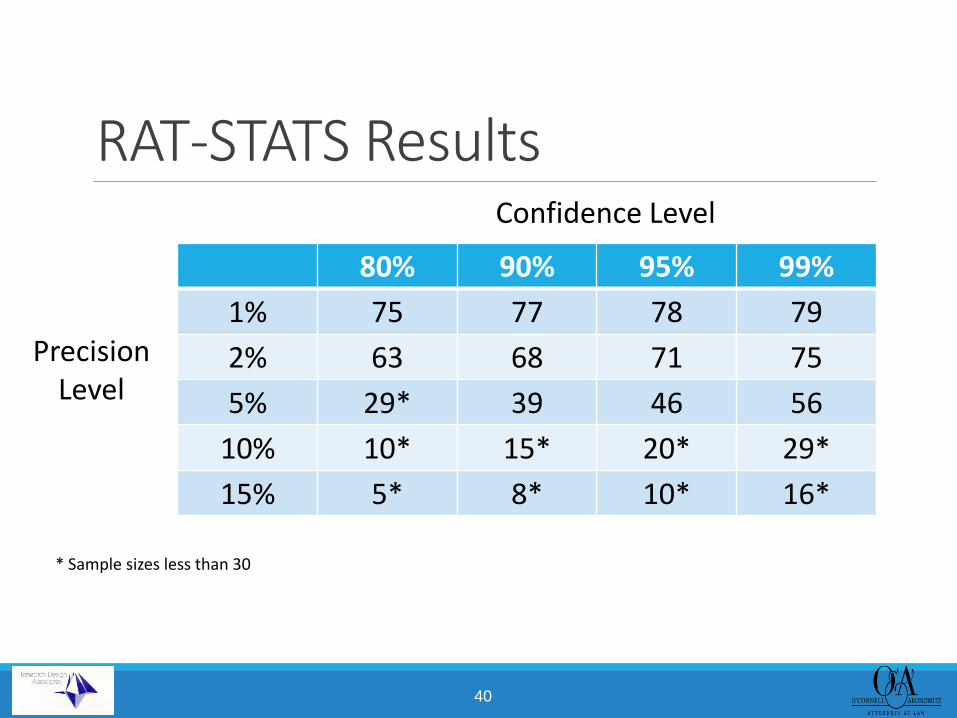
RAT-STATS Results
80% 90% 95% 99%
1% 75 77 78 79
2% 63 68 71 75
5% 29* 39 46 56
10% 10* 15* 20* 29*
15% 5* 8* 10* 16*
Confidence Level
Precision Level
* Sample sizes less than 30
40

Representative Samples A small yet complete and accurate picture of the data in the frame.
A subset of a statistical universe that accurately reflects the numerical membership of the entire universe and its distribution.
A representative sample is an unbiased indication of what the frame is like.
Representativeness is tested mathematically. When a sample is not representative, the result is known as a sampling error.
41

Representative Sample
Frame
Sample
42

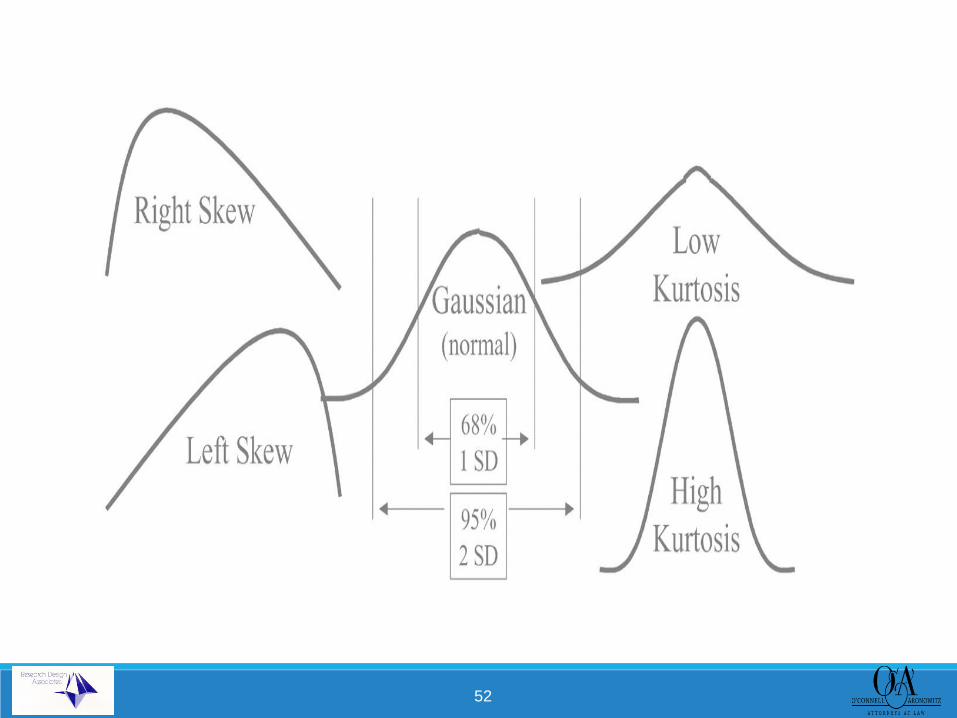
Distributions: the Measurement Yardstick
43

Probability Yardstick The single sample chosen for the audit is only one sample (of the chosen size) out of a very large number of samples of that size which could have been chosen from the frame.
The sampling distribution of all possible means provides a mathematical model of what is likely to occur if all of the possible samples in the frame were analyzed.
If a large number of samples were drawn from the frame ◦ A mean can be calculated for each sample.
◦ Each sample mean would not be exactly the same value as most of the others. Rather sample means would differ from one to another and from the true mean of the frame.
◦ The means would be different from one another however they would cluster around the central value (or mean) of the frame.
◦ There will be more scores in the middle of the distribution than at the ends.
◦ The differences in the means of different samples are the basis of the error that occurs inferring from a sample to the frame rather than measuring all of the claims in the frame.
◦ If repeated random samples (moving toward infinity) were made, their means would be expected to fall into a normal distribution.
44

45
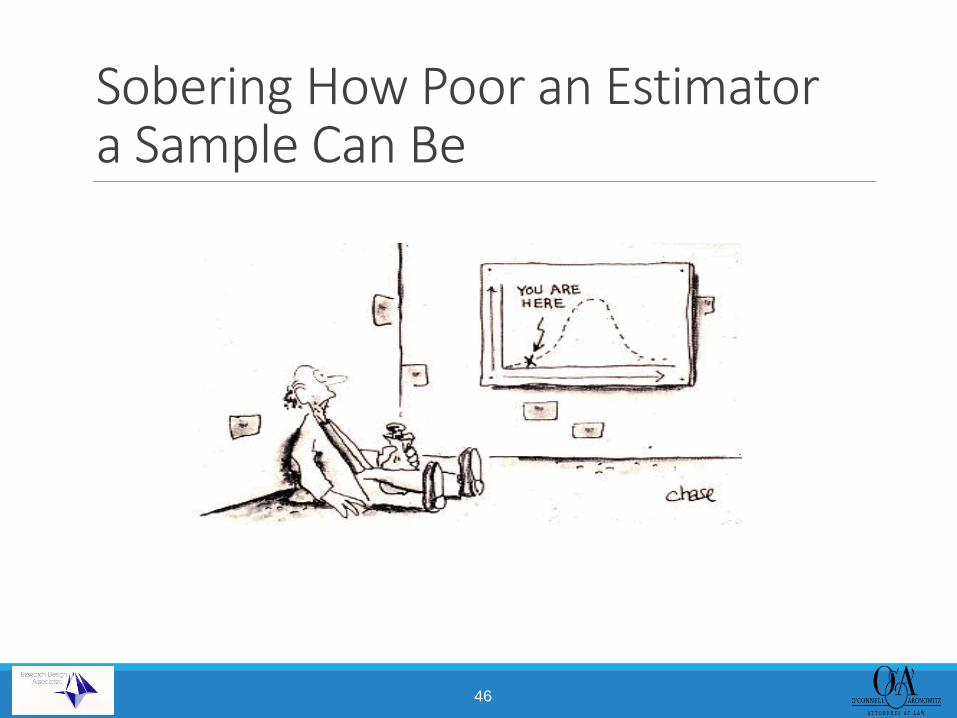
Sobering How Poor an Estimator a Sample Can Be
46

Amount Paid is a Proxy for Overpayment Sample selected from amount paid to provider.
Sample analyzed using overpayment data.
Never know up front what the overpayment amount is going to be unless ◦ there is a known history of overpayment dollar amount; OR
◦ conduct a probe audit.
Overpayment amounts must meet criteria for using parametric statistics or the confidence levels are destroyed.
If overpayments are not correlated with amount paid the analysis cannot proceed.
47

What’s the Big Deal About the Normal Distribution?
In probability theory, the normal (or bell-shaped) distribution is a continuous probability distribution (a function that tells the probability of a number in some context falling between any two real numbers). The normal distribution is symmetric around the mean. The mean, median and mode are the same number.
The normal distribution is immensely useful because of the Central Limit Theorem which states that the mean of many random variables independently drawn from the same frame is distributed approximately normally, irrespective of the form of the original distribution. That is, the overpayment means will be randomly distributed if the sample is large ... moving toward infinity.
48

Normal Distribution
49

Normal Distribution Yardstick It is the common yardstick of the continuous distribution (dollars)
If the mean of the sample is random then expected confidence levels can be established by probability math.
The audited sample must be tested and demonstrated to be random and representative
The sample mean overpayment is compared to the theoretical distribution yardstick based on how the data would array if they were random
If the overpayment mean is different from what would be expected by chance alone, then that difference is not random; rather it is an overpayment effect.
50

Lower Confidence Level
Upper Confidence Level
Point Estimate
51
52

Mode
Mean
Median
0 12,072.62 566.09 1,274.35
Where is the Confidence Level? One-sided or Two
Illustration, not based on actual data
53
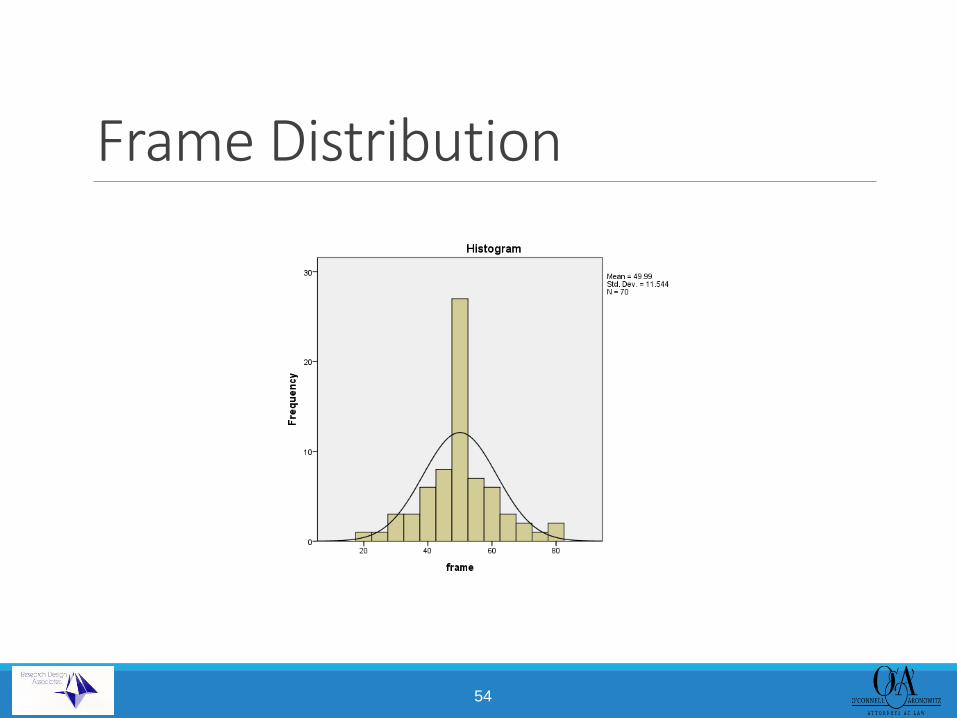
Frame Distribution
54

55

Sample Frequency in Dollars N 15
Mean 430.93
Median 112.00
Mode 120
Std. Deviation 525.519
Variance 76,170.210
Skewness 0.816
Kurtosis 0.580
Minimum 10
Maximum 1,300
Sum 6,464
56

Non Normal Sample Mean and Standard Deviation
Sample mean +/- 1 standard deviation
Mean = $430.92 + 525.510 = 956.43
430.92 - 525.510 = -94.18
57
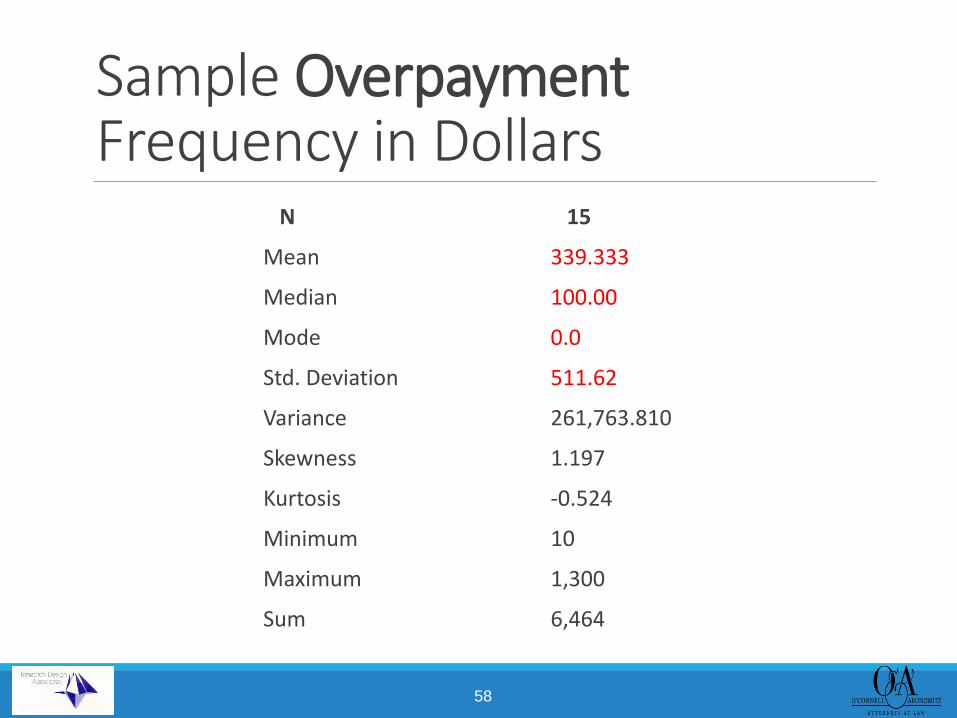
Sample Overpayment Frequency in Dollars
N 15
Mean 339.333
Median 100.00
Mode 0.0
Std. Deviation 511.62
Variance 261,763.810
Skewness 1.197
Kurtosis -0.524
Minimum 10
Maximum 1,300
Sum 6,464
58
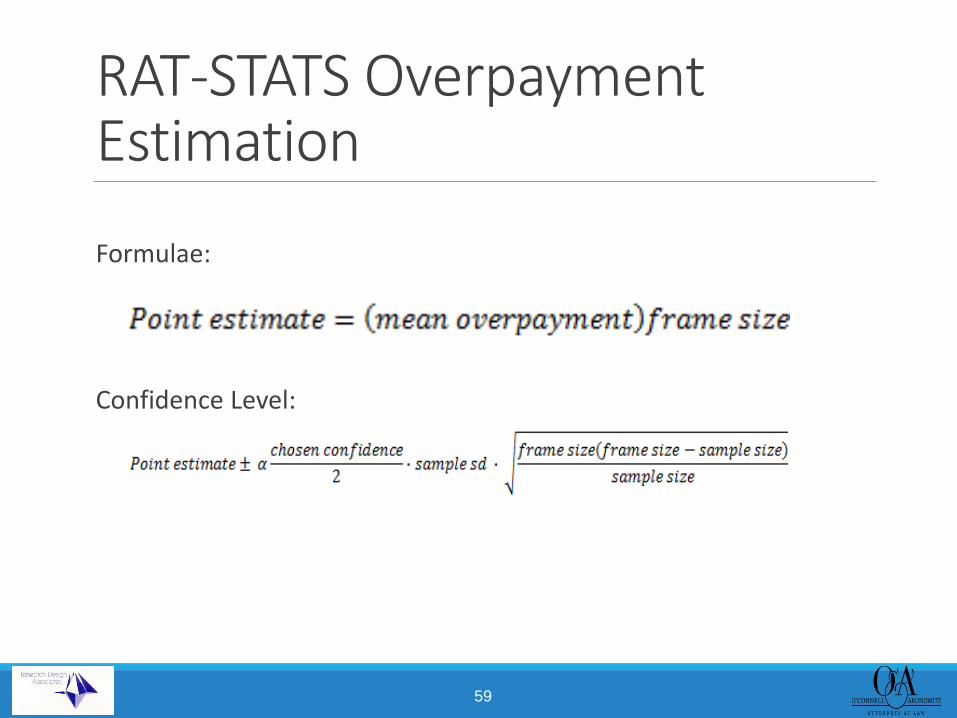
RAT-STATS Overpayment Estimation
Formulae:
Confidence Level:
59
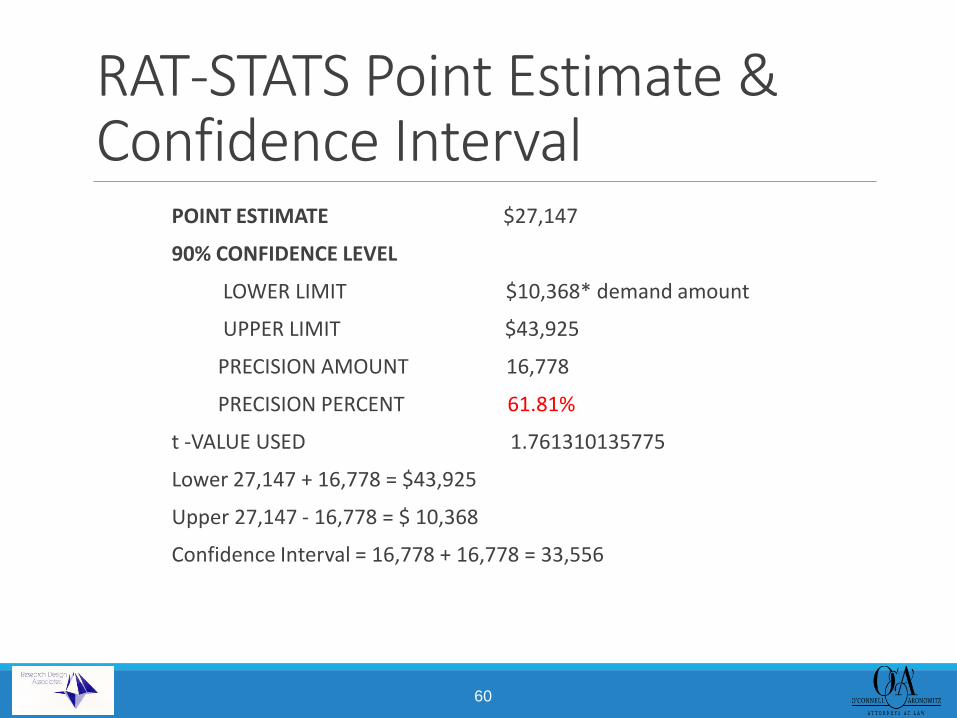
RAT-STATS Point Estimate & Confidence Interval
POINT ESTIMATE $27,147
90% CONFIDENCE LEVEL
LOWER LIMIT $10,368* demand amount
UPPER LIMIT $43,925
PRECISION AMOUNT 16,778
PRECISION PERCENT 61.81%
t -VALUE USED 1.761310135775
Lower 27,147 + 16,778 = $43,925
Upper 27,147 - 16,778 = $ 10,368
Confidence Interval = 16,778 + 16,778 = 33,556
60

Confidence Levels Non Normal Data
Point Estimate +/- ½ Confidence Interval
Confidence Interval: 16,778 + 16,778 = 33,556
Lower 27,147 + 16,778 = $ 43,925
Upper 27,147 - 16,778 = $ 10,368
Lower confidence Level ??? Unknowable
61

Poor Questions Lead to Poor Answers
Even well designed probability statistics cannot answer the questions consumers seek.
Can’t predict who is going to be president
Can’t tell what day your baby will be born
Cant tell the overpayment dollar amount for a provider
They can tell you how likely the mean of the sample is to represent the true mean of the frame from which it was chosen. No more no less.
A badly executed sample can not even tell that. They are simply an exercise in arithmetic, not a probability sample.
62

Poor Audit Design & Execution Produce Only Invalid Results
Statistics in the hands of an inept auditor are like a lamppost to a drunk: they are
used more for support than illumination.
63
Questions?
64

Faculty David R. Ross, Esq. Shareholder E-mail: [email protected] (518) 462 5601 O’Connell and Aronowitz, P.C. 54 State Street Albany, NY 12207 Website: www.oalaw.com
Pat Maykuth, Ph.D. President E-mail: [email protected]
(404) 373 4637 Research Design Associates, Inc. 721 E Ponce de Leon Decatur, GA 30030 www.researchdesignassociates.com
65