Mechanization Trends in Underground Mines of CIL & Future Strategies Asoke Kr Paul CMD, BCCL 28 th...
44
Mechanization Trends in Underground Mines of CIL & Future Strategies Asoke Kr Paul CMD, BCCL 28 th Jan, 2008
-
Upload
griffin-philip-chapman -
Category
Documents
-
view
215 -
download
1
Transcript of Mechanization Trends in Underground Mines of CIL & Future Strategies Asoke Kr Paul CMD, BCCL 28 th...

Mechanization Trends in Underground Mines of CIL
& Future Strategies
Asoke Kr Paul
CMD, BCCL
28th Jan, 2008

Index
Sl No. Particulars Slide No
1. Indian economy-Present scenario 4 - 7
2. Demand vis-à-vis Availability of Coal
9-11
3. Status of coal mining in India 13-17
4. Coal reserve & characteristics 19 – 22
5. Recent trends of UG mechanization
24 - 29
6. CIL- Production Programme (UG) 31 - 33
7. Technological options & Future Strategies
35 - 43

Indian Economy & Present Scenario

4
Indian Economy - Present Scenario
• Indian economy- GDP growth of +8%, poised to achieve 9% or more
• One of the fastest growing economies of the world• Per capita consumption of energy continues to be
lower (0.325 mtoe) against World average (1.553 mtoe). Projected per capita consumption in India is 0.450 mtoe by 2010.
• Projected demand of coal in India would rise to 1079 Mill T by 2021-22, 1267 Mill T by 2025 from the current level of 430 Mill T (considering 8% GDP growth).
Contd…

5
• Coal provides 24% of global primary energy need, whereas in India, it has a share of 54%.
• Coal generates 40% of world’s electricity, whereas in India, it has a share of 65%.
• With population of over one billion, India constitutes 15% of world population, whereas India’s share of global energy consumption is only 3%.
Contd…
6
• Electricity generation
World India• Coal 40.1% 65.7%
• Natural Gas 19.4% 9.8%
• Hydro 15.9% 16.4%
• Nuclear 15.8% 2.8%
• Oil 6.9% 0.4%
• Other 1.9% 4.9% (Incl.3.3% of Lignite)
Total 100 % 100%
Contd…
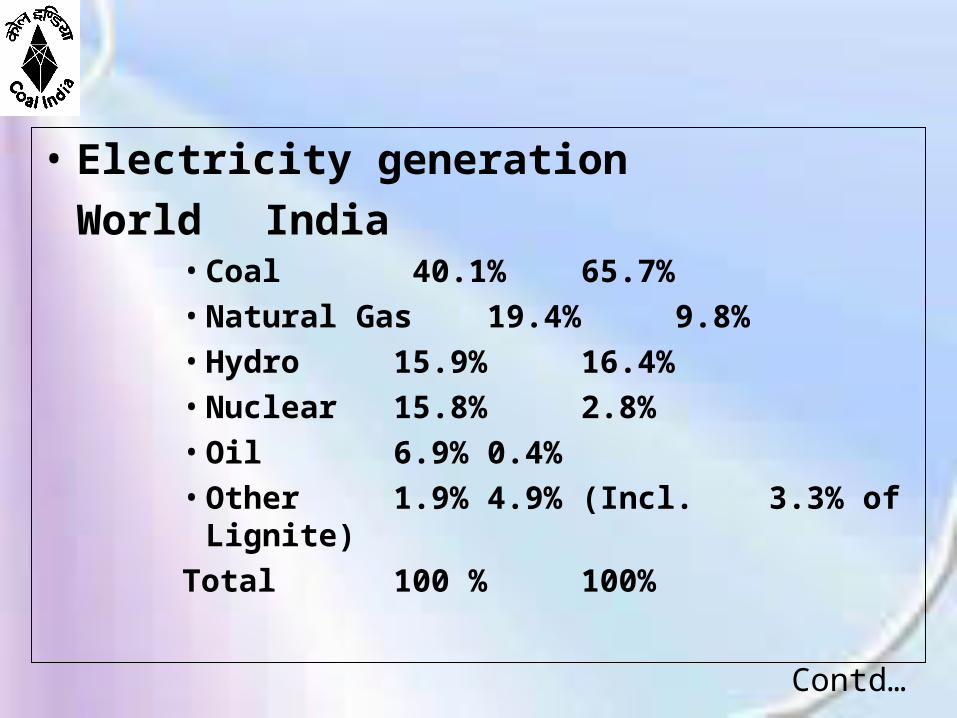
• Generated 662.5 billion units of power in 06-07, of which 431.1 billion units i.e 65% was coal based generation
• Our electricity generation capacity stands at 1,28,000 MW (06-07), planned to grow to 2,33,000 MW by 2012
• Most of this increase is projected from coal based generation only.
• Steel majors to generate 30-32 Mill Te (additional) by 2011-12 from the present level of approx 40 Mill Te.
• COAL WILL REMAIN THE MAINSTAY OF POWER GENERATION FOR NEXT 50 YEARS.

Demand vis-à-vis Availability of Coal

DEMAND OF COAL(with 8% GDP)
YEAR AS PER INTEGRATED
ENERGY POLICY
AS PER COAL VISION 2025
2006-07 502 473
2011-12 691 629
2016-17 915 828
2021-22 1270 1079
2026-27 1723 1267
2031-32 2343
Fig in Mill T

PRODUCTION PLAN
YEAR AS PER INTEGRATED
ENERGY POLICY
AS PER COAL
VISION 2025
CIL’s Plan
2006-07 439 429 373
2011-12 536 621 536
2016-17 634 773 653
2021-22 829 927 755
2026-27 1073 1061 839 (2025-
26)
2031-32 1517 -
Fig in Mill T

• OUT OF THE PROJECTED DEMAND OF AROUND 1.1 Bill T BY 2022, THE OPENCAST POTENTIAL HAS BEEN ESTIMATED AS 900 Mill T. THE BALANCE MUST COME FROM UNDERGROUND MINES.
• THEREFORE, FOCUS NEED TO BE GIVEN ON UG MECHANIZATION WHICH WOULD HELP IN
– Containing Cost of production
– Conservation, by way of better extraction of deeper seams
– Improving safety standards

PRESENT STATUS OF COAL MINING

Status of Coal Mining in India
• Produced about 431 Mill T of coal in 06-07• Consumed about 464 Mill T • Imported approx 22 Mill T of coking & 23 Mill T of
non-coking coal. Import constitutes roughly 10% of total consumption
• Small quantity of 2.0 Mill T exported • Share of production : CIL - 83.7%; SCCL – 8.8%;
Others – 7.5%.• Captive coal blocks to contribute approx 24 Mill T
in 07-08 against 17.5 Mill T produced in 06-07.

Coal Production Scenario in India
• Coal mining started in 1774
1947 - 30 Mill T
1977-78 - 100 MT
1989-90 - 200 MT
1999-2K - 300 MT
2006-07 - 431 MT
• CIL Production (Mill T)OC UG Total
1974-75 20.77 58.22 78.99
(26.3%) (73.7%)
2005-06 297.55 45.82 343.37
(86.7%) (13.3%)
• Production Projection
in 2025 715 124 839
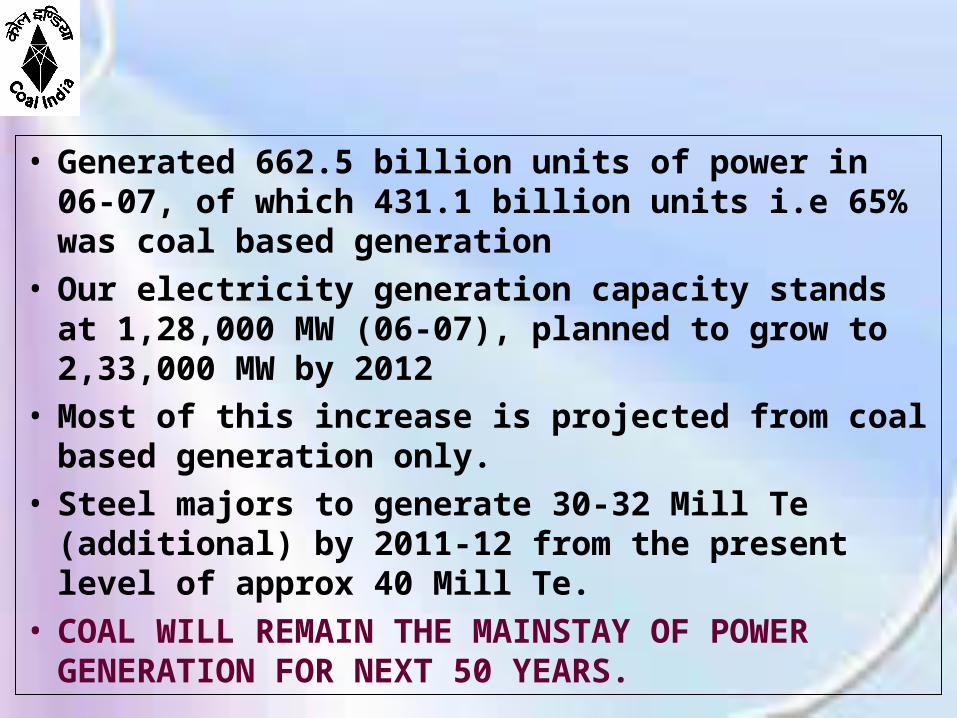
Status of Coal Mining in India - Production trend/Projection
COMPANY
ACTUAL PROJECTION
IX PLAN
(01-02)
X PLAN (06-07)
BE
07-08
XI PLAN
(11-12)
XII PLAN (16-17)
CIL 279.65 360.91 384.51 520.50 664.00
S.C.C.LTD 30.81 37.71 38.04 40.80 45.00
OTHERS 17.33 32.21 37.95 119.70 346.00
TOTAL 327.79 430.83 460.50 680.00 1055.00
CAGR (%) 2.53 5.62 - 9.57 9.18
GROWTH
X OVER IX PLAN - XI OVER X PLAN
29% 44% (HIGHEST SO FAR)
Fig in Mill T

69.9690.05
130.81
178.6
250.62279.65
360.91
0
50
100
150
200
250
300
350
400
450
500
Plan period
Mill
T
COAL INDIA 69.96 90.05 130.81 178.6 250.62 279.65 360.91
CAGR 5.2% 6.4% 6.4% 5.0% 2.2% 5.4%
66-74 (IV) 74-79 (V) 79-85 (VI) 85-90 (VII) 90-97 (VIII) 97-02 (IX) 02-07 (X)
PLANWISE PRODUCTION AND GROWTH
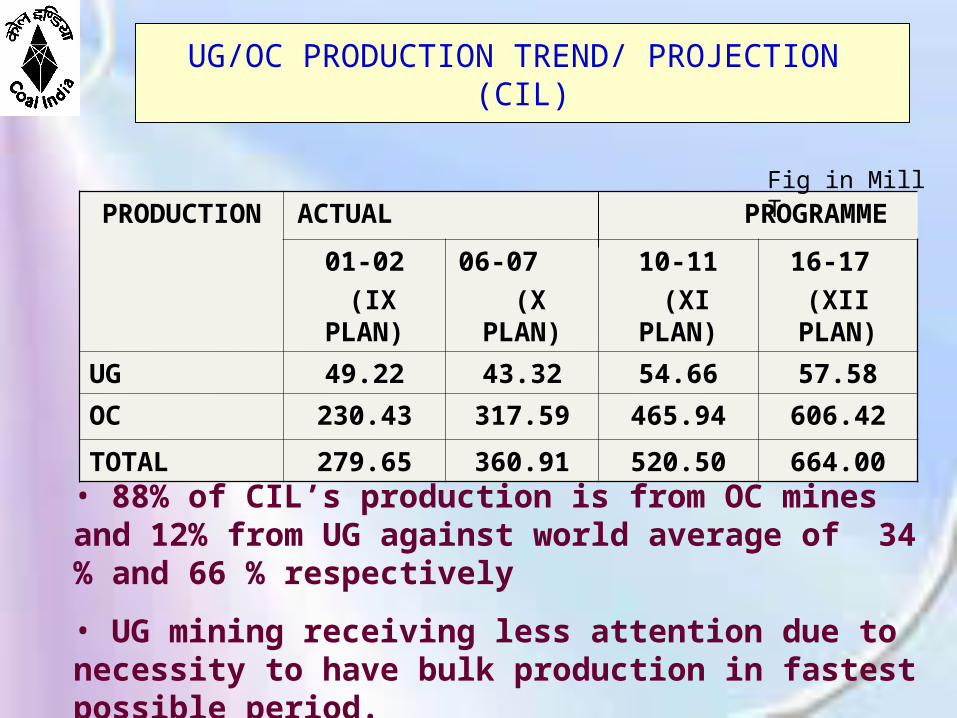
UG/OC PRODUCTION TREND/ PROJECTION (CIL)
PRODUCTION ACTUAL PROGRAMME
01-02
(IX PLAN)
06-07
(X PLAN)
10-11
(XI PLAN)
16-17
(XII PLAN)
UG 49.22 43.32 54.66 57.58
OC 230.43 317.59 465.94 606.42
TOTAL 279.65 360.91 520.50 664.00
Fig in Mill T
• 88% of CIL’s production is from OC mines and 12% from UG against world average of 34 % and 66 % respectively
• UG mining receiving less attention due to necessity to have bulk production in fastest possible period.

COAL RESERVE
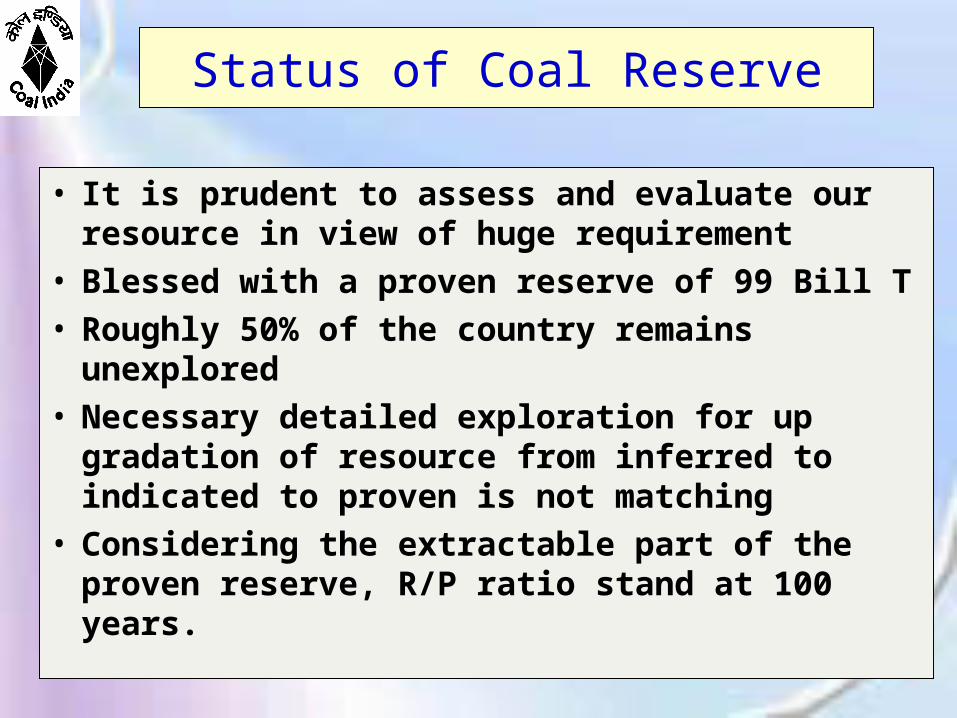
Status of Coal Reserve
• It is prudent to assess and evaluate our resource in view of huge requirement
• Blessed with a proven reserve of 99 Bill T • Roughly 50% of the country remains unexplored• Necessary detailed exploration for up gradation of
resource from inferred to indicated to proven is not matching
• Considering the extractable part of the proven reserve, R/P ratio stand at 100 years.

Depth (M) Proved Indicated Inferred Total %
0-300 76.7 65.6 14.3 156.6 60.8
300-600 7.0 42.6 18.0 67.6 26.3
0-600 (Jharia) 13.7 0.5 - 14.2 5.5
600-1200 1.7 11.5 5.8 19.0 7.4
Total 99.1 120.2 38.1 257.4 100
% 38.5 46.7 14.8 100 -
Fig. in Bill T
GEOLOGICAL RESOURCES OF INDIAN COAL (AS ON 01.01.2007)

COAL RESERVES IN INDIA(AS ON 01.01.2007) **
TYPE OF COAL PROVED INDICATED INFERRED TOTAL
COKING 16.95 13.30 2.10 32.35
NON-COKING 81.64 106.77 35.67 224.08
TOTAL 99.06 120.18 38.14 257.38
WORLD COAL RESERVE*
909
(Fig in Bill T)
* BP Statistics Review of World Energy 2005; ** GSI

Characteristics of Indian Coal deposits
• Limited reserves of Coking coal (32 Bill T)• High ash and low calorific values ( 40% & above;
Avg 4000 Kcal/Kg – UHV)• Mismatch in location of deposits and major
consumption centres• High cost of transport

Recent Trends ofUG Mechanization

Analysis of UG mechanization in CIL
• 305 UG mines in CIL contributing 43 Mill T
96 mines (31%) are already mechanized 131 mines (43%) have exclusively manual workingsRest 78 mines constituting 26% employ both manual
& mechanized workingsOut of the total 209 (131+78) mines, 110 mines have
been found as feasible for mechanization

Equipment fleet in UG Mines of CIL
Equipment
M/C on roll as on Annual Prodn (LT)
Mar’07 Mar’06 Mar’07 Mar’06
SDL 816 829 202.18 209.90
LHD 244 217 99.88 88.84
R/Header 10 13 1.57 1.89
PSLW 7 8 5.39 8.93
Conv/Mech 1 1 0.32 0.70
Cont. Miner 2 1 6.19 7.09
Tot Mech 315.52 317.35
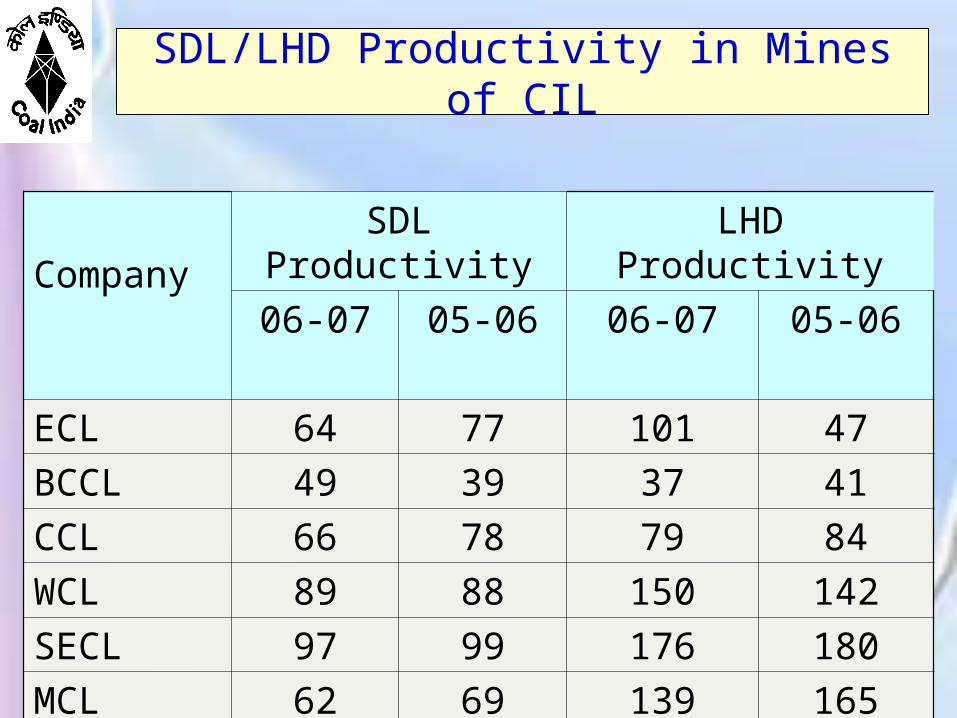
SDL/LHD Productivity in Mines of CIL
Company
SDL Productivity LHD Productivity
06-07 05-06 06-07 05-06
ECL 64 77 101 47
BCCL 49 39 37 41
CCL 66 78 79 84
WCL 89 88 150 142
SECL 97 99 176 180
MCL 62 69 139 165
CIL 82 84 142 136
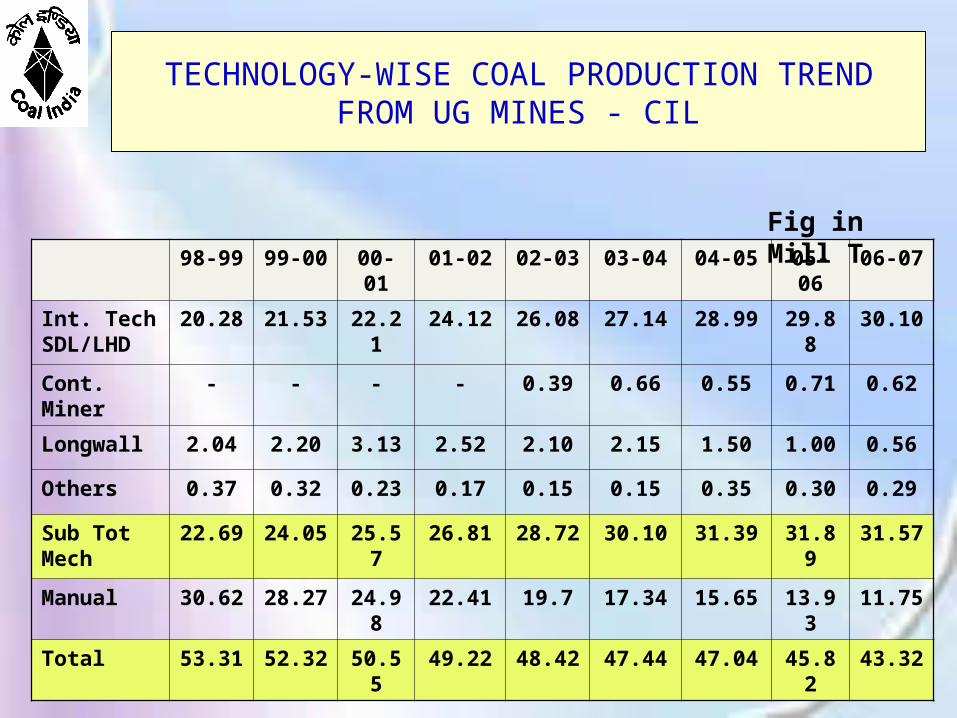
TECHNOLOGY-WISE COAL PRODUCTION TREND FROM UG MINES - CIL
98-99 99-00 00-01 01-02 02-03 03-04 04-05 05-06 06-07
Int. Tech SDL/LHD
20.28 21.53 22.21 24.12 26.08 27.14 28.99 29.88 30.10
Cont. Miner - - - - 0.39 0.66 0.55 0.71 0.62
Longwall 2.04 2.20 3.13 2.52 2.10 2.15 1.50 1.00 0.56
Others 0.37 0.32 0.23 0.17 0.15 0.15 0.35 0.30 0.29
Sub Tot Mech
22.69 24.05 25.57 26.81 28.72 30.10 31.39 31.89 31.57
Manual 30.62 28.27 24.98 22.41 19.7 17.34 15.65 13.93 11.75
Total 53.31 52.32 50.55 49.22 48.42 47.44 47.04 45.82 43.32
Fig in Mill T

Global L/W Mining Performances
Country No. of faces
Best Prodn (mtpa)
Avg Prodn (mtpa)
USA 49 7.2 4.3
CHINA 600 8.9 0.8
AUSTRALIA 24 5.7 2.8
RUSSIA 120 4.1 0.5
INDIA 5 0.5 0.1

Global Room & Pillar Performances
Country Best Prodn (Lac ton/month)
Avg Prodn (Lac ton/month)
USA 1.10 0.70
CHINA 2.00 0.30
AUSTRALIA 0.60 0.40
RUSSIA 0.35 0.20
INDIA 0.50 0.40

CIL - Production Programme during XI &
XII Plan

CIL Production Program – UGXI & XII Plan
Company Actual 06-07
Proj. XI Plan 11-12
Proj. XII Plan 16-17
ECL 8.27 13.16 13.14
BCCL 4.90 5.28 6.25
CCL 1.96 2.40 2.40
WCL 9.91 10.62 10.79
SECL 16.20 19.70 21.00
MCL 1.97 3.00 3.60
NEC 0.11 0.40 0.40
CIL 43.32 54.56 57.58
Fig in Mill T
MOC has further enhanced the UG target to 75 Mill T by 11-12

Technology-wise Coal Production in CIL XI Plan (UG)
Technology Actual 06-07
Projection 07-08
Proj. XI Plan 11-12
Conv. B&P
Conv. LW
Mech B&P (SDL/LHD)
Mech. LW
Continuous Miner
Special Methods
11.77
0.03
30.20
0.54
0.62
0.16
10.16
0.14
34.01
0.90
1.22
0.55
7.21
0.06
38.29
3.07
4.18
1.75
CIL 43.32 46.98 54.56
Fig in Mill T

Future Scenario
• Insignificant increase from ECL/BCCL/CCL• Quantum increase in UG production is expected
from SECL/WCL/MCL• Gradual phasing out manual loading through
introduction of mechanized loading• Potential technology shift from manual to
SDL/LHD, Continuous Miner & Special Innovative methods.

Technological Options & Future Strategies

Different methods tried so far
– B&P system of development with scraper, SDL, LHD
– B&P with partial extraction, Splitting and stooking, wide-stall mining, partial extraction with hydraulic stowing
– Thick seam mining employing different methods like Multislice mining (Inclined/horizontal slicing )
– Longwall mining in a single pass
– Longwall with Integral caving/ Longwall Sub-level caving
– Blasting Gallery method
– Hydro-mining
– Use of Continuous Miner

Presence of large number of low capacity outlets
These mines are uneconomical and labour intensive
Working seams overlain by old fire/water-logged goaves – restricts Depillaring
Predominance of Development method
Old mines have spread over extensive area.
Distance of working district causes loss of productive hours.
MAJOR CONSTRAINTS TO IMPROVE UG PRODUCTION
Contd…

Locating new shaft/Incline on surface difficult due to non- availability of land.
Sinking/deepening of shaft for working of lower seams – capital intensive and hampers production. Non-availability of free surface areas for uninterrupted caving
Reduction in number of Underground mines due to safety Issues and exhaustion of reserves (From
357 in 1996-97 to 298 in 2005-06)
Contd…

Long Gestation Period for opening new UG mine compared to Opencast
Limited success of PSLW technology in India
Un-viable economics of production
Difficulty in procurement of sand for stowing in many cases leads to development only (i.e. only 25-30% extraction)

STRATEGIES FOR INCREASING PRODUCTION FROM UNDERGROUND MINES FROM
PRESENT LEVEL OF 43 MT (06-07) TO 124 MT (2025-26)
Development of underground projects with Longwall/Mass production technology on risk/gain sharing basis with production of 2–10 Mill T per annum
Application of Continuous Miner in extraction of pillars & in virgin areas.
Existing Bord & Pillar with SDL/LHD to Continue
Intensify mechanized Roof Bolting
100% mechanization by 2017

Technology for deep Shaft Sinking
High speed tunneling machine for faster Incline/Drift drivage.
Introduction of state-of-the-art Safety Monitoring devices
Introduction of Man Riding systems in mines.
Wireless multi-media communication for ug mines.
Automation and use of IT
Capacity building through training and redeployment of manpower.

R & D NEEDS FOR FUTURE
• Trials of suitable mining methods for steep and thick seams.
• Hard roof management for UG mines by establishing technologies like hydro-fracturing or safe blasting with explosives or non-explosive materials.
• Trials of stowing with materials other than sand
• Detection and mapping of old and unapproachable workings.
• Application of robots for mapping of unapproachable UG workings and for detection of trapped miners in the event of disasters.

Site selection for installation of Highwall miner
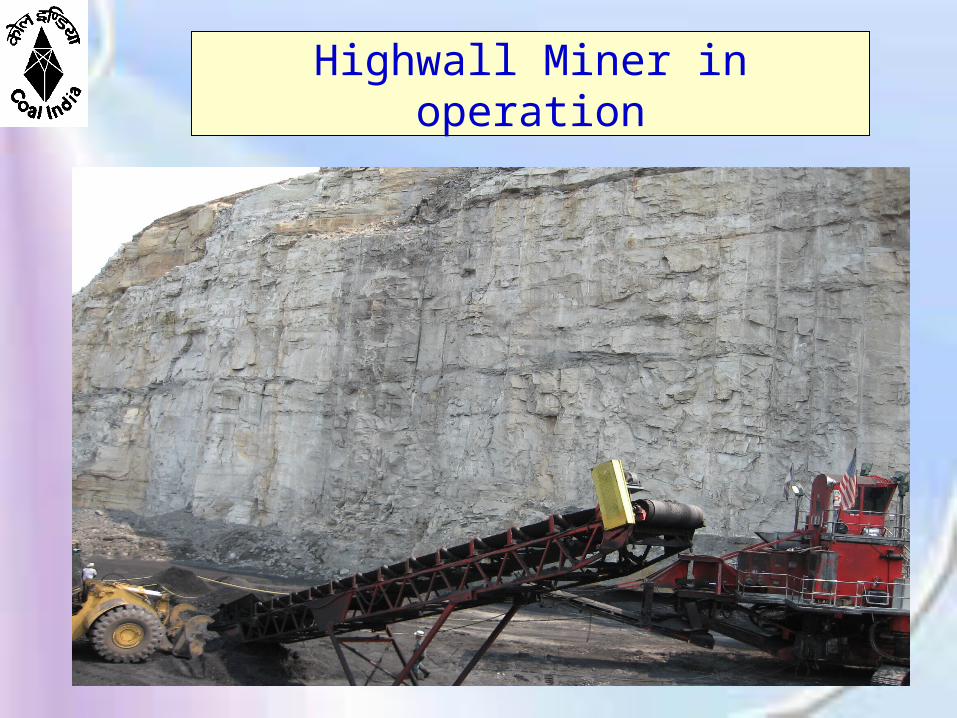
Highwall Miner in operation

Thank You