MECHANICAL AND DURABILITY PROPERTIES OF RECYCLED …
137
MECHANICAL AND DURABILITY PROPERTIES OF RECYCLED AND REPEATED RECYCLED COARSE AGGREGATE CONCRETE by Sumaiya Binte Huda A THESIS SUBMITTED IN PARTIAL FULFILLMENT OF THE REQUIREMENTS FOR THE DEGREE OF MASTER OF APPLIED SCIENCE in The College of Graduate Studies (Civil Engineering) THE UNIVERSITY OF BRITISH COLUMBIA (Okanagan) February 2014 © Sumaiya Binte Huda, 2014
Transcript of MECHANICAL AND DURABILITY PROPERTIES OF RECYCLED …
MECHANICAL AND DURABILITY PROPERTIES OF RECYCLED AND
REPEATED RECYCLED COARSE AGGREGATE CONCRETE
by
Sumaiya Binte Huda
A THESIS SUBMITTED IN PARTIAL FULFILLMENT
OF THE REQUIREMENTS FOR THE DEGREE OF
MASTER OF APPLIED SCIENCE
in
The College of Graduate Studies
(Civil Engineering)
THE UNIVERSITY OF BRITISH COLUMBIA
(Okanagan)
February 2014
© Sumaiya Binte Huda, 2014

ii
ABSTRACT
Disposal and treatment of construction and demolition (C&D) wastes are often costly and
hazardous to the environment. Their recycling could lead to a greener solution to the
environmental conservation and pave the way towards sustainability. This study utilizes
demolished concrete as coarse aggregate often termed as recycled coarse aggregate (RCA) for
producing industry quality concrete. Large scale recycling can substantially reduce the
consumption of natural aggregate and help preserve the environment. However, in near future, it
can raise new challenges. The use of “repeated recycled coarse aggregate” in concrete production
can be a viable solution to the growing problem regarding the C&D waste disposal. During the
development of new generation product like recycled and repeated recycled coarse aggregate
concrete, it is essential to investigate the fresh, hardened, and durability properties of concrete to
promote and escalate its application in the construction industry. This research investigates the
fresh, mechanical, and durability properties of 25 MPa recycled aggregate concrete (RAC) made
with different RCA replacement levels. Durability performance of 25 MPa RAC was evaluated
in terms of sulphate attack and cyclic wetting and drying along with chloride exposure. Chloride
propagation was evaluated after 1, 4, 9, 16, 28, 90, and 120 cycles. This study reveals that the
performance of RAC is decreasing with increasing RCA replacement levels but their overall
performance is comparable to natural aggregate concrete (NAC).
Three different generations of repeated recycled coarse aggregate concrete were produced
using 100% RCA as a replacement of natural coarse aggregate. Similar mix design was used for
producing 32 MPa concrete. Along with this, their durability performance was examined under
three different exposure conditions namely, freeze-thaw, sulphate, and chloride exposure. It was
found that the compressive strength of different generations of repeated recycled concrete was

iii
lower than the control concrete. However, all of the mixes exceeded the target strength at 120
days. The durability performance of the different generations of repeated recycled coarse
aggregate concrete was negatively affected by using different generations of such aggregates but
still these findings will add a new achievement towards sustainable world.

iv
PREFACE
Major portions of the work outlined in this thesis have been submitted (see list below) for
possible publication in peer reviewed technical journals. The author carried out all experimental
work, analyses of results, and writing of the initial draft of all papers listed below. The
contributions of her research supervisor consisted of providing guidance and supervision, and
helping in the development of the final versions of the publications.
Refereed Journal Publications
Huda, S.B. and Alam, M.S. 2014. Mechanical and durability properties of recycled aggregate
concrete (RAC) made with different replacement levels of recycled coarse aggregate (RCA).
Submitted to Construction and Building Materials.
Huda, S.B. and Alam, M.S. 2014. Mechanical behavior of three generations of 100% repeated
recycled coarse aggregate concrete. Submitted to Cement and Concrete Research.
Huda, S.B. and Alam, M.S. 2014. Durability properties of repeated recycled coarse aggregate
concrete. Submitted to Construction and Building Materials.

v
TABLE OF CONTENTS
ABSTRACT…… ....................................................................................................................... ii
PREFACE ................................................................................................................................. iv
TABLE OF CONTENTS…………………………………………………………………………v
LIST OF TABLES .................................................................................................................... ix
LIST OF FIGURES .................................................................................................................... x
ACKNOWLEDGEMENTS ..................................................................................................... xiii
DEDICATION…………………………………………………………………………………...xv
Chapter 1 : INTRODUCTION AND THESIS ORGANIZATION ............................................. 1
1.1 GENERAL ........................................................................................................................ 1
1.2 OBJECTIVE OF THE STUDY ......................................................................................... 2
1.3 RESEARCH SIGNIFICANCE .......................................................................................... 3
1.4 THESIS OUTLINE ........................................................................................................... 4
Chapter 2 : LITERATURE REVIEW ........................................................................................ 6
2.1 GENERAL ........................................................................................................................ 6
2.2 GREEN CONCRETE ....................................................................................................... 7
2.3 GREEN CONCRETE AND SUSTAINABILITY.............................................................. 8
2.4 DIFFERENT WAYS OF GREEN CONCRETE PRODUCTION ...................................... 9
2.5 RAC UTILIZATION ...................................................................................................... 10
2.6 PROPERTIES OF RECYCLED AGGREGATE ............................................................. 13
2.6.1 Gradation, Shape and Texture ................................................................................... 14
2.6.2 Specific Gravity ........................................................................................................ 15
2.6.3 Absorption ................................................................................................................ 15
2.6.4 Abrasion resistance ................................................................................................... 16
2.7 PROPERTIES OF RAC .................................................................................................. 18
2.7.1 Fresh Properties of RAC ........................................................................................... 18
2.7.1.1 Workability ........................................................................................................ 18
2.7.1.2 Slump ................................................................................................................. 19
2.7.1.3 Air content ......................................................................................................... 20
2.7.1.4 Initial and final setting time ................................................................................ 20

vi
2.7.2 Properties of Hardened RAC ..................................................................................... 20
2.7.2.1 Physical properties ............................................................................................. 21
2.7.2.1.1 Permeability ................................................................................................. 21
2.7.2.1.2 Porosity of concrete ..................................................................................... 21
2.7.2.1.3 Coefficient of thermal expansion .................................................................. 22
2.7.2.1.4 Ultra sound pulse velocity ............................................................................ 22
2.7.2.2 Mechanical properties ........................................................................................ 22
2.7.2.2.1 Compressive strength ................................................................................... 23
2.7.2.2.2 Hardness ...................................................................................................... 26
2.7.2.2.3 Flexural strength .......................................................................................... 26
2.7.2.2.4 Tensile strength ............................................................................................ 27
2.7.2.2.5 Modulus of elasticity .................................................................................... 27
2.7.2.2.6 Drying shrinkage.......................................................................................... 28
2.7.2.3 Durability of Recycled Concrete ......................................................................... 28
2.7.2.3.1 Freezing and thawing resistance ................................................................... 28
2.7.2.3.2 Carbonation ................................................................................................. 29
2.7.2.3.3 Corrosion ..................................................................................................... 29
2.7.2.3.4 Alkali-silica resistance (ASR) and alkali carbon resistance (ACR) ............... 30
2.7.2.3.5 Sulfate resistance ......................................................................................... 30
2.7.2.3.6 Chloride penetration resistance..................................................................... 30
2.7.2.3.7 Chloride content ........................................................................................... 30
2.7.2.3.8 Chloride conductivity ................................................................................... 30
2.8 MIX DESIGNS FOR RAC.............................................................................................. 32
2.9 CLOSURE ...................................................................................................................... 33
Chapter 3 : MECHANICAL BEHAVIOR OF RECYCLED AGGREGATE CONCRETE
(RAC) MADE WITH DIFFERENT REPLACEMENTLEVELS OF RECYCLED
COARSE AGGREGATE (RCA) .............................................................................. 34
3.1 GENERAL ...................................................................................................................... 34
3.2 SOURCES OF AGGREGATES ...................................................................................... 35
3.3 PROPERTIES OF AGGREGATES ................................................................................ 36
3.3.1 Gradation .................................................................................................................. 36

vii
3.3.2 Bulk Density, Specific Gravity, and Moisture content of Aggregates ........................ 37
3.4 EXPERIMENTAL PROCEDURE .................................................................................. 38
3.5 RESULTS AND DISCUSSION ...................................................................................... 41
3.5.1 Results of fresh concrete properties ........................................................................... 41
3.5.2 Results of Compressive Strength ............................................................................... 41
3.5.3 Failure Pattern of Concrete ....................................................................................... 45
Chapter 4 : DURABILITY OF RAC MADE WITH DIFFERENT RCA REPLACEMENT
LEVELS: SULPHATE AND CHLORIDE ATTACK ............................................... 46
4.1 GENERAL ...................................................................................................................... 46
4.2 TEST METHOD TO ASSESS THE SULPHATE RESISTANCE OF RAC .................... 47
4.3 TEST METHOD TOASSESS THE CHLORIDE ION INGRESSION INTORAC ........... 50
4.4 RESULT AND DISCUSSION ........................................................................................ 52
4.4.1 Results of Sulphate Resistance Test .......................................................................... 52
4.4.2 Results of Chloride Ion Ingression into RAC ............................................................ 58
Chapter 5 : INFLUENCE OF REPEATED RECYCLED COARSE AGGREGATE ON THE
FRESH AND HARDENED PROPERTIES OF CONCRETE ................................... 61
5.1 GENERAL ...................................................................................................................... 61
5.2 SOURCES OF AGGREGATES ...................................................................................... 63
5.3 PRODUCTION OF REPEATED RECYCLED COARSE AGGREGATE ...................... 63
5.4 PROPERTIES OF AGGREGATES ................................................................................ 66
5.4.1 Gradation .................................................................................................................. 67
5.4.2 Bulk Density, Specific Gravity, and Moisture Content of Aggregates ....................... 68
5.5 EXPERIMENTAL PROGRAM ...................................................................................... 70
5.6 EXPERIMENTAL RESULTS ........................................................................................ 73
5.6.1 Results of Fresh Concrete Properties ......................................................................... 73
5.6.2 Results of Compressive Strength ............................................................................... 74
5.6.3 Stress-Strain Curve ................................................................................................... 76
5.6.3.1 Modulus of elasticity and poisson’s ratio ............................................................ 79
5.6.4 Results of Splitting Tensile Strength ......................................................................... 79
5.6.5 Failure Pattern of Concrete ....................................................................................... 80
Chapter 6 : Durability Properties of Repeated Recycled Coarse Aggregate Concrete ............... 82

viii
6.1 GENERAL ...................................................................................................................... 82
6.2 FREEZE-THAW DURABILITY TEST OF REPEATED RECYCLED COARSE
AGGREGATE CONCRETE ............................................................................................. 83
6.3 TEST METHOD TO ASSESS THE SULPHATE RESISTANCE OF REPEATED
RECYCLED COARSE AGGREGATE CONCRETE ........................................................ 84
6.4 TEST METHOD TO ASSESS THE CHLORIDE ION INGRESSION INTO
REPEATED RECYCLED COARSE AGGREGATE CONCRETE ................................... 85
6.5 RESULT AND DISCUSSION ........................................................................................ 85
6.5.1 Results of Freeze-Thaw Durability Test .................................................................... 85
6.5.2 Results of Sulphate Resistance Test .......................................................................... 92
6.5.3 Results of Chloride Ion Ingression into Recycled Concrete ....................................... 97
Chapter 7 : Conclusions and Recommendations ..................................................................... 101
7.1 SUMMARY .................................................................................................................. 101
7.2 CONCLUSIONS ........................................................................................................... 101
7.2.1 Recycled Concrete Made with Different RCA Replacement Levels ........................ 102
7.2.2 Repeated Recycled Coarse Aggregate Concrete ...................................................... 102
7.3 LIMITATIONS OF THIS STUDY ................................................................................ 103
7.4 RECOMMENDATIONS FOR FUTURE RESEARCH ................................................. 104
REFERENCES ....................................................................................................................... 106
APPENDIX-A : COMPRESSIVE STRENGTH AND CHLORIDE ION CONCENTRATION
............................................................................................................................... 121

ix
LIST OF TABLES
Table 2.1: Current condition of RAC ........................................................................................ 13
Table 2.2: Allowable maximum limits of different harmful substances in recycled aggregate
(after Oikonomou 2005) ........................................................................................... 14
Table 2.3: Variation of attached mortar contents with the particle size of recycled aggregate .... 15
Table 2.4: Specific gravity of aggregate .................................................................................... 16
Table 2.5: Absorption capacity of different types of aggregates ................................................ 17
Table 2.6: Abrasion resistance .................................................................................................. 17
Table 2.7: RAC specifications limit .......................................................................................... 19
Table 2.8: Pore radius of different concrete mixes at 90 days (after Gomez-Soberon 2002) ...... 22
Table 2.9: Variation in compressive strength of RCA concrete ................................................. 25
Table 2.10: Variation in flexural strength of RCA concrete ....................................................... 26
Table 2.11: Variation in tensile strength of RCA concrete......................................................... 27
Table 2.12: Comparative analysis of concrete properties made from recycled concrete
aggregate (after ACI Committee 555, 2001) ........................................................... 31
Table 3.1: Properties of aggregates ........................................................................................... 38
Table 3.2: Mix proportions ....................................................................................................... 39
Table 3.3: Properties of fresh concrete ...................................................................................... 41
Table 3.4: Compressive strength results of different concrete mixes ......................................... 43
Table 5.1: Properties of aggregates ........................................................................................... 70
Table 5.2: Mix proportions ....................................................................................................... 72
Table 5.3: Fresh concrete properties ......................................................................................... 74
Table 5.4: Mechanical properties of different concrete mixes at 120th day................................. 79
Table A1: Chemical composition (after Siddique 2003) .......................................................... 121
Table A2: Concentration of chloride ions per unit surface area of concrete cylinder................ 121
Table A3: Compressive strength of the natural coarse aggregate concrete and different
generations repeated RCA concrete ........................................................................ 122
Table A4: Concentration of chloride ions per unit surface area of concrete cylinder................ 122

x
LIST OF FIGURES
Figure 2.1 Breakdown of construction and demolition waste stream in Ottawa (after City of
Ottawa 2013) ............................................................................................................ 10
Figure 2.2 The effect of recycled concrete aggregate on concrete compressive strength (after
Yang et al. 2008) ...................................................................................................... 24
Figure 3.1 Sieve analyses of (a) Natural fine aggregate, (b) Natural coarse aggregate, and (c)
Recycled coarse aggregate (RCA) ............................................................................ 37
Figure 3.2 Compressive strength of concrete made with different replacement levels................ 43
Figure 3.3 Variation in compressive strength of different concrete mixes at the age of 7, 28,
56, and 148 days ....................................................................................................... 44
Figure 3.4 Failure pattern of different concrete mixes (a) Mix-1, (b) Mix-2, (c) Mix-3,
(d) Mix-4, (e) Mix-5, and (f) Mix-6 .......................................................................... 45
Figure 4.1 Sulphate bath used for sulphate exposure test ........................................................... 50
Figure 4.2 Sequence of one wet-dry cycle ................................................................................. 52
Figure 4.3 Sulphate Compressive strength of concrete made with different RCA replacement
level under sulphate exposure ................................................................................... 53
Figure 4.4 The percent (%) change in compressive strength of concrete made with different
RCA replacement levels at the age of 148 days under sulphate exposure with respect
to the compressive strength of moist cured specimens at the same respective age ..... 55
Figure 4.5 Compressive strength of various concrete mixes ...................................................... 55
Figure 4.6 (a) Height change (%) (b) Volume change (%) of concrete cylinders under
sulphate exposure condition ...................................................................................... 56
Figure 4.7 Discoloring during exposed to sulphate .................................................................... 57
Figure 4.8 Compressive strength of concrete after being exposed to chloride solution (a) 28
cycles (at 56thday), (b) 90 cycles (at 118
thday), and (c) 120 cycles (at 148
thday) ........ 58
Figure 4.9 Compressive strength of concrete at the age of 148 days .......................................... 59
Figure 4.10 Concentration of chloride ions per unit surface area of concrete cylinder ............... 60
Figure 5.1 Flow diagram of evolution process of recycled concrete made with repeated
recycled coarse aggregate ......................................................................................... 65
Figure 5.2 The crushing setup used for producing repeated recycled coarse aggregate .............. 66
xi
Figure 5.3 Gradation curves of (a) natural fine aggregate and (b) natural coarse aggregate........ 67
Figure 5.4 Sieve analyses of different generations repeated recycled coarse aggregates where
(a) 1stgeneration recycled coarse aggregate (RCA1), (b) 2
ndgeneration recycled
coarse aggregate (RCA2), and (c) 3rd
generation recycled coarse aggregate
(RCA3)..................................................................................................................... 68
Figure 5.5 Microscopic view (magnification 40x) of different types of coarse aggregate:
(a) Control (natural coarse aggregate), (b) 1stgeneration recycled coarse aggregate
(RCA1), (c) 2nd
generation recycled coarse aggregate (RCA2), and (d) 3rd
generation
recycled coarse aggregate (RCA3) ............................................................................ 71
Figure 5.6 Compressive strength of various concrete mixes ...................................................... 75
Figure 5.7 Variation in 3, 7, 28, 56 and 120-day compressive strength of various concrete
batches ..................................................................................................................... 77
Figure 5.8 Stress-strain curves of various concrete mixes at the age of 120 days ....................... 78
Figure 5.9 Splitting tensile strength of various concrete mixes at the age of 28 days ................. 80
Figure 5.10 Failure pattern of various concrete mixes (a) Control (natural coarse aggregate
concrete) at 56th day, (b) 1
st generation repeated RCA concrete (RC1) at 56
th day,
(c) 2nd
generation repeated RCA concrete (RC2) at 56th day, (d) 3
rd generation
repeated RCA concrete (RC3) at 56th day, (e) Control (natural coarse aggregate
concrete) at 120th day, (f) 1
st generation repeated RCA concrete (RC1) at 120
th day,
(g) 2nd
generation repeated RCA concrete (RC2) at 120th day, and (h) 3
rd
generation repeated RCA concrete (RC3) at 120th
day .............................................. 81
Figure 6.1 Relative dynamic modulus of elasticity of concrete .................................................. 87
Figure 6.2 Length change of concrete ....................................................................................... 88
Figure 6.3 Weight change of concrete ....................................................................................... 89
Figure 6.4 Durability factor of concrete .................................................................................... 90
Figure 6.5 Specimens for freeze-thaw durability test before being placed in freeze-thaw
chamber where (a) Control (natural coarse aggregate concrete), (b) 1st generation
repeated RCA concrete (RC1), (c) 2nd
generation repeated RCA concrete (RC2),
and (d) 3rd
generation repeated RCA concrete (RC3) ................................................ 91
Figure 6.6 Concrete specimens after being exposed to 300 freeze-thaw cycles where
(a) Control (natural coarse aggregate concrete), (b) 1st generation repeated RCA

xii
concrete (RC1), (c) 2nd
generation repeated RCA concrete (RC2), and (d) 3rd
generation repeated RCA concrete (RC3) ................................................................. 91
Figure 6.7 The results of compressive strength test at the age of 7days (before being placed in
5% sodium sulphate solution) and 56 days (after 7 weeks of exposure) ..................... 93
Figure 6.8 The results of compressive strength test at the age of 56 days of standard moist
curing cylinders and sulphate exposed cylinders ....................................................... 93
Figure 6.9 Compressive strength of various concrete mixes at 56th day ..................................... 94
Figure 6.10 Height change (%) of concrete cylinders under sulphate exposure condition .......... 96
Figure 6.11 Volume change (%) of concrete cylinders under sulphate exposure condition ........ 97
Figure 6.12 Compressive strength of concrete at the age of 56 days .......................................... 98
Figure 6.13 Compressive strength of various concrete batches at 56th day ................................. 99
Figure 6.14 Concentration of chloride ions per unit surface area of concrete cylinder ............. 100

xiii
ACKNOWLEDGEMENTS
I convey my profound gratitude to the almighty Allah for allowing me to bring this effort
to fruition. I express my sincere gratitude to my advisor, Dr. M. Shahria Alam for providing me
with an opportunity to work with him during my graduate studies at The University of British
Columbia, Okanagan. I couldn’t have asked for a better mentor and guide for my MASc program
and I really appreciate all the support, guidance, and motivation that he has provided me through
my academic career. He has been instrumental with knowledge, support, and mentoring that
made my graduate experience at UBC so impeccably productive and rewarding, and made a
great contribution to the success of this research.
I would like to thank my master’s dissertation committee members, Dr. Rehan Sadiq and
Dr. Ahmad Rteil for always supporting my research work and providing me with great feedback
from time to time, helping me improve the quality of my work immensely. The assistance of Dr.
Lukas Bichler is also noted in generating the microscopic image of recycled aggregate.
Graduate school and experimental research facility at UBC’s Okanagan campus has
provided an excellent educational experience, and I would like to acknowledge the support I
have received for pursuing a graduate degree at this Institution from Natural Sciences and
Engineering Research Council of Canada (NSERC). Additionally, OK Builders Ltd. has
supported this research project and provided required materials and useful thoughts throughout.
I feel privileged to get the opportunity to work with such an excellent group of graduate
students in the research group especially Anant, Shahidul, Kader, and Muntasir who helped me
during my experimental works, offered technical knowledge, and friendship. I would also like to
acknowledge Dr. Nouroz Islam for his generous help in setting up the data acquisition system

xiv
and strain gauges. I offer my enduring gratitude to the lab technicians for their valuable and
generous assistance during my experimental works.
Finally, It is particularly important to thank my husband, Muntasir, for his support
throughout my graduate studies and my parents, whom I feel to be the key source of inspiration
for all my achievements.

xv
Dedicated to my parents

1
Chapter 1: INTRODUCTION AND THESIS ORGANIZATION
1.1 GENERAL
Sustainable construction and infrastructure management largely depend on the recycling
and reuse of construction and demolition (C&D) waste. In Canada, C&D waste constitutes
almost 25% of the municipal solid waste (MSW) (Statistic Canada 2008). It is estimated that, in
British Columbia, C&D waste is almost 27.5% of total MSW where in Ontario and Alberta it is
29% and 7.5%, respectively (Statistics Canada 2008). Unfortunately, the amount of C&D waste
is increasing every year. Among all the C&D wastes in Canada concrete waste occupies a
significant portion. As their disposal is costly and occupies large amount of space in landfills, it
is critical to find a way to reuse them so that this huge amount of waste can be turned into a
natural resource for construction industry. One possible way of utilizing this concrete is to use it
as coarse aggregates in new concrete, which can lead to a greener environment and pave the way
for sustainable construction. Recycled aggregate concrete (RAC) is a relatively new construction
material which is produced by crushing old concrete and used as aggregate replacement in new
concrete. On the other hand, as this concrete gets older and need to be demolished, it will
regenerate further concrete waste, which has the potential for similar reuse. Therefore, repeated
recycled coarse aggregate concrete is a completely innovative green product, which requires
extensive experimental investigation as its utilization will lead us one step forward towards a
more sustainable world. Repeated recycled coarse aggregate concrete is produced by sequential
crushing of used concrete products. Its uses in construction industry will help minimize two
major environmental problems. First, it will reduce the environment pollution and second it will

2
help in preserving limited natural resources. Although RAC is a promising construction material,
before any large industrial application its strength and durability properties must be properly
investigated since the prominent characteristics of recycled aggregates differ from the natural
aggregates. The differences in mechanical properties of recycled aggregate significantly
influence the quality of RAC, and considered as one of the major barriers related to the field
application of RAC. The influence of repeated recycled aggregate cannot be fully understood
without proper investigation as the aggregate properties might vary significantly with the number
of repetitions. In order to provide a sustainable construction material a suitable balance is
essential between the quality and cost of RAC. The use of RAC is a very cost effective option if
the quality remains comparable to the conventional concrete. To enhance the use of RAC and its
acceptance as a sustainable construction material, the investigation of mechanical and durability
properties is necessary which will help gain confidence regarding its application and lead us
significantly closer to an ideal safe and sustainable solution to our need for green infrastructure.
1.2 OBJECTIVE OF THE STUDY
Although the properties of recycled and repeated recycled aggregates differ from natural
aggregate, these aggregates can be considered as a potential replacement to natural aggregate.
Throughout the world extensive research have already been conducted on RAC (Yang et al.
2008, Poon et al. 2004, Etxeberria et al. 2007, Alam et al. 2013, Huda et al. 2013). The
performance of RAC can be significantly influenced by its source. The finding of this study will
boost up the confidence level of local industries regarding the use of RAC. The overall objective
of this study is to develop a sustainable solution for natural coarse aggregate replacement in
concrete by introducing repeated recycled aggregate as raw materials for producing ready mix

3
Green Concrete. This study seeks to produce a durable concrete that is acceptable in its fresh
and hardened properties. This study is conducted to achieve the following objectives:
1. Compare the fresh and hardened properties of RAC made with different recycled
coarse aggregate (RCA) replacement levels with those of natural aggregate concrete
(NAC).
2. Evaluate the durability performance of RAC made with different RCA replacement
levels
3. Investigate the potential of repeated recycled coarse aggregate
4. Investigate the aggregate properties of different generations’ repeated recycled coarse
aggregates
5. Study fresh and hardened properties of different generations of repeated recycled
coarse aggregate concrete.
6. Durability performance of repeated recycled coarse aggregate concrete is examined in
terms of freeze thaw durability test, sulphate attack, and cyclic wetting and drying along
with sodium chloride solution.
1.3 RESEARCH SIGNIFICANCE
The mechanical and durability properties of recycled aggregate have been investigated by
several researchers all over the world (Poon et al. 2004, Etxeberria et al. 2007, Yang et al. 2008,
Salem et al. 2003, Alam et al. 2013). The quality and mechanical properties of recycled
aggregate can vary significantly due to the geographic location and environmental condition.
Studies performed in Europe or Asia might not be applicable to North America. This study aims
to provide important information on the mechanical and durability properties of RAC to the local

4
ready mix industry. The outcome of this study will provide local concrete industry and
practitioners’ necessary information regarding the application of RCA as a replacement of
natural coarse aggregate for producing RAC. The results excerpted from this study will boost up
the confidence level and allow various applications of RAC in aggressive environment such as
cold climatic condition undergoing freeze-thaw cycles, sulphate attack, and chloride penetration.
Repeated recycled coarse aggregate concrete is a potential sustainable construction material.
Since its absorption and porosity can be higher than conventional concrete, durability could be
an issue that needs to be addressed. Currently there is no published literature on the durability
properties of repeated recycled coarse aggregate concrete. This research addresses information
on the characteristics of the different generations recycled coarse aggregate concrete and
encourages their application. Specifically, this study offers a new generation green concrete and
its practical application can reduce the carbon emission, carbon footprint, and size of land fill.
Most importantly, it will reduce the use of limited natural aggregate and it can provide a cost
effective solution in terms of present and future concerns (Smith 2009, Donalson et al. 2011).
1.4 THESIS OUTLINE
Chapter-1 covers the objectives and scope of this study including a general introduction
on green concrete (RAC and repeated recycled coarse aggregate concrete).
Chapter-2 provides a detailed literature review on green concrete using C&D waste.This
chapter also covers the sustainability perspective of green concrete, provides statistical
information about the utilization of RAC and synthesizes the properties of recycled aggregate
and the fresh, hardened, and durability properties of RAC available in literature.

5
Chapter-3 describes the experimental procedure along with the results of aggregate
property and the fresh and hardened properties of 25 MPa RAC made with RCA of different
replacement levels.
Chapter-4 provides the methodology and the results of durability of RAC made with
different RCA replacement levels in terms of sulphate attack and chloride ion ingression under
cyclic wetting and drying.
Chapter-5 includes the experimental procedure and their results for investigating the fresh
and hardened properties of 32 MPa repeated recycled coarse aggregate concrete.
Chapter-6 describes the durability of different generations of repeated recycled coarse
aggregate concrete.
Chapter-7 presents the conclusions derived from this study, discusses the limitations of
this study and provides recommendations for future research directions.

6
Chapter 2: LITERATURE REVIEW
2.1 GENERAL
A large portion of Canadian civil infrastructure is reaching the end of its life span and will
soon need to be replaced. Although the replacement of this infrastructure will increase the
amount of construction and demolition (C&D) waste already found in Canadian landfills, these
C&D waste can be potentially used as an alternative aggregate (recycled aggregate) in
construction industry (Yeheyis et al. 2013). C&D waste as recycled aggregates not only reduces
the scarcity of landfill, but also provides a sustainable construction material. Currently concrete
waste makes up about 12% of C&D waste found in Ottawa (City of Ottawa 2013). If this trend
continues, Canadian landfills will be saturated and polluted. However, a huge amount of this
waste can potentially be recycled. With the use of recycled aggregate in concrete mixtures, it is
possible to minimize the use of natural aggregate and scarcity of landfill significantly.
As environmental preservation is becoming a primary societal concern, the use of
sustainable materials in construction is gaining popularity all over the world. The use of
construction wastes for the production of new sustainable concrete is, however, not a new
research area. From history it was found that Romans often used C&D waste or debris for road
construction (Tabsh and Abdelfatah 2009). RAC has been reported to provide environmental
benefits through both its production and use, thus, providing a greener and more sustainable
solution. By using concrete waste as aggregate for producing new concrete (recycled aggregate
concrete), natural resources (e.g. gravel pits, rock quarries) can be preserved, which can
eliminate other related manufacturing processes, e.g. excavation/blasting, transportation,
7
crushing etc. When an old structure is demolished, the demolition wastes also need to be sent to
the landfills. This process involves the cost of material handling, dumping, and transportation
cost. The use of C&D waste will substantially reduce the landfill use.
This chapter presents a detailed summary of the existing literature on RAC, in particular,
various properties of RAC, comparative analyses on the fresh and hardened properties of NAC
and RAC, and their durability aspects. This chapter presents the existing knowledge on the
properties of RAC using useful graphs and tables, and discusses their advantages and
disadvantages in a systematic manner.
2.2 GREEN CONCRETE
Concrete is being used as a construction material for more than 2000 years. In construction
industry concrete has become more acceptable for its dependable nature and long lasting
property. Other than construction purpose, the contribution of concrete in economic growth,
social progress, and environmental protection is often ignored. It was found that energy
performances of concrete structure are superior to steel structures (Lemay 2011). Concrete
structures are not only flexible in design but also affordable. Moreover, concrete structures are
more environmentally friendly than aluminum or steel structures.
To make the concrete industry more sustainable and environment friendly, researchers are
working continuously and they came up with the idea of green concrete (recycled concrete).
Green concrete or recycled concrete is a sustainable type of concrete resulting from aggregate
replacements such as RAC, rubber tire, ceramic waste, tile, glass aggregate etc. It could also be a
result of portland cement replacements such as fly ash, silica fume and slag or it could result
from waste material admixtures such as waste latex paint. As a result, RAC has less
8
environmental impact in terms of energy consumption and emission during its manufacturing
process (Hameed 2009) and can reduce the cost associated with concrete production.
2.3 GREEN CONCRETE AND SUSTAINABILITY
A sustainable material is often defined as a material that produces environmental benefits
through both its production and use. However, environmental benefits are not the only aspect
that defines a sustainable material. Social and economic benefits must also be considered before
deeming a material sustainable. As a result, the green concrete should provide a sustainable
solution for reducing industrial waste through the investigation of its environmental, economic
and social benefits.
The environmental benefits of using green concrete can be seen primarily in two ways.
Firstly, the benefit of using any amount of recycled concrete aggregate would help limit the
amount of industrial waste heading to landfills. Recycled concrete aggregates do not degrade
easily and will, therefore, remain in our landfills for long periods of time. By reducing these
waste materials it is possible to limit the size and increase the longevity of our landfills.
Secondly, the use of green concrete would contribute to a reduction in our carbon footprint. By
using RAC in new concrete the number of gravel pits/rock quarries can be reduced which would
eliminate the large amount greenhouse gases emitted through the natural aggregate
excavation/extraction process (Marinkovic et al. 2010, Sjunnesson 2005). This reduction of
gravel pits/rock quarries can also prevent the destruction of our carbon neutralizing ecosystems.
Recently, Huda et al. (2013, 2014) conducted studies on the life cycle analysis of recycled
concrete. They found that by using RCA in new concrete production, total impact of concrete
production can be reduced by 1% to 7%.

9
The use of RAC has also significant economic gains. Tam (2008) concluded that the large
costs associated with the extraction of natural aggregate (such as the stripping and blasting) are
not present with waste aggregate. The use of recycled aggregate from local landfills will also
contribute to a reduction in high transportation costs currently incurred through the use of natural
aggregate.
The social benefits of using the green concrete may not be as obvious as the environmental
or the economic benefits in other regions. It is not desirable to have a landfill in a public
community as soil contamination, odors, increased traffic, and land value depreciation can result.
By using recycled aggregate in concrete, the amount of landfill space being used could be
reduced. In addition, landfills are typically operated by local municipalities that generally carry
the costs. These savings could be redirected into social programs to benefit communities. The
reduction in gravel pit sizes can also provide social benefits. Although gravel pits often provide
jobs and economic benefits to communities, they come at a cost as gravel pits increase the
number of truck volume in that particular area. The increase in truck traffic can make the roads
dangerous for children; reduce the life span of roads not designed for the large traffic, impact
privacy, and cause noise and air pollution that negatively affect communities. As a result, the
reduction of gravel pits can also be seen to benefit communities.
2.4 DIFFERENT WAYS OF GREEN CONCRETE PRODUCTION
Different ingredients used in concrete production include cement as a binder, sand as fine
aggregate and crushed stone, gravel or brick chips as coarse aggregates. Green concrete is a
sustainable type of concrete resulting from either aggregate replacements or cement
replacements. Green concrete can be produced by three types of replacement:

10
1) Replacing coarse aggregate
2) Replacing fine aggregate and
3) Replacing cement
Water replacement can be done using waste latex paint. In RAC, coarse aggregate
replacement can be done with construction or demolition waste (C&D), ceramic waste, tile,
rubber tire, glass waste etc. Figure 2.1 shows the breakdown of construction and demolition
waste stream in recycled aggregate, where we can see that concrete represents 12% of total
construction waste. As this study area is focused on RAC made with RCA, this chapter mainly
covers the details on RAC.
Figure 2.1 Breakdown of construction and demolition waste stream in Ottawa (after City of
Ottawa 2013)
2.5 RAC UTILIZATION
Recycled aggregates have been successfully used in concrete production for more than half
century. In Europe, recycling waste industries are well established. After the Second World War,
European countries have been utilizing the C&D waste for concrete production. The European
Concrete 12%
Gypsum10%
Wood26%
Metal9%
Oil17%
Paper and Card board
14%
Other12%

11
Demolition Association calculated that, approximately 200 million tons of wastes are generated
every year in Europe (Tabsh and Abdelfatah 2009). But currently, only 30% of the waste is
being recycled. In Europe, recycling and reusing of C&D waste is a popular and well supported
program by the European Commission on Management of Construction and Demolition Waste.
The target levels of recycling C&D waste of different European Union members are varied from
50% to 90% (Tabsh and Abdelfatah 2009). On the other hand, some of the European Union
countries are still struggling to achieve this high recycling rate such as the recycling rate of Spain
and Greece is about less than 20% where Ireland, Germany, Netherland, and Denmark,
effectively achieve recycling rate which is higher than 70% (Jeffrey 2011).
Currently in USA, around 2.2 billion tons of virgin aggregates are being produced every
year (USGS 2009) and about 10-15% of this quantity is used for pavements. In addition, other
maintenance and construction works for roads are required further 20-30% of aggregate. The rest
amount of aggregate is consumed for structural applications, which is about 60-70%. In USA,
50% of recycled aggregate is produced by natural aggregate producer, 14% by debris recycling
center, and 36% by contractors. Many initiatives were taken to facilitate the application of
recycled aggregate but initially the application was limited for road construction as base or filler
material (Gilpin et al. 2004). A geological survey carried out in 2000 revealed that every year
almost 100 million tons of recycled concrete aggregate is produced in US. This huge amount of
recycled concrete aggregate is utilized by various sectors such as asphalt pavement (9%), new
concrete production (6%), riprap (14%), base materials (68%), and other (7%) (Li 2005).
California, Michigan, Texas, Minnesota, and Virginia are taking the initiative regarding the
utilization of recycled aggregate in new concrete (FHWA 2004). Minnesota Department of
Transportation succeed to save $600,000 by using recycled aggregate to construct a 16 miles

12
plain concrete pavement in 1980 (Salem et al. 2003). It is possible to save $11 in every 1000 kg
by using recycled concrete aggregate instead of natural aggregate (Smith et al. 2008).
The use of RCA is very specific and limited in Canada. It is estimated that the utilization of
RCA is only 3% in Ontario (Miller 2005). Previously, Ministry of transportation of Ontario
(MTO) did not encourage the use of recycled aggregate in construction. Later they started to use
blending aggregates (natural and recycled) for the sub base and base of concrete pavement
(Gilbert 2005).
Among the Asian countries, Japan has a very fascinated and enriched research history
regarding RAC. Due to the structural safety requirement very little amount of recycled aggregate
is being used in the real case scenario/field. Never the less in 1991 recycling law was established
by Japan government, to encourage the reuse of demolition waste specially the waste concrete.
After this initiative the rate of application of recycled aggregate increased from 48% (1990) to
96% in 2000, though they were mostly as a sub-base materials for concrete pavement (Kawano
2003).
Every year 14 million tons of wastes are generated in Hong Kong. Earlier, non-hazardous
wastes were used for land reclamation process. Due to various difficulties this recycling process
was hindered. SAR government of Hong Kong started a pilot project incorporating recycling
facility of C&D waste where daily recycling capacity was 2400 tons. They successfully reused
recycled aggregate in different appropriate government projects (Rao et al. 2007).
Like other countries, Taiwan introduced some comprehensive program to fascinate and
promote the application of recycled aggregate in the production of new concrete. In 1999 they
utilized RAC during the rehabilitation program of infrastructures after a devastating earthquake.

13
Almost 30 million tons of C&D waste was generated during rehabilitation program. This
unexpected situation was overcome by successfully recycling 80% of those waste and 30% of
those recycled material was used as pavement base (Rao et al. 2007). Table 2.1 presents a
summary of the overall condition of waste management through recycling, reusing and
incineration around the world.
Table 2.1: Current condition of RAC
Country Source
Waste
generation
(million tons)
Recycled
or reused
(%)
Waste sent to
landfills or
incinerated (%)
Canada (C&Dwaste) Yeheyis et al. 2013 9 22 78
USA EPA, 2009 243 33.8 66.2
Europe Tabsh and Abdelfatah2009 200 30 70
China Zhao and Rotter 2008 120 50 50
Japan Saotome 2007 79 98 2
Austria Hyder Consulting 2011 19 55 45
India WMW 2011 10-12 50 50
2.6 PROPERTIES OF RECYCLED AGGREGATE
Aggregates occupy a large portion of concrete volume and its properties significantly
influence the properties of concrete. In case of RAC it is very difficult to get clear and
appropriate idea about its quality because the origin of the recycled aggregate is often unknown.
The application of recycled aggregate in new concrete is not only fascinating but also
challenging. Due to the variation in sources, recycled concrete aggregate may possess impurities
along with the adhered mortar content. This significantly influences the properties of RAC and
make it difficult to predict the properties of new concrete (Smith 2009). German committee of
reinforced concrete structure has specified maximum permissible limit of different harmful

14
ingredients that can be presented in recycled aggregate (Grubl and Ruhl 1998). Later Greek
standard adopted this limit in their standard.Table 2.2 represents thepermissible maximum limit
of different harmful ingredients that can present in recycled aggregate.
Table 2.2: Allowable maximum limits of different harmful substances in recycled aggregate
(after Oikonomou 2005)
Substance
Arsenic
As
Lead
Pb
Cadmium
Cd
Chromium
Cr
Copper
Cu
Nickel
Ni
Iodine
I
Zinc
Zn
Limit (µg/l) 50 100 5 100 200 100 2 400
Following section discusses the different properties of recycled aggregate.
2.6.1 Gradation, Shape and Texture
The properties of RAC are significantly affected by the gradation, shape, and texture of the
recycled aggregate used. Since recycled aggregates can be obtained from different sources, their
shape and textures are likely to vary over a wide range. Salem et al. (2003) found that recycled
aggregate possesses hundred percent crushed faces as aggregates are produced from primary and
secondary crushing. Katz (2003) found that the gradation and attached mortar content of
recycled aggregates are not influenced by the crushing strength and the age of parent concrete.
According to Corinaldesi et al. (2002) the size of recycled aggregate is dropped down to 50mm
by primary crushing process and all types of metal impurities are removed by using
electromagnets while transferring from primary to secondary crusher. Then particle size is
reduced to 14-20 mm during secondary crushing process. The adherent mortar contains of fine
and coarse aggregate are 25% and 6.5%, respectively (Katz 2003). Table 2.3 presents the
variation of attached mortar contents with the particle size of recycled aggregate.

15
Table 2.3: Variation of attached mortar contents with the particle size of recycled aggregate
Particle size Attached mortar
(by volume)
Reference
20-30 mm 20% BCSJ 1978
16-32 mm 25%- 35% Hansen and Narud 1983
14-20mm 25%-6.5% Katz 2003
8-16 mm 40% Hansen and Narud 1983
5-25 mm 35.5% Hasaba et al. 1981
4-8 mm 60% Hansen and Narud 1983
2.6.2 Specific Gravity
Natural aggregate has a specific gravity of around 2.7. On the other hand recycled
aggregate’s specific gravity is less than natural aggregate. Salem et al. (2003) and Katz (2003)
explained that the presence of attached mortar on the surface of recycled aggregate is responsible
for this reduced specific gravity of recycled aggregate. Specific gravity of recycled fine
aggregate is from 2 to 2.3 and its value increases with the increased size of RCA and it varies
from 2.2 to 2.6 while in saturated surface dry conditions (ACPA 1993, Katz 2003). Specific
gravity of different type of aggregates are shown in Table 2.4.
2.6.3 Absorption
A lower absorption capacity is observed by natural coarse aggregate which is around
0.3%. RCA has a higher absorption capacity than natural coarse aggregate due to the attached
mortar. 3.2% to 12% range of water absorption is seen in the case of fine and coarse recycled
aggregates (Katz 2003). The absorption capacity of recycled fine aggregate is higher than that of
RCA (Katz 2003, Salem et al. 2003, Gomez-Soberon 2002, Rao 2005). The absorption capacities
of different types of aggregates are given below in Table 2.5.

16
Table 2.4: Specific gravity of aggregate
Specific gravity Reference
Natural coarse aggregate 2.11 Alam et al. 2013
Natural coarse aggregate 2.65 Nassar and Soroushian 2012
Natural coarse aggregate 2.67 Salem et al. 2003
Natural coarse aggregate (lime stone) 2.71 Fathifazl et al. 2009
Natural coarse aggregate (river gravel) 2.74 Fathifazl et al. 2009
Natural coarse aggregate 2.7 Katz 2003
RCA 2.59 Katz 2003
RCA 2.4 Nassar and Soroushian 2012
RCA 2.4 Salem et al. 2003
RCA 2.5 Fathifazl et al. 2009
RCA 2.42 Fathifazl et al. 2009
RCA 2.03 Alam et al. 2013
RCA 2.2 Oikonomou 2005
Natural fine aggregate 2.65 Nassar and Soroushian 2012
Natural fine aggregate 2.54 Leite et al. 2013
Natural fine aggregate 2.72 Fathifazl et al. 2009
Recycled fine aggregate 2.45 Leite et al.2013
Recycled fine aggregate 2.23 Katz 2003
2.6.4 Abrasion resistance
Abrasion resistance of aggregate gives idea about the weathering resistance and the quality
of aggregate. According to Sagoe- Crential et al. (2001) virgin aggregate abrasion resistance is
12% higher than that of recycled aggregate. Recycled aggregate has abrasion resistance of 20%
to 45% and sometimes it can be as high as 50% (ACPA 1993). Abou- Zeid et al. (2005) found
that replacement pattern of recycled aggregate (full or partial) does not influence the abrasion
resistance of aggregate. Table 2.6 shows the abrasion resistance of natural and recycled
aggregate.It reflects the difference between the initial mass and the final mass of the tested
samples with respect to the percentage of the initial mass.

17
Table 2.5: Absorption capacity of different types of aggregates
Absorption Reference
Natural coarse aggregate 2.28% Nassar and Soroushian 2012
Natural coarse aggregate 0.30% Salem et al. 2003
Natural coarse aggregate 0.9-1.1% Gomez-Soberon 2002
Natural coarse aggregate (lime stone) 0.34% Fathifazl et al. 2009
Natural coarse aggregate (river
gravel) 0.89% Fathifazl et al. 2009
Natural coarse aggregate 0.4% Leite et al. 2013
Natural coarse aggregate 2.17% Alam et al. 2013
Natural coarse aggregate 1.24-1.25 Poon et al. 2004
RCA 4.35% Nassar and Soroushian 2012
RCA 4.70% Salem et al. 2003
RCA 5.8-6.8% Gomez-Soberon 2002
RCA 3.3-5.4% Fathifazl et al. 2009
RCA 5.23% Alam et al. 2013
RCA 3.2-3.4% Katz 2003
RCA 3% Oikonomou 2005
RCA 6.28-7.56 Poon et al. 2004
RCA 5.5% Leite et al. 2013
Natural fine aggregate 0.97% Nassar and Soroushian 2012
Natural fine aggregate 0.54% Fathifazl et al. 2009
Natural fine aggregate 0.8% Leite et al. 2013
Natural fine aggregate 1.49% Gomez-Soberon 2002
Recycled fine aggregate 5.5% Leite et al. 2013
Recycled fine aggregate 11.2-12.7% Katz 2003
Recycled fine aggregate 8.20% Gomez-Soberon 2002
Table 2.6: Abrasion resistance
Abrasion
resistance Reference
Natural aggregate 22.80% Nassar and Soroushian 2012
Recycled aggregate 31.60% Nassar and Soroushian 2012
Recycled aggregate 20-50% ACPA 1993

18
2.7 PROPERTIES OF RAC
Presently in new construction only a small portion of RAC is used as there is a lack of
adequate technical specification and guidelines for producing good quality RAC. As a result lots
of research works are being conducted all over the world to investigate the properties of RAC.
These results will intensify the industrial production of recycle concrete. There are five existing
specifications for recycled concrete made with used concrete (Oikonomou 2005, Kuroda 2005,
Noguchi 2005, Li 2008). These five are Greek Specification Concrete technology (GSCT),
Chinese technical code (DG/TJ07-008), RILEM (RILEM 1994a), BS8500 (2002), and Japanese
Industrial Standards (JIS). Table 2.7 represents the specification limit for RAC of GSCT, JIS,
DG/TJ07-008, and BS8500 and also another proposed specification limit for RAC for Egypt
(Kamel and Abou-Zeid 2008, Kamel 2008).
2.7.1 Fresh Properties of RAC
2.7.1.1 Workability
In 2001, it was found that commercially produced recycled aggregates are smoother and
spherical than recycled aggregates which are usually produced for laboratory work (Sagoe-
Crential et al. 2001). This type of shape increases the workability of commercially produced
RAC than that of laboratory produced RAC. Due to the higher absorption capacity of recycled
aggregate, the concrete mixes become stiffer and less workable compared to NAC (Salem et al.
2003). Some researchers observed that RAC requires 5-10% extra free water to achieve the same
workability than that of NAC though it is significantly influenced by the quality of recycled
aggregate (Hasan 1992, Leite et al. 2013).

19
Table 2.7: RAC specifications limit
RAC specification GSCT*
JIS* DG/TJ07-008
**
BS8500**
Egypt*
Coarse Fine Type IƗ Type II
Specific gravity
(kg/m3)
2.2
(min) 2.5 (min) 2.5 (min)
Water absorption (%) 3 (max) 3 (max)
3.5
(max) 7 (max) 10(max)
7
(max)
Foreign ingredients
(%) 1 (max) 1 (max) 1 (max) 1(max)
1(max)
Foreign ingredients
(kg/m3)
2 to
10
Organic ingredients
(%)
0.5
(max) 0.5 (max)
Sulphate ingredients
(%) 1 (max)
1(max)
1(max)
Amount of sand (%) 5 (max)
Amount of filler (%) 2 (max)
Los Angeles abrasion
(%)
40
(max) 35 (max)
40 to
50
Soft granules (%) 3 (max)
Soundness or loss (%)
10
(max)
Sand equivalent (%)
80
(min)
Solid volume (%)
55 (max) 53 (max)
Material passing 75
µm (%) 1 (max) 7 (max)
10% fineness value
(kN)
50 to
150
Chloride content
0.04
(max)
0.4
(max) 0.25(max)
ASR
Harmless Harmless
Flakiness index (%) 40
[Ɨstructural use,* Smith 2009, **Li 2008]
2.7.1.2 Slump
Slump value represents the consistency and workability of fresh concrete. Topcu and
Sengel (2004) showed that at a fixed water cement (w/c) ratio, the workability decreases with the
increased amount of recycled aggregate replacement which consequently decreases the slump

20
value of RAC. The loss of slump is higher in case of over dry recycled aggregate at similar w/c
ratio. Yang et al. (2008) studied the mechanical and durability properties of RAC. In terms of
the fresh concrete properties such as slump, they found that as the percentage (%) of recycled
aggregate increased in the concrete, the concrete slump slightly decreased. However, since the
reduction in slump was very small, it can be offset with the use of admixtures. Poon et al (2004)
found that after adjusting the required amount of water content of air dry RCA as per its actual
moisture state the slump value was 100 mm for RAC made with 50% RCA where it was 110-
100mm for NAC.
2.7.1.3 Air content
Salem et al. (2003) obtained that air content of RAC is higher than NAC. This means that
RAC contains high amount of entrapped air compared to NAC. Similar observation was found
by Katz (2003).
2.7.1.4 Initial and final setting time
Hansen and Hedegkd (1984) found that admixtures of parent concrete does not influence
the initial and final setting time of RAC.
2.7.2 Properties of Hardened RAC
Hardened concrete properties reveal the strength and durability properties of concrete. In
an experimental study Tavakoli and Soroushian (1996) showed that several factors are correlated
with the strength of RAC. Original/parent concrete strength has a significant impact on the
strength of RAC. RAC strength properties are also affected by coarse aggregate replacement
level. They found that the values of flexural, compressive and splitting tensile strength of RAC

21
differed from conventional concrete. Following section discusses about the different types of
physical and mechanical properties of RAC.
2.7.2.1 Physical properties
2.7.2.1.1 Permeability
Concrete made with recycled aggregate has higher permeability by 10-45%than that of
NAC almost. Mainly the permeability property of RAC depends on aggregate source (Zaharieva
et al. 2003,Abou-Zeid et al. 2005). The water absorption of recycled concrete aggregate is higher
than virgin aggregate. During the harden stage of concrete this water evaporates and causes
porosity. Extension of curing period can produce fine pore and thus help reducing the
permeability of RAC by 50% (Zaharieva et al. 2003)
2.7.2.1.2 Porosity of concrete
Gomez-Soberon (2002) examined the porosity of concrete made with recycled aggregate
and investigated different properties of RAC such as, the threshold ratio, critical pore ratio,
average pore ratio, and theoretical pore radius of concrete. These properties were examined
mainly at the age of 7, 28, and 90 days. These test results indicated that replacing natural
aggregates with recycled coarse aggregates yielded an increase in porosity. The tensile and
compressive strengths of RAC are decreased with increased porosity. It was also found that the
modulus of elasticity decreases with the increased porosity. It is difficult to find a proper relation
between the total porosity and properties of RAC. It can be improved by distributing the pore
radius. Table 2.8 represents the pore radius of concrete at 90 days.

22
Table 2.8: Pore radius of different concrete mixes at 90 days (after Gomez-Soberon 2002)
Mix Pore radius (nm)
Control 18.8
30% RCA 19.6
60% RCA 21
100% RCA 24.7
2.7.2.1.3 Coefficient of thermal expansion
Smith and Tighe (2009) conducted an experimental study to find the impact of recycled
concrete aggregate on the coefficient of thermal expansion (CTE) of RAC. They concluded that
the concrete performance improves with the increasing percentages of recycled aggregate. They
found that CTE values were 7.28×10⁻⁶/ᵒC and 4.10×10⁻⁶/ᵒC for virgin concrete and 50% RCA,
respectively. On the other hand Yang et al. (2003) results conflict with Smith and Tighe (2009)
findings. Yang et al. (2003) stated that the RCA concrete has higher CTE value. They found
8.9×10⁻⁶/ᵒC and 11.6×10⁻⁶/ᵒC CTE values for cylinder and prism RCA specimens,
respectively.
2.7.2.1.4 Ultra sound pulse velocity
NAC ultra sound pulse velocity is around 69-70 µs and this value increases for RAC which
is approximately 92-93 µs (Topcu 1997).
2.7.2.2 Mechanical properties
Researchers have been exploring the possibility of using recycled aggregate especially
C&D wastes since 1970. Several researchers (Yang et al. 2008, Poon et al. 2004, Etxeberria et al.
2007) found that similar/comparable strength can be achieved by concrete made with RCA
instead of natural coarse aggregates. Best match was observed between RAC and conventional

23
concrete when recycled aggregate contained less amount of attached mortar (Yannas 1977).
Following portion discusses the mechanical behavior of RAC.
2.7.2.2.1 Compressive strength
The compressive strength of RAC is greatly influenced by the recycled aggregate
replacement ratio and the effective w/c ratio (Ulloa et al. 2013). Higher variation in terms of the
compressive strength is observed for 100% replacement where it is comparatively low for lower
replacement levels such as 20% to 50%. Alam et al. (2013) found that almost 15% reduction in
compressive strength as compared to control mix for 25% to 50% RCA concrete.
Test result by Hansen and Narud (1983) indicated that if all other factors are kept constant
then RAC compressive strength is greatly influenced by the w/c ratio of original/parent concrete.
The strength of RAC will be equivalent or better than NAC if its w/c ratio is lower or at least
similar to that of original concrete.
Yannas (1977) conducted an experimental investigation to examine and compare the
mechanical behavior of recycled and conventional concrete. It was found that the compressive
strength and modulus of elasticity of concrete made with RCA were 76% and 60% to 80% of
that of conventional concrete, respectively. Later, Crentsil and Brown (2001) found no major
difference between the compressive strength of control concrete and RAC.
High strength and high performance RAC mechanical behaviors were investigated by
Ajdukiewicz and Kliszczewicz (2002). In their study, 40-70 MPa concrete were used for
producing recycled aggregate. They concluded that for producing RAC with similar workability,
a modification in water content is required in the mix design. This study reflected the conclusion
drawn by Tavakoli and Soroushian (1996). Ajdukiewicz and Kliszczewicz (2002) reported a

24
reduction in the compressive strength of RAC by 10%, whereas Yannas (1977) found a reduction
of 24%. Juan and Gutierrez (2006) suggested that for producing good quality of structural
recycled concrete aggregates the attached mortar content should be below 44%. They found that
the compressive strength of recycled concrete made using this quality recycled concrete
aggregates are generally not lower than 25MPa.
Yang et al. (2008) used different recycled aggregate replacement levels (30%, 50%, and
100%) to produce 40 MPa concrete with recycled aggregate and a water-cement ratio of 50% by
weight. They found that any replacement level of recycled concrete aggregate will produce
concrete with the same compressive strength as what is normally found for NAC. Figure 2.2
shows the results of compressive strength of RAC with different RCA replacement levels found
by Yang et al. (2008). From this figure, it is evident that irrespective of RCA replacement levels,
the compressive strength remains almost constant.
Figure 2.2 The effect of recycled concrete aggregate on concrete compressive strength (after
Yang et al. 2008)
0
5
10
15
20
25
30
35
40
45
50
0 25 50 75 100
Co
mp
res
siv
e S
tre
ng
th
(MP
a)
Curing Time (days)
0% RCA
30% RCA
50% RCA
100% RCA

25
Limited studies and experimental data are available regarding the use of RCA in high
strength concrete. Acker (1996) produced high strength concrete using three different
replacement percentages of RCA (5%, 10% and 12.5%). With 30% RCA, Limbachiya et al.
(2000) achieved a compressive strength of 80 MPa at 28th day. Their aim was to produce high
strength concrete (50 MPa or more) using RCA. They used rejected precast structural concrete
elements as RCA. Their study showed that there was no significant effect in concrete strength up
to 30% replacement of coarse aggregate by RCA. They suggested that if more than 30% RCA
replacement levels are used, it can reduce the strength of RAC. Table 2.9 shows the variations of
compressive strength of RAC with different RCA replacement levels compared to NAC.
Table 2.9: Variation in compressive strength of RCA concrete
Replacement
Level
Variation in Compressive
Strength as compared to
natural concrete
Reference
25% 9% Increase Etxeberria et al. 2007
25% 15% Decrease Alam et al. 2013
30% 10% Decrease Yang et al. 2008
30% 9.5% Decrease Kwan et al. 2012
30% Similar Limbachiya et al. 2000
50% 11% Increase Etxeberria et al. 2007
50% 14.7% Decrease Alam et al. 2013
50% 5% Decrease Yang et al. 2008
50% 5% Decrease Limbachiya et al. 2000
60% 30% Decrease Kwan et al. 2012
100% 7.7% Increase Etxeberria et al. 2007
100% 11% Decrease Yang et al. 2008
100% 2.4% Increase Salem et al. 2003
100% 8.9% Decrease Limbachiya et al. 2000
100% 8% Decrease Ajdukiewicz and Kliszczewicz 2002

26
2.7.2.2.2 Hardness
The hardness value depends on RAC’s compressive strength. If the compressive strength
decreases, the hardness value also decreases. Very little information is available in the literature
regarding the hardness of RAC. Topcu (1997) found the hardness value for natural concrete as
21.3 MPa, while it declines and becomes 11.6 MPa for 100% RAC.
2.7.2.2.3 Flexural strength
Conflicting results are observed from the literature regarding the impact of recycled
aggregate on the flexural strength of concrete. Table 2.10 provides a summary of the variation in
flexural strength as a function of RAC replacement level obtained by different researchers.
Several researchers concluded that use of recycled aggregates in concrete production decreases
the flexural strength of RAC (Alamet al. 2013, Katz 2003). Zaharieva (2004) showed that
concrete made with recycled concrete aggregate flexural strength was 10-20% less than virgin
concrete. On the other hand, Poon et al. (2002) found that concrete made with 100% recycled
concrete aggregate flexural strength was13% higher than virgin concrete. Conversely, Alam et
al. (2013) found a reduction of 16% in flexural strength of RAC made with 25% RCA.
Table 2.10: Variation in flexural strength of RCA concrete
Replacement
Level
Variation in Flexural Strength as
compared to natural concrete
Reference
25% 2.2% Increase Poon 2002
25% 16% Decrease Alam et al. 2013
50% 6.25% Increase Poon 2002
50% 32% Decrease Alam et al. 2013
75% 10.8% Increase Poon 2002
100% 13% Increase Poon 2002
100% 31% Decrease Katz 2003

27
2.7.2.2.4 Tensile strength
Like flexural strength, researchers have come up with contradictory conclusions regarding
the tensile strength of RAC. Table 2.11 shows the variation in tensile strength results of RAC
found in different experimental studies. Tensile strength of RAC is decreased with the increased
porosity (Gomez-Soberon 2002). Ajdukiewicz and Kliszczewicz (2002) found that the tensile
strength value of RAC was 10% smaller than NAC. However, Etxeberria et al. (2007) and Alam
et al. (2013) found higher tensile strength for RAC.
Table 2.11: Variation in tensile strength of RCA concrete
Replacement
Level
Variation in Tensile Strength as
compared to natural concrete
Reference
15% Similar Gomez-Soberon 2002
25% 6% Increase Etxeberria et al. 2007
25% 34%% Increase Alam et al. 2013
30% 2.7% Decrease Gomez-Soberon 2002
50% 18% Increase Etxeberria et al. 2007
50% 16% Increase Alam et al. 2013
60% 8% Decrease Gomez-Soberon 2002
100% 2% Decrease Etxeberria et al. 2007
100% 10.8% Decrease Gomez-Soberon 2002
2.7.2.2.5 Modulus of elasticity
Depending on the RCA replacement level and water-cement ratio the modulus of elasticity
of RAC is 50-70% of NAC (Rao 2005, Ajdukiewicz and Kliszczewicz 2002, Oliveira et al.
1996).To improve the quality of RAC a new technique was proposed by Qian et al. (2011). Their
technique is known as shucking technique which was established as a secondary process for
improving the performance of simply crushed recycled aggregate. Qian et al. (2011) investigated

28
the elastic modulus of shucking RAC made with RCA and reported improved strength and
elastic modulus properties of shucking RAC compared to commonly used RAC.
2.7.2.2.6 Drying shrinkage
Crentsil and Brown (2001) concluded that the drying shrinkage of RAC is higher than
NAC. Replacement ratio significantly influences the drying shrinkage of RAC. The value of
drying shrinkage increases with the increased recycled aggregate replacement ratio (Poon et al.
2002). They reported that the drying shrinkage of RAC increases by 5%, 10%, 15%, and 27.5%
for RCA replacement levels of 25%, 50%, 75%, and 100%, respectively.
2.7.2.3 Durability of Recycled Concrete
RAC properties can be better understood by investigating the durability properties. The
durability properties of RAC were studied by several researchers (Olorunsogo and Padayachee
2002, Yang et al. 2008, Zaharieva 2004, Kwan et al. 2012). RAC with variable percentages of
RCA (0%, 50% and 100%) were studied by Olorunsogo and Padayachee (2002). They found that
if the RCA level is increased, the durability property of RAC decreases. The quality of RAC can
be enhanced with the curing age. Following section discusses the durability properties of RAC.
2.7.2.3.1 Freezing and thawing resistance
Different types of opinions are found about the freeze thaw resistance of RAC. Gokce et al.
(2004) investigated the freeze thaw durability of RAC. They showed that it depends on the
source of parent concrete. RAC made with air entrained recycled aggregate showed better
performance than RAC made with non-air entrained recycled aggregate. Non-air entrained
concrete has higher mass loss than air entrained concrete. The relative dynamic modulus of
29
elasticity of RAC originated from air entrained concrete was approximately 90% or above after
exposed to 500 freeze thaw cycles. On the other hand only 60% of the relative dynamic modulus
of elasticity observed after exposed to 500 freeze thaw cycles when RAC originated from non-air
entrained concrete. Salem and Burdette (1998) and Zaharieva et al (2004) reported that recycled
aggregate originated from concrete made with air entrained admixture produced high quality
freeze thaw resistance concrete. Kasai et al. (1988) found that high replacement ratio of RAC
declines the frost resistance of new concrete and also suggested that it is better not to use
recycled concrete aggregate in sever freeze thaw exposure condition. Yamato et al. (1988)
examined the durability of RAC under freezing and thawing condition. They concluded that
RAC resistance was less than NAC. For freeze thaw, small reduction in resistance was observed
up to 30% replacement of recycled aggregate.
2.7.2.3.2 Carbonation
Many researchers reported that the carbonation depth of RAC is 1.3 to 2.5 times higher
than virgin concrete (Levy-Salomon and Paulo 2004, Katz 2003, Crentsil et al. 2001, Shayan
and Xu 2003). Otsuki et al. (2003) concluded that slightly higher carbonation depth was
observed for RAC than the original concrete with similar water cementing ratio. Presence of
attached mortar increases the permeability of RAC and thus increases the carbonation depth of
concrete.
2.7.2.3.3 Corrosion
Chloride, sulphate and carbonate exposure conditions are mainly responsible for the
corrosion of concrete. Shayan and Xu (2003) observed less corrosion risk for RAC using half-
cell potential test.

30
2.7.2.3.4 Alkali-silica resistance (ASR) and alkali carbon resistance (ACR)
Fly ash can improve alkali-silica reactivity up to an acceptable limit but as per CSA
guideline fly ash content should not be more than 25% of total cementing material. No
significant improvement was observed for incorporating 15% fly ash (Li and Gress 2006).
Shayan and Xu (2003) reported that recycled concrete aggregate has better alkali aggregate
reactivity.
2.7.2.3.5 Sulfate resistance
Shayan and Xu (2003) found that RCA concrete sulphate resistance was more than NAC,
and after one year exposure the related expansion was less than 0.025%.
2.7.2.3.6 Chloride penetration resistance
Chloride penetration is one of the major causes which generate corrosion in concrete.
Shayan and Xu (2003) obtained almost 2.2 to 2.3 mm higher penetration depth for RAC than
NAC after exposed to chloride solution.
2.7.2.3.7 Chloride content
ACPA (1993) stated that Chloride contents of recycled coarse and fine aggregates were
0.7%-0.9% and 0.03%, respectively which are less than ACI acceptable limit. But Hansen and
Hedegkd (1984) obtained 0.69% soluble chloride ion by weight of cement in concrete made with
recycled concrete aggregate which was higher than ACI acceptable limit.
2.7.2.3.8 Chloride conductivity
Chloride conductivity is the diffusion rate of chloride ions inside the concrete (Olorunsogo
and Padayachee 2002, Smith 2009). It is possible to decrease the chloride conductivity of

31
concrete by increasing the curing of concrete. As the amount of recycled aggregate increases it
automatically decreases the conductivity of RAC. The presence of cracks and fissures during the
processing of recycled aggregates may influence this phenomenon. As a result RAC becomes
more susceptible in terms of absorption, permeation, and diffusion of liquid substances
(Olorunsogoand Padayachee 2002).
Table 2.12 presents comparative performance of RAC produced by both fine and coarse
aggregate replacement. The results are provided in terms of expected changes in concrete
properties from similar mixes using natural aggregate.
Table 2.12: Comparative analysis of concrete properties made from recycled concrete aggregate
(after ACI Committee 555, 2001)
Property RAC made with coarse and
fine recycled concrete
aggregate
RAC made with coarse
recycled concrete aggregate
Corrosion Rate May be faster May be faster
Air Content Slightly higher Slightly higher
Water Bleeding Less Slightly less
Workability Slightly to significantly lower Similar to slightly lower
Water Demand Much greater Greater
Finishability More difficult Similar to more difficult
Compressive Strength 15% - 40% less 0% - 24% less
Carbonization Up to 65% more Up to 65% more
Tensile Strength 10% - 20% less 0% - 10% less
Permeability 0% - 500% more 0% - 500% more
Strength Variation Slightly more Slightly more
Creep 30% - 60% more 30% - 60% more
Modulus of Elasticity 25% - 40% less 10% - 33% less
Freeze-Thaw Durability Depends on air void system Depends on air void system
Coefficient of thermal
expansion
0% - 30% more 0% - 30% more
ASR Less susceptible Less susceptible
Drying Shrinkage 70% - 100% more 20% - 50% more
Sulfate Resistance Depends on mix Depends on mix
Specific Gravity 5% - 15% less 0% - 10% less

32
2.8 MIX DESIGNS FOR RAC
Introduction of a proper guideline for RAC mix design could result in a dramatic increase
in the application of the recycled concrete aggregate in concrete industry. ACI-555R provides
some guidelines about the mix proportion of RAC. But these sources don’t provide the proper
mix design method for gaining hardened and fresh characteristics of RAC. These guidelines
were mainly based on conventional mix proportioning method. To give a new dimension in RAC
mix design Fathifazl et al. (2009) proposed the equivalent mortar volume method for RAC. In
the equivalent mortar volume method they predicted RAC as a two phase material cluster of
cement paste and natural aggregate. Total mortar volume in RAC must be equal to the total
mortar volume in NAC for their proposed method. A large number of mixes were made by them
using their proposed and conventional method. By applying their equivalent mortar volume
method they obtained higher slump for RAC. In RCA concrete, fine aggregate and cement
amount can be significantly reduced by using this equivalent mortar volume method. By utilizing
this method, they observed similar mechanical properties for both RAC and standard NAC.
Lin et al. (2005) used taguchi method to maintain the quality of recycled aggregate. Bairagi
et al. (1990) found out the suitable mix design method for RAC from existing mix design
methods. They suggested an empirical equation for modifying influencing factor. Their
suggested modified procedure requires 10% extra cement but it improves the quality of RAC.
Kwan et al. (2012) found that the DoE (Department of Environment, UK, 1988) method is
good for RAC’s mix design with up to 80% RCA replacement of the total coarse aggregate
content of the mix. They observed that the level of RCA replacement is directly proportional to
the water absorption of concrete. They concluded that up to 30% substitution of coarse

33
aggregate, no significant change was observed in compressive strength which was quite similar
to the finding of Limbachiya et al. (2000).
2.9 CLOSURE
This chapter has presented a detailed review of the state-of-the-art knowledge available on
the mechanical and durability properties of RAC. This review provides an insight into the
current research activities and applications relating to development of RAC. Because of its wide
variation in mechanical properties found from different experimental studies, the application of
RAC in commercial projects is still limited. Since its inception, researchers have investigated
the properties of RAC by varying the replacement levels, mix proportions, and other factors.
This study summarized the variation of different experimental studies found in different parts of
the world along with their features and results. This study also identified the gaps in existing
literature and the remainder of the thesis is outlined to fill up some of those research needs for
commercial application of RAC.

34
Chapter 3: MECHANICAL BEHAVIOR OF RECYCLED AGGREGATE
CONCRETE (RAC) MADE WITH DIFFERENT REPLACEMENTLEVELS
OF RECYCLED COARSE AGGREGATE (RCA)
3.1 GENERAL
Engineers and researchers are always striving and exploring different ideas to utilize
various industrial wastes to produce concrete for construction. Determining the characteristics
and behavior of these different types of concrete has become an important research stream in
order to exploit them in mix design. Compressive strength is the most important characteristics
of concrete that dictates its durability. Due to its worldwide availability, comparatively low cost,
and ability to take any form and shape, concrete has emerged as the most widely used
construction material all over the world. According to Cement Association of Canada, every year
15 billion tonnes of concrete is produced throughout the world (Cement Association of Canada
2012). This widely accepted construction material, however, has some disadvantages such as
greenhouse gas emissions during the production, consumption of limited natural resources. The
overall production process of concrete contributes approximately 5% of the greenhouse gas
(GHG) emissions produced each year (Concrete Association of Canada 2012). To help reducing
the environmental impacts of concrete production, researchers and industries are continuously
investigating to find new ways and come up with innovative idea of producing concrete with
reduced environmental impact. Nowadays, RAC as a coarse aggregate has become a trade mark
for sustainable design of concrete production that has potentials for construction projects to
achieve LEED (Leadership in Energy and Environmental Design) certification (USGBC 2014).
Before any mass application of a new concrete mix, it is important to investigate its mechanical

35
and durability properties. The main objective of this study is to investigate the mechanical and
durability characteristics of concrete made with different replacement levels of recycled coarse
aggregate (RCA) with an aim to escalate the commercial production of this new concrete and its
application in the Okanagan Valley. This chapter focuses on the fresh and hardened properties of
RAC and its comparison with NAC (control). This chapter also discusses the properties of
different types of aggregate which were used in this study.
3.2 SOURCES OF AGGREGATES
One of the main objectives of this study is to produce 25 MPa RAC with different
replacement levels of RCA and compare it with NAC. Natural aggregate and recycled concrete
aggregate were used as coarse aggregate for the production of concrete. Natural sand was used as
fine aggregate for production of both natural and recycled concrete. Recycled fine aggregate was
not considered in this study due to high absorption of such aggregate. Moreover, many
impurities associated with recycled fine aggregate can reduce concrete strength. It is usually not
recommended to use recycled fine aggregate for the production of concrete (BSI 2006, Hasan
1992, DIN 2002, Marinkovic et al. 2010,Rilem TC 121-DRG1994). High water absorption and
high cohesion of recycled fine aggregate cause difficulties to control RAC production. Control
mix was produced using 100% natural coarse aggregate. Natural aggregate with a maximum size
of 20 mm was used in this study.
RCA source plays a vital role for achieving desired properties of concrete. Recycled coarse
aggregate with a maximum size of 14 mm was used in this study. The source of recycled
aggregate is often unknown. It is very beneficial for this study to represent the practical situation.
If gross commercial production is taken into consideration then it is very difficult to track the

36
source of recycled aggregate. Recycled aggregates are usually produced from demolished
concrete. Normally demolished concrete is collected from landfills and it is very hard to identify
the sources because those concrete come from different sources like bridges, buildings,
sidewalks, pavements, hydraulic structures, and other structures. Smaller size RCA (14mm) was
obtained after several crushing stages to minimize the amount of adhered mortar content. RAC
strength can be negatively affected by RCA over 19mm. Interfacial transition zone of RCA
would increase for aggregate size over 19 mm which may have some negative impact on the
strength of RAC made with RCA (Smith 2009).
3.3 PROPERTIES OF AGGREGATES
Different types of aggregate testing were performed for the natural coarse aggregate,
natural fine aggregate (sand), and RCA. The results of various aggregate property tests are
discussed in the following sections.
3.3.1 Gradation
Fresh and hardened properties of concrete can be affected by the gradation of aggregate.
Improper gradation can affect the air content, slump, and result in excessive voids in the
hardened concrete. Sieve analyses of coarse and fine aggregates were performed according to
CSA A23.2-2A (CSA 2009). The upper and lower limits in CSA A23.2-2Awere used to check
the gradation standard of different types of aggregates used in this study. The fine and coarse
natural aggregate has a maximum nominal size of 5 mm and 20 mm, respectively. Figures 3.1a
and 3.1b show the aggregate gradation curve of natural fine and coarse aggregates, respectively.
These two graphs illustrate that both the fine and coarse natural aggregates are well graded and
within the CSA limit.

37
0
20
40
60
80
100
1 10 100
Passin
g (%
)
Sieve Opening (mm)
CSA Lower
CSA Upper
Coarse NA
(b)
0
20
40
60
80
100
0.01 0.1 1 10
Passin
g (%
)
Sieve Opening (mm)
CSA Lower
CSA Upper
Fine NA
(a)
0
20
40
60
80
100
1 10 100
Passin
g (%
)
Sieve Opening (mm)
CSA Lower
CSA Upper
RCA
(c)
Figure 3.1 Sieve analyses of (a) Natural fine aggregate, (b) Natural coarse aggregate, and (c)
Recycled coarse aggregate (RCA)
In this study, various percentages of RCA were used as a substitute of natural coarse
aggregate. It was also critical to check whether its gradation falls within the CSA limits as their
parent concrete source was unknown. The gradation of RCA is illustrated in Figure 3.1c. This
can be noted that RCA has a well gradation and has a nominal maximum size of 14 mm.
3.3.2 Bulk Density, Specific Gravity, and Moisture content of Aggregates
The specific gravity (relative density) and absorption capacity of natural and recycled
coarse aggregates were determined according to CSA A23.2-12A (CSA 2009). The results of
different types of aggregate properties tests are shown in Table 3.1. The specific gravity of RCA
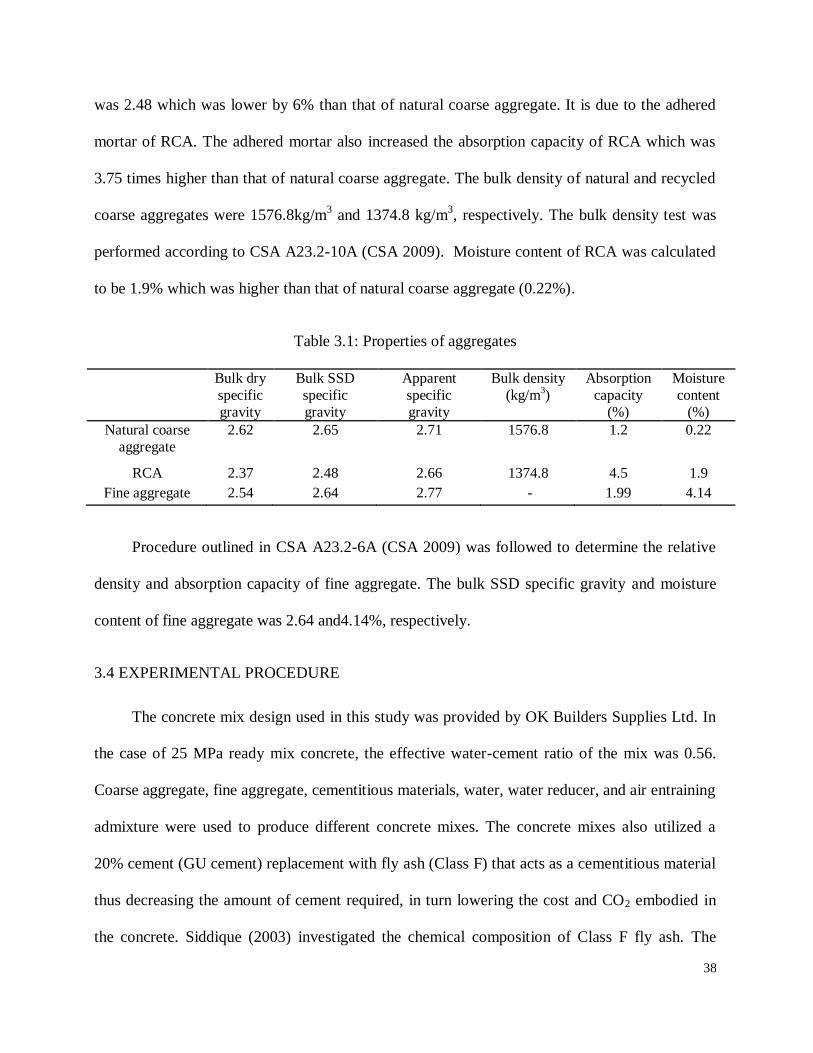
38
was 2.48 which was lower by 6% than that of natural coarse aggregate. It is due to the adhered
mortar of RCA. The adhered mortar also increased the absorption capacity of RCA which was
3.75 times higher than that of natural coarse aggregate. The bulk density of natural and recycled
coarse aggregates were 1576.8kg/m3 and 1374.8 kg/m
3, respectively. The bulk density test was
performed according to CSA A23.2-10A (CSA 2009). Moisture content of RCA was calculated
to be 1.9% which was higher than that of natural coarse aggregate (0.22%).
Table 3.1: Properties of aggregates
Bulk dry
specific
gravity
Bulk SSD
specific
gravity
Apparent
specific
gravity
Bulk density
(kg/m3)
Absorption
capacity
(%)
Moisture
content
(%)
Natural coarse
aggregate
2.62 2.65 2.71 1576.8 1.2 0.22
RCA 2.37 2.48 2.66 1374.8 4.5 1.9
Fine aggregate 2.54 2.64 2.77 - 1.99 4.14
Procedure outlined in CSA A23.2-6A (CSA 2009) was followed to determine the relative
density and absorption capacity of fine aggregate. The bulk SSD specific gravity and moisture
content of fine aggregate was 2.64 and4.14%, respectively.
3.4 EXPERIMENTAL PROCEDURE
The concrete mix design used in this study was provided by OK Builders Supplies Ltd. In
the case of 25 MPa ready mix concrete, the effective water-cement ratio of the mix was 0.56.
Coarse aggregate, fine aggregate, cementitious materials, water, water reducer, and air entraining
admixture were used to produce different concrete mixes. The concrete mixes also utilized a
20% cement (GU cement) replacement with fly ash (Class F) that acts as a cementitious material
thus decreasing the amount of cement required, in turn lowering the cost and CO2 embodied in
the concrete. Siddique (2003) investigated the chemical composition of Class F fly ash. The

39
chemical composition of Class F is given in Table A1 (Appendix-A). The use of fly ash also aids
in the sulphate and chloride resistance by forming a tighter concrete matrix thereby reducing the
permeability and rate of chemical infiltration. Glenium 3030NS (BASF 2013) and Micro Air
(BASF 2013) were used as water reducing admixture and air entraining admixture, respectively.
Table3.2 shows the mix proportions for the various designs that were tested for this study.
Table 3.2: Mix proportions
Mix component
Mix 1 Mix 2 Mix 3 Mix 4 Mix 5 Mix 6
(Control) (30%
RCA)
(40%
RCA)
(50%
RCA)
(75%
RCA)
(100%
RCA)
Cementing
materials
GU cement 208 208 208 208 208 208
Fly ash 52 52 52 52 52 52
Fine
aggregate
Natural
aggregate 807.6 807.6 807.6 807.6 807.6 807.6
Coarse aggregate
Natural
aggregate 1040.7 728.5 624.4 520.4 260.2 0
Recycled aggregate
0 312.2 416.3 520.4 780.5 1040.7
Water 150 150 150 150 150 150
Water
reducer
Glenium
3030 468 ml 468 ml 468 ml 468 ml 468 ml 468 ml
Air
entraining admixture
Micro air 120 ml 120 ml 120 ml 120 ml 120 ml 120 ml
As presented in Table 3.2, six different concrete mixes were designed with varying levels
of RCA replacement. The RCA content used to replace a portion of the natural coarse aggregate
varies from 30-100 % with a 0% RCA replacement as the control mix (Mix-1). Control mix
made with conventional aggregate (NA) was required to facilitate the proper comparison
between RCA concrete and NAC. The control specimens also facilitated as a reference for
comparing the durability performance and quantify any change in the concrete specimen’s

40
degradation with increasing RCA content. All other mix components remained constant to
ensure that the test results only reflect the effect of changing the RCA proportions. The
mechanical properties of concrete are only discussed in this chapter and the next chapter
(Chapter 4) covers the durability aspects of RAC. To investigate the mechanical property of
concrete, compressive strength test was done according to CSA A23.2-9C (CSA 2009).
Moreover, fresh concrete properties were investigated by performing slump and air content test.
For each concrete batch produced, it was decided that 12 cylinders were to be cast to allow for 7,
28, 56, and 148 days test for compressive strength test. As a result, a total of 72 concrete cylinder
specimens were produced. According to CSA A23.2-3C (Clause 7) (CSA 2009), ∅100 x 200
mm cylinder specimens were cast.
Concrete mixing was performed according to the requirements outlined in CSA A23.2-2C
(CSA 2009). Mixer drum was used for mixing concrete ingredients. The water reducing
admixture and air entraining admixture were added to water just before it was added to the mixer
drum. At first, half of the mixing water was added with coarse aggregates into the mixer drum
and then it was started for mixing. Fine aggregate, GU cement, fly ash along with rest of the
water were added into the mixer and was allowed to run for further 3 minutes. After that, it was
rested for another 3 minutes followed by an additional2 minutes of finial mixing.
Each mix’s fresh concrete slump was measured following the guideline mentioned in CSA
A23.2-5C (CSA 2009) using a standard slump cone. Air content of fresh concrete was measured
according to CSA A23.2-4C (CSA 2009).Fresh concrete samples for slump and air content tests
were taken from the same batch to maintain the consistency of results of fresh concrete
properties.

41
The compressive strength tests specimens were cured inside a moisture monitored curing
chamber according to CSA A23.2-3C (Clause 7.3.1) (CSA 2009). Those concrete cylinders were
demolded after 24 hours of casting and were then placed immediately in the automated humidity
controlled curing chamber. The cylinders were taken out from the curing chamber and dried
before testing on the specified dates.
3.5 RESULTS AND DISCUSSION
3.5.1 Results of fresh concrete properties
The 25 MPa concrete mix was designed for a 90 mm target slump. The results of the fresh
concrete properties are provided in Table 3.3. This table shows that the slump value of different
concrete mixes remained unaffected due to the utilization of different replacement levels of
RCA. The CSA requirement of air content for the 14-20 mm nominal maximum sizes of
aggregates is 5-8% for category-1. From Table 3.3it can be seen that the air content of Mix- 1
(control) and Mix-6 (100% RCA) were 5.7% and 5.5%, respectively.
Table 3.3: Properties of fresh concrete
Mix 1 Mix 2 Mix 3 Mix 4 Mix 5 Mix 6
Slump (mm) 110 110 110 100 100 95
Air content (%) 5.7 5.8 5.8 6 5.6 5.5
[Mix-1 = Control, Mix-2 = 30% RCA, Mix-3 = 40% RCA, Mix-4 =50% RCA, Mix-5 =75%
RCA, and Mix-6 =100% RCA]
3.5.2 Results of Compressive Strength
The cylinder compression tests were conducted after 7, 28, 56, and 148 days of curing and
the results are presented in Figure 3.2 and Table 3.4. Compressive strength versus age graph is
depicted in Figure 3.2 illustrating that as the percentage of RCA replacement increases the
compressive strength decreases. Inadequate hydration and weak interfacial transition zone (ITZ)

42
between the components of concrete cluster caused by the high amount of attached mortar on the
surface of recycled aggregate are the major reasons behind the strength degradation of RAC with
the increased replacement level of RCA (Yang et al 2008, Tu et al. 2006). It is also influenced by
the low bulk density and adhered mortar of RCA. On the other hand, 148 days’ compressive
strength of Mix-2 (30% RCA replacement) was higher than Mix-1 (control). Mix-1 compressive
strength was 24.1 MPa at 148 days which was 5.5% less than the compressive strength of Mix-2
at the same age. This was due to the rough texture and higher absorption capacity of RCA.
Presence of adhered mortar increases the absorption capacity of RCA and crushing of
demolished concrete makes aggregate surface rough. Both of these properties of RCA lead to
better interlocking and bonding between the RCA and cement paste as compared to natural
aggregate concrete (Salem and Burdette 1998, Etxeberria et al. 2007). Within the considered
time period the highest compressive strength was gained by Mix-2 (25.5MPa) and the lowest
was found for Mix-4 (19.8 MPa). The strength gaining pattern of Mix-5 and Mix-6 were almost
similar except at the age of 28 days the compressive strength of Mix-6 was 9.3% lower than that
of Mix-5. Table 3.4 shows the results of compressive strength at different test days and their
percent difference in strength gain with respect to NAC (Mix-1) at the same respective age. The
percent difference in compressive strength between the Mix-1 (control mix) and Mix-6 (100%
RCA replacement) at 148 days was 14.5 %. This illustrated the true loss in strength as a result of
replacing RCA with NA.As the replacement level of natural aggregate by RCA increases, the
percent difference also increases.

43
Figure 3.2 Compressive strength of concrete made with different replacement levels
[Mix-1 = Control, Mix-2 = 30% RCA, Mix-3 = 40% RCA, Mix-4 =50% RCA, Mix-5 =75%
RCA, and Mix-6 =100% RCA]
Table 3.4: Compressive strength results of different concrete mixes
Mix-1 Mix-2 Mix-3 Mix-4 Mix-5 Mix-6
(MPa) (MPa) (MPa) (MPa) (MPa) (MPa)
7 days 12 13.4(11.7%) 9.6(-19.6%) 10.1(-15.5%) 8.7(-27.8%) 8.9 (-25.4%)
28 days 17.1 16.5(-3.6%) 16.3(-4.8%) 14.7(-14.2%) 15.1(-11.6%) 13.7(-19.9%)
56 days 23 22(-4.2%) 18(-21.6%) 18.9(-17.9%) 17.7(-23%) 16.6(-27.8%)
148days 24.1 25.5(5.8%) 19.9(-17.4%) 19.8(-17.8%) 21(-12.9%) 20.6(-14.5%)
[Mix-1 = Control, Mix-2 = 30% RCA, Mix-3 = 40% RCA, Mix-4 =50% RCA, Mix-5 =75%
RCA, and Mix-6 =100% RCA]
Note: the value in braces represents the percent difference in strength gain with respect to Mix-1
In contrast, the percent difference of different concrete mixes decreased at 148th
day which
indicates that the RCA aggregate concrete is more favorable than NAC while considering its
long term strength development. This long term strength is contributed by the unhydrated cement
paste on the exterior surface of RCA (Khatib 2005). Besides, it may be attributed by the
absorbed water of RAC that may work as a source of water to complete the hydration process
(Yang et al 2008).
0
10
20
30
0 30 60 90 120 150
Co
mp
ressiv
e s
tren
gth
(M
Pa)
Age (days)
Mix-1 Mix-2 Mix-3
Mix-4 Mix-5 Mix-6

44
Statistical analyses were carried out to evaluate the variation of the compressive strengths
of six different mixes. Figure 3.3 presents the box plot of data found from the 7, 28, 56, and 148
day compressive strength of RAC made with different RCA replacement levels and its
comparison with control mix (Mix-1). Figure 3.3 shows the variation of compressive strengths in
individual mix proportion where the numerical range (maximum and minimum values) of data is
represented by height. The boxes represent the 1st quartile through 3
rd quartile. The horizontal
line inside the box represents the 50th
percentile (median value).It can be observed that the initial
strength test results (7days) are almost symmetrically/normally distributed for all mixes. In the
case of Mix-1, initially (7, 28, and 56 days) it showed symmetrical distribution but later negative
skewness was observed. On the other hand, Mix-3 experienced negative skewness for 28 and 56
days but later it experienced positive skewness.
Figure 3.3 Variation in compressive strength of different concrete mixes at the age of 7, 28, 56,
and 148 days
[Mix-1 = Control, Mix-2 = 30% RCA, Mix-3 = 40% RCA, Mix-4 =50% RCA, Mix-5 =75%
RCA, and Mix-6 =100% RCA]
5
10
15
20
25
30
Mix-1 Mix-2 Mix-3 Mix-4 Mix-5 Mix-6
Co
mp
ressiv
e s
tre
ng
th (
MP
a)

45
3.5.3 Failure Pattern of Concrete
Failure pattern of RAC made with different RCA were also investigated according to CSA
A23.2-9C (CSA 2009) and compared with NAC. The concrete specimens after the compressive
strength tests are shown in Figures 3.4a-f where different types of failure patterns were observed.
Shearing type of failure was observed for Mix-1,2, and 3. As the RCA replacement level was
increased beyound 40%, the failure pattern also changed. Mix- 4 and Mix-5 experienced cone
and split type failure. In these cases, the concrete was trying to split tangentially or radially and
it coulde bedue to the weak interfacial transition zone of RACwith increased RCA replacement
levels. In each case it was observed that the failure was mainly due to mortar failure.
Figure 3.4 Failure pattern of different concrete mixes (a) Mix-1, (b) Mix-2, (c) Mix-3, (d) Mix-4,
(e) Mix-5, and (f) Mix-6
[Mix-1 = Control, Mix-2 = 30% RCA, Mix-3 = 40% RCA, Mix-4 =50% RCA, Mix-5 =75%
RCA, and Mix-6 =100% RCA]
(a) (b) (c)
(e) (f)(d)

46
Chapter 4: DURABILITY OF RAC MADE WITH DIFFERENT RCA
REPLACEMENT LEVELS: SULPHATE AND CHLORIDE ATTACK
4.1 GENERAL
Durability of concrete was occasionally considered as a design criteria before 1970s. At
that time government officials, design professionals, developers, and builders rarely considered
durability property in a construction project. Later in 1980, “concrete cancer” became a popular
phrase in the society and media. This influenced peoples to grab their attention towards the
durability performance of concrete. As a response, many countries reviewed and incorporated
some changes in their code such as US (NIST 2013), Australia (QCL group 1999), and Europe
(Folić 2009). The deterioration of concrete structures, exposed to aggressive or harsh
environments, is a vital fact that affects the durability of civil infrastructure. This reduces the life
span of civil infrastructures which consequently increases the maintenance cost. Durability
works as a key factor for enhancing the performance and life cycle of concrete structures. The
use of RCA in concrete makes it more susceptible to degradation as these aggregates are more
porous in nature than the natural coarse aggregate concrete. Porosity of RCA raises a concern
about the durability performance of RAC. At this point there is little published material on the
durability performance of RAC. However, before any commercial application, the ready mix
industry would like to ensure that RAC can withstand the harsh environmental exposures. This
chapter assesses the effects of sulphate attack and cyclic wetting and drying along with chloride
exposure of 25MPa RAC made with different RCA replacement levels.
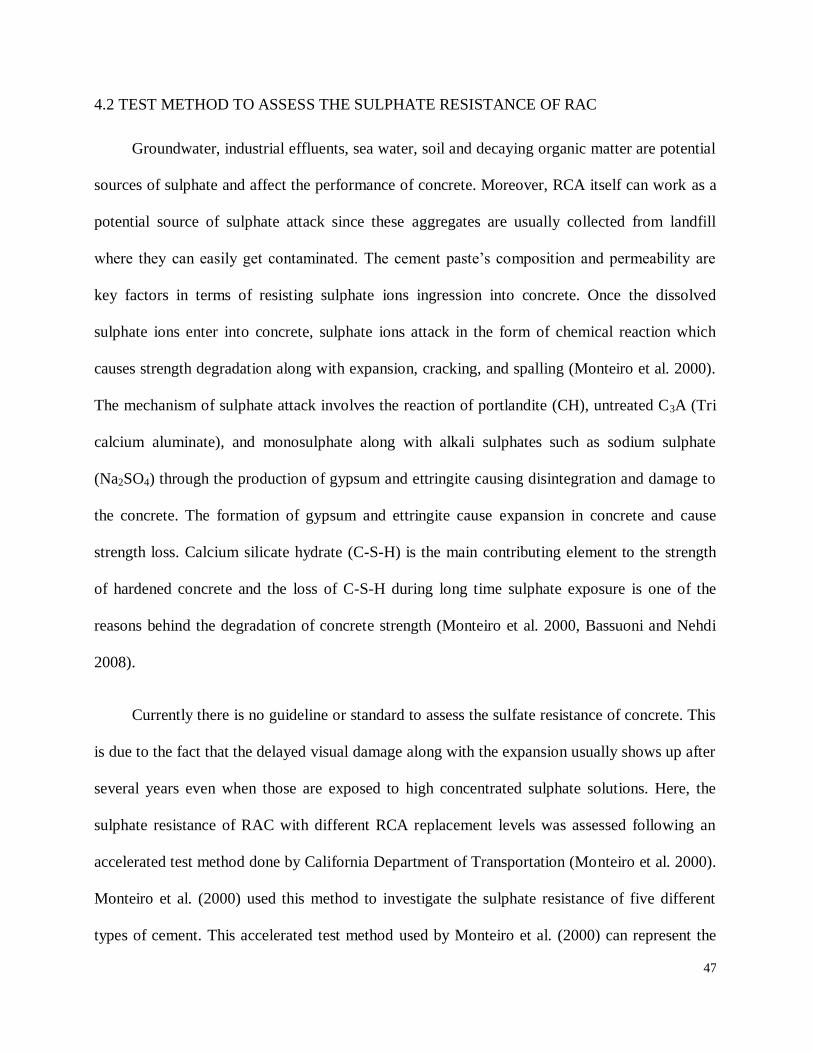
47
4.2 TEST METHOD TO ASSESS THE SULPHATE RESISTANCE OF RAC
Groundwater, industrial effluents, sea water, soil and decaying organic matter are potential
sources of sulphate and affect the performance of concrete. Moreover, RCA itself can work as a
potential source of sulphate attack since these aggregates are usually collected from landfill
where they can easily get contaminated. The cement paste’s composition and permeability are
key factors in terms of resisting sulphate ions ingression into concrete. Once the dissolved
sulphate ions enter into concrete, sulphate ions attack in the form of chemical reaction which
causes strength degradation along with expansion, cracking, and spalling (Monteiro et al. 2000).
The mechanism of sulphate attack involves the reaction of portlandite (CH), untreated C3A (Tri
calcium aluminate), and monosulphate along with alkali sulphates such as sodium sulphate
(Na2SO4) through the production of gypsum and ettringite causing disintegration and damage to
the concrete. The formation of gypsum and ettringite cause expansion in concrete and cause
strength loss. Calcium silicate hydrate (C-S-H) is the main contributing element to the strength
of hardened concrete and the loss of C-S-H during long time sulphate exposure is one of the
reasons behind the degradation of concrete strength (Monteiro et al. 2000, Bassuoni and Nehdi
2008).
Currently there is no guideline or standard to assess the sulfate resistance of concrete. This
is due to the fact that the delayed visual damage along with the expansion usually shows up after
several years even when those are exposed to high concentrated sulphate solutions. Here, the
sulphate resistance of RAC with different RCA replacement levels was assessed following an
accelerated test method done by California Department of Transportation (Monteiro et al. 2000).
Monteiro et al. (2000) used this method to investigate the sulphate resistance of five different
types of cement. This accelerated test method used by Monteiro et al. (2000) can represent the

48
field conditions where their results obtained from this method could yield similar behavior as
found in field conditions. Moreover, ASTM C1012 and C452 (ASTM 2012) cannot represent the
real deterioration pattern of concrete (Mehta et al.1979) since these guidelines are for mortars. It
is very important to investigate the sulphate resistance of RAC concrete due to the presence of
interfacial transition zone which differentiate it from mortar. In this chapter, sulphate resistance
of 25MPa RAC made with different RCA replacement levels (Mix-2 to Mix-6) was investigated
and compared to NAC (Mix-1) following the accelerated test method. The fresh and hardened
properties of these mixes have already been discussed in Chapter 3. Almost similar type of
experimental approach was followed for evaluating the sulphate resistance of RAC by Shayan
and Xu (2003). In accelerated test method, sulphate resistance of RAC was measured in terms of
the strength loss (compressive strength loss) along with expansion during the sulphate exposure.
Expansion only reveals the ettringite formation due to sulphate attack. However, loss in strength
indicates that the cracking occurred due to the gypsum and ettringite formation during the
sulphate exposure (Cohen and Mather 1991, Mehta and Gjorv 1974).
In this study, the sulphate resistance performance was evaluated using 75×150 mm
cylinders. This size was chosen to maximize the surface area to volume ratio. The increased
surface area to volume ratio helped accelerate the effects of the sulphate by increasing the
exposure area. Prism and bar specimens can represent the length expansion more accurately due
to their geometry compared to cylindrical specimens since it has more surface area compared to
its volume. Due to unavailability of such molds we had to work with cylindrical specimens.
Cylinders were cast along with the casting of previously mentioned specimens in Chapter 3.
These cylinders were demolded and then moist cured for seven days in the same moist curing
chamber as mentioned in Chapter 3before being placed in the sulphate bath. Moist curing was

49
done for 7 days to replicate the field condition. Before being placed in the sulphate bath the
diameter and height of each cylinder were measured. Cylinders from each mix were broken
under compression to measure the 7thday strength of that mix. Sulphate bath was prepared one
day before the use with 5% sodium sulphate (Na2SO4) solution and stored at 23 ± 2ᵒC. In the
storage container the ratio of the volume of sulphate solution to the volume of concrete cylinder
was 4± 0.5.The pH of sulphate solution was always maintained around 7 which is close to pH
(7.2) of typical field condition. Sulfuric acid (H2SO4) was added into the sulphate bath to
maintain the pH of sodium sulphate solution. During the testing period pH was monitored twice
everyday with pH strips. As a result, the concentration of sulphate ion remained constant over
the testing period.
Every week all the specimens were taken out from the sulphate bath to measure the
dimension and height of the cylinders. The volume and height changes were determined using
the following equations
% Volume change, 100%
i
it
V
VVV
(4.1)
where Vi = average initial volume of cylinder (mm3); and Vt = average volume of cylinders
after a prescribed exposure period (mm3).
% Height change, 100%
i
it
H
HHH
(4.2)
where, Hi = average initial height of the cylinder (mm); and Ht = average height of the
cylinder after a prescribed exposure period (mm).

50
Visual inspection was also done to determine any sign of deterioration on the specimen.
Compressive strength test was done at the age of 28days, 56 days, and 148 days to evaluate the
loss of strength during the sulphate exposure. The used sodium sulphate solution was discarded
after taking the measurement of cylinders at certain intervals such as at 56 days, 90 days, and
148 days. All the specimens were kept inside the sulphate bath and the changes were monitored
on a regular basis until just before the testing at specified dates. Figure 4.1 shows one of the
storage containers used to soak the specimens in the sulphate solution.
Figure 4.1 Sulphate bath used for sulphate exposure test
4.3 TEST METHOD TOASSESS THE CHLORIDE ION INGRESSION INTORAC
The durability of concrete is greatly affected by the ingress of fluid inside the concrete.
Chloride ions ingress into RAC can significantly affect the durability of RAC as recycled
aggregate porosity is higher than that of natural aggregate. In order to study the chloride ion
ingression into 25 MPa RAC (Mix-2 to Mix-6) and NAC (Mix-1), cyclic wetting in sodium
chloride (NaCl) solution and subsequent drying was considered. In North America NaCl is

51
widely used as a de-icing salt on a regular basis during winter. Therefore, a high concentration of
sodium chloride solution forms on concrete surface and subsequently it penetrates through the
concrete. It is well documented that cyclic wetting and drying increases the chloride ion
ingression into concrete (Moukwa 1990) and thus accelerates the effects to yield faster test
results (Yeomans 1994, Hong and Hooton 1999, Hong 1998).
For chloride exposures the specimen size selected was 100x200mm cylinders. All the test
specimens were cast during the casting of other specimens used for the fresh and hardened
properties of 25MPa concrete. The specimens were demolded and cured inside the moist curing
chamber (relative humidity 100%) for 28 days before being placed in 5% sodium chloride
solution for six hours. After 6 hours of wetting those cylinders were taken out from chloride bath
and placed on a shelf at normal room temperature (21ᵒC) and relative humidity of 65% for
drying. Those cylinders were left there for 18 hours for drying. That means one cycle took 24
hours as shown in Figure 4.2. McCarter and Watson (1997) found that the wetting rate is faster
than drying rate and in some situations it is 3 to 7 times faster. Sodium chloride solution at a
concentration of 5% was prepared using locally available table salt and it was oven dried at
110ᵒC before being mixed with water. To investigate the chloride ion ingression concentration 1,
4, 9, 16, 28, 90, and 120 cycles were considered. After being subjected to these numbers of
cycles, chloride concentration was measured using Ion Chromatography test. Ion
Chromatography test is usually used for water chemistry analysis. In this method ion
concentration is measured by separating them based on their interaction with resin. In this
method small discs were cut from the surface of concrete cylinder using chisel and hammer.
Then these small discs were pulverized using a pulverizer. The powdered concrete was then

52
analyzed using “Ion Chromatography Test”. The chloride concentration was found in units of
parts per million (ppm).
Figure 4.2 Sequence of one wet-dry cycle
Compressive strength test was also done after being subjected to 1, 4, 9, 16, 28, 90, and
120 wetting and drying cycles with 5% sodium chloride solution. This was done to investigate
whether chloride ion ingression has any effect on the strength properties of RAC.
4.4 RESULT AND DISCUSSION
4.4.1 Results of Sulphate Resistance Test
The sulphate durability test was based on the strength loss as well as the changes in volume
and height of the specimen which were measured over time. This indicated how reactive the
specimens were to sulphate and whether one mix was more reactive than the other, thereby
making it less durable. The compressive strengths of concrete with different RCA replacement
levels at different interval of time under sulphate exposure condition are shown in Figure 4.3.
The bar diagram reveals that even under sulphate exposure up to 56 days, the compressive
strengths of all mixes were increasing and later a decreasing phenomenon was observed by all
mixes. Strength increase does not indicate anything about sulphate attack. It only reveals that
Wetting
Drying

53
cement continues to hydrate in sodium sulphate solution during that time and the pores get filled
up with hydrated products along with gypsum and ettringite. Further formation of these products
are responsible for the micro crack development and degradation of concrete strength in the later
period as these products have a considerably greater volume than the compound they replace
during the reaction in sulphate exposure (Neville 2011). The results also indicate that as the RCA
replacement increases the compressive strength decreases. The compressive strength of Mix-1 at
the age of 148 days under sulphate exposure was 14.5 MPa which was 9.8% higher than that of
Mix-2 (13.2 MPa).
Figure 4.3 Sulphate Compressive strength of concrete made with different RCA replacement
level under sulphate exposure
[Mix-1 = Control, Mix-2 = 30% RCA, Mix-3 = 40% RCA, Mix-4 =50% RCA, Mix-5 =75%
RCA, and Mix-6 =100% RCA]
The relative change in compressive strength (∆Cs) found at the age of 148 days after 141
days of sulphate exposure is shown in Figure 4.4 . The change in compressive strength due to
sulphate exposure was measured as a percentage of the strength of each cylinders found after 148
days of moist curing (C148m). The equation is given below:
0
5
10
15
20
25
30
7 28 56 148
Co
mp
ressiv
e s
tren
gth
(M
Pa)
Age (days)
Mix-1 Mix-2 Mix-3
Mix-4 Mix-5 Mix-6

54
100%148
148148
m
mss
C
CCC
(4.3)
where, C148s = average initial compressive strength of cylinders under sulphate exposure at the
age of 148 days (141 days sulphate exposure) (MPa) and C148m = average compressive strength
of moist cured cylinders at the age of 148 days (MPa)
Figure 4.4 shows that after 141 days of sulphate exposure, Mix-6 showed the highest
strength reduction (48%) among the six considered mixes. This is due to the formation of micro
crack for the production of gypsum and ettringite. Presence of old interfacial transition zones
also significantly influences this phenomenon. Mix-1 and Mix-3 performed almost in a similar
fashion. Only exception was Mix-2 (48%) which showed the highest amount of percent strength
reduction as found for Mix-6 though its RCA replacement level was less than the other different
replacement levels of RCA.
Figure 4.5 presents the box plot of data found from the 148 days compressive strength of
moist cured concrete specimens and its comparison with specimens exposed to sulphate for 141
days. It can be seen that after being exposed to sulphate for 141 days, substantial strength
reduction was observed due to sulphate exposure. Mix-1, Mix-2, Mix-3, Mix-4 showed positive
skewness for moist curing specimens where Mix-1, Mix-3 exhibited negative skewness while
being exposed to sulphate. It can be also observed that the strength ranges for sulphate exposed
RAC specimens substantially decreased compared to moist cured specimens, whereas there was
no change in the case of Mix-1.

55
Figure 4.4 The percent (%) change in compressive strength of concrete made with different RCA
replacement levels at the age of 148 days under sulphate exposure with respect to the
compressive strength of moist cured specimens at the same respective age
[Mix-1 = Control, Mix-2 = 30% RCA, Mix-3 = 40% RCA, Mix-4 =50% RCA, Mix-5 =75%
RCA, and Mix-6 =100% RCA]
Figure 4.5 Compressive strength of various concrete mixes
[ a = being exposed to sulphate for 141 days, b = moist curing cylinders at the age of 148 days]
[Mix-1 = Control, Mix-2 = 30% RCA, Mix-3 = 40% RCA, Mix-4 =50% RCA, Mix-5 =75%
RCA, and Mix-6 =100% RCA]
-60 -50 -40 -30 -20 -10 0
Mix -1
Mix -2
Mix -3
Mix -4
Mix -5
Mix -6
% Change in compressive strength
0
10
20
30
Mix-1 Mix-2 Mix-3 Mix-4 Mix-5 Mix-6
Co
mp
ressiv
e s
tren
gth
(M
Pa)
a
b
aaaaa
b
b
b
bb

56
As mentioned earlier the specimens used for sulphate testing were measured on a weekly
basis to monitor the physical changes occurring over time. The height change was increasing
with the increased level of RCA replacement. The importance of the height change is that it is
the larger dimension of the cylinder so it will experience more change than the diameter. Figure
4.6a shows the variation in terms of height change experienced by the specimens over time under
sulphate exposure. The percent (%) height change of Mix-3 and Mix-4 were similar and lower
than Mix-5 and Mix-6 at 56th day. The crumbling of concrete cylinders of Mix-4 was responsible
for this similar value. At the age of 148 days, the highest change was observed for Mix-6 (0.2%)
and it was 48%, 43%, 38%, 33%, and 18% higher than the percent height change of Mix-1, Mix-
2, Mix-3, Mix-4, and Mix-5, respectively. This is due to increased porosity and old interfacial
transition zone of RCA.
Figure 4.6 (a) Height change (%) (b) Volume change (%) of concrete cylinders under sulphate
exposure condition
[Mix-1 = Control, Mix-2 = 30% RCA, Mix-3 = 40% RCA, Mix-4 =50% RCA, Mix-5 =75%
RCA, and Mix-6 =100% RCA]
0
0.07
0.14
0.21
28 56 148
Heig
ht ch
an
ge (
%)
Age(days)
Mix-1 Mix-2 Mix-3
Mix-4 Mix-5 Mix-6
(a)
0
0.1
0.2
0.3
0.4
0.5
0.6
28 56 148
Vo
lum
e c
han
ge (
%)
Age (days)
Mix-1 Mix-2 Mix-3
Mix-4 Mix-5 Mix-6
(b)

57
Similar trend is observed for the results in terms of change in volume as seen in the height
change where the volume change increases as the RCA content increases. Figure 4.6b shows the
average volume change for each mix over the considered time under 5% sodium sulphate
solution. RAC made with different RCA replacement levels experienced higher volume
expansion than the NAC (Mix-1). At the age of 28 days, Mix-6 showed the highest volume
change which was 20% higher than that of Mix-5 (0.125%).From Figure 4.6b it can be observed
that there was a significant expansion in the volume of concrete cylinders with increased period
of time under sulphate exposure. Mix-2 experienced 3.8% higher volume change than Mix-1 and
1.2%, 2.4%, and 6.9% lower than that of Mix-3, Mix-4, and Mix-5, respectively at 148thday.
Highest volume change of 0.495% was observed by Mix-6 at 148th day.
It was also observed during the sulphate testing that some of the cylinders started to
experience some discoloration. A faded yellow color was appearing on the top of the cylinders
as shown in marked area in Figure 4.7. This indicates that the aesthetics of concrete must also be
taken into consideration while being exposed to sulphate attack.
Figure 4.7 Discoloring during exposed to sulphate

58
4.4.2 Results of Chloride Ion Ingression into RAC
The compressive strength test results of RAC with different RCA replacement levels after
exposed to cyclic wetting and drying with sodium chloride solution for 28, 90, and 120 cycles
are shown in Figures 4.8a-c. Standard moist cured cylinders’ compressive strength results are
also shown in this figure for evaluating the change in strength over the test period. Results
indicate that the strength remains unaffected by cyclic chloride exposure.
Figure 4.8 Compressive strength of concrete after being exposed to chloride solution (a) 28
cycles (at 56thday), (b) 90 cycles (at 118
thday), and (c) 120 cycles (at 148
thday)
[Mix-1 = Control, Mix-2 = 30% RCA, Mix-3 = 40% RCA, Mix-4 =50% RCA, Mix-5 =75%
RCA, and Mix-6 =100% RCA]
0
9
18
27
36
Mix -1 Mix -2 Mix -3 Mix -4 Mix -5 Mix -6
Co
mp
ressiv
e s
tren
gth
(M
Pa) Standardard moist curing
Cyclic wetting and drying with chloride solution
0
9
18
27
36
Mix -1 Mix -2 Mix -3 Mix -4 Mix -5 Mix -6
Co
mp
ressiv
e s
tren
gth
(M
pa)
Standardard moist curing
Cyclic wetting and drying with chloride solution
0
9
18
27
36
Mix -1 Mix -2 Mix -3 Mix -4 Mix -5 Mix -6
Co
mp
ressiv
e S
tren
gth
(M
Pa)
Standardard moist curing
Cyclic wetting and drying with chloride solution
(b)
(c)
(a)

59
Figure 4.9 shows the box plot of data found from the 148 day compressive strength of
standard moist curing specimens and its comparison with chloride exposure specimens after
being subjected to 120 wet-dry cycles. Positive skewness was observed for Mix-3 and Mix-4
after being exposed to 120 wet-dry cycles. The highest difference in terms of maximum and
minimum values was observed for Mix-5 of standard moist curing condition.
The results obtained from the ion chromatography test were divided by the surface area of
the cylinder to get the chloride ion concentration per unit area of concrete and are shown in
Table A2 (Appendix-A) and Figure 4.10. This representation approach of chloride concentration
is different from pervious researchers’ approach. The results illustrate that the concentration of
chloride ion increased with the increased number of RCA replacement levels. It was found that
chloride ion concentration significantly increased with increased number of wetting and drying
cycles. Table A2 indicates that no chloride concentration was found for moist curing samples.
Initially chloride ion ingression rate was higher and for Mix-6 it was the highest.
Figure 4.9 Compressive strength of concrete at the age of 148 days
[Mix-1 = Control, Mix-2 = 30% RCA, Mix-3 = 40% RCA, Mix-4 =50% RCA, Mix-5 =75%
RCA, and Mix-6 =100% RCA]
15
20
25
30
Mix-1 Mix-2 Mix-3 Mix-4 Mix-5 Mix-6
Co
mp
ressiv
e s
tren
gth
(M
Pa)

60
From Figure 4.10 it can be observed that after being exposed to 90 wet dry cycles Mix-2’s
chloride concentration is higher than Mix-1 (91.59 ppm/m2). This can be attributed to the
presence of attached mortar and pores of RAC. The difference in chloride concentration
between Mix-1 and Mix-2 after exposed to 90 wet dry cycles was 17.96 ppm/m2.It can be seen
that the chloride ion concentration value of Mix-1 after being expose to 4 wet dry cycles was
1.56 times higher than that of first cycle and the value of chloride ion concentration gradually
increased with the number of cycles which was 120.96 ppm/m2 after 120 cycles. Mix-2’s
chloride ion concentration was 2.1% higher than Mix-1 after being subjected to 120 cycles. After
120 wet dry cycles the chloride ion concentration of Mix-6 was 0.8% and 6.8% higher than that
of Mix-5 and Mix-4, respectively. This reveals that permeability of RAC increases with the
increased amount of RCA replacement, which is due to the presence of old interfacial transition
zone (ITZ) and attached mortar on the surface of recycled aggregate.
Figure 4.10 Concentration of chloride ions per unit surface area of concrete cylinder
[Mix-1 = Control, Mix-2 = 30% RCA, Mix-3 = 40% RCA, Mix-4 =50% RCA, Mix-5 =75%
RCA, and Mix-6 =100% RCA
0
70
140
210
1 cycle 4 cycles 9 cycles 16 cycles 28 cycles 90 cycles 120 cycles
Ch
lori
de io
n c
on
cen
trati
on
(p
pm
/m2)
Mix -1 Mix -2 Mix -3
Mix -4 Mix -5 Mix -6

61
Chapter 5:INFLUENCE OF REPEATED RECYCLED COARSE
AGGREGATE ON THE FRESH AND HARDENED PROPERTIES OF
CONCRETE
5.1 GENERAL
The consumption of natural aggregate is significantly increasing with the increased
production and utilization of concrete in the construction sector. Construction industry is one of
the largest consumers of the natural aggregate. Every year 15 billion tonnes of concrete are
produced throughout the world which means 2tonnes of concrete per inhabitant per year (Barcelo
2013). In order to fulfill this huge demand, the sources of good quality natural aggregates are
considerably declining all over the world. Each year ten to eleven billion tonnes of aggregate are
being used all over the world (Smith 2009). Approximately three billion tonnes of aggregates are
being produced and used in European Union countries per year (European Environment Agency
2008). Rapid and increased use of natural aggregate raise a huge concern regarding the possible
unavailability of natural aggregate in the near future.
On the other hand, a significant portion of infrastructures are now reaching or getting close
to the end of their service life. A recent study (Mirza 2007) showed that about 30 percent of the
municipal infrastructures in Canada are more than 85 years old and around 80percent of the
infrastructures have passed their expected design life. An economic study revealed that a huge
amount of investment is required for the repair and maintenance of the existing civil
infrastructure in Canada which would cost almost $130 billion where most of those structures are
aging and nearing the end of their life span (Canadian Sailings 2011).

62
New public infrastructure projects of $12-billion were announced by the federal
government to replace the old and deficient infrastructure by new construction (CEAP-Budget
2009). This replacement will increase the amount of construction and demolition (C&D) waste
already found in landfill. If this replacement process is constantly going on, soon there will be a
scarcity of available land spaces to dump C&D waste material among which 52% is concrete
waste (Michael et al. 2003). The replacement process of structure is not only raising a dumping
issue but also becoming a threat to the environment. Many countries throughout the world have
been suffering from lack of proper dumping place. Initiatives have been taken to minimize the
use of natural aggregate and landfilling, for instance, heavy taxes have been introduced to
discourage the disposal of C&D waste. Recycling or reusing of demolished concrete is a viable
option which can significantly decrease the burden of landfill. Large scale recycling can deplete
the consumption of limited resources like natural aggregate as well as play a vital role in solving
the waste disposal problem. Researchers can not only think about the current condition, they also
need to envisage the future situation from their curious/intuitive perceptions because the wide
application of RCA can result in new challenges. One has to think about the next generation of
this recycled concrete, i.e. what happens when this recycled concrete structures need to be
demolished and what about its disposal issue. Similar steps can be taken i.e. the idea of “repeated
recycled coarse aggregate” to be used in concrete production can be a viable solution to the
growing problem regarding the C&D waste disposal and limited source of natural coarse
aggregate. In this chapter, the fresh and hardened properties of sustainable recycled concrete
made with repeated recycled coarse aggregates are discussed. Although previous research has
been conducted for the use of RCA in concrete, the use of repeated recycled coarse aggregate is
a new research area and has been found, in this study, to have exciting potential. Proper

63
investigation about this new generation concrete is very necessary to understand the behavior of
its mechanical and durability properties. Moreover, this will pave the way for future research
opportunities and new challenges to the researchers. Most importantly, repeated recycled coarse
aggregate will reduce the load on the landfill and decrease the use of natural aggregate thus,
offsetting related extraction, processing, transportation, and environmental loads. Different types
of aggregate properties and mechanical behavior of recycled concrete made with three different
generations of repeated recycled coarse aggregates are covered in this chapter.
5.2 SOURCES OF AGGREGATES
This study considers the use of100% RCA to be used repeatedly in first, second and third
generation (i.e. RCA was recycled 3 times over its life span) of concrete production and
compares the mechanical behavior of produced concrete among them. The target was to produce
32 MPa concrete with different generations of repeated RCA. Aggregates were collected from
the same source as already mentioned in Chapter 3. This time recycled coarse aggregates were
collected from a demolished bridge. Several screening, sieving, and washing were done to
remove these impurities. Recycled coarse aggregate was sieved to discard particle size smaller
than 5mm.
5.3 PRODUCTION OF REPEATED RECYCLED COARSE AGGREGATE
This study evaluates the performance of first, second, and third generation of recycled
concrete made with 100% RCA and compares them with that of NAC. 100% replacement level
was considered to boost up the confidence level of construction industry for application of RCA
in new concrete production. If the performance of concrete made with 100% replacement level is
comparable to NAC, than definitely all other replacement levels will perform better and increase

64
the application of RCA. First (1st) generation recycled aggregate concrete (RC1) was produced
using 100% RCA which were collected from OK Builders Winfield pit. After curing for 56 days,
this concrete was crushed and went through several screening and crushing stages to produce
second (2nd
) generation repeated recycled aggregate. The second generation recycled aggregates
were sieved and washed to eliminate the smaller sized particles (less than 5mm) from the
stockpile. This second (2nd
) generation repeated recycled coarse aggregate (RCA2) was used to
produce recycled concrete which is described as second (2nd
) generation repeated recycled
concrete (RC2) in this study. Then RC2 was cured for another 56 days, and then crushed and
recycled to produce the third (3rd
) generation recycled concrete aggregate. The third (3rd
)
generation repeated recycled coarse aggregates (RCA3) were sieved to remove smaller particles
(less than 5 mm). Then those coarse aggregates were washed out with water to remove other
impurities. Third (3rd
) generation repeated recycled coarse aggregate (RCA3) was used to
produce third (3rd
) generation repeated recycled concrete (RC3). The flow diagram of
production process of different generation recycled concrete is shown in Figure 5.1.
Since different generations of repeated recycled concrete were produced using sequential
crushing of different generations of concrete, it was very difficult to estimate the amount of
recycled coarse aggregate for producing RC1. Almost 1m3of concrete (more than 480 cylinders
and 29 beams) was cast using RCA1 to meet the aggregate requirement for the third generation
where 100% natural aggregates were replaced by RCA in all generations. After curing, RC1 was
taken to the crushing plant. Figures 5.2a-f show the sequence of crushing process used for
recycling purpose.

65
Figure 5.1 Flow diagram of evolution process of recycled concrete made with repeated recycled
coarse aggregate
[RCA1 = 1st generation repeated recycled coarse aggregate, RC1 = 1
st generation repeated
recycled coarse aggregate concrete, RCA2 = 2nd
generation repeated recycled coarse aggregate,
RC2 = 2nd
generation repeated recycled coarse aggregate concrete, RCA3 = 3rd
generation
repeated recycled coarse aggregate and RC3 = 3rd
generation repeated recycled coarse aggregate
concrete]
In the beginning of recycling process the hardened recycled concrete is loaded into a
hopper which is followed by crushing through jaw crusher. Small size of concrete
specimens(cylinder of 100×200 mm and beam of 150×150×500 mm) caused difficulties during
the loading into the hopper. Those specimens were loaded into a loader bucket (Figure 5.2a) and
then manually dropped one by one inside the hopper as shown in Figure 5.2b. After crushing the
concrete inside the hopper and jaw crusher, those were passed through a conveyer belt (Figure
5.2c). Then, different sizes of crushed repeated recycled aggregates were separated using sieve.
Large sized particles were further processed into an impact crusher for secondary
RCA3
Casting
RCA1
RCA2
Landfill
Crushing
RC1
Casting
Crushing
Crushing
CastingRC3
RC2

66
crushing(Figure 5.2d-e). All those crushed aggregates were gathered together into a bucket of
loader at the end of several crushing stages as shown in Figure 5.2f and then transported to the
lab for mixing. In this investigation crushing was done twice and similar crushing procedure was
followed in both cases.
Figure 5.2 The crushing setup used for producing repeated recycled coarse aggregate
5.4 PROPERTIES OF AGGREGATES
The implementation of repeated recycled coarse aggregate is a new initiative toward the
development of sustainable concrete and it is very important to examine their properties before
use. This section will discuss the various aggregate properties investigated in this study. The
aggregate testing was performed for the natural coarse aggregate, natural fine aggregate (sand),
and three different generations of RCA. The procedure used to determine the different properties
of aggregates was same as mentioned in Chapter 3.
(a) (b) (c)
(d) (e) (f)

67
5.4.1 Gradation
The natural fine and coarse aggregates were donated by OK Builders and were supposed to
have a good gradation as those are usually used for their ready mix production. Sieve analyses
were performed according to CSA A23.2-2A (CSA 2009). The sieve analysis results for both the
fine and coarse natural aggregates are presented in Figures 5.3a and 5.3b. From these graphs it
can be observed that both the coarse and fine natural aggregates possess fairly good gradations as
per CSA standard.
Figure 5.3 Gradation curves of (a) natural fine aggregate and (b) natural coarse aggregate
In this study, natural coarse aggregates were replaced by 100% different generations of
repeated RCA to produce repeated recycled coarse aggregate concrete. Recycled concrete was
repeatedly used as a replacement of natural coarse aggregate. Figures 5.4a-c show the sieve
analysis results of three different generations of repeated recycled aggregate. From these figures
it can be observed that all the different generations of repeated recycled coarse aggregates fall
within the CSA acceptable range.
0
20
40
60
80
100
1 10 100
Passin
g (%
)
Sieve Opening (mm)
CSA Lower
CSA Upper
Coarse NA
(b)
0
20
40
60
80
100
0.01 0.1 1 10
Passin
g (%
)
Sieve Opening (mm)
CSA Lower
CSA Upper
Fine NA
(a)

68
Figure 5.4 Sieve analyses of different generations repeated recycled coarse aggregates where (a)
1stgeneration recycled coarse aggregate (RCA1), (b) 2
ndgeneration recycled coarse aggregate
(RCA2), and (c) 3rd
generation recycled coarse aggregate (RCA3)
5.4.2 Bulk Density, Specific Gravity, and Moisture Content of Aggregates
Different aggregate property tests were performed to show a comparison among different
generations of repeated recycled coarse aggregates and the natural coarse aggregate. Various
physical property tests were conducted and the results are presented in Table 5.1. The bulk
density, specific gravity, and absorption capacity of all five different types of aggregates were
measured according to CSA standard as mentioned in Chapter 3. The bulk density of natural
coarse aggregate was 1622.3 kg/m3, which was the highest among the considered coarse
aggregates. On the other hand, the bulk density of repeated recycled coarse aggregate was
0
20
40
60
80
100
1 10 100
Passin
g (%
)
Sieve Opening (mm)
CSA Lower
CSA Upper
1st Generation
(a)
0
20
40
60
80
100
1 10 100
Passin
g (%
)
Sieve Opening (mm)
CSA Lower
CSA Upper
2nd Generation
(b)
0
20
40
60
80
100
1 10 100
Passin
g (%
)
Sieve Opening (mm)
CSA Lower
CSA Upper
3rd Generation
(c)

69
relatively low and was decreasing with the number of repetitions. The reduced value of bulk
density is due to the adhered cement paste which remains as the residues upon the top of natural
aggregate after the recycling process. Since the amount of adhered mortar is increasing with the
number of recycling, the bulk density of next generations of repeated recycled coarse aggregates
are increasing compared to the previous one. The bulk density of RCA1, RCA2, and RCA3 were
1396.2 kg/m3, 1251.2 kg/m
3, and 1195.9 kg/m
3, respectively which were approximately 13.9%,
22.9%, and 26.3% smaller than that of natural coarse aggregate. The bulk SSD specific gravity
of RCA1, RCA2, and RCA3 were 2.55, 2.33, and 2.23, respectively whereas the bulk SSD
specific gravity of natural coarse aggregate was 2.69.The observed lower values of three
different generations of repeated recycled coarse aggregate were due to the adhered mortar. This
is why the bulk density subsequently gets lowered and is found the lowest in the case of RCA3.
The absorption value of repeated recycled coarse aggregate is an expression of its porosity. The
absorption capacities of RCA1, RCA2, and RCA3 were 5.2%, 7.1%, and 9.4%, respectively.
Natural coarse aggregate’s absorption capacity was only 1.2%, which was much lower than any
of the recycled aggregates. The high absorption values of repeated recycled coarse aggregate
appear mostly due to the presence of the residue of cement paste that still remained on the
surface of the parent coarse aggregate after crushing. Therefore, the absorption of the repeated
recycled coarse aggregates increases considerably when the number of repetitions increases. The
specific gravity, bulk density, and absorption are interrelated properties that are greatly
influenced by the attached mortar quantity leading to porosity. The moisture content of natural
coarse aggregate was 0.3%. Table 5.1 also illustrates that the moisture content of fine aggregate
was higher than its absorption capacity which means extra moisture was present on the surface of
the fine aggregate.

70
Table 5.1: Properties of aggregates
Bulk dry
specific
gravity
Bulk SSD
specific
gravity
Apparent
specific
gravity
Bulk
density
(kg/m3)
Absorption
capacity
(%)
Moisture
content
(%)
Natural coarse
aggregate 2.67 2.69 2.73 1622.3 1.2 0.3
1st
generation
RCA (RCA1) 2.32 2.55 2.63 1396.2 5.2 2.53
2nd
generation
RCA (RCA2) 2.17 2.33 2.57 1251.2 7.1 2.57
3rd
generation
RCA (RCA3) 2.03 2.23 2.52 1195.9 9.4 2.66
Fine aggregate 2.67 2.71 2.79 1.8 2.13
Figures 5.5a-d show the microscopic view of different types of coarse aggregate. These
figures reveal that the crack and other damages increased with the number of repetitions. On the
other hand, pore and crack was not found in the case of natural aggregate even under the
microscope as shown in Figure 5.5a.The quality of coarse aggregate degraded with the number
of repetitions which might influence the mechanical and durability properties of different
generations of repeated recycled coarse aggregate concrete.
5.5 EXPERIMENTAL PROGRAM
The main purpose of this study is to determine the potential of repeated recycled coarse
aggregate to be utilized as construction material. When new and innovative technologies are
being introduced to an industry there are always fears about adopting them due to unknown
performance in various exposures and its long-term durability. There is a need/demand for
sustainable products where concrete industry does support the idea, but fears that the new
technology may not perform over time and therefore negatively impact their businesses. This
study offers a solution and hope by producing sustainable concrete which utilizes 100% RCA
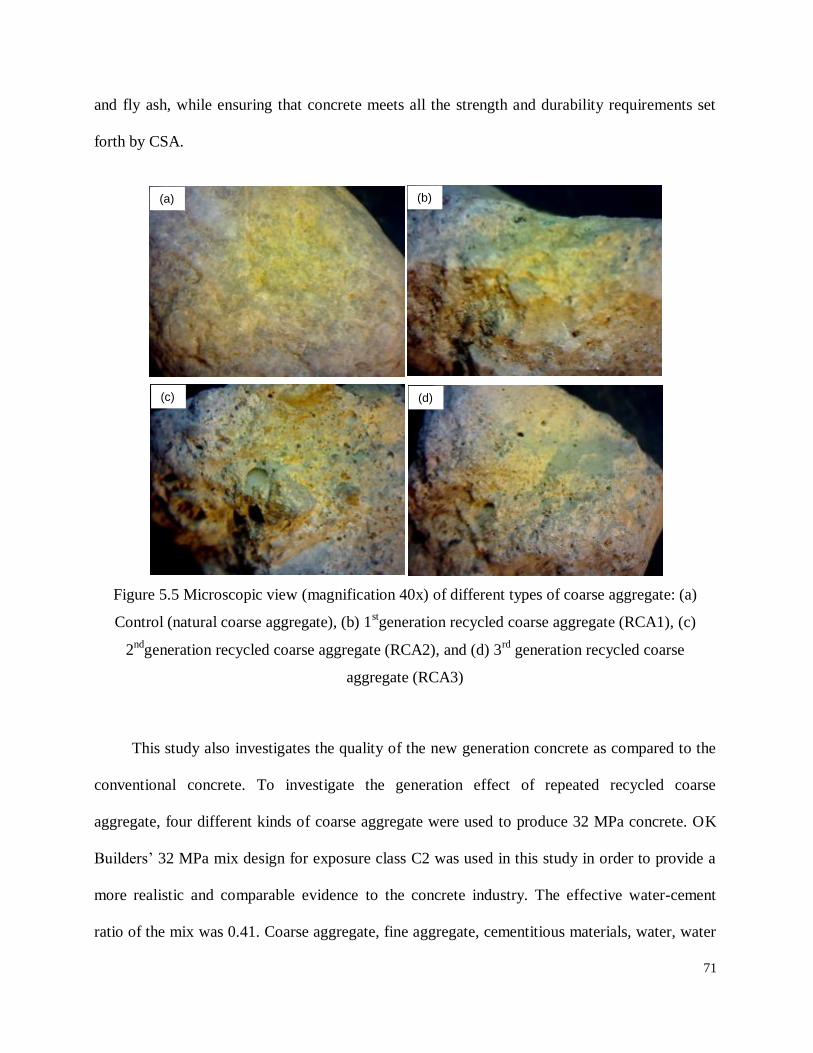
71
and fly ash, while ensuring that concrete meets all the strength and durability requirements set
forth by CSA.
Figure 5.5 Microscopic view (magnification 40x) of different types of coarse aggregate: (a)
Control (natural coarse aggregate), (b) 1stgeneration recycled coarse aggregate (RCA1), (c)
2nd
generation recycled coarse aggregate (RCA2), and (d) 3rd
generation recycled coarse
aggregate (RCA3)
This study also investigates the quality of the new generation concrete as compared to the
conventional concrete. To investigate the generation effect of repeated recycled coarse
aggregate, four different kinds of coarse aggregate were used to produce 32 MPa concrete. OK
Builders’ 32 MPa mix design for exposure class C2 was used in this study in order to provide a
more realistic and comparable evidence to the concrete industry. The effective water-cement
ratio of the mix was 0.41. Coarse aggregate, fine aggregate, cementitious materials, water, water
(a) (b)
(c) (d)

72
reducer, and air entraining admixture were used to produce different concrete mixes. Class F fly
ash was used as a 20% replacement of ordinary Portland cement (GU cement). The fly ash aids
in the durability performance of concrete by forming a tighter concrete matrix thereby reducing
the permeability and rate of chemical infiltration. Glenium 3030 NS (BASF 2013) and Micro air
(BASF 2013) were used as water reducing admixture and air entraining admixture, respectively.
Table 5.2 shows the mix proportions for various generation of repeated recycled coarse
aggregate concrete that were tested in this study.
Table 5.2: Mix proportions
Mix Component Control
1st generation
recycled
concrete (RC1)
2nd
generation
recycled
concrete (RC2)
3rd generation
recycled concrete
(RC3)
Cementing materials
GU cement 280 280 280 280
Fly ash 70 70 70 70
Fine
aggregate
Natural fine
aggregate 750 750 750 750
Coarse aggregate
Natural coarse aggregate
1040 0 0 0
Repeated recycled
coarse aggregate 0 1040 1040 1040
Water 150 150 150 150
Water
reducer Glenium 3030 630 ml 630 ml 630 ml 630 ml
Air entraining
admixture
Micro air 120 ml 120 ml 120 ml 120 ml
The generation effect was examined by using four different types of coarse aggregate and
those were natural coarse aggregate, RCA1, RCA2, and RCA3. In these four mixes all other
components remained constant except the use of different generation of recycled aggregate in
order to ensure that the test results only reflect the generation effect. Control concrete mix

73
worked as a base line for evaluating the behavior of different generation of repeated recycled
coarse aggregate concrete.
The hardened concrete properties were determined by conducting compressive strength test
and splitting tensile strength test. Splitting tensile strength was performed according to CSA
A23.2-13C (CSA 2009) and only three cylinders were cast for 28 days test. Compressive
strength test was done according to CSA A23.2-9C (CSA 2009) at the ages of 3,7,28, 56, and
120 days. At least three cylinders of Ø100×200 mm were cast to perform the specified date
compressive and splitting tensile strength of the natural and different generations of repeated
recycled coarse aggregate concrete. Concrete mixing and curing were done as mentioned in
Chapter 3. The specimens remained in the curing chamber until they were removed for testing.
Fresh concrete properties (slump and air content) were also investigated according to CSA
Standard mentioned in Chapter 3.
5.6 EXPERIMENTAL RESULTS
5.6.1 Results of Fresh Concrete Properties
The variations of concrete slump and air content are presented in Table 5.3.The slump
value for the mix prepared with natural coarse aggregate was 100 mm which was little bit higher
than the target slump of90 mm. This slump value was considered to represent a more realistic
mix because in ready mix industry the usual slump is close to 90 mm. Table 5.3shows that the
slump values of RC1, RC2, and RC3 were 100mm, 94mm, and 85 mm, respectively, which
were within a narrow range of the target slump. The workability of concrete remained unaffected
due to application of different generations of repeated recycled coarse aggregate.

74
Table 5.3: Fresh concrete properties
Slump (mm) Air content (%)
Control 100 3.4
1st generation repeated RCA concrete (RC1) 100 3.6
2nd
generation repeated RCA concrete (RC2) 94 3.9
3rd
generation repeated RCA concrete (RC3) 85 4.4
The results of the air content test of all the mixes are shown in Table 5.3, which shows an
increasing trend with the increased number of repetitions. The concrete containing repeated RCA
seemed to have slightly increased air content compared to that of the reference mix though every
time the same amount of air entraining admixture was used. In a study by Katz (2003), it was
also found that the effect of RCA replacement on air content was higher (approximately 4%-
5.5% for recycled concrete).Similar phenomenon was found in the present study for different
generations of repeated RCA concrete. Though, the reason of the increased air content is not
properly understood, this is probably due to the fact that the amount of adhered mortar content is
increasing with the number of repetitions. Light weight aggregate concrete also shows increased
air content than the normal weight concrete (Wischers and Manns 1974, Katz 2003). The bulk
density of the considered different types of recycled concrete aggregates is gradually decreasing
with repetitions compared to that of natural coarse aggregate. This is another reason why 3rd
generation repeated RCA concrete (RCA3) has the highest air content considering its lowest bulk
density.
5.6.2 Results of Compressive Strength
The compressive strength test results of different concrete mixes are presented in Table A3
(Appendix-A) and Figure 5.6 for ages of 3, 7, 28, 56 and 120 days. The subsequent use of 100%

75
repeated recycled coarse aggregates lead to a drop in the compressive strength of this new
generation recycled concrete with repetitions. It can be observed that the compressive strengths
of concrete containing RCA1 and RCA2 were 35.9 MPa and 36.8 MPa at 56th
day which were
slightly lower than the natural coarse aggregate concrete (43.1 MPa).
Figure 5.6 Compressive strength of various concrete mixes
The compressive strength of RC2 was 2.5% higher at the age of 56th day than that of RC1
though the bulk density of RCA2 was lower. This was due to the rougher texture and more
angular shape of RCA2 which subsequently improved the bonding and interlocking between the
RCA2 and the cement paste. This may also be contributed by the higher absorption capacity of
2nd
generation repeated RCA which latter may have worked as a source of water in the form of
internal curing (Yang et al. 2008). It can be seen that all the considered concrete batches
achieved their target compressive strength (32 MPa) at the age of 28 days except RC3. RC3 also
failed to achieve the 32 MPa target strength even at the age of 56 days. The effect of repeated
use on the compressive strength of RC3 was more than RC1 and RC2.Compressive strength at
56th day of RC3 was 32.7%, 19.2%, and 21.2% lower than that of natural coarse aggregate
0
18
36
54
0 40 80 120
Co
mp
ressiv
e s
tren
gth
(M
Pa)
Age (days)
Control
1st Generation
2nd Generation
3rd Generation
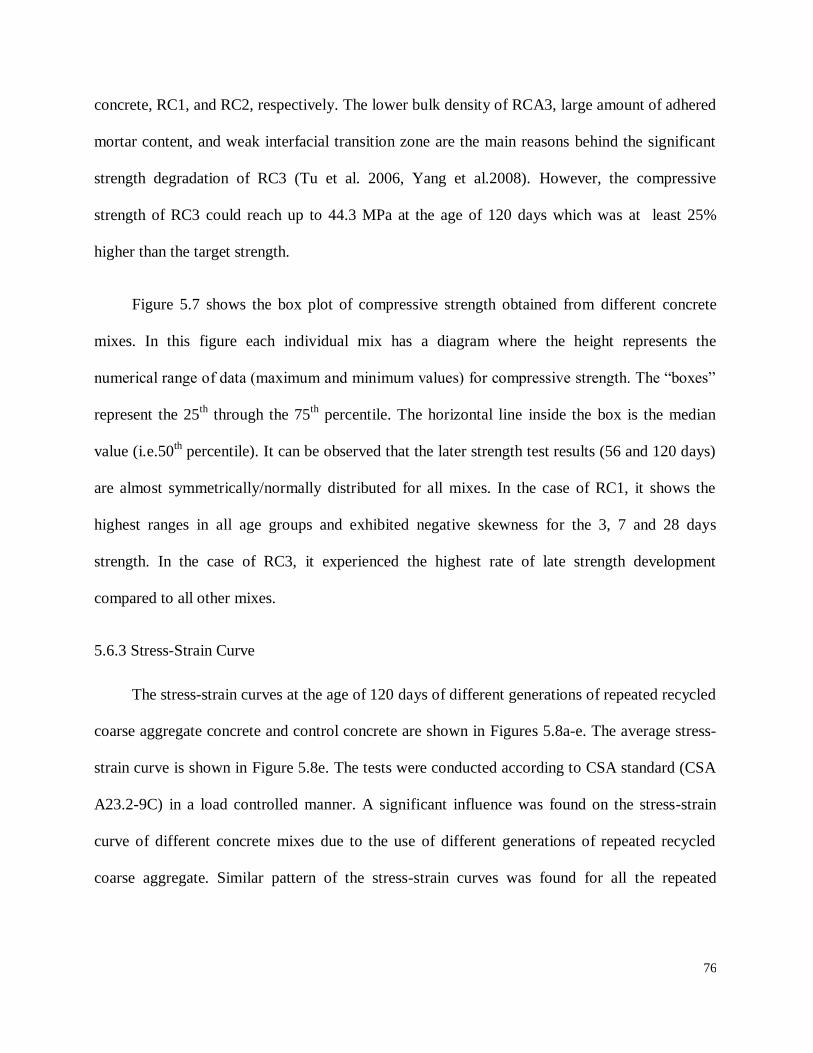
76
concrete, RC1, and RC2, respectively. The lower bulk density of RCA3, large amount of adhered
mortar content, and weak interfacial transition zone are the main reasons behind the significant
strength degradation of RC3 (Tu et al. 2006, Yang et al.2008). However, the compressive
strength of RC3 could reach up to 44.3 MPa at the age of 120 days which was at least 25%
higher than the target strength.
Figure 5.7 shows the box plot of compressive strength obtained from different concrete
mixes. In this figure each individual mix has a diagram where the height represents the
numerical range of data (maximum and minimum values) for compressive strength. The “boxes”
represent the 25th
through the 75th
percentile. The horizontal line inside the box is the median
value (i.e.50th percentile). It can be observed that the later strength test results (56 and 120 days)
are almost symmetrically/normally distributed for all mixes. In the case of RC1, it shows the
highest ranges in all age groups and exhibited negative skewness for the 3, 7 and 28 days
strength. In the case of RC3, it experienced the highest rate of late strength development
compared to all other mixes.
5.6.3 Stress-Strain Curve
The stress-strain curves at the age of 120 days of different generations of repeated recycled
coarse aggregate concrete and control concrete are shown in Figures 5.8a-e. The average stress-
strain curve is shown in Figure 5.8e. The tests were conducted according to CSA standard (CSA
A23.2-9C) in a load controlled manner. A significant influence was found on the stress-strain
curve of different concrete mixes due to the use of different generations of repeated recycled
coarse aggregate. Similar pattern of the stress-strain curves was found for all the repeated

77
recycled concrete mixes. The peak stress for the control mix was 49.8MPa and its corresponding
peak strain was 0.00211.
Figure 5.7 Variation in 3, 7, 28, 56 and 120-day compressive strength of various concrete
batches
[ where a = 3 days, b = 7 days, c = 28 days, d = 56 days, and e = 120 days]
[Control = Natural aggregate concrete, RC1 = 1st generation repeated recycled coarse aggregate
concrete, RC2 = 2nd
generation repeated recycled coarse aggregate concrete, and RC3 = 3rd
generation repeated recycled coarse aggregate concrete]
The value of the strain corresponding to the peak stress was higher for repeated recycled
coarse aggregate concrete compared to that of NAC. This is due to the lower modulus of
elasticity of recycled concrete compared to NAC as shown in Table 5.4. The peak axial strain
values of RC1, RC2, and RC3 were 0.00268, 0.00253, and 0.00239, respectively. The ultimate
strain is considered as the axial strain beyond the peak stress at a stress level equal to 85% of the
peak stress during the load control test (Gonzalez-Fonteboa et al. 2009). The ultimate axial strain
of control mix was 0.0023 which was 14.8% and 11.5% lower than that of RC1 and RC2,
respectively. The ultimate strain of RC3 was 0.0025. The transverse strains of different concrete
mixes are also shown in the figure. Similar pattern is also observed in transverse strain response.
10
15
20
25
30
35
40
45
50
55
Control RC1 RC2 RC3
Co
mp
ressiv
e s
tre
ng
th (
MP
a)
a a
a
a
e e e
b
e d
d d
d
c
c c
c b b
b

78
Figure 5.8 Stress-strain curves of various concrete mixes at the age of 120 days
[where, a= Control, b = RC1, c = RC2, d = RC3, and e = average]
[Control = Natural aggregate concrete, RC1 = 1st generation repeated recycled coarse aggregate
concrete, RC2 = 2nd
generation repeated recycled coarse aggregate concrete, and RC3 = 3rd
generation repeated recycled coarse aggregate concrete]
0
10
20
30
40
50
60
-0.001 0 0.001 0.002 0.003
Str
es
s (
MP
a)
Control-Axial
Control-Transverse
(a)
Axial strainTransverse strain
0
10
20
30
40
50
60
-0.001 0 0.001 0.002 0.003 0.004
Str
es
s (
MP
a)
RC1(1)-AxialRC1(1)-TransverseRC1(2)-AxialRC1(2)-Transverse
(b)
Axial strainTransverse strain
0
10
20
30
40
50
60
-0.001 0 0.001 0.002 0.003
Str
es
s (
MP
a)
RC2(1)-AxialRC2(1)-TransverseRC2(2)-AxialRC2(2)-Transverse
(c)
Axial strainTransverse strain
0
10
20
30
40
50
60
-0.001 0 0.001 0.002 0.003
Str
es
s (
MP
a)
RC3(1)-AxialRC3(1)-TransverseRC3(2)-AxialRC3(2)-Transverse
(d)
Axial strainTransverse strain
0
10
20
30
40
50
60
-0.001 0 0.001 0.002 0.003
Str
es
s (
MP
a)
Control-AxialControl-TransverseRC1-AxialRC1-TransverseRC2-AxialRC2-TransverseRC3-AxialRC3-Transverse
(e)
Axial strainTransverse strain

79
5.6.3.1 Modulus of elasticity and poisson’s ratio
Table 5.4 shows the variations of modulus of elasticity and poisson’s ratio of different
generations of repeated recycled coarse aggregate concrete and their comparison with control
mix. The modulus of elasticity of different generations of repeated recycled coarse aggregate
concretes decreased with the increased number of repetitions. The highest modulus of elasticity
was found for control mix which was 27.9 GPa and it was 8.1% higher than that of RC3. This
was due to the decreasing stiffness and bulk density of RCAs. This also indicates that the quality
of repeated recycled coarse aggregates was decreasing with the increased number of repetitions.
Poisson’s ratio of control mix was found as 0.23. The value of poisson’s ratios was increasing
with the number of repetitions. The poisson’s ratio value of RC1 was 0.25 and it was 8.7%
higher than the control mix.
Table 5.4: Mechanical properties of different concrete mixes at 120th day
Concrete mix
Modulus of
elasticity
Peak
stress
Strain at peak
stress
Ultimate
strain
Poisson’s
ratio
(GPa) (MPa) (mm/mm) (mm/mm)
Control 27.9 49.8 0.00211 0.0023 0.23
RC1 27.1 46.2 0.00268 0.0027 0.25 RC2 26.1 46.4 0.00253 0.0026 0.24
RC3 25.8 42.8 0.00239 0.0025 0.26
5.6.4 Results of Splitting Tensile Strength
The splitting tensile strengths of various concrete mixes are shown in Figure 5.9for the age
of 28 days. Here the splitting tensile strengths found for all new generation concrete can be
compared directly to the splitting tensile strength of the control concrete. It can be seen from the
data presented in the figure that the values of the splitting tensile strength of RC1 and RC2 were

80
higher than the control by almost 3-4%. This was attributed by the effectiveness of new
interfacial transition zone and the absorption capacity of the attached mortar on the surface of
repeated recycled coarse aggregate (Etxeberria 2007, Salem and Burdette 1998).This
phenomenon was also found in few studies where it was discovered that the splitting tensile
strength of concrete containing RCA was higher than the control mixture (Alam et al. 2013,
Etxeberria 2007,Malesev 2010). The repeated recycled coarse aggregate concrete containing
RCA3 experienced lower than the splitting tensile strength of control mix by approximately
33%. This was the consequence of large amount of old cement paste and lower bulk
densityofRCA3 leading to a weaker interfacial transition zone.
Figure 5.9 Splitting tensile strength of various concrete mixes at the age of 28 days
[Control = Natural aggregate concrete, RC1 = 1st generation repeated recycled coarse aggregate
concrete, RC2 = 2nd
generation repeated recycled coarse aggregate concrete, and RC3 = 3rd
generation repeated recycled coarse aggregate concrete]
5.6.5 Failure Pattern of Concrete
The failure patterns of various concrete mixes at the age of 56 days are shown in Figures
5.10a-d and Figures 5.10e-f represent the failure patterns of these mixes at 120th day. Those
9.7 10.0 10.1
6.5
0
4
8
12
Control RC1 RC2 RC3
Sp
litt
ing
ten
sile s
tren
gth
(M
Pa)

81
failure patterns were observed when those specimens were subjected to compressive strength
test. Cone and shear failure was observed by the control mix which is shown in Figure 5.10a.
Shear failure pattern was shown by RC1. Again cone and shear failure pattern was observed for
both RC2 and RC3. At the age of 120 days shear failure was observed for the control mix and
RC1 as shown in Figures 5.10e-f. Cone and shear failure was observed for RC2 at 120th day
where RC3 showed shear failure at the same age as shown in Figure 5.10h.
Figure 5.10 Failure pattern of various concrete mixes (a) Control (natural coarse aggregate
concrete) at 56th day, (b) 1
st generation repeated RCA concrete (RC1) at 56
th day, (c) 2
nd
generation repeated RCA concrete (RC2) at 56th day, (d) 3
rd generation repeated RCA concrete
(RC3) at 56th day, (e) Control (natural coarse aggregate concrete) at 120
th day, (f) 1
st generation
repeated RCA concrete (RC1) at 120th day, (g) 2
nd generation repeated RCA concrete (RC2) at
120th day, and (h) 3
rd generation repeated RCA concrete (RC3) at 120
th day
(b)(a) (c) (d)
(e) (f) (g) (h)

82
Chapter 6: DURABILITY PROPERTIES OF REPEATED RECYCLED
COARSE AGGREGATE CONCRETE
6.1 GENERAL
The performance of concrete not only depends on its mechanical properties but also
significantly affected by its durability properties. The service life of concrete structure is also
strongly dependent on its durability characteristics. Durability is one of the major concerns
associated with the application of new generation repeated recycled coarse aggregate concrete.
Its absorption and drying shrinkage are higher than NAC as it is being produced by crushing
different generations of repeated recycled coarse aggregate concrete. The production of repeated
recycled coarse aggregate concrete will offer a green, sustainable, and environment friendly
product to the concrete industry. Before any kind of practical application, the durability
performance of this new generation concrete must be tested to ensure that it can handle different
harsh exposure conditions. At present there is no published literature on the durability of
repeated recycled coarse aggregate concrete and in order to advance the pursuit of a more
sustainable concrete, the durability of this concrete must be determined.
In this chapter the durability performance of 32 MPa repeated recycled coarse aggregate
concrete is evaluated in terms of freeze-thaw cycles, sulphate attack, and wetting-drying cycles
in chloride environment. The fresh and hardened properties of this new generation concrete are
already discussed in Chapter 5. The required specimens for investigating the durability problems
were cast along with the specimens used for testing the fresh and hardened properties of repeated
recycled coarse aggregate concrete. These three durability related problems of different
83
generations of repeated recycled coarse aggregate concrete (RC1, RC2, and RC3) were
examined by comparing their performance with control concrete (natural coarse aggregate
concrete).
6.2 FREEZE-THAW DURABILITY TEST OF REPEATED RECYCLED COARSE
AGGREGATE CONCRETE
Freeze-thaw is one of the major durability concerns of this new generation concrete in cold
regions since the absorption, porosity, and the attached mortar content are increasing with the
increased number of repetitions with this new generation concrete. Extensive research is needed
to understand the freeze-thaw durability performance of repeated recycled coarse aggregate
concrete. ASTM C666 (ASTM 2012) Procedure A was followed to examine the durability
performance of 32 MPa repeated recycled coarse aggregate concrete. 76×102×406 mm standard
beam molds were used to cast specimens for this test. Two beams were cast for each generation
of repeated recycled concrete. Two beam specimens were also cast with NAC (control) to
compare the performance of repeated recycled coarse aggregate concrete. After the removal of
mold, these specimens were moist cured for 14 days in the moist curing chamber. After 14 days
of curing these specimens were brought to the target thaw temperature which is between 2ᵒC to -
1ᵒCusing the freeze-thaw cabinet. The length, weight and fundamental transverse frequency of
those beam specimens were measured. Then the specimens were placed inside the containers of
the freeze-thaw machine and the containers were completely filled with clean water to start the
freeze-thaw test. After each 36 cycles specimens were removed from the machine, and the
length, weight, and fundamental transverse frequency of the beam specimens were measured to
monitor the changes as mentioned in ASTM C666 (ASTM 2012). Containers were rinsed out
and filled with clean water before putting back the specimens each time. This test was continued

84
up to 300 cycles. According to ASTM C666 (ASTM 2012), the freeze-thaw testing should
continue until the specimens passed 300 cycles or reached the failure criteria. It is specified that
if the value of relative dynamic modulus reaches 60% of its initial value or the length expansion
is 0.10%, then the specimen has reached the failure criteria and should be discarded.
6.3 TEST METHOD TO ASSESS THE SULPHATE RESISTANCE OF REPEATED
RECYCLED COARSE AGGREGATE CONCRETE
The sulphate resistance test of different generations repeated recycled coarse aggregate
concrete was performed following the same procedure mentioned in Chapter 4.This time the
specimen size selected was 100×200mm cylinders for sulphate exposures experiments. This size
was chosen to eliminate the problems which occurred in case of small sized cylinder (75×150
mm) for recycled concrete made with different RCA replacement levels. During the 7 days
strength test, the small size cylinder compressive strength was much lower than the 100×200 mm
cylinders. Three cylinders were cast for each generation of repeated recycled coarse aggregate
concrete and control concrete. The cylinders were moist cured for seven days before being
placed in the sulphate bath. Sulfate bath preparation and the pH monitoring were done exactly
the same way as discussed in Chapter4.
The specimens used for sulphate testing were measured on a weekly basis to determine the
physical changes occurring in the specimen over time. The used sodium sulphate solution was
discarded after taking the measurement of cylinders at certain intervals such as at the age of 28
days and 56 days. Compressive strength test was performed at the age of 56 days after the
sulphate exposure of 7 weeks to investigate the loss of strength during the sulphate exposure.

85
6.4 TEST METHOD TO ASSESS THE CHLORIDE ION INGRESSION INTO REPEATED
RECYCLED COARSE AGGREGATE CONCRETE
This study also investigated the durability of 32 MPa repeated recycled coarse aggregate
concrete under chloride exposure condition along with wetting-drying cycles, and compared
those results with the control mix. The repeated recycled coarse aggregate concrete is more
porous than the control mix and any kind of fluid can penetrate into it. The aggressive ion
ingression such as chloride can cause disintegration of concrete. Hence, it is very important to
investigate the chloride durability performance of repeated recycled coarse aggregate concrete.
The chloride concentration in concrete was measured using Ion Chromatography. Similar
procedure was followed as discussed in Chapter 4. Only variation was the test period which was
56 days for each considered generation due to time restriction. As a result, chloride ion
concentration was measured after 1, 4, 9, 16, and 28 cycles. Compression test was done on three
specimens only at the age of 56 days after being exposed to 28 cycles to examine whether there
is any degradation in strength due to propagation of chloride along with wet dry cycle.
6.5 RESULT AND DISCUSSION
6.5.1 Results of Freeze-Thaw Durability Test
The freeze-thaw durability performance of different generations of repeated recycled
coarse aggregate concrete was measured in terms of relative dynamic modulus of elasticity,
percent change in length, and percent change in weight. The relative dynamic modulus of
elasticity was estimated using the following equation suggested by ASTM C666 (ASTM 2012)
1002
2
o
n
nn
nP (6.1)

86
where,
n = number of cycles during the time of testing
Pn =relative dynamic modulus of elasticity after n cycles of freezing-and-thawing
no = initial fundamental transverse frequency , in Hz
nn= fundamental transverse frequency after being exposed to n freezing-and-thawing
cycles, in Hz
Figure 6.1 shows the results of relative dynamic modulus of elasticity at different number
of cycles during the test period. Results show that as the number of repetitions increased, the
value of relative dynamic modulus of elasticity decreased. Moreover, the values of relative
dynamic modulus of elasticity also decreased with the increased number of freeze-thaw cycles.
Control concrete survived up to 288 freeze-thaw cycles without any reduction in the relative
dynamic modulus of elasticity. It was found that after being subjected to 300 cycles the control
concrete’s relative dynamic modulus of elasticity was 99.7%.As indicated in Figure 6.1, there
was a drop at 144th
cycle for the relative dynamic modulus of elasticity of RC1, RC2, and RC3
which were 0.89%, 1.35%, and 2.59%, lower than that of control concrete, respectively. After
300 cycles the relative dynamic modulus of elasticity of control mix was 1.95%, 3.32%, and
9.27% higher than that of RC1, RC2, and RC3, respectively. Lowest relative dynamic modulus
of elasticity was found for RC3 which was 91.2%. This is due to the higher absorption and
porosity of repeated recycled coarse aggregate concrete with the number of repetitions. Due to
this increased porosity the absorbed water easily gets saturated and upon freezing, it develops
internal stress. If this internal stress exceeds the tensile strength of aggregate then micro cracks

87
will generate inside the concrete and it will influence the relative dynamic modulus of elasticity
of concrete (Salem et al. 2003). Though slight reduction was observed in terms of relative
dynamic modulus, three different generations of repeated recycled concrete performed quite
well. Their relative dynamic modulus was higher than 90% after being exposed to 300 freeze-
thaw cycles which was good as compared to ASTM failure criteria, which is around 60% of
initial value.
Figure 6.1 Relative dynamic modulus of elasticity of concrete
[Control = Natural aggregate concrete, RC1 = 1st generation repeated recycled coarse aggregate
concrete, RC2 = 2nd
generation repeated recycled coarse aggregate concrete, and RC3 = 3rd
generation repeated recycled coarse aggregate concrete]
As shown in Figure 6.2, the percent change in length of all considered types of concrete
increased as the number of cycles increased. The lowest amount of percentage length change was
observed for control mix after 300 cycles where the highest was observed for RC3. The length
change of RC1 was 8.6% lower than that of RC2 after being exposed to 300 freeze-thaw cycles.
80
85
90
95
100
0 36 72 108 144 180 216 252 288
Rela
tive d
yn
am
ic m
od
ulu
s (
%)
No. of freeze-thaw cycles
Control RC1
RC2 RC3
0 36 72 108 144 180 216 252 288 300

88
Figure 6.2 Length change of concrete
[Control = Natural aggregate concrete, RC1 = 1st generation repeated recycled coarse aggregate
concrete, RC2 = 2nd
generation repeated recycled coarse aggregate concrete, and RC3 = 3rd
generation repeated recycled coarse aggregate concrete]
Figure 6.3 shows the weight change of concrete. In terms of the percentage weight change
for all considered types, initially it showed an increasing pattern and later it was decreasing, then
again little increased and decreased phenomenon were observed. As the weight gain indicated
the presence of micro cracking and the weight loss meant the spalling of concrete (Kriesel et al.
1997). Both of these indicated the ongoing damage process. After 300 cycles the highest amount
of weight change was observed for RC3 which was 66.2%, 15.8%, and 11.7% higher than that of
control, RC1, and RC2, respectively. This was contributed by the attached mortar and the
porosity of RCA3 which subsequently increased the ingression of water inside the concrete. Low
absorption of natural aggregate helped demonstrate comparatively better resistance against the
ingression of moisture.
0
0.03
0.06
0.09
0.12
0.15
0 36 72 108 144 180 216 252 288
Len
gth
ch
an
ge (
%)
No. of cycles
Control RC1
RC2 RC3
0 36 72 108 144 180 216 252 288 300

89
Figure 6.3 Weight change of concrete
[Control = Natural aggregate concrete, RC1 = 1st generation repeated recycled coarse aggregate
concrete, RC2 = 2nd
generation repeated recycled coarse aggregate concrete, and RC3 = 3rd
generation repeated recycled coarse aggregate concrete]
Figure 6.4 shows the durability factor of all considered concrete. The durability factor was
calculated according to ASTM C666 (ASTM 2012)
100M
PNDF (6.4)
where, DF = durability factor of the test specimen, P = relative dynamic modulus of
elasticity at Ncycles, N = number of cycles at which P reaches the specified minimum value for
discontinuing the test or the specified number of cycles at which the exposure is to be
terminated, whichever is less, and M = specified number of cycles at which the exposure is to be
terminated.
As shown in Figure 6.4, better durability performance was observed for control than the
repeated recycled concrete. Slight degradation in durability factor was observer for RC1 which
0
0.7
1.4
2.1
2.8
Weig
ht ch
an
ge (
%)
No. of freeze-thaw cycles
Control RC1
RC2 RC3
0 36 72 108 144 180 216 252 288 300

90
was 97.8% while control achieved 99.7%. Lowest durability factor was found for RC3 (91.2%)
but still it survived up to 300 freeze-thaw cycles which indicates that even RC3 can perform well
under harsh environmental condition. Results indicate that the freeze-thaw durability
performance of repeated recycled concrete is comparable with NAC.
Figure 6.4 Durability factor of concrete
[Control = Natural aggregate concrete, RC1 = 1st generation repeated recycled coarse aggregate
concrete, RC2 = 2nd
generation repeated recycled coarse aggregate concrete, and RC3 = 3rd
generation repeated recycled coarse aggregate concrete]
Along with these tests visual inspection was also done to investigate the damage due to
freeze-thaw exposure. Figures 6.5a-d show the initial condition (before being placed in freeze-
thaw chamber) of different generations repeated recycled coarse aggregate concrete specimens.
On the other hand, Figures 6.6a-d reveal the condition of concrete specimens after being exposed
to 300 freeze-thaw cycles. Concrete spalling was observed and marked with red colour in
Figures 6.6a-d. Though all the considered concrete survived after exposed to 300 cycles, all of
them showed some damages due to spalling. The extent of damage was higher for repeated
recycled coarse aggregate concrete than that of control mix.
0
25
50
75
100
Control RC1 RC2 RC3
Du
rab
ilit
y facto
r (%
)

91
Figure 6.5 Specimens for freeze-thaw durability test before being placed in freeze-thaw chamber
where (a) Control (natural coarse aggregate concrete), (b) 1st generation repeated RCA concrete
(RC1), (c) 2nd
generation repeated RCA concrete (RC2), and (d) 3rd
generation repeated RCA
concrete (RC3)
Figure 6.6 Concrete specimens after being exposed to 300 freeze-thaw cycles where (a) Control
(natural coarse aggregate concrete), (b) 1st generation repeated RCA concrete (RC1), (c) 2
nd
generation repeated RCA concrete (RC2), and (d) 3rd
generation repeated RCA concrete (RC3)
(a)
(b)
(c)
(d)
(d)
(b)
(a)
(c)
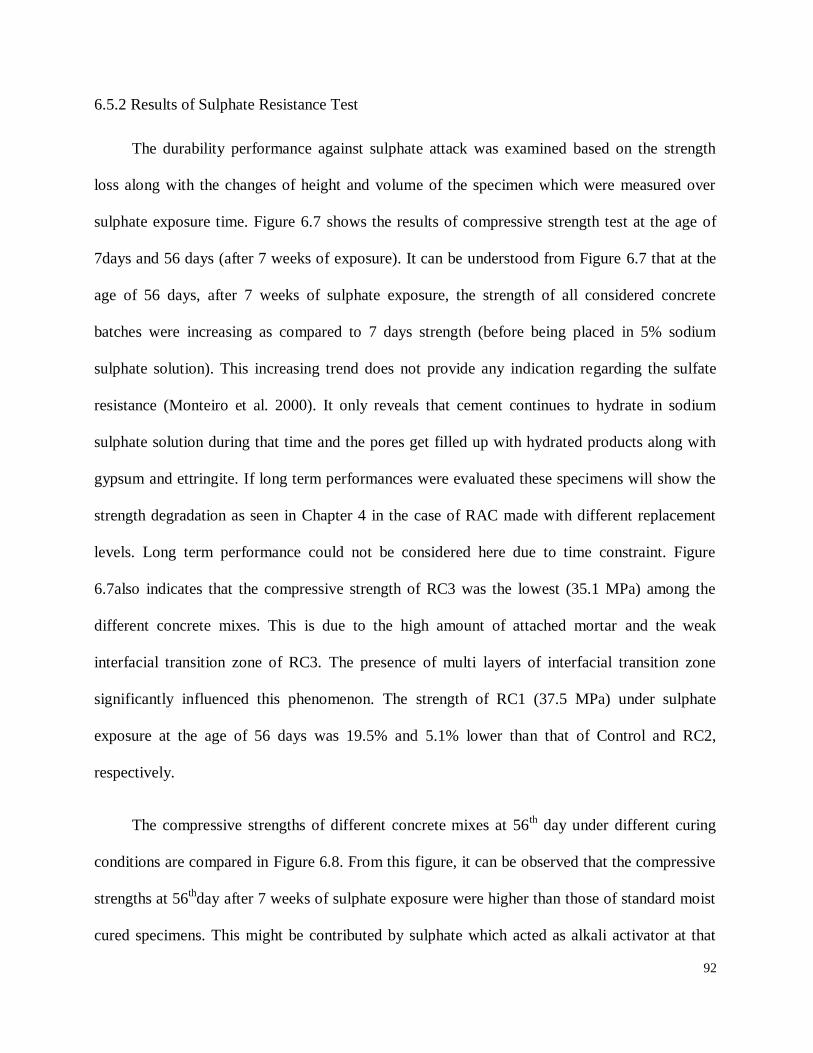
92
6.5.2 Results of Sulphate Resistance Test
The durability performance against sulphate attack was examined based on the strength
loss along with the changes of height and volume of the specimen which were measured over
sulphate exposure time. Figure 6.7 shows the results of compressive strength test at the age of
7days and 56 days (after 7 weeks of exposure). It can be understood from Figure 6.7 that at the
age of 56 days, after 7 weeks of sulphate exposure, the strength of all considered concrete
batches were increasing as compared to 7 days strength (before being placed in 5% sodium
sulphate solution). This increasing trend does not provide any indication regarding the sulfate
resistance (Monteiro et al. 2000). It only reveals that cement continues to hydrate in sodium
sulphate solution during that time and the pores get filled up with hydrated products along with
gypsum and ettringite. If long term performances were evaluated these specimens will show the
strength degradation as seen in Chapter 4 in the case of RAC made with different replacement
levels. Long term performance could not be considered here due to time constraint. Figure
6.7also indicates that the compressive strength of RC3 was the lowest (35.1 MPa) among the
different concrete mixes. This is due to the high amount of attached mortar and the weak
interfacial transition zone of RC3. The presence of multi layers of interfacial transition zone
significantly influenced this phenomenon. The strength of RC1 (37.5 MPa) under sulphate
exposure at the age of 56 days was 19.5% and 5.1% lower than that of Control and RC2,
respectively.
The compressive strengths of different concrete mixes at 56th day under different curing
conditions are compared in Figure 6.8. From this figure, it can be observed that the compressive
strengths at 56thday after 7 weeks of sulphate exposure were higher than those of standard moist
cured specimens. This might be contributed by sulphate which acted as alkali activator at that

93
age under the sulphate exposure and influenced the pozzolanic reactivity of fly ash and thus
increased the strength.
Figure 6.7 The results of compressive strength test at the age of 7days (before being placed in
5% sodium sulphate solution) and 56 days (after 7 weeks of exposure)
[Control = Natural aggregate concrete, RC1 = 1st generation repeated recycled coarse aggregate
concrete, RC2 = 2nd
generation repeated recycled coarse aggregate concrete, and RC3 = 3rd
generation repeated recycled coarse aggregate concrete]
Figure 6.8The results of compressive strength test at the age of 56 days of standard moist curing
cylinders and sulphate exposed cylinders
[Control = Natural aggregate concrete, RC1 = 1st generation repeated recycled coarse aggregate
concrete, RC2 = 2nd
generation repeated recycled coarse aggregate concrete, and RC3 = 3rd
generation repeated recycled coarse aggregate concrete]
29.7
46.6
25.3
37.5
27.6
39.5
17.9
35.1
0
10
20
30
40
50
7 days 56 Days
Co
mp
ressiv
e s
tren
gth
(M
Pa)
Control RC1
RC2 RC3
43.1
35.9 36.8
29
46.6
37.539.5
35.1
0
15
30
45
60
Control RC1 RC2 RC3
Co
mp
ressiv
e s
tren
gth
(M
Pa)
Standard moist curing
Sulphate exposure

94
Statistical analyses were carried out to evaluate the variation of compressive strengths of
four different mixes. Figure 6.9 presents the box plot of data found from the 56 day compressive
strength of moist cured repeated recycled coarse aggregate concrete of different generations
along with the compressive strength of specimens exposed to sulphate for 7 weeks. After being
exposed to sulphate for 7 weeks symmetric distribution was observed for control mixes. RC3
exhibited positive skewness after being exposed to sulphate on the other hands it exhibited
negative skewness for moist curing samples.
Figure 6.9 Compressive strength of various concrete mixes at 56th day
[where a = moist curing and b = after 7 weeks of sulphate exposure]
[Control = Natural aggregate concrete, RC1 = 1st generation repeated recycled coarse aggregate
concrete, RC2 = 2nd
generation repeated recycled coarse aggregate concrete, and RC3 = 3rd
generation repeated recycled coarse aggregate concrete]
The percent change in height and volume of different specimens are shown in Figures 6.10
and 6.11, respectively. Figures 6.10 and 6.11 show a similar trend where the number of
repetitions increased the changes in the height and volume of cylinders also increased. This is
due to the increasing porosity and decreasing bulk density of aggregates with the increased
25
30
35
40
45
50
Control RC1 RC2 RC3
Co
mp
ressiv
e s
tren
gth
(M
Pa)
a
a
aa
b
bb
b

95
number of repetitions. Micro cracking inside the aggregate could be another contributing factor.
The height and volume changes were determined using equations 6.5 and 6.6where the results
are depicted in Figures 6.10and 6.11.
% Height change, 100%
i
it
H
HHH
(6.5)
where, Hi = average initial volume of cylinder (mm); and Ht = average volume of cylinders
after a prescribed exposure period (mm).
% Volume change, 100%
i
it
V
VVV
(6.6)
where Vi = average initial volume of cylinder (mm3); and Vt = average volume of cylinders
after a prescribed exposure period (mm3).
It can be seen from Figure 6.10 that there was significant expansion in the height of
concrete cylinders with increased period of time under sulphate exposure. The change in height
of control concrete was 0.015% after being exposed to sulphate for one week and with time it
was increasing. After 7 weeks of exposure (56 days) the change in height was 0.09% for control
mix. The height change of RC1 was 7.7%, 25%, 66.7% lower than that of control, RC2, and
RC3, respectively at the age of 28 days. The crumbling of concrete cylinders decreased the
height change of RC1. The maximum height expansion was shown by RC3 (0.165%) at 56th day
and it was 57.1% and 17.9% higher than the height expansion of RC1 and RC2, respectively.
RC3 was more permeable in nature than RC1 and RC2 thus increased the sulphate ion ingression
inside the concrete. Multiple layers of interfacial transition zone also worked as a contributing

96
factor. The height change of RC1 was 25% lower than RC2 at the age of 56 days under sulphate
exposure. This was contributed by the porosity and adhered mortar, which were lower for RCA1
as compared to RCA2.
Figure 6.10 Height change (%) of concrete cylinders under sulphate exposure condition
[Control = Natural aggregate concrete, RC1 = 1st generation repeated recycled coarse aggregate
concrete, RC2 = 2nd
generation repeated recycled coarse aggregate concrete, and RC3 = 3rd
generation repeated recycled coarse aggregate concrete]
Figure 6.11shows that volume change of RC3 was 94%, 50%, and 10% higher than that of
control, RC1, and RC2, respectively at the age of 28 days under sulphate exposure. Control
concrete volume expansion was lower than different generation repeated recycled coarse
aggregate concrete over the test period under sulphate exposure. The volume change increased
over time. The maximum volume change was observed for RC3 (0.45%) at 56thday after 7 weeks
of sulphate exposure. These results indicate that as the number of repetitions increases the
sulphate ion ingression inside the concrete increases which consequently affects the volume of
concrete.
0
0.05
0.1
0.15
0.2
14 days 21 days 28 days 56 days
Heig
ht ch
an
ge (
%)
Age (days)
Control RC1
RC2 RC3

97
Figure 6.11 Volume change (%) of concrete cylinders under sulphate exposure condition
[Control = Natural aggregate concrete, RC1 = 1st generation repeated recycled coarse aggregate
concrete, RC2 = 2nd
generation repeated recycled coarse aggregate concrete, and RC3 = 3rd
generation repeated recycled coarse aggregate concrete]
6.5.3 Results of Chloride Ion Ingression into Recycled Concrete
The compressive strength results at the age of 56 days after being exposed to 28 wetting-
drying cycles along with chloride solution for control and different generations of repeated
recycled coarse aggregate concrete are shown in Figure 6.12. Their standard moist curing
compressive strength test results are also shown in Figure 6.12 to examine the degradation of
strength due to chloride propagation. It reveals that chloride propagation does not have any
significant effect on the compressive strength of those considered concrete.
0
0.1
0.2
0.3
0.4
0.5
14 days 21 days 28 days 56 days
Vo
lum
e c
han
ge (
%)
Age (days)
Control RC1
RC2 RC3

98
Figure 6.12 Compressive strength of concrete at the age of 56 days
[Control = Natural aggregate concrete, RC1 = 1st generation repeated recycled coarse aggregate
concrete, RC2 = 2nd
generation repeated recycled coarse aggregate concrete, and RC3 = 3rd
generation repeated recycled coarse aggregate concrete]
Figure 6.13 shows the box plot of compressive strength test results of moist curing and
chloride exposed cylinders at 56th day. This figure shows that the distribution of moist curing
and chloride exposure cylinders’ compressive strength for RC1 and RC2 was normally
distributed, whereas the distributions of compressive strength for RC3 and control concrete
under moist curing and chloride exposure were negatively skewed.
The concentrations of chloride ion per unit surface area of different generations of repeated
recycled coarse aggregate concrete are given in Figure 6.14 and Table A4 (Appendix-A). Control
concrete results are also shown to evaluate their chloride resistance performance. No chloride ion
concentration was found in standard moist curing concrete mixes as presented in Table A4
(Appendix-A).It can be seen from Figure 6.14 that the chloride ion penetration increased as the
number of repetitions increased. Moreover, the chloride concentration was also increasing with
the increased number of cycles. Above mentioned phenomena were contributed by the adhered
0
10
20
30
40
50
Control RC1 RC2 RC3
Co
mp
ressiv
e s
tren
gth
(M
Pa)
Standardard moist curing
Cyclic wetting and drying with chloride solution

99
mortar and multi layers of old interfacial transition zone of repeated recycled coarse aggregate,
causing repeated recycled coarse aggregate concrete more porous and permeable than the control
mix (Otsuki et al. 2003).
Figure 6.13 Compressive strength of various concrete batches at 56th day
[where a = after being exposed to 28 cycles along with chloride solution and b = moist curing]
[Control = Natural aggregate concrete, RC1 = 1st generation repeated recycled coarse aggregate
concrete, RC2 = 2nd
generation repeated recycled coarse aggregate concrete, and RC3 = 3rd
generation repeated recycled coarse aggregate concrete]
At 56th day, after being exposed to 28 wetting and drying cycles with sodium chloride
solution, RC3 showed the highest concentration of chloride ion per unit surface area which was
about 105.9 ppm/m2 and the control mix showed the lowest concentration. However, upto 4
cycles the chloride ion concentration values of RC1 and control were very close. Later, the
chloride ion concentration rate increased gradually for RC1. After exposed to 16 cycles the
chloride concentration of RC2 was 4.1% lower than RC3.
25
30
35
40
45
50
Control RC1 RC2 RC3
Co
mp
ress
ive
stre
ng
th (
MP
a)
a
a
b
a
b
a
bb

100
Figure 6.14 Concentration of chloride ions per unit surface area of concrete cylinder
[Control = Natural aggregate concrete, RC1 = 1st generation repeated recycled coarse aggregate
concrete, RC2 = 2nd
generation repeated recycled coarse aggregate concrete, and RC3 = 3rd
generation repeated recycled coarse aggregate concrete]
0
20
40
60
80
100
120
1 cycle 4 cycles 9 cycles 16 cycles 28 cycles
Ch
lori
de io
n c
on
cen
trati
on
(p
pm
/m2)
Control RC1
RC2 RC3

101
Chapter 7: CONCLUSIONS AND RECOMMENDATIONS
7.1 SUMMARY
Concrete structures are integral parts of modern civil infrastructures constituting a large
portion of national wealth of any country. Every year a huge amount of waste is generated due
the construction and demolition of aging concrete structures, consequently increasing the
environmental loads. Green concrete (recycled and repeated recycled coarse aggregate concrete)
produced using C&D waste offers a sustainable construction material that can reduce overall
impact of concrete production throughout its life cycle. This study was carried out to investigate
the properties of green concrete. Two different target strengths were considered along with two
different patterns of recycled aggregate utilization. One of these was 25 MPa recycled concrete
made with different RCA replacement levels and anther one was 32MParepeated recycled
concrete made with different generations of repeated recycled coarse aggregate. The
performance of these concrete was compared with the control concrete mix. In this chapter the
conclusions of this current study are discussed. In addition, limitations and recommendations for
future study are also outlined here.
7.2 CONCLUSIONS
The fresh, mechanical, and durability properties of the recycled concrete and repeated
recycled coarse aggregate concrete were investigated. The following conclusions are drawn from
this study.

102
7.2.1 Recycled Concrete Made with Different RCA Replacement Levels
The absorption capacity of recycled coarse aggregate was 3.75 times higher than that of
natural coarse aggregate.
As the RCA replacement level increases the compressive strength decreases. Only
exception was Mix-2 (30% RCA) which achieved 5.8% higher strength than that of
Mix-1 (control) at 148th day. This can be attributed to the rough texture and better
interlocking properties RCA. Therefore, upto 30% RCA replacement level, it is possible
to achieve similar or higher compressive strength than the natural coarse aggregate
concrete.
The long term strength development of recycled coarse aggregate concrete is more
favorable than natural aggregate concrete.
The durability performance of recycled concrete is affected by the higher absorption and
porosity of RCA.
The result of sulphate resistance of recycled concrete was quite comparable to NAC.
This study showed that the chloride ion ingression of RAC increased with the increased
RCA replacement level. Repeated Recycled Coarse Aggregate Concrete
7.2.2 Repeated Recycled Coarse Aggregate Concrete
The bulk density, specific gravity, and absorption capacity of different generations of
repeated recycled coarse aggregate decreased with the increased number of repetitions.
The findings of this study show that the CSA A23.2-12A can be used for investigating
the absorption of repeated recycled coarse aggregates..
The values of the splitting tensile strength of RC1 and RC2were 3.1% and 4.1% higher
than the control mix, respectively.

103
The application of different generations of repeated recycled coarse aggregate concrete
exhibited reduction in terms of their strength properties but all of them achieved their
target strength at 120th
day. The compressive strengths of RC1 and RC2 were quite
comparable to the control mix.
Three generations of repeated recycled coarse aggregate concrete successfully passed
the freeze-thaw durability test. The durability performance of repeated recycled coarse
aggregate concrete was satisfactory and for all the considered generations it was above
90% whereas the passing criteria is only 60% initial value. Due to the presence of the
adhered mortar and multi layers of old interfacial transition zone of repeated recycled
coarse aggregates, the chloride ion propagation increased with the increased number of
repetitions. After being exposed to 28 wetting and drying cycles with sodium chloride
solution the values of chloride ion concentration of control, RC1, RC2 and RC3 were
72.9 ppm/m2, 84.5 ppm/m
2, 98.5 ppm/m
2, and 105.9 ppm/m
2, respectively.
7.3 LIMITATIONS OF THIS STUDY
This study has the following limitations mainly due the unavailability of proper equipment
and time constraint.
Height and volume changes of specimens would be more accurate if length comparator
could be used.
For sulphate durability test, prism or bar type specimens are better options rather than
cylinder. Due to unavailability of mold we had to work with cylindrical specimens.
During the production of different generation repeated recycled coarse aggregate
concrete crusher did not have similar sieve/mesh. This was due to the shortage of large

104
capacity crushers in the region, which was also associated with high amount of cost for
this operation.
Strength loss due to sulphate attack of different generations repeated recycled coarse
aggregate concrete was not observed over a long period of time due to time constraint.
Long testing period is required to investigate the sulphate durability performance of
both repeated recycled coarse aggregate concrete and recycled concrete made with
different RCA replacement levels.
7.4 RECOMMENDATIONS FOR FUTURE RESEARCH
Repeated recycled coarse aggregate concrete is a new generation concrete which can be a
sustainable and cost effective solution for construction industry. The results of this study will
surely grow interest among researchers towards new generation concrete. Potential
improvements to the methods and results presented in this study include:
Long time exposure should be considered to evaluate the durability performance of
green concrete.
Combination of NA and different generations of repeated recycled coarse aggregate
with different replacement levels need to be investigated.
The splitting tensile strength and flexural strength of recycled and repeated recycled
concrete under different harsh exposure conditions need to be investigated to get more
accurate idea about their durability performance.
Investigate the fire resistance of both recycled and repeated recycled concrete.
Design guideline should be formulated for recycled concrete mix design.

105
Investigation of the attached mortar content of different generations of repeated
recycled coarse aggregate should be carried out.
Detailed lifecycle analysis should be conducted for recycled concrete.
It is also critical to determine the performance of structural elements (e.g. beams,
columns, walls) made of recycled and repeated recycled concrete.
Markov chain model can be used to predict the performance of different generations of
repeated recycled coarse aggregate concrete.

106
REFERENCES
Abou-Zeid, M.N., Shenouda, M.N., McCabe, S.L., and EI-Tawil, F.A. 2005. “Rein carnation of
concrete.” Concrete International, 27(2): 53-59.
Acker, A.V. 1996. “Recycling of concrete at a precast concrete plant.” Betonwerk und Fertigteil-
Technik/ Concrete Precasting Plant and Technology, 62(6): 3-6.
Ajdukiewicz, A., Kliszczewicz, A. 2002. “Influence of recycled aggregates on mechanical
properties of HS/HPC.” Cement and Concrete Composites, 24(2): 269–279.
Alam, M.S., Slater, E., and Billah, A. 2013. "Green Concrete Made with RCA and FRP Scrap
Aggregate: Fresh and Hardened Properties." J. Mater. Civ. Eng., 25(12): 1783-1794.
American Concrete Pavement Association(ACPA) 1993. Recycling concrete pavement concrete
paving technology, TB-014P.
Annex 5 1999. “C&D waste arisings and their uses and destinations.” Symonds Group Ltd
46967 Final Report Febuary 1999.
ASTM C452. Standard test method for potential expansion of portland-cement mortars exposed
to sulfate. Accessed: 11th Nov 2013.
ASTM C666. Standard test method for resistance of concrete to rapid freezing and thawing.
Accessed: 11th Nov 2012.
ASTM C618. Standard specification for coal fly ash and raw or calcined natural pozzolan for use
in concrete.
ASTMC1012. Standard test method for length change of hydraulic-cement mortars exposed to a
sulfate solution. Accessed: 11th Dec 2012.
Bairagi, N.K., Vidyadhara, H.S., and Ravande, K. 1990. “Mix design procedure for recycled
aggregate concrete.” Construction and Building Materials, 4(4): 188-193.

107
BASF 2013. Available online:
http://www.basf-admixtures.com/en/products/highrange/glenium3030ns/Pages/default.aspx
Accessed: 4th Nov 2013.
BASF 2013. Available online: http://by.genie.uottawa.ca/~csce/MICRO_AIR_DS307.pdf
Accessed: 4th Nov 2013.
Bassuoni, M.,T., and Nehdi, M.,L. 2008. “Durability of self-consolidating concrete to combined
effects of sulphate attack and frost action.” Materials and Structures, 41: 1657–1679.
BCSJ 1978. “Study on recycled aggregate and recycled aggregate concrete.” Concrete Journal
Japan, 16(7): 18–31.
Brown, P.W. 1981.“An evaluation of the sulfate resistance of cements in a controlled
environment.” Cement and Concrete Research, 11: 719-727.
BSI, 2006. Concrete – Complementary British Standard to BS EN 206-1; Part 2: Specification
for Constituent Materials and Concrete. BS 8500-2:2006, November 2006, pp. 38.
Canadian Sailings 2011. Funding Canada’s $400-billion infrastructure deficit- why public-
private partnerships are gaining traction as a long-term strategy, Canada’s weekly trade
and transportation magazine. Available online: http://www.canadiansailings.ca/?p=3413
Accessed: 4th Nov 2013.
CEAP Budget 2009. Canada Economic Action Plan. Available online:
http://www.budget.gc.ca/2009/pdf/budgetplanbugetaire-eng.pdf. Accessed: 4th Nov 2013.
Cement Association of Canada 2012. Available online:
http://www.cement.ca/en/Concrete-and-the-Environment.html
Accessed: 13th Jan 2013.
City of Ottawa 2013. Available online:

108
http://ottawa.ca/en/city-hall/public-consultations/environment/phase-1-discussion-paper
Accessed: 13th Jan 2014.
Cohen, M.D. and Mather, B. 1991. “Sulfate attack on concrete - research needs.” ACI Material
Journal, 88(1): 62-69.
Concrete Association of Canada 2012.
Available online: http://www.cement.ca/en/Concrete-and-the-Environment.html
Accessed: 28th Oct 2012.
Corinaldesi, V., Giuggiolini, M., Moriconi, G. 2002. “Use of rubble from building demolition in
mortars.” Waste Management, 22: 893–899.
Canadian Standards Association, CSA. 2009. “Sieve analysis of fine and coarse aggregate.” CSA
A23.2-2A, CSA, Toronto, Ontario.
Canadian Standards Association, CSA. 2009. “Flexural strength of concrete (using a simple
beam with third-point loading).” CSA A23.2-8C, CSA, Toronto, Ontario.
Canadian Standards Association, CSA. 2009. “Compressive strength of cylindrical concrete
specimens.” CSA A23.2-9C., CSA, Toronto, Ontario.
Canadian Standards Association, CSA. 2009. “Splitting tensile strength of cylindrical concrete
specimens.” CSA A23.2-13C, CSA, Toronto, Ontario.
Canadian Standards Association, CSA. 2009. “Relative density and absorption of fine
aggregate.” CSA A23.2-6A, CSA, Toronto, Ontario.
Canadian Standards Association, CSA. 2009. “Bulk density of aggregate.” CSA A23.2-10A,
CSA, Toronto, Ontario.
Canadian Standards Association, CSA. 2009. “Surface moisture in fine and coarse aggregate.”
CSA A23.2-11A, CSA, Toronto, Ontario.
109
Canadian Standards Association, CSA. 2009. “Relative density and absorption of coarse
aggregate.” CSA A23.2-12A,CSA, Toronto, Ontario.
Canadian Standards Association, CSA. 2009. “Making concrete mixes in the laboratory.” CSA
A23.2-2C, CSA, Toronto, Ontario.
Canadian Standards Association, CSA. 2009. “Making and curing concrete compression and
flexural test specimens.” CSA A23.2,-3C CSA, Toronto, Ontario.
Canadian Standards Association, CSA. 2009. “Air content of plastic concrete by pressure
method.” CSA A23.2-4C CSA, Toronto, Ontario.
Canadian Standards Association, CSA. 2009. “Slump and slump flow of concrete.” CSA A23.2-
5C, CSA, Toronto, Ontario.
Department of Environment, Heritage and Local Government 1998. Changing our ways: a policy
statement on waste management, Dublin.
DIN 2002. Aggregates for mortar and concrete; part 100: recycled aggregates. DIN 4226 – 100,
February 2002, pp. 18.
Donalson, J., Curtis, R., and Najafi, F.T. 2011. “Sustainable assessment of recycled concrete
aggregate (RCA) used in highway construction.” Report No. TRB 2011, submitted for
publication and presentation for the 90th Annual Meeting of the Transportation Research
Board in January 2011 in Washington, D.C.
European Environment Agency 2008. Effectiveness of environmental taxes and charges for
managing sand, gravel and rock extraction in Selected European Union countries. EEA
Report No. 2/2008. Schultz Grafisk, Copenhagen. Available online:
http://www.eea.europa.eu/publications/eea_report_2008_2
Accessed: 22th Oct 2013

110
Etxeberria, M., E., Vázquez, E., Mari, A., and Barra, M. 2007. “Influence of amount of recycled
coarse aggregates and production process on properties of recycled aggregate concrete.”
Cement and Concrete Research, 37: 735-742.
Fathifazl, G., Abbas, A., Razaqpur, A.G., Isgor, O.B., Fournier, B., and Foo, S. 2009. “New
mixture proportioning method for concrete made with coarse recycled concrete aggregate.”
J. Mater. Civ. Eng., 21(10): 601-611.
FHWA. 2004. “Transportation applications of recycled concrete aggregate: FHWA state of the
practice national review September 2004.” U.S. Department of Transportation, Federal
Highways Administration, Washington, DC.
Folić, R. 2009. “Durability design of concrete structures- part 1: analysis fundamentals.”
Architecture and Civil Engineering, 7(1): 1-18.
Gilbert, N. 2005. Ontario Ministry of Transportation, Downsview, ON, January 5, 2005.
Gilpin-Robinson, J.R., Menzie, D.W., Hyun, H. 2004. “Recycling of construction debris as
aggregate in the Mid-Atlantic Region, USA.” Resour. Conserv. Recycl., 2(3): 275–94.
Gokce, A., Nagataki, S., Saeki, T., and Hisada, M. 2004. “Freezing and thawing resistance of air-
entrained concrete incorporating recycled coarse aggregate: The role of air content in
demolished concrete.” Cement and Concrete Research, 34(5): 799-806.
Gomez-Soberon, J.M.V. 2002. “Porosity of recycled concrete with substitution of recycled
concrete aggregate – an experimental study.” Cement and Concrete Research, 32: 1301–
1311.
Gonzalez-Fonteboa, B., Martinez-Abella, F., Carro-Lopez, D., and Martinez-Lage, I. 2009.
“Design of recycled concrete under ultimate limit state by normal stresses.” Proceeding of

111
2nd International RILEM Conference on Progress of Recycling in the Built Environment
2-4 December 2009, Sao Paulo, Brazil, pp: 275-285.
Grubl, P., and Ruhl, M. “German committee for reinforced concrete (DAfStb) – code: concrete
with recycled aggregates.” Stainable Construction : Use of Recycled Concrete Aggregate,
London, U.K., University of Dundee, Concrete Technology Unit, London, UK (Publisher),
1998, pp 8.
Hadejeiva- Zaharieva, R., Dimitrovab, E., Buyle-Bodinc, F. 2003. “Building waste management
in Bulgaria: challenges and opportunities.” Waste Management, 23: 749–761.
Hameed, M. 2009. “Impact of transportation on cost, energy, and particulate emissions for
recycled concrete aggregate.” Master’s Thesis, University of Florida, Florida, USA.
Hansen, T.C, Hedegkd, S.E. 1984. “Properties of recycled aggregate concretes as affected by
admixtures in original concretes.” Journal of the American Concrete Institute, 81(1): 21–
26.
Hansen, T.C. (Ed.), 1992. “Recycling of demolished concrete and masonry.” RILEM Report 6 &
FN Spon, London, 1-160.Taylor & Francis, London and New York., K.
Hansen, T.C. (Ed.), 1992. “Recycling of demolished concrete and masonry.” Taylor & Francis,
London and New York.
Hansen, T.C. and Narud, H. 1983. “Strength of recycled concrete made from crushed concrete
coarse aggregate.” Concrete International, 5: 79–83.
Hasaba, S., Kawamura, M., Toriik, K. 1981. “Drying shrinkage and durability of concrete made
of recycled concrete aggregates.” Japan Concrete Institute, 3:55–60.
Hawkins, R. 2009. “Recycled aggregates.” A report prepared by Bill Brown Consultant using US
Geological Survey 2006 to 2009.

112
Hong, K. 1998. “Cyclic wetting and drying and its effects on chloride ingress in concrete.”
Master’s thesis, Department of Civil Engineering, University of Toronto, Toronto, ON,
Canada.
Hong, K., Hooton, R.D. 1999. “Effects of cyclic chloride exposure on the penetration of concrete
cover.” Cement and Concrete Research, 29: 1379-1386.
Huda, S.B, Shahriar, A., Alam, M.S., Hewage, K., and Sadiq, R. 2014. “Sustainability
assessment of recycled concrete- a life cycle approach.” Submitted to Construction
Building Materials, manuscript number CONBUILDMAT-D-14-00338.
Huda, S.B., Islam, M.S., Slater, E., and Alam, M.S. 2013. “Green concrete from industrial
wastes: a sustainable construction material.” First Intl Conference on Concrete
Sustainability 2013, Tokyo, Japan, 27-29 May 2013, Ref. 0084, 8p.
Hyder Consulting 2011. “Construction and demolition waste status report - management of
construction and demolition waste in Australia.” A report prepared for Department of
Sustainability, Environment, Water, Population and Communities and Queensland
Department of Environment and Resource Management.
Jeffrey, C. 2011. “Construction and demolition waste recycling a literature review.” A report
prepared by Dalhousie University’s Office of Sustainability and financial Support provided
by Resource and Recovery Fund Board of Nova Scotia.
Kamel, A.M.E.A., and Abou-Zeid, M.N. 2008. “Key performance and economic considerations
for using recycled concrete aggregate.” In 87th
Annual Meeting, Transportation Research
Board, National Academy of Science, 08-1073, Washington, DC.

113
Kasai, Y. 2004. Recent trends in recycling of concrete waste and use of recycled aggregate
concrete, Recycling concrete and other materials for sustainable development, ACI text,
SP-219-2, Farmington Hills, Michigan 11-34.
Katz, A. 2003. “Properties of concrete made with recycled aggregate from partially hydrated
old concrete.” Cement and Concrete Research, 33(5): 703-711.
Kawano H. 2003. “The state of using by-products in concrete in Japan and outline of JIS/TR on
recycled concrete using recycled aggregate.” Proceedings of the 1st FIB Congress on
recycling, pp: 245–53.
Khatib, J. M. 2005. “Properties of concrete incorporating fine recycled aggregate,” Cement and
Concrete Research, 35: 763-769.
Kriesel, R., Snyder, M., and French, C. E. 1997. “Freeze-thaw durability of high-strength
concrete.” Report no. MnDOT 1998-10, Minnesota Department of Transportation. Center
for Transportation Studies, University of Minnesota, USA.
Kuroda, Y., and Hashida, H.2005. “A closed-loop concrete system on a construction site.” In
international symposium on sustainable cement, concrete and concrete structures, Toronto,
Ontario, October 5-7, 2005. pp: 371-388.
Kwan, W.H., Ramli, M., Kam, K.J., and Sulieman, M.Z. 2012. “Influence of the amount of
recycled coarse aggregate in concrete design and durability properties.” Construction and
Building Materials, 26(1): 565–573.
Leite, M.B., Figueire do Filho, J.G., and Lima, P.R.L. 2013. “Workability study of concretes
made with recycled mortar aggregate.” Materials and Structures, 46: 1765-1778.
Lemay, L. 2011. “Life cycle assessment of concrete buildings.” A report (concrete sustainability
report) prepared by NRMCA.

114
Available online: http://www.nrmca.org/sustainability/CSR04%20-
20Lif.e%20Cycle%20Assessment%20of%20Concrete%20Buildings.pdf
Accessed: 30th Nov 2013.
Li, S., Nantung, T., and Jiang, Y. 2005. “Assessing issues, technologies, and data needs to meet
traffic input requirements by ME pavement design guide: implementation initiatives.” 05-
143, Transportation Research Board, 84 The Annual Meeting, Washington, DC, January 9-
13.
Li, X. 2008. “Recycling and reuse of waste concrete in China part I. material behaviour of
recycled aggregate concrete.” Resources, Conservation and Recycling, 53: 36-44.
Limbachiya, M.C., Leelawat, T., and Dhir, R. K. 1998. Sustainable construction: use of recycled
concrete aggregate. Proceedings of the International Symposium organized by the
Concrete Technology Unit of University of Dundee, London, UK, 11-12 November 1998.
Dhir, R.K., Henderson, N.A., and Limbachiya, M. C.(eds.) pp. 227-238.
Limbachiya, M. C., Leelawat, T., and Dhir, R. K. 2000. “Use of recycled concrete aggregate in
high strength concrete.” Materials and Structures, 33(233): 574-580.
Lin, Y.H., Tyan, Y.Y., and Lee, P.C. 2005. “Study on the mix proportioning design of recycled
concrete by the taguchi method.” In proceedings of the Tenth International Conference on
Civil, Structural and Environmental Engineering Computing, Civil-Comp Press,
Stirlingshire, UK, paper 21, DOI: 10.4203/ccp.81.21.
Mailvaganan, N. P. 1992. “Repair and Protection of Concrete Structures,” CRC Press.
Malesev, M., Radonjanin, V., and Marinkovic, S. 2010. “Recycled concrete as aggregate for
structural concrete production.” Sustainability , 2: 1204-1225.

115
Marinkovic, S., Radonjanin, V., Malesev., and Ignjatovic, I. 2010. “Comparative environmental
assessment of natural and recycled aggregate concrete.” Waste Management, 30, 2255-
2264.
McCarter, W.J. and Watson, D. 1997. “Wetting and drying of cover-zone concrete.” Proceedings
of the institute of Civil Engineers - Structures and Buildings, 122(2): 227-236.
Mehta, P.K., Pirtz, D., and Polivka, M. 1979. “Properties of alite cements.”, Cement and
Concrete Research, 9: 439-50.
Mehta, P.K. and Gjorv, O.E. 1974. “A new test for sulfate resistance of cements.” J. of Testing
and Evaluation, 2(6): 510-15.
Michael, N., Venta, G., and Foo, S. 2003. “Demolition and deconstruction: review of the current
status of reuse and recycling of building materials.” The Air & Waste Management
Association (A&WMA) Report, Ontario, Canada.
Miller, G . 2005. “Running out of gravel and rock.” Toronto Star, January 6, p. A22.
Mirza, S. (2007). Danger ahead: the coming collapse of Canada’s municipal infrastructure.
Federation of Canadian Municipalities, pp: 1-24.
Monteiro, P.J.M., Roesler, J., Kurtis, K.E., and Harvey, J. 2000. “Accelerated test for measuring
sulphate resistance of hydraulic cements for Caltrans LLPRS program.” California
Department of Transportation, Report No: FHWA/CA/OR-2000/03, Pavement Research
Centre, Institute of Transportation Studies, University of California, Berkeley.
Moukawa, M. 1990. “Deterioration of concrete in cold sea waters.” Cement and Concrete
Research, 20(3): 439- 446.
Municipal waste statistic. Available online:
http://epp.eurostat.ec.europa.eu/statistics_explained/index.php/Municipal_waste_statistics

116
Accessed: 22th Jan 2013.
Nassar, R. and Soroushian, P. 2012. “Strength and durability of recycled aggregate concrete
containing milled glass as partial replacement for cement.” Construction and Building
Materials, 29: 368-377.
Neville, A.M. 2011. Properties of concrete. 5th edition, Pearson Education Limited, Essex,
England.
Nisbet, M., Venta, G., and Foo, S. 2001. “Demolition and deconstruction: review of the current
status of reuse and recycling of building materials.”
NIST Engineering Laboratory 2013. Available online:
http://www.nist.gov/el/building_materials/inorganic/ltpc.cfm
Accessed: 25th Jan 2014.
Nobuaki Otsuki,N., Miyazato, S., and Yodsudjai, W. 2003. “Influence of recycled aggregate on
interfacial transition zone, strength, chloride penetration and carbonation of concrete.”
ASCE J. Mater. Civ. Eng., 15: 443-451.
Noguchi , T. 2005. “An outline of Japanese industrial standards (JIS) as related to sustainability
issues.” In international symposium on sustainable cement, concrete and concrete
structures, Toronto, Ontario, October 5-7, 2005. pp: 407-422
Oikonomou, N.D. 2005. “Recycled concrete aggregates.” Cement and Concrete Composites,
25(2): 315-318.
Olorunsogo, F.T., Padayachee, N. 2002. “Performance of recycled aggregate concrete monitored
by durability indexes.” Cement Concrete Research, 32(2): 179–185.
117
Otsuki, N., Miyazato, S., and Yodsudjai, W. 2003. “Influence of recycled aggregate on
interfacial transition zone, strength, chloride penetration and carbonation of concrete.”
Journal of Material in Civil Engineering, 15(5): 443-451.
Poon, C.S., Z.H. Shui, Z.H., Lam, L., Fok, H., and Kou, S.C. 2004. “Influence of moisture states
of natural and recycled aggregates on the slump and compressive strength of concrete.”
Cement and Concrete Research, 34: 31-36.
Poon, C.S., Kou, S.C., and Lam, L. 2002. “ Use of recycled aggregates in molded concrete bricks
and blocks.” Construction and Building Materials, 16(5): 281-289.
QCL Group, 1999. “Sulphate attack and chloride ion penetration: their role in concrete
durability.” Technical note, 8 pages.
Rahal, K., 2007. “Mechanical properties of concrete with recycled coarse aggregate.” Building
and Environment, 42(1): 407–415.
Rao A. 2005. “Experimental investigation on use of recycled aggregates in mortar and concrete.”
Master’s Thesis, Department of Civil Engineering, Indian Institute of Technology Kanpur;
India.
Rao, A., Jha, K.N., and Misra, S. 2007. “Use of aggregates from recycled construction and
demolition waste in concrete.” Resources, Conservation and Recycling, 50(1): 71-81.
RILEM TC 121-DRG, 1994. “RILEM recommendation: specifications for concrete with
recycled aggregates.” Materials and Structures 27: 557-559.
Salem, R.M., and Burdette, E.G. 1998. “Role of chemical and mineral admixture on physical
properties and frost-resistance of recycled aggregate concrete.” ACI Materials Journal
95(5): 558-563.

118
Salem, R.M., Burdette, E.G., and Jackson, N.M. 2003. “Resistance to freezing and thawing of
recycled aggregate concrete.” ACI Materials Journal 100 (3): 216-221.
Sagoe-Crentsil, K., Brown, T., and Taylor, A.H. 2001. “Performance of concrete made with
commercially produced coarse recycled concrete aggregate.” Cement and Concrete
Research, 31(5): 707-712.
Saotome, T. 2007. “Development of construction and demolition waste recycling in Ontario.”
School of Engineering Practice SEP 704, McMaster University, Hamilton, ON, Canada.
Siddique, R. 2003. “Effect of fine aggregate replacement with Class F fly ash on the mechanical
properties of concrete.” Cement and Concrete Research, 33: 539-547.
Shayan, A., and Xu, A. 2003. “Performance and properties of structural concrete made with
recycled concrete aggregate.” ACI Material Journal, 100(5): 371-380.
Smith, J.T., Tighe, S.L., Norris, J., Kim, E., and Xu, X. 2008. “Coarse recycled aggregate
concrete pavements-design, instrumentation, and performance.” In proceedings of annual
conference of the Transportation Association of Canada, September 21-24, 2008, Toronto,
ON, Canada.
Smith, J.T.2009. “Recycled concrete aggregate – a viable aggregate source for concrete
pavements.” PhD Dissertation, Department of Civil Engineering, University of Waterloo,
Waterloo, ON, Canada.
Sjunnesson, J. (2005). “Life cycle assessment of concrete”, Master thesis, Department of
technology and society, environmental and energy systems studies, Lund university, Lund,
Sweeden.
Statistics Canada 2006. Government of Canada. Available online: http://www.statcan.gc.ca
Accessed: 10th October 2009.

119
Statistics Canada 2008. Waste management industry survey: business and government sectors.
Available online: http://www.statcan.gc.ca/pub/16f0023x/2010001/t005-eng.pdf
Accessed: 11th Jan 2014.
Tabsh, S.W. and Abdelfatah, A.S. 2009. “Influence of recycled concrete aggregates on strength
properties of concrete.” Construction and Building Materials, 23: 1163–1167.
Tam, V. 2008. “Economic comparison of concrete recycling: A case study approach.”
Resources, Conservation and Recycling, 52(5): 821-828.
Tavakoli, M., and Soroushian, P. 1996. “Strengths of recycled aggregate concrete made using
field-demolished concrete as aggregate.” ACI Materials Journal, 93(2): 182–190.
Topcu, I.B., and Sengel, S. 2004. “Properties of concretes produced with waste concrete
aggregate.” Cement and Concrete Research, 34(8): 1307-1312.
Tu, T.Y., Chen, Y.Y., and Hwang, C.L. 2006. “Properties of HPC with recycled aggregates.”
Cement and Concrete Research, 36: 943-950.
Ulloa, V. A., Garcia-Taengua, E., Pelufo, M., Domingo, A., and Serna, P. 2013. “New views on
effect of recycled aggregates on concrete compressive strength.” ACI Materials Journal
110(6) : 687-696.
United States Environmental Protection Agency (EPA). 2009. “Municipal Solid Waste
Generation, Recycling, and Disposal in the United States: Facts and Figures for 2009.”
United States Environmental Protection Agency Solid Waste and Emergency Response
(5306P), Washington, DC.
U.S. Green Building Council (USGBC) 2014. Available online:
http://www.usgbc.org/leed/rating-systems
Accessed : 22nd Jan 2014.

120
Waste management world 2011. “Rebuilding C&D Waste Recycling Efforts in India.”
Available online: http://www.waste-management-world.com/articles/print/volume-
12/issue-5/features/rebuilding-c-d-waste-recycling-efforts-in-india.html
Accessed : 15th Jan 2014.
Wischers, G., Manns, W.1974. “Technology of structural lightweight concrete.” In: G. Bologna
(Ed.) Lightweight Aggregate Concrete Technology and World Application,
CEMBUREAU, Paris pp. 23–35.
Yamato. T, Y. Emoto, M. Soeda, Y. Sakamoto. 1998. “Some properties of recycled aggregate
concrete.” Proceedings of the Second International Symposium (RILEM) on Demolition
and Reuse of Concrete and Masonary, Tokyo, Japan, vol. 2 , pp. 643–651
Yang, K.H., Chung, H., and Ashraf F. Ashour, A.F. 2008. “Influence of type and replacement
level of recycled aggregates on concrete properties.” ACI Materials Journal, 105(3): 289-
296.
Yeheyis, M., Hewage, K., Alam, M.S., Eskicioglu, C., and Sadiq, R. 2013. “An overview of
construction and demolition waste management in Canada: a lifecycle analysis approach to
sustainability.” Clean Technologies and Environmental Policy, 15(1): 81-91.
Yeomans, S.R.1994. “Performance of black, galvanked, and epoxy-coated reinforcing steels in
chloride contaminated concrete.” Corrosion, 50(1): 72-81.
Zaharieva, R., Buyle-Bodin, F., and Wiequin, E 2003. “Assessment of the surface properties of
recycled aggregate concrete.” Cement and Concrete Composites, 25(2): 223-232.
Zhao, W. and Rotter, S. 2008. “The current situation of construction & demolition waste
management in China.” 2nd International Conference on Bioinformatics and Biomedical
Engineering, ICBBE 2008, pp. 4747-4750.

121
APPENDIX-A: COMPRESSIVE STRENGTH AND CHLORIDE ION
CONCENTRATION
Table A1: Chemical composition (after Siddique 2003)
Chemical
composition
Class F fly ash
(%)
ASTM C618
(%)
Silicon dioxide, SiO2 55.3
Aluminum oxide,
Al2O3 25.7
Ferric oxide, Fe2O3 5.3
SiO2+ Al2O3+Fe2O3 85.9 70 min
Calcium oxide 5.6
Magnesim oxide 2.1 5 max
Titanium oxide 1.3
Potassium oxide 0.6
Sodium oxide 0.4 1.5 max
Sulfure trioxide 1.4 5 max
LOI (1000ᵒC) 1.9 6 max
Moisture 0.3 3 max
Table A2: Concentration of chloride ions per unit surface area of concrete cylinder
Concentration of chloride ions per unit surface area of
cylinder (ppm/m2)
Mix -1 Mix -2 Mix -3 Mix -4 Mix -5 Mix -6
Standard moist Curing 0.00 0.00 0.00 0.00 0.00 0.00
1 cycle (29th day) 19.15 26.39 34.42 34.26 36.69 39.25
4 cycles (32nd
day) 30.06 33.60 36.39 43.41 46.91 49.05
9 cycles (37th day) 31.06 35.73 46.80 48.63 56.73 77.62
16 cycles (44th
day) 43.25 46.54 63.78 70.17 78.60 82.74
28 cycles (56th
day) 60.91 62.93 77.87 79.80 95.63 99.63
90 cycles (118th day) 91.59 109.55 121.17 144.00 163.08 166.15
120 cycles (148th day) 120.96 123.53 131.25 185.61 196.57 198.19
[Mix-1 = Control, Mix-2 = 30% RCA, Mix-3 = 40% RCA, Mix-4 =50% RCA, Mix-5 =75%
RCA, and Mix-6 =100% RCA]

122
Table A3: Compressive strength of the natural coarse aggregate concrete and different
generations repeated RCA concrete
Age
(days)
Compressive strength
(MPa)
Control
3 24.0
7 29.7
28 40.3
56 43.1
1st generation repeated
RCA Concrete (RC1)
3 20.9
7 25.3
28 33.7
56 35.9
2nd
generation repeated
RCA Concrete (RC2)
3 22.8
7 27.6
28 34.5
56 36.8
3rd
generation repeated
RCA Concrete (RC3)
3 14.4
7 17.9
28 23.6
56 29.0
Table A4: Concentration of chloride ions per unit surface area of concrete cylinder
Concentration of chloride ions per
unit surface area of cylinder
(ppm/m2)
Control RC1 RC2 RC3
Standard moist
Curing 0 0 0 0
1 cycle (29th day) 45.43 46.06 56.64 66.25
4 cycles (32nd
day) 47.22 49.62 67.60 72.28
9 cycles (37th day) 56.48 63.77 79.35 84.36
16 cycles (44th
day) 64.05 76.39 96.74 100.83
28 cycles (56th
day) 72.90 84.54 98.49 105.88
[Control = Natural aggregate concrete, RC1 = 1st generation repeated recycled coarse aggregate
concrete, RC2 = 2nd
generation repeated recycled coarse aggregate concrete, and RC3 = 3rd
generation repeated recycled coarse aggregate concrete]