Measuring Walking Quality Through iPhone Mobility Metrics
17
Measuring Walking Quality Through iPhone Mobility Metrics May 2021
Transcript of Measuring Walking Quality Through iPhone Mobility Metrics
Measuring Walking Quality Through iPhone Mobility Metrics May 2021
Overview 3 ..........................................................................................................................................
Introduction 3 ......................................................................................................................................................
Development 4 ....................................................................................................................................
Study Design 4 ...............................................................................................................................................
Population 6 ....................................................................................................................................................
Results 8 .............................................................................................................................................
Step Count 8 .......................................................................................................................................................
Walking Speed 9 .................................................................................................................................................
Step Length 10 ....................................................................................................................................................
Double Support Time 11 ......................................................................................................................................
Walking Asymmetry 12 ........................................................................................................................................
Discussion 13 ......................................................................................................................................
Conclusions 14 ....................................................................................................................................
Appendix 14 ........................................................................................................................................
Data Sanity 14 .................................................................................................................................................
Statistical Methods 15 ....................................................................................................................................
Asymmetry Definition 15 .................................................................................................................................
References 16......................................................................................................................................
Measuring Walking Quality Through Mobility Metrics May 2021 2
Contents
Overview Using the motion sensors built into iPhone 8 and later, iOS 14 provides Mobility metrics that are important for your health. This includes estimates of walking speed, step length, double support time, and walking asymmetry , — all metrics that can be used 1 2
to characterize your gait and mobility. This paper provides a detailed understanding of how these Mobility metrics are estimated on iPhone, including testing and validation.
Introduction Walking is a key indicator of an individual’s injury, disability, and short- and long-term health. , Walking 3 4 5 6
mobility can represent the ability to age with independence, with mobility being affected by a variety of 7
health conditions including muscular degeneration, neurological disease, , and cardiopulmonary 8 9 10
fitness. A simple way that health practitioners measure an individual’s mobility is by observing walking. , 11 12 13
Walking requires a suite of complex components that are coordinated across multiple physiological systems, where a single failure in any element may indicate progression of disease or an increased risk of injury.
Measurement of walking performance is often used to assess an individual’s health status, track recovery 14
from injury and surgery, or monitor changes with aging. Some commonly employed walking performance 15 16 17
measurements are walking speed, step length, double support time, and walking asymmetry.
• Walking speed, and its change over time, is closely related to clinically meaningful health outcomes.4, 18
Measured walking speed is frequently used to track the recovery of acute health events such as joint replacement3 and stroke, as well as for monitoring changes over time such as the progression of 19
Parkinson’s disease10, and aging. 20 21
• Step length is a marker of compromised mobility for types of neurologic and musculoskeletal conditions,14 and it’s predictive of falls and fear of falling. Step length decreases with age, with older adults 22
showing reduced step lengths relative to younger counterparts. , Shortening step length is an 23 24
important consideration as we age, and early exercise interventions may provide a way to maintain 25
independence. , 26 27
• Double support time is the proportion of time that both feet are touching the ground during walking. It increases both in absolute time and as a percentage of each gait cycle with injury16 or dysfunction. An 28
increase in double support time has been related to a rise in an individual’s fear of falling,22 while lower double support times are correlated with improved walking stability and lower risk of falling. 29
• Walking asymmetry emerges when a unilateral pathology or injury occurs and an individual relies on the contralateral limb during walking. Increases in walking asymmetry occur after injury or due to 30
neurodegeneration from aging or disease.20, Declines in bilateral coordination between the two legs 31
have been shown to be tied to an increased risk of falling , and poor surgical outcomes,30 and they’re 32 33
predictive of later joint injury. , 34 35
Measuring Walking Quality Through Mobility Metrics May 2021 3
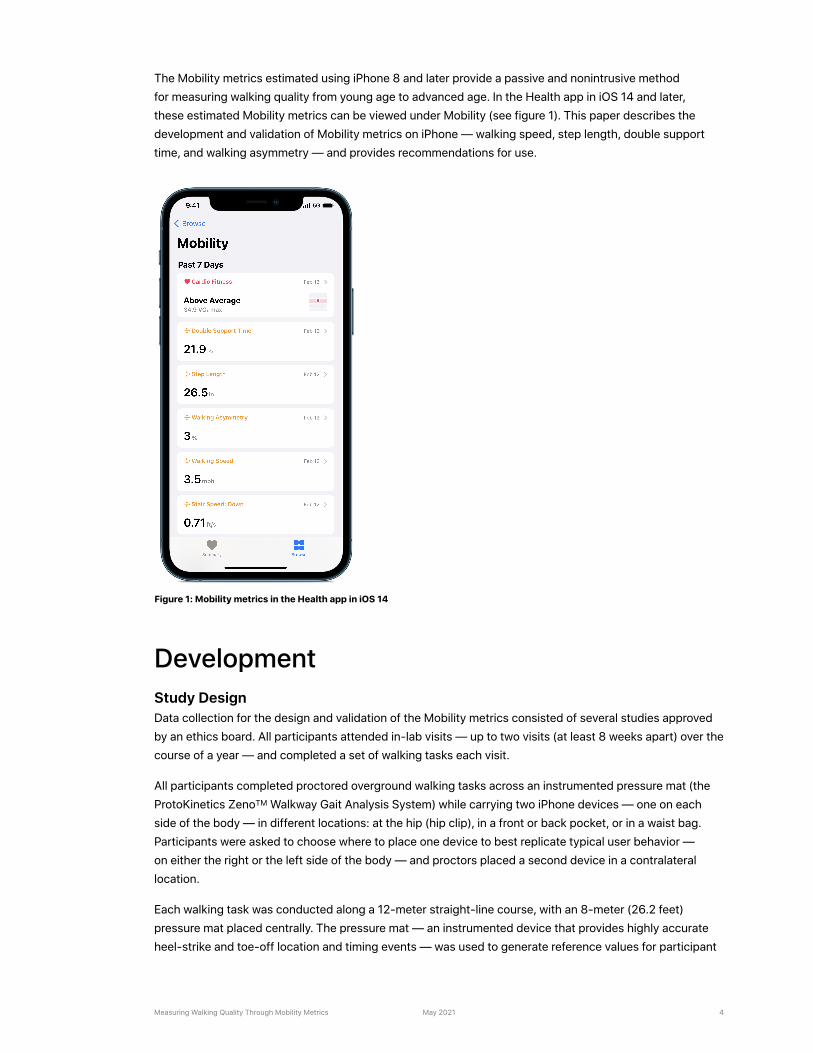
The Mobility metrics estimated using iPhone 8 and later provide a passive and nonintrusive method for measuring walking quality from young age to advanced age. In the Health app in iOS 14 and later, these estimated Mobility metrics can be viewed under Mobility (see figure 1). This paper describes the development and validation of Mobility metrics on iPhone — walking speed, step length, double support time, and walking asymmetry — and provides recommendations for use.
Development Study Design Data collection for the design and validation of the Mobility metrics consisted of several studies approved by an ethics board. All participants attended in-lab visits — up to two visits (at least 8 weeks apart) over the course of a year — and completed a set of walking tasks each visit.
All participants completed proctored overground walking tasks across an instrumented pressure mat (the ProtoKinetics ZenoTM Walkway Gait Analysis System) while carrying two iPhone devices — one on each side of the body — in different locations: at the hip (hip clip), in a front or back pocket, or in a waist bag. Participants were asked to choose where to place one device to best replicate typical user behavior — on either the right or the left side of the body — and proctors placed a second device in a contralateral location.
Each walking task was conducted along a 12-meter straight-line course, with an 8-meter (26.2 feet) pressure mat placed centrally. The pressure mat — an instrumented device that provides highly accurate heel-strike and toe-off location and timing events — was used to generate reference values for participant
Measuring Walking Quality Through Mobility Metrics May 2021 4
Figure 1: Mobility metrics in the Health app in iOS 14
step count, walking speed, step length, double support time, and walking asymmetry. For further details on the experimental setup, see the “Data Sanity” section in the Appendix.
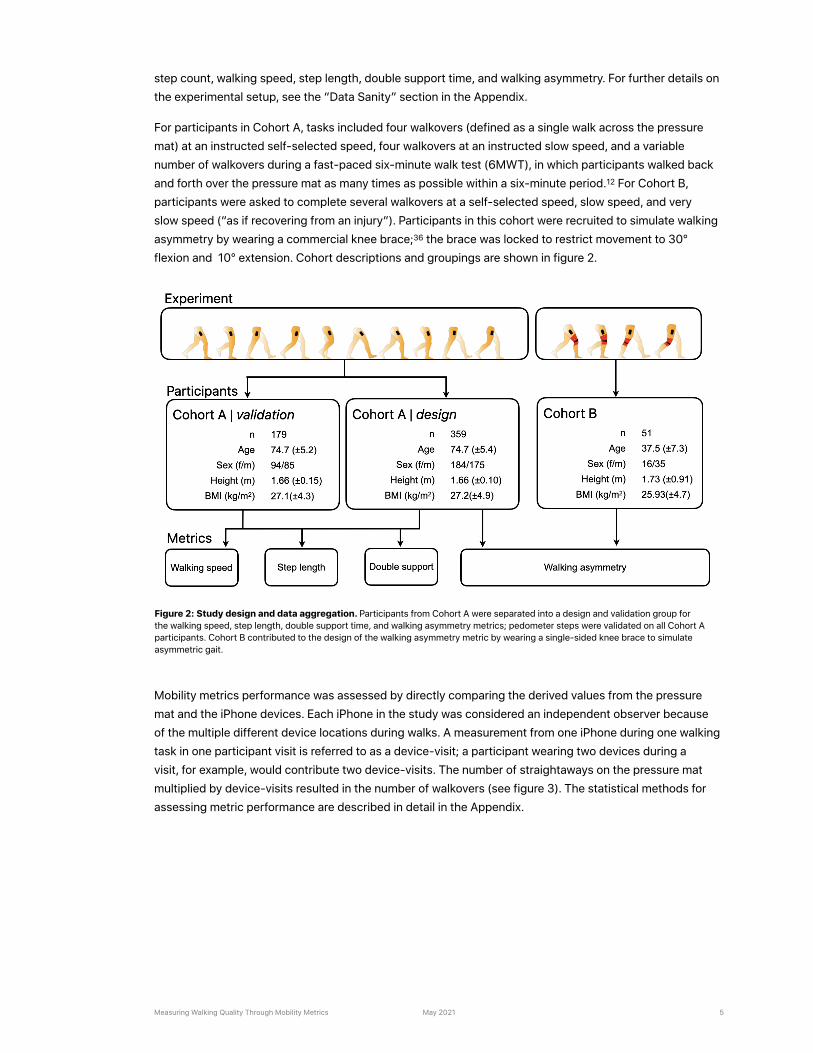
For participants in Cohort A, tasks included four walkovers (defined as a single walk across the pressure mat) at an instructed self-selected speed, four walkovers at an instructed slow speed, and a variable number of walkovers during a fast-paced six-minute walk test (6MWT), in which participants walked back and forth over the pressure mat as many times as possible within a six-minute period.12 For Cohort B, participants were asked to complete several walkovers at a self-selected speed, slow speed, and very slow speed (“as if recovering from an injury”). Participants in this cohort were recruited to simulate walking asymmetry by wearing a commercial knee brace; the brace was locked to restrict movement to 30° 36
flexion and 10° extension. Cohort descriptions and groupings are shown in figure 2.
Mobility metrics performance was assessed by directly comparing the derived values from the pressure mat and the iPhone devices. Each iPhone in the study was considered an independent observer because of the multiple different device locations during walks. A measurement from one iPhone during one walking task in one participant visit is referred to as a device-visit; a participant wearing two devices during a visit, for example, would contribute two device-visits. The number of straightaways on the pressure mat multiplied by device-visits resulted in the number of walkovers (see figure 3). The statistical methods for assessing metric performance are described in detail in the Appendix.
Measuring Walking Quality Through Mobility Metrics May 2021 5
Figure 2: Study design and data aggregation. Participants from Cohort A were separated into a design and validation group for the walking speed, step length, double support time, and walking asymmetry metrics; pedometer steps were validated on all Cohort A participants. Cohort B contributed to the design of the walking asymmetry metric by wearing a single-sided knee brace to simulate asymmetric gait.

Population Apple collected data for the design and validation of the Mobility metrics across multiple studies involving two cohorts of study participants; studies were approved by an ethics board, and all participants consented to the collection and use of their data for this purpose. Cohort A was a large group of older adults who live either in the community or in independent living housing (see table 1). Cohort B was a group of younger, able-bodied adults who were asked to wear a knee brace to elicit asymmetry (see table 2).
Measuring Walking Quality Through Mobility Metrics May 2021 6
Figure 3: Example data collection and analysis. Above are two examples of data collections for Cohort A. Participants were instructed to wear two devices while completing 4 walkovers on the pressure mat at a slow speed, 4 walkovers at a self-selected speed, and as many walkovers as possible for the 6MWT. Data sets for each condition were included in analysis only if they contained at least 3 valid walkovers at each instructed speed and at least 10 valid walkovers for the 6MWT. Data across conditions and devices were collapsed together to calculate metric performance through estimates such as the standard deviation of absolute error (σerror) and minimal detectable change.

Table 1. Cohort A participant characteristics
Unique participants Design (N = 359) Validation (N = 179)
Demographics and biometrics
Age 74.7 (±5.4) [64, 92] 74.7 (±5.3) [65, 95]
Gender (female/male) 184/175 93/86
Height (meters) 1.66 (±0.10) [1.43, 1.95] 1.66 (±0.95) [1.44, 1.88]
BMI (kg/m2) 26.6 (±4.4) [17.4, 43.8] 26.9 (±4.1) [17.9, 39.3]
Prevalence of musculoskeletal conditions 292 (81%) 142 (80%)
Prevalence of cardiovascular conditions* 259 (72%) 124 (69%)
Prevalence of neurological conditions 54 (15%) 27 (15%)
Assistive devices 13 (5%) <10 (<5%)
Musculoskeletal conditions — number (%)
Amputation <10 (<5%) <10 (<5%)
Arthritis 94 (26%) 40 (22%)
Balance disorder 64 (18%) 34 (19%)
Degenerative disc disease 27 (8%) 11 (6%)
Head or neck problems 41 (11%) 20 (11%)
Osteoarthritis 177 (49%) 88 (49%)
Rheumatoid arthritis <10 (<5%) <10 (<5%)
Ruptured or herniated disc 23 (6%) 18 (10%)
Joint replacement surgery 58 (16%) 29 (16%)
Other 157 (44%) 75 (42%)
*Hypertension, heart attack, heart failure, coronary artery disease, stroke, hyperlipidemia, PAD, arrhythmia.
Table 2. Cohort B participant characteristics
Design (N = 51)
Demographics and biometrics
Age 37.5 (±7.3) [26, 55]
Gender (female/male) 16/35
Height (meters) 1.73 (±0.91) [1.55, 1.89]
BMI (kg/m2) 25.9 (±4.7) [18.3, 42.7]
Measuring Walking Quality Through Mobility Metrics May 2021 7
Results Aggregate results for participants in Cohort A are shown in table 3; these results are collapsed across design and validation data sets.
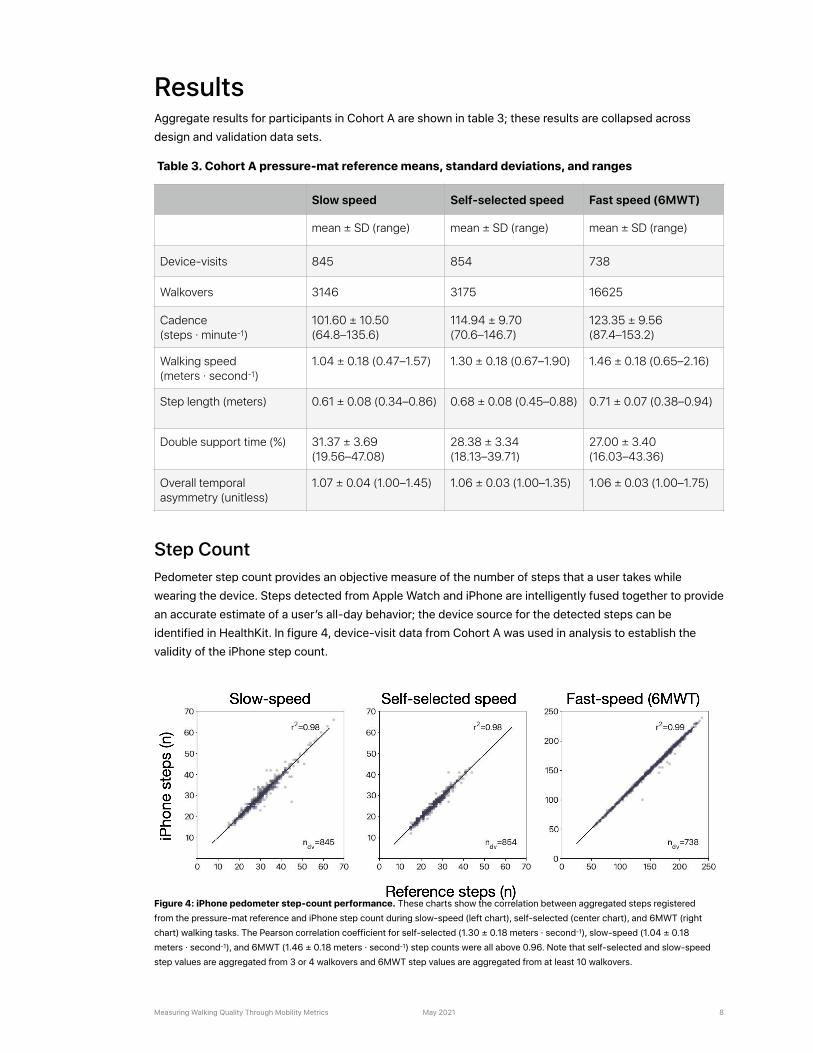
Step Count Pedometer step count provides an objective measure of the number of steps that a user takes while wearing the device. Steps detected from Apple Watch and iPhone are intelligently fused together to provide an accurate estimate of a user’s all-day behavior; the device source for the detected steps can be identified in HealthKit. In figure 4, device-visit data from Cohort A was used in analysis to establish the validity of the iPhone step count.
Table 3. Cohort A pressure-mat reference means, standard deviations, and ranges
Slow speed Self-selected speed Fast speed (6MWT)
mean ± SD (range) mean ± SD (range) mean ± SD (range)
Device-visits 845 854 738
Walkovers 3146 3175 16625
Cadence (steps · minute-1)
101.60 ± 10.50 (64.8–135.6)
114.94 ± 9.70 (70.6–146.7)
123.35 ± 9.56 (87.4–153.2)
Walking speed (meters · second-1)
1.04 ± 0.18 (0.47–1.57) 1.30 ± 0.18 (0.67–1.90) 1.46 ± 0.18 (0.65–2.16)
Step length (meters) 0.61 ± 0.08 (0.34–0.86) 0.68 ± 0.08 (0.45–0.88) 0.71 ± 0.07 (0.38–0.94)
Double support time (%) 31.37 ± 3.69 (19.56–47.08)
28.38 ± 3.34 (18.13–39.71)
27.00 ± 3.40 (16.03–43.36)
Overall temporal asymmetry (unitless)
1.07 ± 0.04 (1.00–1.45) 1.06 ± 0.03 (1.00–1.35) 1.06 ± 0.03 (1.00–1.75)
Measuring Walking Quality Through Mobility Metrics May 2021 8
Figure 4: iPhone pedometer step-count performance. These charts show the correlation between aggregated steps registered from the pressure-mat reference and iPhone step count during slow-speed (left chart), self-selected (center chart), and 6MWT (right chart) walking tasks. The Pearson correlation coefficient for self-selected (1.30 ± 0.18 meters · second-1), slow-speed (1.04 ± 0.18 meters · second-1), and 6MWT (1.46 ± 0.18 meters · second-1) step counts were all above 0.96. Note that self-selected and slow-speed step values are aggregated from 3 or 4 walkovers and 6MWT step values are aggregated from at least 10 walkovers.
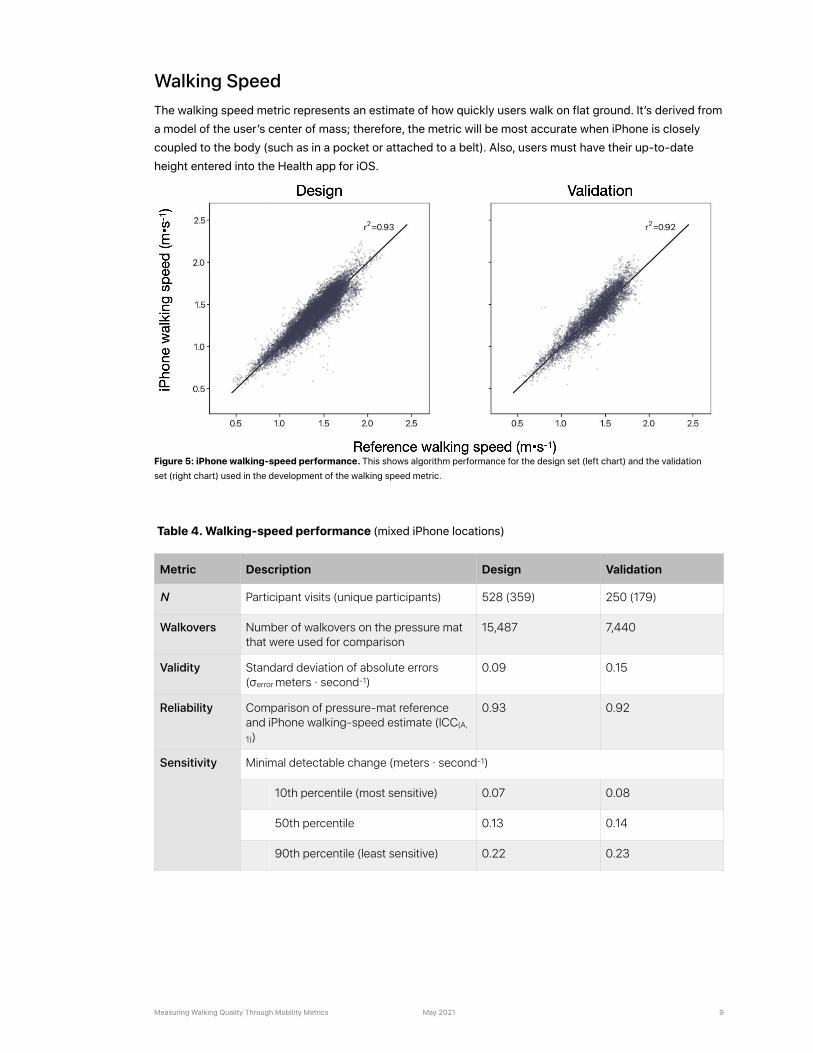
Walking Speed The walking speed metric represents an estimate of how quickly users walk on flat ground. It’s derived from a model of the user’s center of mass; therefore, the metric will be most accurate when iPhone is closely coupled to the body (such as in a pocket or attached to a belt). Also, users must have their up-to-date height entered into the Health app for iOS.
Table 4. Walking-speed performance (mixed iPhone locations)
Metric Description Design Validation
N Participant visits (unique participants) 528 (359) 250 (179)
Walkovers Number of walkovers on the pressure mat that were used for comparison
15,487 7,440
Validity Standard deviation of absolute errors (σerror meters · second-1)
0.09 0.15
Reliability Comparison of pressure-mat reference and iPhone walking-speed estimate (ICC(A,
1))
0.93 0.92
Sensitivity Minimal detectable change (meters · second-1)
10th percentile (most sensitive) 0.07 0.08
50th percentile 0.13 0.14
90th percentile (least sensitive) 0.22 0.23
Measuring Walking Quality Through Mobility Metrics May 2021 9
Figure 5: iPhone walking-speed performance. This shows algorithm performance for the design set (left chart) and the validation set (right chart) used in the development of the walking speed metric.
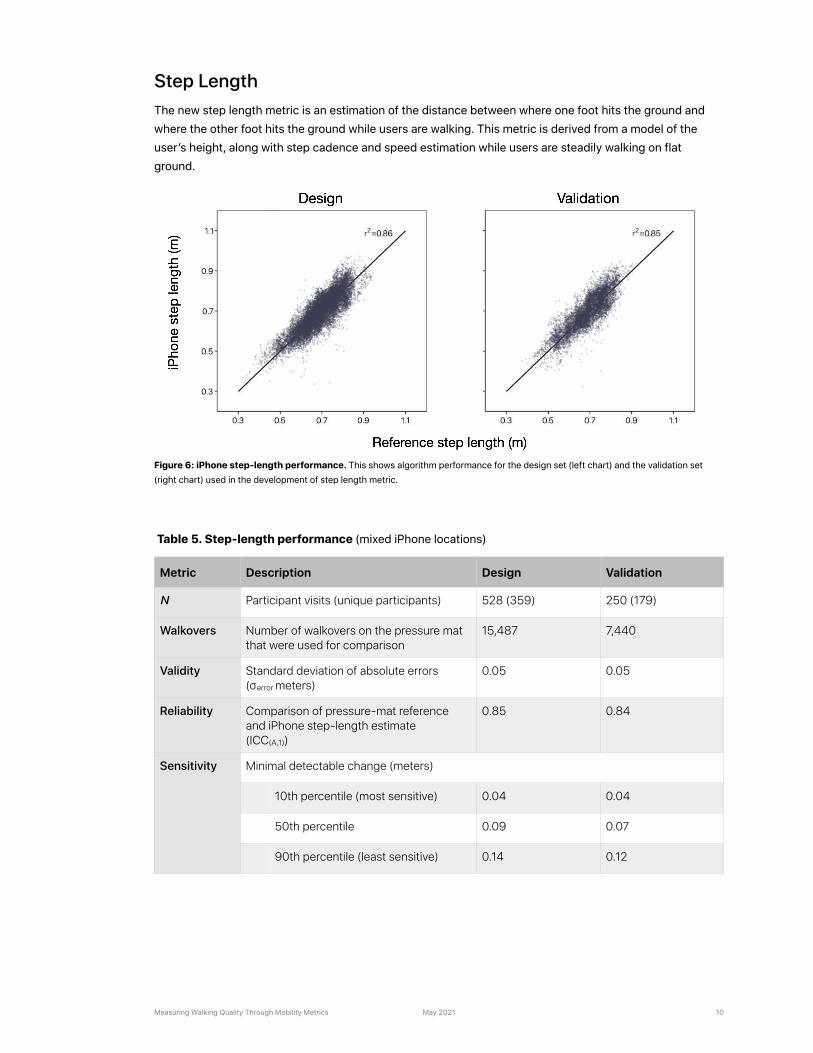
Step Length The new step length metric is an estimation of the distance between where one foot hits the ground and where the other foot hits the ground while users are walking. This metric is derived from a model of the user’s height, along with step cadence and speed estimation while users are steadily walking on flat ground.
Table 5. Step-length performance (mixed iPhone locations)
Metric Description Design Validation
N Participant visits (unique participants) 528 (359) 250 (179)
Walkovers Number of walkovers on the pressure mat that were used for comparison
15,487 7,440
Validity Standard deviation of absolute errors (σerror meters)
0.05 0.05
Reliability Comparison of pressure-mat reference and iPhone step-length estimate (ICC(A,1))
0.85 0.84
Sensitivity Minimal detectable change (meters)
10th percentile (most sensitive) 0.04 0.04
50th percentile 0.09 0.07
90th percentile (least sensitive) 0.14 0.12
Measuring Walking Quality Through Mobility Metrics May 2021 10
Figure 6: iPhone step-length performance. This shows algorithm performance for the design set (left chart) and the validation set (right chart) used in the development of step length metric.
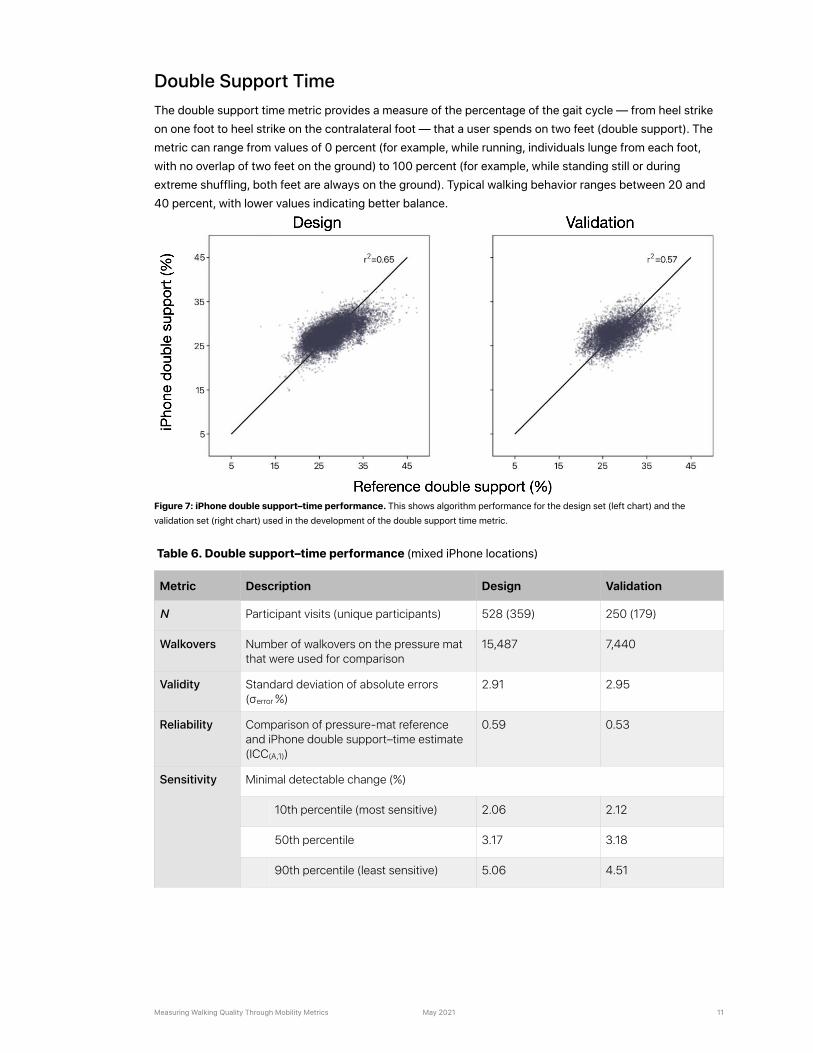
Double Support Time The double support time metric provides a measure of the percentage of the gait cycle — from heel strike on one foot to heel strike on the contralateral foot — that a user spends on two feet (double support). The metric can range from values of 0 percent (for example, while running, individuals lunge from each foot, with no overlap of two feet on the ground) to 100 percent (for example, while standing still or during extreme shuffling, both feet are always on the ground). Typical walking behavior ranges between 20 and 40 percent, with lower values indicating better balance.
Figure 7: iPhone double support–time performance. This shows algorithm performance for the design set (left chart) and the validation set (right chart) used in the development of the double support time metric.
Measuring Walking Quality Through Mobility Metrics May 2021 11
Table 6. Double support–time performance (mixed iPhone locations)
Metric Description Design Validation
N Participant visits (unique participants) 528 (359) 250 (179)
Walkovers Number of walkovers on the pressure mat that were used for comparison
15,487 7,440
Validity Standard deviation of absolute errors (σerror %)
2.91 2.95
Reliability Comparison of pressure-mat reference and iPhone double support–time estimate (ICC(A,1))
0.59 0.53
Sensitivity Minimal detectable change (%)
10th percentile (most sensitive) 2.06 2.12
50th percentile 3.17 3.18
90th percentile (least sensitive) 5.06 4.51
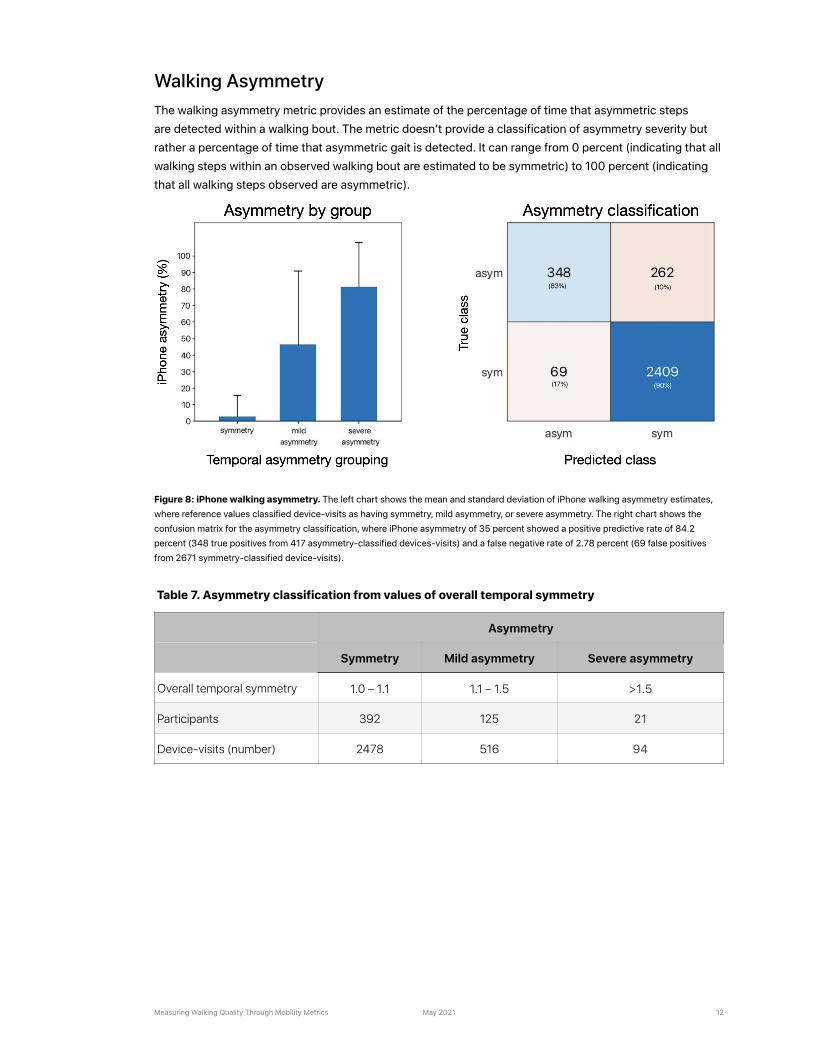
Walking Asymmetry The walking asymmetry metric provides an estimate of the percentage of time that asymmetric steps are detected within a walking bout. The metric doesn’t provide a classification of asymmetry severity but rather a percentage of time that asymmetric gait is detected. It can range from 0 percent (indicating that all walking steps within an observed walking bout are estimated to be symmetric) to 100 percent (indicating that all walking steps observed are asymmetric).
Figure 8: iPhone walking asymmetry. The left chart shows the mean and standard deviation of iPhone walking asymmetry estimates, where reference values classified device-visits as having symmetry, mild asymmetry, or severe asymmetry. The right chart shows the confusion matrix for the asymmetry classification, where iPhone asymmetry of 35 percent showed a positive predictive rate of 84.2 percent (348 true positives from 417 asymmetry-classified devices-visits) and a false negative rate of 2.78 percent (69 false positives from 2671 symmetry-classified device-visits).
Measuring Walking Quality Through Mobility Metrics May 2021 12
Table 7. Asymmetry classification from values of overall temporal symmetry
Asymmetry
Symmetry Mild asymmetry Severe asymmetry
Overall temporal symmetry 1.0 – 1.1 1.1 – 1.5 >1.5
Participants 392 125 21
Device-visits (number) 2478 516 94
Discussion The Mobility metrics described in this paper provide consumers, researchers, and healthcare providers with a mechanism for assessing mobility during day-to-day life outside the clinic. Previous advocacy for gait assessment focused on cost-benefit analysis, and it limited the recommended use of gait analysis to certain conditions based on cost and availability of testing ; availability of these metrics on a widely 37
adopted consumer platform like iPhone may expand the range of recommended applications. Other research has previously demonstrated the utility of inertial sensors, such as those found in wearable devices, in augmenting clinical exams by providing objective measures of impairment, monitoring disease progression, and evaluating response to treatments. 38
The availability and application of these metrics in clinical or research settings may provide insight into clinically reliable and meaningful thresholds and allow greater application of known thresholds. For example, a 10 cm/s decrease in walking speed within a year has been associated with a risk of falls in older populations. Short-term changes in walking speed in older adults with heart failure have been shown 39
to be prognostic of longer-term outcomes. And walking speed, step length, and double support time 40
have been used to objectively measure treatment-mediated improvements in walking for individuals with multiple sclerosis. Other applications exist with likely more yet to be discovered as explorations may have 41
been hindered by the lack of availability of these types of data in the past.
The development and validation of the Mobility metrics are limited in several ways. First, due to the scarcity of individuals with asymmetric gait, asymmetry was artificially induced using a knee brace in the Cohort B study. Though this method has been shown to reliably induce asymmetric walking,36 the mechanics of this type of asymmetry could differ substantially from asymmetry due to, for example, neurodegenerative disease or prosthetics. Furthermore, the study population didn’t span all adult ages 42 43
and was limited to individuals residing in the Santa Clara Valley. Though walking capacity can differ across categories such as race or ethnicity, it’s widely accepted that bipedal pendular walking doesn’t vary 44
substantially once adult age is reached unless gait becomes substantially impaired. Therefore, the 45
metrics outlined here should be accurate for tracking normal walking across a lifespan, but they’ll need to be further validated for more specific populations.
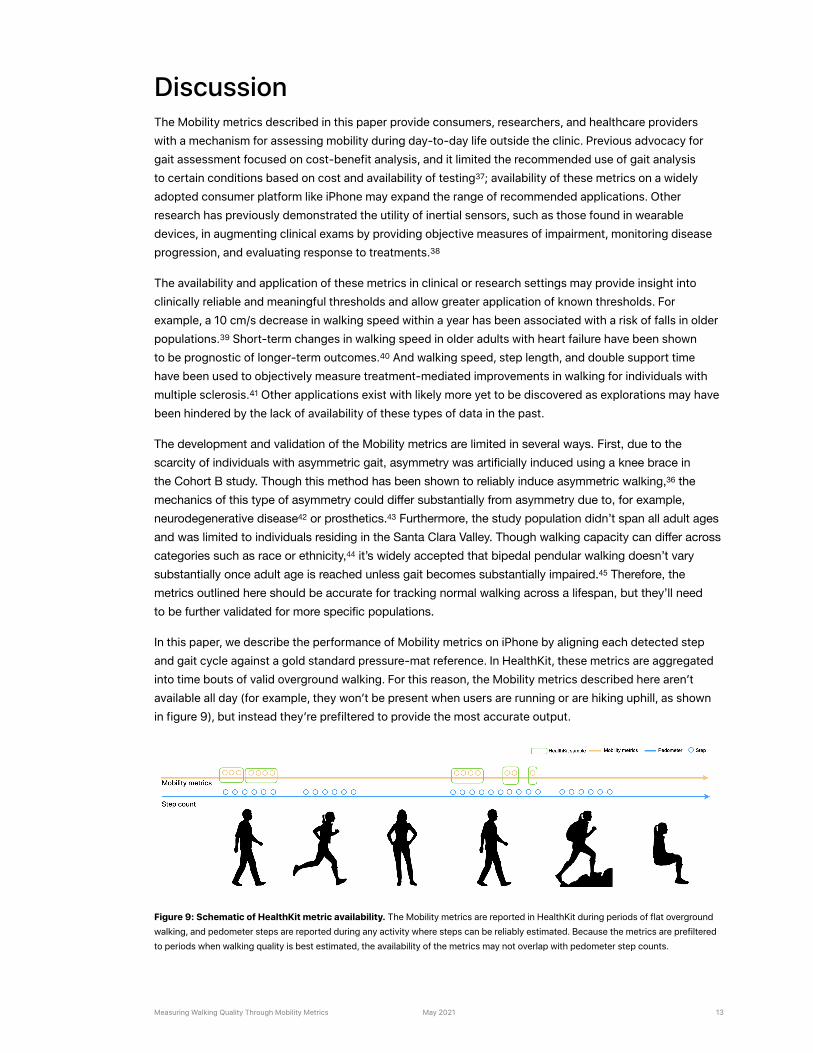
In this paper, we describe the performance of Mobility metrics on iPhone by aligning each detected step and gait cycle against a gold standard pressure-mat reference. In HealthKit, these metrics are aggregated into time bouts of valid overground walking. For this reason, the Mobility metrics described here aren’t available all day (for example, they won’t be present when users are running or are hiking uphill, as shown in figure 9), but instead they’re prefiltered to provide the most accurate output.
Figure 9: Schematic of HealthKit metric availability. The Mobility metrics are reported in HealthKit during periods of flat overground walking, and pedometer steps are reported during any activity where steps can be reliably estimated. Because the metrics are prefiltered to periods when walking quality is best estimated, the availability of the metrics may not overlap with pedometer step counts.
Measuring Walking Quality Through Mobility Metrics May 2021 13
The metrics are derived from a biomechanical model of walking that depends on an accurate estimate of leg length, which is estimated from the user’s entered height. Users should enter their height into the Health app for iOS to receive the most accurate estimates; otherwise, no calibration is required. Additionally, the availability of measures will largely depend on users’ interaction with iPhone. Given the need for a tight coupling of a device to a user’s center of mass, individuals who carry iPhone in a location that provides a good signal (for example, in a pocket close to the hip) will receive more frequent estimates than users who primarily carry iPhone in another location (for example, in hand or in a backpack or purse). For users who have received at least one walking bout estimate, on average over 80 percent of them will receive at least five estimates of their Mobility metrics per day. The metrics won’t be available if users have turned on Wheelchair mode in the Health app for iOS.
Conclusions Mobility metrics on iPhone allow users to opportunistically and passively assess their functional mobility. Tracking these metrics longitudinally in a nonintrusive way provides an objective measure of all-day mobility that can augment specialized functional tests and clinical questionnaires. These metrics provide users, researchers, and healthcare providers with a new tool for tracking and quantifying functional mobility.
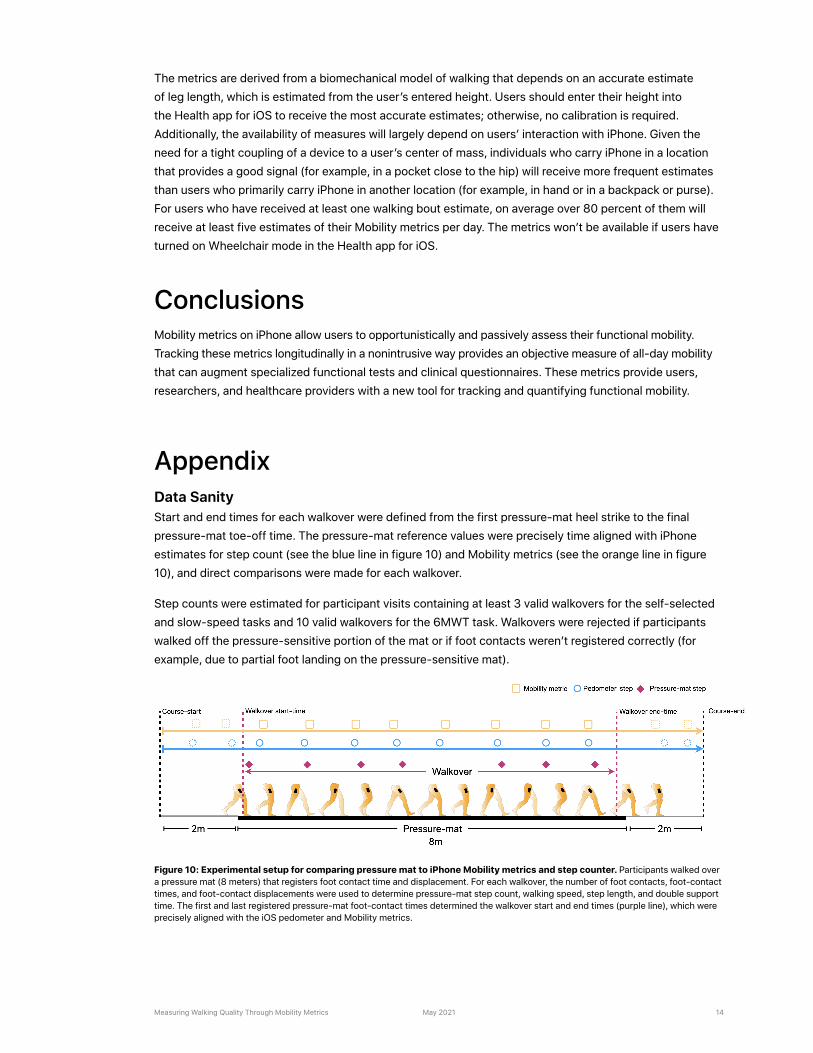
Appendix Data Sanity Start and end times for each walkover were defined from the first pressure-mat heel strike to the final pressure-mat toe-off time. The pressure-mat reference values were precisely time aligned with iPhone estimates for step count (see the blue line in figure 10) and Mobility metrics (see the orange line in figure 10), and direct comparisons were made for each walkover.
Step counts were estimated for participant visits containing at least 3 valid walkovers for the self-selected and slow-speed tasks and 10 valid walkovers for the 6MWT task. Walkovers were rejected if participants walked off the pressure-sensitive portion of the mat or if foot contacts weren’t registered correctly (for example, due to partial foot landing on the pressure-sensitive mat).
Figure 10: Experimental setup for comparing pressure mat to iPhone Mobility metrics and step counter. Participants walked over a pressure mat (8 meters) that registers foot contact time and displacement. For each walkover, the number of foot contacts, foot-contact times, and foot-contact displacements were used to determine pressure-mat step count, walking speed, step length, and double support time. The first and last registered pressure-mat foot-contact times determined the walkover start and end times (purple line), which were precisely aligned with the iOS pedometer and Mobility metrics.
Measuring Walking Quality Through Mobility Metrics May 2021 14
Statistical Methods
Continuous Metrics
Time-synchronized iPhone and reference step counts were aggregated for each walking task and compared using the Pearson correlation coefficient (r2).
For the development of the walking speed, step length, and double support time metrics, device-visits gathered from Cohort A were split into design and validation data sets, where the design set was used to develop each metric’s algorithm. Algorithm performance for the three metrics were determined by comparing their estimates to the pressure-mat reference values. Metric validity was assessed using the standard deviation of absolute errors between reference and iPhone estimate pairs. Metric reliability was assessed using the Pearson correlation coefficient (r2) and inter-rater intraclass correlation coefficient (ICC(A,1)). Sensitivity was assessed using minimal detectable change of each device-visit, with percentile 46
distributions being reported.
Classification Metrics
For the development of walking asymmetry, device-visit data collated from both Cohort A and Cohort B were collated. Each set of device-visits was used to calculate overall temporal symmetry ratio47 and classify reference device-visits into “symmetry,” “mild asymmetry,” and “severe asymmetry” walking bins. For the device-visits in each bin, the mean and standard deviation of iPhone walking asymmetry was calculated. A receiver operating characteristic (ROC) analysis was then used to evaluate the ability of iPhone walking asymmetry to successfully categorize participants as symmetrical or asymmetrical walkers.
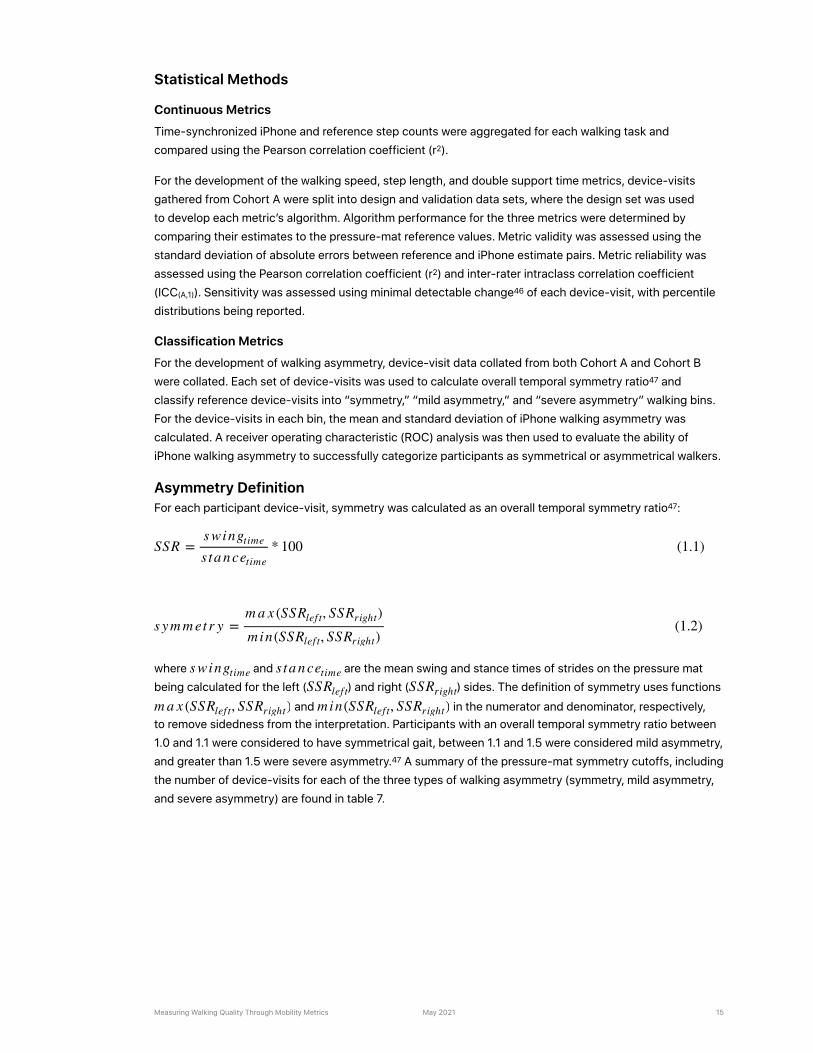
Asymmetry Definition For each participant device-visit, symmetry was calculated as an overall temporal symmetry ratio47:
where and are the mean swing and stance times of strides on the pressure mat being calculated for the left ( ) and right ( ) sides. The definition of symmetry uses functions
and in the numerator and denominator, respectively, to remove sidedness from the interpretation. Participants with an overall temporal symmetry ratio between 1.0 and 1.1 were considered to have symmetrical gait, between 1.1 and 1.5 were considered mild asymmetry, and greater than 1.5 were severe asymmetry. A summary of the pressure-mat symmetry cutoffs, including 47
the number of device-visits for each of the three types of walking asymmetry (symmetry, mild asymmetry, and severe asymmetry) are found in table 7.
SSR =s wingtime
s ta n cetime* 100 (1.1)
s ym m et r y =m a x (SSRlef t, SSRright)min(SSRlef t, SSRright)
(1.2)
s wingtime s ta n cetimeSSRlef t SSRright
m a x (SSRlef t, SSRright) min(SSRlef t, SSRright)
Measuring Walking Quality Through Mobility Metrics May 2021 15
References developer.apple.com/videos/play/wwdc2020/10656.1
developer.apple.com/documentation/healthkit.2
Benedetti MG, Catani F, Bilotta TW, et al. Muscle activation pattern and gait biomechanics after total knee replacement. Clinical 3
Biomechanics. 2003; 18: 871–876. doi: 10.1016/S0268-0033(03)00146-3.
Asiri FY, Marchetti GF, Ellis JL, et al. Predictors of functional and gait outcomes for persons poststroke undergoing home-based 4
rehabilitation. Journal of Stroke & Cerebrovascular Diseases. 2014; 23(7): 1856–1864. doi: 10.1016/j.jstrokecerebrovasdis.2014.02.025.
Middleton A, Fritz SL, Lusardi M. Walking speed: The functional vital sign. Journal of Aging and Physical Activity. 2015; 23(2): 314–322. 5
doi: 10.1123/japa.2013-0236.
Studenski S, Perera S, Patel K, et al. Gait speed and survival in older adults. The Journal of the American Medical Association. 2011; 6
305(1): 50–58. doi: 10.1001/jama.2010.1923.
Satariano WA, Guralnik JM, Jackson RJ, et al. Mobility and aging: New directions for public health action. American Journal of Public 7
Health. 2012 (102): 1508–1515. doi: 10.2105/AJPH.2011.300631.
Sosnoff JJ, Sandroff BM, Motl RW. Quantifying gait abnormalities in persons with multiple sclerosis with minimal disability. Gait & 8
Posture. 2012; 36(1): 154–156. doi: 10.1016/j.gaitpost.2011.11.027.
Mielke MM, Roberts RO, Savica R, et al. Assessing the temporal relationship between cognition and gait: Slow gait predicts cognitive 9
decline in the Mayo Clinic Study of Aging. The Journals of Gerontology: Series A. 2012; 68(8): 929–937. doi: 10.1093/gerona/gls256.
Mirelman A, Bonato P, Camicioli R, et al. Gait impairments in Parkinson’s disease. The Lancet Neurology. 2019; 18(7): 697–708. 10
doi: 10.1016/S1474-4422(19)30044-4.
Yates T, Zaccardi F, Dhalwani NN, et al. Association of walking pace and handgrip strength with all-cause, cardiovascular, and cancer 11
mortality: a UK Biobank observational study. European Heart Journal. 2017; 38(43): 3232–3240. doi: 10.1093/eurheartj/ehx449.
Steffen TM, Hacker TA, Mollinger L. Age- and gender-related test performance in community-dwelling elderly people: Six-Minute Walk 12
Test, Berg Balance Scale, Timed Up & Go Test, and gait speeds. Physical Therapy. 2002; 82(2): 128–137. doi: 10.1093/ptj/82.2.128.
Fritz S, Lusardi M. White paper: “Walking speed: the sixth vital sign.” Journal of Geriatric Physical Therapy. 2009; 32(2): 2–5. 13
Pirker W, Katzenschlager R. Gait disorders in adults and the elderly. Wien Klin Wochenschr. 2017; 129: 81–95. doi: 10.1007/14
s00508-016-1096-4.
Hollman JH, Beckman BA, Brandt RA, et al. Minimum detectable change in gait velocity during acute rehabilitation following hip fracture. 15
Journal of Geriatric Physical Therapy. 2008; 31(2): 53–56. doi: 10.1519/00139143-200831020-00003.
Casartelli NC, Item-Glatthorn JF, Bizzini M, et al. Differences in gait characteristics between total hip, knee, and ankle arthroplasty 16
patients: a six-month postoperative comparison. BMC Musculoskeletal Disorders. 2013; 14: 176. doi: 10.1186/1471-2474-14-176.
Boyer K, Johnson R, Banks J, et al. Systematic review and meta-analysis of gait mechanics in young and older adults. Experimental 17
Gerontology. 2017; 95: 63–70. doi: 10.1016/j.exger.2017.05.005.
Tilson JK, Sullivan KJ, Cen SY, et al. Meaningful gait speed improvements during the first 60 days poststroke: minimal clinically 18
important difference. Physical Therapy. 2010; 90(2): 196–208. doi: 10.2522/ptj.20090079.
Cruz TH, Lewek MD, Dhaher YY. Biomechanical impairments and gait adaptations post-stroke: Multi-factorial associations. Journal of 19
Biomechanics. 2009; 42(11): 1673–1677. doi: 10.1016/j.jbiomech.2009.04.015.
Plotnik M, Giladi N, Hausdorff JM. A new measure for quantifying the bilateral coordination of human gait: effects of aging and 20
Parkinson’s disease. Experimental Brain Research. 2007; 181(4): 561–570. doi: 10.1007/s00221-007-0955-7.
Buzzi UH, Stergiou N, Kurz MJ, et al. Nonlinear dynamics indicates aging affects variability during gait. Clinical Biomechanics. 2003; 21
18(5): 435–443. doi: 10.1016/S0268-0033(03)00029-9.
Maki BE. Gait changes in older adults: predictors of falls or indicators of fear? Journal of the American Geriatrics Society. 1997; 45(3): 22
313–320. doi: 10.1111/j.1532-5415.1997.tb00946.x.
Judge JO, Davis RB, Ounpuu S. Step length reductions in advanced age: the role of ankle and hip kinetics. The Journals of Gerontology: 23
Series A. 1996; 51(6): 303–312. doi: 10.1093/gerona/51a.6.m303.
Aboutorabi A, Arazpour M, Bhramizadeh M, et al. The effect of aging on gait parameters in able-bodied older subjects: A literature 24
review. Aging Clinical and Experimental Research. 2016; 28(3): 393–405. doi: 10.1007/s40520-015-0420-6.
Guimaraes RM, Isaacs B. Characteristics of the gait in old people who fall. International Rehabilitation Medicine. 1980; 2(4): 177–180. 25
doi: 10.3109/09638288009163984.
Belda-Lois JM, Mena-del Horno S, Bermejo-Bosch I, et al. Rehabilitation of gait after stroke: a review towards a top-down approach. 26
Journal of NeuroEngineering and Rehabilitation. 2011; 8(66). doi: 10.1186/1743-0003-8-66.
Measuring Walking Quality Through Mobility Metrics May 2021 16

Daley MJ, Spinks WL. Exercise, mobility and aging. Sports Medicine. 2000; 29(1): 1–12. doi: 10.2165/00007256-200029010-00001.27
Gabell A, Nayak USL. The effect of age on variability in gait. Journal of Gerontology. 1984; 39(6): 662–666. doi: 10.1093/geronj/28
39.6.662.
Williams DS, Martin AE. Gait modification when decreasing double support percentage. Journal of Biomechanics. 2019; 92: 76–83. 29
doi: 10.1016/j.jbiomech.2019.05.028.
Di Stasi SL, Logerstedt D, Gardinier ES, et al. Gait patterns differ between ACL-reconstructed athletes who pass return-to-sport criteria 30
and those who fail. The American Journal of Sports Medicine. 2013; 41(6): 1310–1318. doi: 10.1177/0363546513482718.
Richmond SB, Swanson CW, Peterson DS, et al. A temporal analysis of bilateral gait coordination in people with multiple sclerosis. 31
Multiple Sclerosis and Related Disorders. 2020; 45: 102445. doi: 10.1016/j.msard.2020.102445.
Hausdorff JM. Gait dynamics, fractals and falls: Finding meaning in the stride-to-stride fluctuations of human walking. Human 32
Movement Science. 2007; 26(4): 555–589. doi: 10.1016/j.humov.2007.05.003.
Lord S, Galna B, Verghese J, et al. Independent domains of gait in older adults and associated motor and nonmotor attributes: Validation 33
of factor analysis approach. The Journals of Gerontology: Series A. 2013; 68(7): 820–827. doi: 10.1093/gerona/gls255.
Roos PE, Button K, Sparkes V, et al. Altered biomechanical strategies and medio-lateral control of the knee represent incomplete 34
recovery of individuals with injury during single leg hop. Journal of Biomechanics. 2014; 47(3): 675–680. doi: 10.1016/j.jbiomech.2013.11.046.
Duffell LD, Gulati V, Southgate D, et al. Measuring body weight distribution during sit-to-stand in patients with early knee osteoarthritis. 35
Gait & Posture. 2013; 38(4): 745–750. doi: 10.1016/j.gaitpost.2013.03.015.
Shorter KA, Polk JD, Rosengren KS, et al. A new approach to detecting asymmetries in gait. Clinical Biomechanics. 2008; 23(4): 36
459–467. doi: 10.1016/j.clinbiomech.2007.11.009.
Baker R, Esquenazi A, Benedetti MG, et al. Gait analysis: clinical facts. European Journal of Physical and Rehabilitation Medicine. 2016; 37
52(4): 560–574.
O’Brien MK, Hidalgo-Araya MD, Mummidisetty CK, et al. Augmenting clinical outcome measures of gait and balance with a single inertial 38
sensor in age-ranged healthy adults. Sensors (Basel). 2019; 19(20): 4537. doi: 10.3390/s19204537.
Verghese J, Holtzer R, Lipton RB, et al. Quantitative gait markers and incident fall risk in older adults. The Journals of Gerontology: 39
Series A. 2009; 64(8): 896–901. doi: 10.1093/gerona/glp033.
Tanaka S, Kamiya K, Hamazaki N, et al. Short-term change in gait speed and clinical outcomes in older patients with acute heart failure. 40
Circulation Journal. 2019; 83(9): 1860–1867. doi: 10.1253/circj.CJ-19-0136.
Novotna K, Rusz J, Kubala Havrdova E, et al. Why patients with multiple sclerosis perceive improvement of gait during treatment with 41
natalizumab? Journal of Neural Transmission. 2019; 126(6): 731–737. doi: 10.1007/s00702-019-02013-z.
Galna B, Lord S, Burn DJ, et al. Progression of gait dysfunction in incident Parkinson’s disease: Impact of medication and phenotype. 42
Movement Disorders: Official Journal of the International Parkinson and Movement Disorder Society. 2015; 30(3): 359–367. doi: 10.1002/mds.26110.
Mattes SJ, Martin PE, Royer TD. Walking symmetry and energy cost in persons with unilateral transtibial amputations: Matching 43
prosthetic and intact limb inertial properties. Archives of Physical Medicine and Rehabilitation. 2000; 81(5): 561–568. doi: 10.1016/s0003-9993(00)90035-2.
Boulifard DA, Ayers E, Verghese J. Home-based gait speed assessment: Normative data and racial/ethnic correlates among older adults. 44
Journal of the American Medical Directors Association. 2019; 20(10): 1224–1229. doi: 10.1016/j.jamda.2019.06.002.
Tesio L, Rota V. The motion of body center of mass during walking: A review oriented to clinical applications. Frontiers in Neurology. 45
2019; 10: 999. doi: 10.3389/fneur.2019.00999.
Dontje ML, Dall PM, Skelton DA, et al. Reliability, minimal detectable change and responsiveness to change: Indicators to select the best 46
method to measure sedentary behavior in older adults in different study designs. PLOS ONE. 2018; 13(4): e0195424. doi: 10.1371/journal.pone.0195424.
Patterson KK, Parafianowicz I, Danells CJ, et al. Gait asymmetry in community-ambulating stroke survivors. Archives of Physical 47
Medicine and Rehabilitation. 2008; 89(2): 304–310. doi: 10.1016/j.apmr.2007.08.142.
Measuring Walking Quality Through Mobility Metrics May 2021 17
© 2021 Apple Inc. All rights reserved. Apple, the Apple logo, Apple Watch, HealthKit, and iPhone are trademarks of Apple Inc., registered in the U.S. and other countries. IOS is a trademark or registered trademark of Cisco in the U.S. and other countries and is used under license. Other product and company names mentioned herein maybe trademarks of their respective companies.