
Three-Dimensional Holographic Refractive-Index Measurement ...
Measuring the refractive index around intersubband transition resonance in GaN/AlN
multi quantum wells
Elad Gross,1,* Amir Nevet,1 Asaf Pesach,1 Eva Monroy,2 Shmuel E. Schacham,3 Meir Orenstein,1 Mordechai Segev,4 and Gad Bahir1
1Department of electrical engineering, Technion-Israel Institute of Technology, Haifa 32000, Israel 2Equipe Mixte CEA-CNRS Nanophysique et Semiconducteurs, INAC/SP2M, CEA Grenoble, 17 rue des Martyrs,
38054 Grenoble cedex 9, France 3Department of Electrical and Electronic Engineering, Ariel University Center, Ariel 40700, Israel
4Physics Department and Solid State Institute, Technion-Israel Institute of Technology, Haifa 32000, Israel *[email protected]
Abstract: We present the direct measurement of the refractive index distribution (spectral dispersion) arising from an intersubband transition in GaN/AlN multi quantum wells structure. The measurement is carried out through a novel interferometric technique. The measured interferogram yields a change in the refractive index varying from −5 × 10⁻³ to 6 × 10⁻³ as a function of the wavelength, introduced by the intersubband resonance at 1.5 µm. These results compare well with those derived using Kramers-Kronig transform of the measured absorption spectrum.
©2013 Optical Society of America
OCIS codes: (160.4760) Optical properties; (160.6000) Semiconductor materials; (120.5060) Phase modulation; (230.4205) Multiple quantum well (MQW) modulators; (260.3160) Interference.
References and links
1. N. Suzuki and N. Iizuka, “Feasibility study on ultrafast nonlinear optical properties of 1.55-μm intersubband transition in AlGaN/GaN quantum wells,” Jpn. J. Appl. Phys. 36(Part 2, No. 8A), L1006–L1008 (1997).
2. C. Gmachl, H. M. Ng, S.-N. George Chu, and A. Y. Cho, “Intersubband absorption at λ 1.55 μm in well- and
modulation-doped GaN/AlGaN multiple quantum wells with superlattice barriers,” Appl. Phys. Lett. 77(23), 3722–3724 (2000).
3. M. Tchernycheva, L. Nevou, L. Doyennette, F. H. Julien, E. Warde, F. Guillot, E. Monroy, E. Bellet-Amalric, T. Remmele, and M. Albrecht, “Systematic experimental and theoretical investigation of intersubband absorption in GaN/AlN quantum wells,” Phys. Rev. B 73(12), 125347 (2006).
4. N. Iizuka, K. Kaneko, N. Suzuki, T. Asano, S. Noda, and O. Wada, “Ultrafast intersubband relaxation (⩽150 fs) in AlGaN/GaN multiple quantum wells,” Appl. Phys. Lett. 77(5), 648–650 (2000).
5. N. Iizuka, K. Kaneko, and N. Suzuki, “Sub-picosecond all-optical gate utilizing an intersubband transition,” Opt. Express 13(10), 3835–3840 (2005).
6. Y. Li, A. Bhattacharyya, C. Thomidis, T. D. Moustakas, and R. Paiella, “Ultrafast all-optical switching with low saturation energy via intersubband transitions in GaN/AlN quantum-well waveguides,” Opt. Express 15(26), 17922–17927 (2007).
7. A. Vardi, G. Bahir, F. Guillot, C. Bougerol, E. Monroy, S. E. Schacham, M. Tchernycheva, and F. H. Julien, “Near infrared quantum cascade detector in GaN/AlGaN/AlN heterostructures,” Appl. Phys. Lett. 92(1), 011112 (2008).
8. E. Baumann, F. R. Giorgetta, D. Hofstetter, S. Leconte, F. Guillot, E. Bellet-Amalric, and E. Monroy, “Electrically adjustable intersubband absorption of a GaN/AlN superlattice grown on a transistorlike structure,” Appl. Phys. Lett. 89(10), 101121 (2006).
9. L. Nevou, N. Kheirodin, M. Tchernycheva, L. Meignien, P. Crozat, A. Lupu, E. Warde, F. H. Julien, G. Pozzovivo, S. Golka, G. Strasser, F. Guillot, E. Monroy, T. Remmele, and M. Albrecht, “Short-wavelength intersubband electroabsorption modulation based on electron tunneling between GaN/AlN coupled quantum wells,” Appl. Phys. Lett. 90(22), 223511 (2007).
10. N. Kheirodin, L. Nevou, H. Machhadani, P. Crozat, L. Vivien, M. Tchernycheva, A. Lupu, F. H. Julien, G. Pozzovivo, S. Golka, G. Strasser, F. Guillot, and E. Monroy, “Electrooptical modulator at telecommunication wavelengths based on GaN-AlN coupled quantum wells,” IEEE Photon. Technol. Lett. 20(9), 724–726 (2008).
#179127 - $15.00 USD Received 5 Nov 2012; revised 25 Dec 2012; accepted 9 Jan 2013; published 7 Feb 2013(C) 2013 OSA 11 February 2013 / Vol. 21, No. 3 / OPTICS EXPRESS 3800

11. H. Machhadani, P. Kandaswamy, S. Sakr, A. Vardi, A. Wirtmüller, L. Nevou, F. Guillot, G. Pozzovivo, M. Tchernycheva, A. Lupu, L. Vivien, P. Crozat, E. Warde, C. Bougerol, S. Schacham, G. Strasser, G. Bahir, E. Monroy, and F. H. Julien, “GaN/AlGaN intersubband optoelectronic devices,” New J. Phys. 11(12), 125023 (2009).
12. D. Hofstetter, E. Baumann, F. R. Giorgetta, R. Théron, H. Wu, W. J. Schaff, J. Dawlaty, P. A. George, L. F. Eastman, F. Rana, P. K. Kandaswamy, F. Guillot, and E. Monroy, “Intersubband transition-based processes and devices in AlN/GaN-based heterostructures,” Proc. IEEE 98(7), 1234–1248 (2010).
13. E. B. Dupont, D. Delacourt, and M. Papuchon, “Mid-infrared phase modulation via Stark effect on intersubband transitions in GaAs/GaAlAs quantum wells,” IEEE J. Quantum Electron. 29(8), 2313–2318 (1993).
14. G. Almogy, A. Shakouri, and A. Yariv, “Observation of birefringence induced by intersubband transitions in quantum wells,” Appl. Phys. Lett. 63(20), 2720–2722 (1993).
15. L. B. Cen, B. Shen, Z. X. Qin, and G. Y. Zhang, “Influence of polarization induced electric fields on the wavelength and the refractive index of intersubband transitions in AlN/GaN coupled double quantum wells,” J. Appl. Phys. 105(9), 093109 (2009).
16. Y. Li, A. Bhattacharyya, C. Thomidis, Y. Liao, T. D. Moustakas, and R. Paiella, “Refractive-index nonlinearities of intersubband transitions in GaN/AlN quantum-well waveguides,” J. Appl. Phys. 104(8), 083101 (2008).
17. A. Lupu, M. Tchernycheva, Y. Kotsar, E. Monroy, and F. H. Julien, “Electroabsorption and refractive index modulation induced by intersubband transitions in GaN/AlN multiple quantum wells,” Opt. Express 20(11), 12541–12549 (2012).
18. J. E. Zucker, I. Bar‐Joseph, B. I. Miller, U. Koren, and D. S. Chemla, “Quaternary quantum wells for electro‐optic intensity and phase modulation at 1.3 and 1.55 μm,” Appl. Phys. Lett. 54(1), 10–12 (1989).
19. H. C. Liu and F. Capasso, Intersubband Transitions in Quantum Wells: Physics and Device Applications (Academic, 1999).
20. C. Sirtori, F. Capasso, J. Faist, and S. Scandolo, “Nonparabolicity and a sum rule associated with bound-to-bound and bound-to-continuum intersubband transitions in quantum wells,” Phys. Rev. B Condens. Matter 50(12), 8663–8674 (1994).
21. A. Yariv, Optical Electronics in Modern Communications, 5th ed. (Oxford University Press, 1997). 22. D. Brunner, H. Angerer, E. Bustarret, F. Freudenberg, R. Höpler, R. Dimitrov, O. Ambacher, and M. Stutzmann,
“Optical constants of epitaxial AlGaN films and their temperature dependence,” J. Appl. Phys. 82(10), 5090–5096 (1997).
23. I. H. Maliston, “Refraction and dispersion of synthetic sapphire,” J. Opt. Soc. Am. 52(12), 1377–1379 (1962).
1. Introduction
Intersubband transitions (ISBTs) in III-nitride (GaN, InN, AlN and their alloys) quantum wells (QWs) have attracted considerable interest over the past few years due to their possible applications as ultrafast optoelectronic devices, such as all-optical switches for optical communication networks, near-infrared (NIR) photodetectors, and quantum cascade lasers [1–10]. In contrast to other III-V semiconductors, ISBTs in GaN/AlGaN QWs can be tuned to the optical fibers transmission windows at 1.3 and 1.55-µm due to the large conduction band offset (about 1.75 eV for GaN/AlN) [11, 12]. Additional key feature of nitride-based ISBTs is the ultra-fast intersubband (ISB) relaxation lifetimes (few hundreds femtoseconds) due to the highly polar nature of the III-nitride material system [1, 4]. These properties are well suited for the development of fast all-optical switches and modulators operating at fiber-optic communication wavelengths. In recent years, a number of GaN ISBT based devices, operating in the NIR spectral region, have been demonstrated. These include photodetectors [7], Tera bit/s all-optical switches [5, 6] and electro-optical modulators relying either on bias-controlled QW depletion [8, 11], or on charge transfer between coupled QWs [9, 10].
Due to selection rules, the ISB absorption in GaN/AlGaN QWs is observed only for radiation polarized perpendicular to the plane of the QWs. As a result, the complex ISBT susceptibility tensor is anisotropic and the crystal becomes birefringent. In what follows, we denote the change in the refractive index arising from the ISBT resonance as ΔnISBT, that is, ΔnISBT the difference between the refractive index in the GaN/AlGaN MQW sample and the refractive index in a reference sample that does not have the MQW structure. Since the ISBT acts only on one polarization, ΔnISBT is best revealed through birefringence, which is what we measure in the experiments presented in this paper. In fact, the large, controllable, phase retardation, arising from ΔnISBT, can be used for phase modulation, as demonstrated experimentally by mid-infrared (10 μm) phase modulation via Stark effect on ISBTs in GaAs/GaAlAs QWs [13]. Indeed, direct measurement of ΔnISBT at 10-μm in GaAs/AlGaAs
#179127 - $15.00 USD Received 5 Nov 2012; revised 25 Dec 2012; accepted 9 Jan 2013; published 7 Feb 2013(C) 2013 OSA 11 February 2013 / Vol. 21, No. 3 / OPTICS EXPRESS 3801

QWs was performed by Almogy et al. [14] almost twenty years ago, using a multi-pass waveguide configuration and ellipsometry to extract the phase difference between the s and p polarizations. On the other hand, very few theoretical and experimental works have addressed the change in the refractive index introduced by ISBT in GaN-based QWs. The theoretical work of Cen et al. [15] describes the influence of polarization induced electric fields on the resonance wavelength and the refractive index of ISBTs in GaN/AlN coupled QWs. Refractive index nonlinearities in GaN/AlN QWs were studied by Lin et al. [16]. In a recent work, Lupo et al. [17] reported a measurement of ΔnISBT deduced from the shift of the position of the beating interference maxima of different order modes in a wave-guided depletion modulator. The value of the refractive index change, occurring when the carriers' population was varied from complete depletion to full population of the QWs, was found to be −5 × 10⁻³. This value of ΔnISBT is comparable to the birefringence occurring in InGaAsP/InP phase modulators based on interband transitions in QWs using the quantum confined Stark effect [18].
In this work we present an experimental study of ΔnISBT: the resonant contribution to the refractive index associated with the intersubband transition in a GaN/AlN MQW structure. The direct measurement of the dispersion around the ISBT resonance at 1.5 µm wavelength is extremely valuable for the proper design and implementation of high speed NIR electro-optical phase modulators for fiber- optics telecommunications. Our experimental approach is based on a free space Mach-Zehnder interferometer with the MQW sample inserted in one of the interferometer's arms. Such interferometric measurements are characterized by an extreme sensitivity to minute changes in the refractive index (much below 10−4). We measure a maximum value of ΔnISBT~6 × 10⁻³. From the measurements, we extract the continuous spectral dispersion around the resonance peak, by applying an appropriate dispersion model to the measured NIR interferogram. In addition, we use a Fourier Transform Infrared (FTIR) spectrometer to measure the absorption spectrum, and use the Kramers-Kronig (K-K) relations to obtain the associated spectral dispersion. The direct spectral dispersion measurement agrees very well with the spectral dispersion calculated from the K-K relations.
2. Sample structure and experimental techniques
We measured the ΔnISBT in a MQW structure, composed of GaN wells and AlN barriers, around their ISBT resonance frequency. The structure was grown by plasma-assisted molecular beam epitaxy (PMBE) on a 1-µm-thick AlN-on sapphire template. The active region (interaction layer) consists of 100 periods of 1.5-nm-thick GaN well with a 3-nm-thick AlN barrier. The wells are n-doped with Si at a (nominal) level of 5 × 1019 cm−3. The well thickness was designed to obtain ISBT around 1.5 µm, for telecommunications purposes. In order to comply with the ISB selection rule and to increase the absorbance, the sample facets were polished at 45°, creating a multi-pass waveguide structure. The length of this MQW sample is 8-mm and its thickness 450-µm thus ~17 passes through the interaction layer were obtained. To isolate the transmission response of the interaction layer from the entire active sample, we prepare a reference sample of AlN on sapphire, with identical geometrical shape and parameters, but without QWs, thus no resonance associated with ISBT is present.
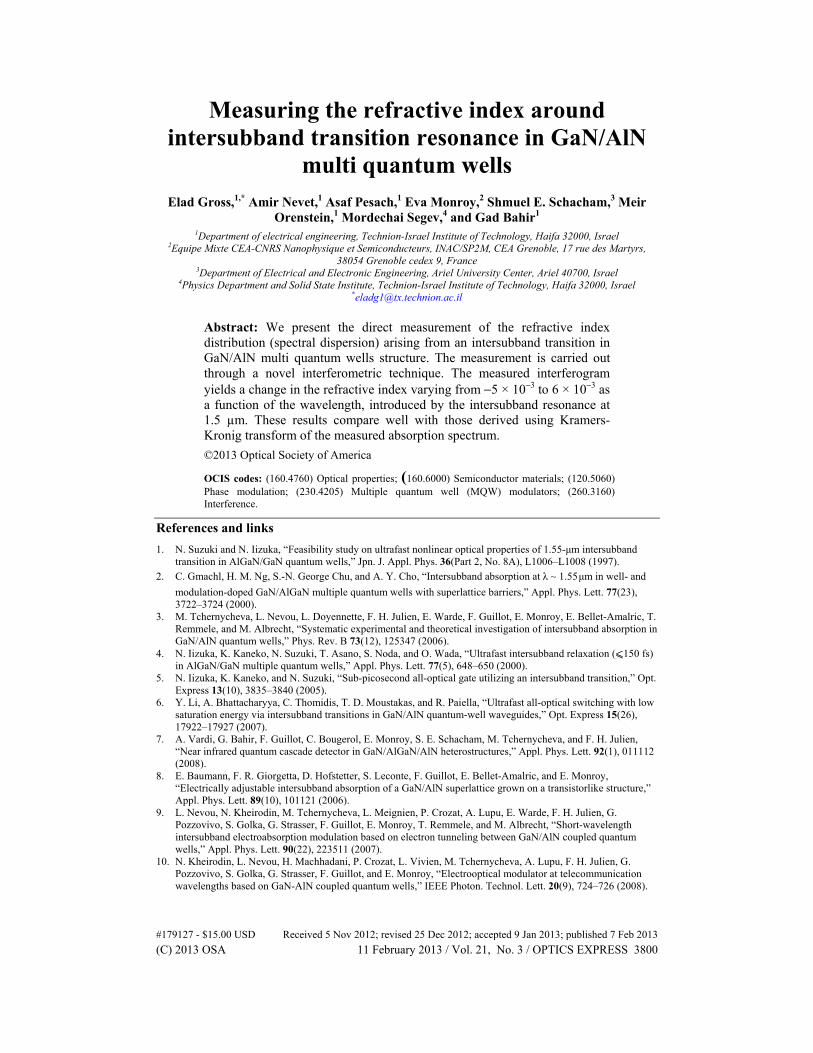
The Mach-Zehnder experimental setup is shown in Fig. 1. The NIR light source is comprised of two tunable lasers covering the spectral range of 1.456-1.630 µm, with coherence length ~4 cm. The laser beam is coupled to free space by a single mode fiber (SMF), and collimated by a NIR lens. The polarization-controlled collimated beam is modulated by a mechanical chopper and then split into the two arms of the interferometer at beam-splitter BS1. The beam in the sample arm is propagating directly through the sample, while the beam in the reference arm, after some attenuation (to match amplitudes), is passed through a 20mm-long block of BK7 glass (to fine-tune and calibrate the path difference between the arms). The beams are subsequently recombined at beam-splitter BS2. The
#179127 - $15.00 USD Received 5 Nov 2012; revised 25 Dec 2012; accepted 9 Jan 2013; published 7 Feb 2013(C) 2013 OSA 11 February 2013 / Vol. 21, No. 3 / OPTICS EXPRESS 3802
resulting interference pattern is detected by a Germanium photo-receiver (New Focus, model 2033). Computer software is used to record the response as a function of the wavelength.
Fig. 1. Free space Mach-Zehnder interferometer setup. The sample is in multi-pass waveguide configuration.
The refractive index of the sample can be extracted from the interferogram generated by scanning the wavelengths throughout the spectral range of the source. The resultant spectral interferogram has a period of ~3 nm, as shown in Fig. 4 below. Spectral scanning resolution of 0.5 nm is used to record the spectral interferogram pattern, complying with Nyquist sampling law.
3. Experimental results and analysis
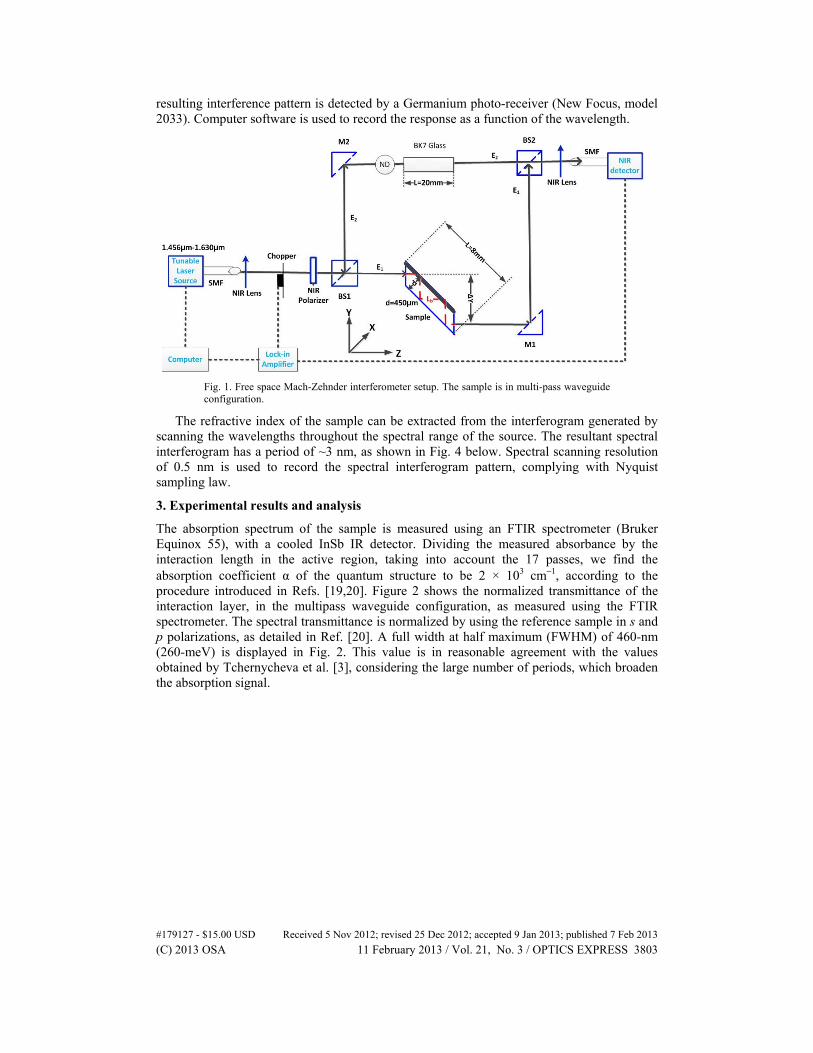
The absorption spectrum of the sample is measured using an FTIR spectrometer (Bruker Equinox 55), with a cooled InSb IR detector. Dividing the measured absorbance by the interaction length in the active region, taking into account the 17 passes, we find the absorption coefficient α of the quantum structure to be 2 × 103 cm−1, according to the procedure introduced in Refs. [19,20]. Figure 2 shows the normalized transmittance of the interaction layer, in the multipass waveguide configuration, as measured using the FTIR spectrometer. The spectral transmittance is normalized by using the reference sample in s and p polarizations, as detailed in Ref. [20]. A full width at half maximum (FWHM) of 460-nm (260-meV) is displayed in Fig. 2. This value is in reasonable agreement with the values obtained by Tchernycheva et al. [3], considering the large number of periods, which broaden the absorption signal.
#179127 - $15.00 USD Received 5 Nov 2012; revised 25 Dec 2012; accepted 9 Jan 2013; published 7 Feb 2013(C) 2013 OSA 11 February 2013 / Vol. 21, No. 3 / OPTICS EXPRESS 3803
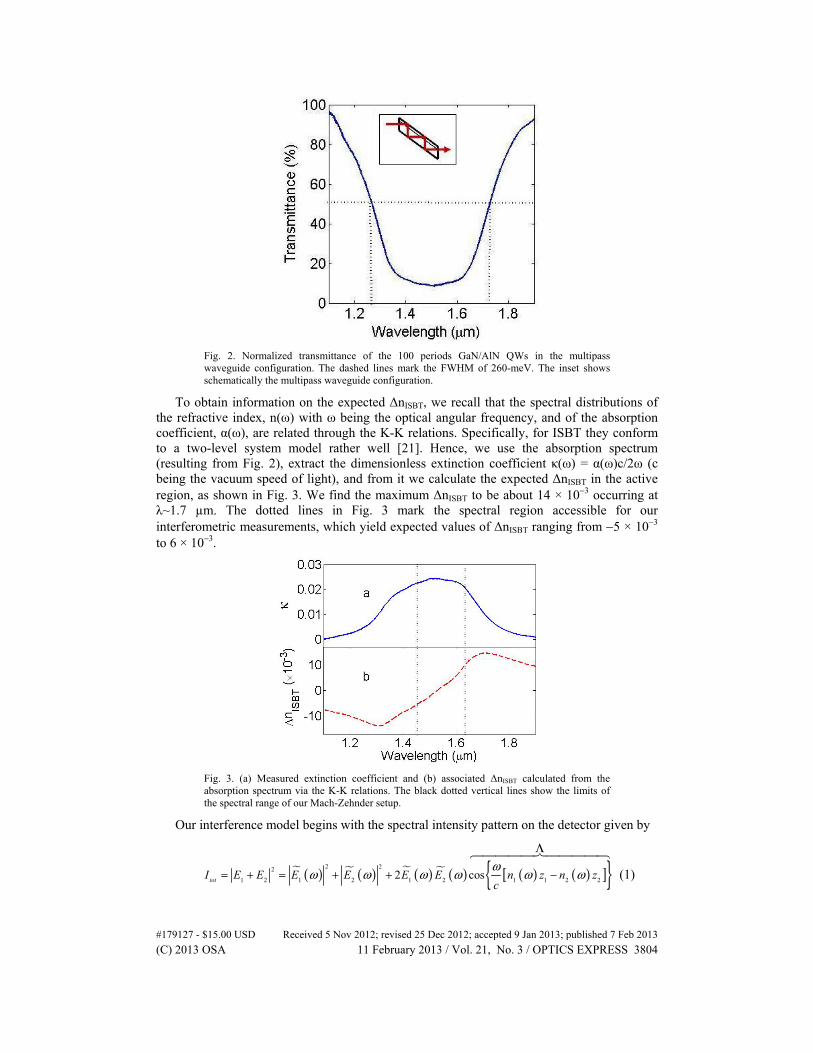
Fig. 2. Normalized transmittance of the 100 periods GaN/AlN QWs in the multipass waveguide configuration. The dashed lines mark the FWHM of 260-meV. The inset shows schematically the multipass waveguide configuration.
To obtain information on the expected ΔnISBT, we recall that the spectral distributions of the refractive index, n(ω) with ω being the optical angular frequency, and of the absorption coefficient, α(ω), are related through the K-K relations. Specifically, for ISBT they conform to a two-level system model rather well [21]. Hence, we use the absorption spectrum (resulting from Fig. 2), extract the dimensionless extinction coefficient κ(ω) = α(ω)c/2ω (c being the vacuum speed of light), and from it we calculate the expected ΔnISBT in the active region, as shown in Fig. 3. We find the maximum ΔnISBT to be about 14 × 10−3 occurring at λ~1.7 µm. The dotted lines in Fig. 3 mark the spectral region accessible for our interferometric measurements, which yield expected values of ΔnISBT ranging from −5 × 10⁻³ to 6 × 10⁻³.
Fig. 3. (a) Measured extinction coefficient and (b) associated ΔnISBT calculated from the absorption spectrum via the K-K relations. The black dotted vertical lines show the limits of the spectral range of our Mach-Zehnder setup.
Our interference model begins with the spectral intensity pattern on the detector given by
( ) ( ) ( ) ( ) ( ) ( )[ ]{ }2 22
1 2 1 2 1 2 1 1 2 22 costotI E E E E E E n z n zc
= + = + + −
Λω
ω ω ω ω ω ω (1)
#179127 - $15.00 USD Received 5 Nov 2012; revised 25 Dec 2012; accepted 9 Jan 2013; published 7 Feb 2013(C) 2013 OSA 11 February 2013 / Vol. 21, No. 3 / OPTICS EXPRESS 3804
where ( ) ( )( ) { }exp , 1, 2k k k kE E i n z c kω ω ω= = , 1E ( 2E ) is the electric field amplitude in the
sample (reference) arm, 1n ( 2n ) is the effective refractive index of the sample (reference) arm
and 1z ( 2z ) is the optical length in the sample (reference) arm. Equation (1) consists of a DC
term and an interference term. To extract the normalized interferogram (the Λ term), we must perform, for both sample and reference, two additional measurements: transmittance through the sample arm while blocking the reference arm, and vice versa. Using those measurements, we derive the normalized interferogram from the equation
( )( ) ( ) ( ){ }Re
nt
Re
cos 1 12
tot Sample arm f arm
b i glass g
Sample arm f arm
I I In L Y L n
cI I
− −
− −
− −Λ = = − + Δ − −
⋅
ωω (2)
where I is the measured intensity, Lglass = 20-mm is the length of the BK7 glass and ng = 1.5 is its refractive index, ΔY = L/√2 is the beam displacement (L is the sample length), Lb and Lint are the total optical lengths in the sample (reference or active) and in the MQW interaction layer, respectively, as shown in Fig. 1, and n(ω) is the refractive index in the sample. In the presence of the ISBT resonance, the refractive index of the interaction layer changes and so does the spectral frequency of the interferogram.
Comparing the measured interferograms of the sample and reference in the p polarization, we can extract the QW dispersion around the resonance. Assuming linear dispersion of the refractive index about a center radial frequency ω0 we obtain:
( ) ( ) ( )
( ) ( ) ( )
Re f0,Re f 0 0
int0,int 0 0
ReferenceSample
Interaction Layer
n n n
n n n
ω ω ω ω
ω ω ω ω
= + ⋅ −
= + ⋅ −
(3)
n0,Ref and ñRef are the refractive index at the center radial frequency ω0 and the slope of the dispersion curve around ω0 of the reference sample, respectively. Similarly, n0,int and ñint are the refractive index at the center angular frequency ω0 and the slope of the dispersion curve around ω0 of the interaction layer, respectively. ω0 is determined at the point of maximum absorption (Fig. 2). By inserting Eq. (3) into Eq. (2) we find that the resulting argument of the cosine function is varying as aω2 + bω. Here, a and b are real constant proportional to the refraction parameters, from which we derive the linear dispersion coefficients of the samples, based on the interference model. To extract a and b, we had to modify conventional data fitting algorithms for the analysis of the measured near IR interferograms.
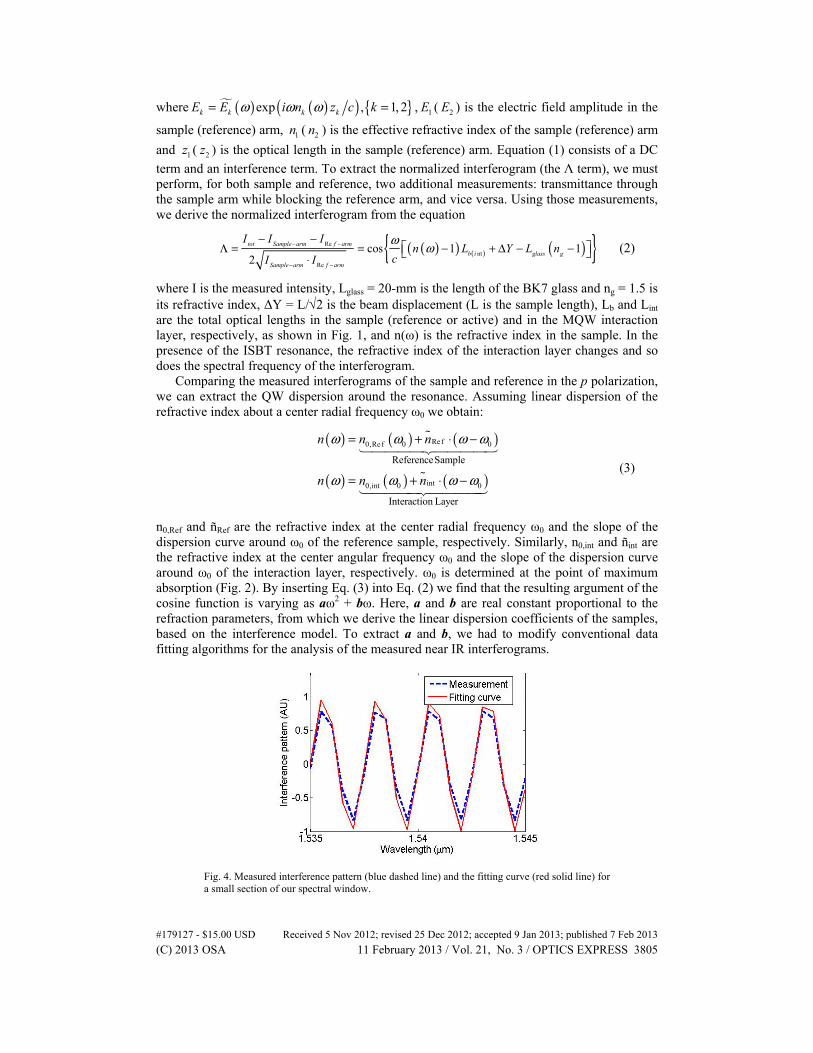
Fig. 4. Measured interference pattern (blue dashed line) and the fitting curve (red solid line) for a small section of our spectral window.
#179127 - $15.00 USD Received 5 Nov 2012; revised 25 Dec 2012; accepted 9 Jan 2013; published 7 Feb 2013(C) 2013 OSA 11 February 2013 / Vol. 21, No. 3 / OPTICS EXPRESS 3805

Figure 4 shows the measured interference pattern for a small section of our spectral window, along with the cos(aω2 + bω) fitting curve obtained using the fitting algorithms. Each measurement is performed five times, to get the statistics on the mean value and standard deviation (STD) of a and b. Table 1 shows the extracted values of a and b. While a is positive in the reference sample, it has a smaller absolute value and is actually negative in the active sample. As shown below, a and b are related to ñRef and ñint. The results indicate that in the interaction sample the slope of the dispersion curve inverts, as a consequence of the ISB absorption resonance in the interaction layer – as indeed expected in a resonance conforming to a two-level system.
Table 1. Values of parameters a and b, extracted by fitting cos(aω2 + bω) to the experimental data. While a is positive for the reference sample, it is smaller and negative
for the active sample.
Sample a (10−29sec2/rad) [Average ± STD]
b (10−12sec) [Average ± STD]
Reference 14 ± 1.6 2.8 ± 0.04 Active −1.5 ± 0.8 2.29 ± 0.02
According to Eq. (2) and Eq. (3), a and b for the reference sample are
( ) ( )0, 0 1 1
;Refb Ref glass gRef b
Ref Ref
L n n Y L nn La b
c c
ω− − + Δ − −= = (4)
By weighted averaging the optical lengths in the reference sample and in the interaction layer, the a and b of the active sample are found to be
( )
( ) ( ) ( ) ( )
intint intint Re
intint 0, 0 int 0,int 0
int Re
1 1 1
Ref bf
Refb Ref glass g
f
n L L n La
c
L L n n L n n Y L nb
c
ω ω
+
+
− +=
− − − + − − + Δ − −=
(5)
where Lb−Lint is the optical length in the active sample excluding the interaction layer. Using Eq. (4) we extract ñRef, isolate a and b of the interaction layer, and find
( )
int0,int 0, 0int
intintint
RefRefRef Ref
RefRef Ref
n n n nb b
a a n n
ωξ+
+
− − −−= =
− − (6)
Equation (6) is independent of all optical lengths. By defining Xint = ñint−ñRef and Δn0,int = n0,int−n0,Ref, Eq. (6) becomes
0,intint
int 0
nX
ξ ωΔ
=+
(7)
The refractive index of the (1.5-nm-thick) GaN QW is 2.3 and of the (3-nm-thick) AlN barrier is 2.0, based on Ref. [22]. Thus, the weighted average refractive index of the interaction layer, n0,int, is 2.1. The refractive index of the reference sample, n0,Ref, (450-μm-thick sapphire on 1-μm-thick AlN template) is measured separately with our Mach-Zehnder setup in a front configuration (sample placed normal to the incident radiation) to be 1.74, in good agreement with Ref. [23].
Using Table 1 and Eq. (4)-(7), we derive ΔnISBT: the dispersion of the refractive index of the interaction layer due to ISB absorption in GaN/AlN MQWs. Within our experimental measurement window, the explicit relation between ΔnISBT and the parameters derived from the experiments is ΔnISBT = ñint·(ω−ω0). Table 2 shows the linear dispersion coefficients ñRef,
#179127 - $15.00 USD Received 5 Nov 2012; revised 25 Dec 2012; accepted 9 Jan 2013; published 7 Feb 2013(C) 2013 OSA 11 February 2013 / Vol. 21, No. 3 / OPTICS EXPRESS 3806

ñint. It can be seen that, while the slope of the dispersion curve of the reference sample is positive, it is negative for the interaction layer. Moreover, ñint is more than 25 times larger than ñRef. Based on Eq. (3) and inserting the refraction parameters of Table 2, we calculate the spectral dispersion in the samples within the measured spectral range. Figure 5 shows the measured dispersion curves of the reference sample for p and s polarizations. The two orthogonal polarizations have very similar dispersion curves. The minute difference between them is due to the small birefringence in the reference sample (arising from the sapphire and the AlN materials). Figure 6 shows the measured (continuous red line) dispersion curve of ΔnISBT for the GaN/AlN MQW interaction layer. The full dispersion curve, as calculated by K-K relations from the measured absorption spectrum (Fig. 3), is shown by a green dashed curve. Very good match between the measured results using the Mach-Zehnder setup and K-K calculations is demonstrated. The obtained values of ΔnISBT (the dotted-dashed line in Fig. 6), namely, the contribution of the ISBT resonance to the refractive index of the active sample, are more than an order of magnitude larger than the corresponding value for the reference sample (10−4), within the measured spectral range. The values of ΔnISBT are measured to vary continuously from −5 × 10⁻³ to 6 × 10⁻³. Based on linear extrapolation of our experimental results, the maximum value of ΔnISBT is around 13 × 10−3 at 1.7 µm, as expected - at a wavelength longer than the absorption resonance center (Fig. 6). Likewise, the minimum value of ΔnISBT occurs at 1.3 µm, a wavelength shorter than the absorption center.
Table 2. Measured linear dispersion coefficients ñ, in units of 1/ω, and refractive indices at the resonance center, n0,Ref, n0,int, for the reference sample and interaction layer
Sample ñ (10−17 sec/rad) n0 Reference 0.3 1.74
Interaction layer −8.4 2.1
Fig. 5. Measured dispersion of the reference sample, Δn=ñRef·(ω−ω0), in s and p polarizations. The small difference between the two curves is due to birefringence in the sapphire and the AlN materials in the reference sample.
#179127 - $15.00 USD Received 5 Nov 2012; revised 25 Dec 2012; accepted 9 Jan 2013; published 7 Feb 2013(C) 2013 OSA 11 February 2013 / Vol. 21, No. 3 / OPTICS EXPRESS 3807

Fig. 6. Measured spectral variation of the contribution of the intersubband transition to the refractive index in the GaN/AlN MQWs interaction layer (solid red line), the corresponding dispersion curve computed via the K-K relations, from the FTIR absorption measurements of Fig. 3 (green dashed line), and the measured dispersion in the reference sample (blue dotted-dashed line) which is an order of magnitude smaller (of the order of 10−4).
4. Summary and conclusions
In this work, we directly measured the contribution of the intersubband transition to the refractive index, arising from a resonance around 1.5 μm wavelength, in a GaN/AlN MQW structure. The experiment was performed using a free-space Mach-Zehnder setup with the MQW sample in a multi-pass waveguide configuration. We have shown that the experimental setup is highly sensitive and can measure dispersion as low as 10−4. The resonant contribution to the refractive index was derived from the interferogram and displayed values between −5 × 10⁻³ to 6 × 10⁻³ within the measured spectral range. These values are similar to those in standard interband-based modulators in InGaAsP/InP QW. The experimental results coincide with the analysis based on K-K relations for FTIR absorbance measurements. The outcome of this experiment paves the way for realizing ISBT-based integrated Mach-Zehnder phase modulators at the optical communication wavelength range.
Acknowledgments
This work was supported by EC FP7 FET-OPEN STREP “Unitride” under grant agreement #233950 and by the Focal Technolgy Area on Nanophotonics for Detection program. We are indebted to Dr. Tomer Michaeli for the valuable discussions.
#179127 - $15.00 USD Received 5 Nov 2012; revised 25 Dec 2012; accepted 9 Jan 2013; published 7 Feb 2013(C) 2013 OSA 11 February 2013 / Vol. 21, No. 3 / OPTICS EXPRESS 3808