Three-Dimensional Holographic Refractive-Index Measurement ...
16
Three-Dimensional Holographic Refractive-Index Measurement of Continuously Flowing Cells in a Microfluidic Channel The MIT Faculty has made this article openly available. Please share how this access benefits you. Your story matters. Citation Sung, Yongjin, Niyom Lue, Bashar Hamza, Joseph Martel, Daniel Irimia, Ramachandra R. Dasari, Wonshik Choi, Zahid Yaqoob, and Peter So. “Three-Dimensional Holographic Refractive-Index Measurement of Continuously Flowing Cells in a Microfluidic Channel.” Physical Review Applied 1, no. 1 (February 2014). As Published http://dx.doi.org/10.1103/PhysRevApplied.1.014002 Publisher American Physical Society Version Author's final manuscript Citable link http://hdl.handle.net/1721.1/97724 Terms of Use Creative Commons Attribution-Noncommercial-Share Alike Detailed Terms http://creativecommons.org/licenses/by-nc-sa/4.0/
Transcript of Three-Dimensional Holographic Refractive-Index Measurement ...
Three-Dimensional Holographic Refractive-Index Measurementof Continuously Flowing Cells in a Microfluidic Channel
The MIT Faculty has made this article openly available. Please share how this access benefits you. Your story matters.
Citation Sung, Yongjin, Niyom Lue, Bashar Hamza, Joseph Martel, DanielIrimia, Ramachandra R. Dasari, Wonshik Choi, Zahid Yaqoob,and Peter So. “Three-Dimensional Holographic Refractive-IndexMeasurement of Continuously Flowing Cells in a MicrofluidicChannel.” Physical Review Applied 1, no. 1 (February 2014).
As Published http://dx.doi.org/10.1103/PhysRevApplied.1.014002
Publisher American Physical Society
Version Author's final manuscript
Citable link http://hdl.handle.net/1721.1/97724
Terms of Use Creative Commons Attribution-Noncommercial-Share Alike
Detailed Terms http://creativecommons.org/licenses/by-nc-sa/4.0/

Three-Dimensional Holographic Refractive-Index Measurement of Continuously Flowing Cells in a Microfluidic Channel
Yongjin Sung1,†, Niyom Lue1, Bashar Hamza2, Joseph Martel2, Daniel Irimia2, Ramachandra R. Dasari1, Wonshik Choi3, Zahid Yaqoob1, and Peter So1,4
1 Laser Biomedical Research Center, Massachusetts Institute of Technology, Cambridge, MA, USA
2 BioMEMS Resource Center, Massachusetts General Hospital, and Harvard Medical School, Charlestown, MA, USA
3 Department of Physics, Korea University, Seoul, Korea
4 Department of Mechanical Engineering and Department of Biological Engineering, Massachusetts Institute of Technology, Cambridge, MA, USA
Abstract
Refractive index of biological specimens is a source of intrinsic contrast that can be explored
without any concerns of photobleaching or harmful effects caused by extra contrast agents. In
addition, RI contains rich information related to the metabolism of cells at the cellular and
subcellular levels. Here, we report a no-moving parts approach that provides three-dimensional
refractive index maps of biological samples continuously flowing in a microfluidic channel.
Specifically, we use line illumination and off-axis digital holography to record the angular spectra
of light scattered from flowing samples at high speed. Applying the scalar diffraction theory, we
obtain accurate RI maps of the samples from the measured spectra. Using this method, we
demonstrate label-free 3-D imaging of live RKO human colon cancer cells and RPMI8226
multiple myeloma cells, and obtain the volume, dry mass and density of these cells from the
measured 3-D refractive index maps. Our results show that the reported method, alone or in
combination with the existing flow cytometry techniques, promises as a quantitative tool for stain-
free characterization of large number of cells.
Introduction
Refractive index serves as a source of intrinsic contrast in a variety of imaging modalities
including optical coherence tomography [1, 2] and light-scattering spectroscopy [3, 4]. At
the same time, the refractive index can be related to the density of organic molecules [5-7],
and its volume integral can provide the total amount of non-aqueous content in a cell [8-10]
or organelles [11]. Variance and change in the refractive index of cells have been also linked
to carcinogenic transformations [12, 13]. The refractive index of homogeneous bulk
materials can be obtained with a critical angle refractometer measuring the critical angle of a
† To whom correspondence should be addressed. [email protected].
NIH Public AccessAuthor ManuscriptPhys Rev Appl. Author manuscript; available in PMC 2014 November 19.
Published in final edited form as:Phys Rev Appl. 2014 February 27; 1: . doi:10.1103/PhysRevApplied.1.014002.
NIH
-PA
Author M
anuscriptN
IH-P
A A
uthor Manuscript
NIH
-PA
Author M
anuscript
specimen with respect to the other material with known refractive index [14]. For thin
layered materials, ellipsometry measuring depolarization of the incident light is known to be
accurate [14]. Measuring the refractive index of a non-homogeneous specimen such as
biological cells requires a more delicate approach.
The refractive index can be related to the speed of light wave inside a material [15].
Therefore, wavefront distortion, which represents the total phase (time) delay of the light
wave due to a specimen, can be connected to the 3-D refractive index map of the specimen.
The wavefront distortion can be measured with a Shack-Hartman wavefront sensor [16, 17],
interferometry [18-21], or inline holography (also called propagation-based methods) [22,
23]. Among these techniques, interferometry is particularly appropriate in the optical
regime, where the light sources with a reasonably large coherence length are readily
available. The wavefront measurement for a single angle of illumination can provide only
partial information of the 3-D specimen; thus, one can has to perform tomographic
measurement in conjunction with the wavefront measurement. Typically, a collimated laser
beam is used and its angle of incidence onto the sample is varied by rotating the sample or
scanning the direction of illumination beam [24-27]. It has been also demonstrated that one
can obtain the refractive index map with a spatially-incoherent beam and scanning the
objective focus through the sample [28]. In either approach, however, the sample has to be
stationary while the illumination direction or the objective focus is varied, which limits the
throughput of imaging.
From the Huygens principle [15], a plane wave can be synthesized from parallel line-
focused beams, whose relative phase determines the wave propagation direction, and vice
versa. Thus, scanning a line-focused beam across a sample, we can collect the information
equivalent to that acquired with varying the illumination angle of a plane wave onto the
sample. Importantly, in the former we measure the angular spectra of scattered light, while
in the latter we directly measure distorted wavefronts after the sample. From the angular
spectra acquired for varying locations of the line-focused beam, we can obtain the depth-
resolved refractive index map. This technique, called wave synthesis or synthetic aperture
tomography, was demonstrated first in the ultrasound regime [29], and recently in the optical
regime [30]. In our previous demonstration [30], the angular spectra, which are complex
quantities, were measured with phase shifting interferometry (PSI). In PSI, the sample has to
be stationary during the phase shifting step; thus, the images are acquired in a discrete
fashion, which cannot be applied to continuously flowing samples. For tomographic
reconstruction, we adopted a filtered back-projection algorithm [31], which is not ideal for
thick cells. In this study, we overcome these limitations by adopting off-axis digital
holography for the angular spectra measurement and applying an algorithm based on the
scalar diffraction theory for the tomographic reconstruction. Using a microfluidic channel
designed for our high-numerical-aperture setup, we demonstrate, for the first time within our
knowledge, 3-D refractive index imaging of cells continuously flowing in a microfluidic
channel.
Sung et al. Page 2
Phys Rev Appl. Author manuscript; available in PMC 2014 November 19.
NIH
-PA
Author M
anuscriptN
IH-P
A A
uthor Manuscript
NIH
-PA
Author M
anuscript

Methods
Consider that we illuminate a specimen with the light whose complex amplitude can be
represented by uin. From the scalar diffraction theory, the complex amplitude of scattered
light can be written as [32]
(1)
where G(r)= exp(ikr)/4πr is the Green's function for the Helmholtz equation. λ is the
wavelength of the incident light in the medium, and k = 2π/λis the wavenumber. The
function V(x, y, z)=k2 (1–(n(x, y, z)/n0)2) is the scattering potential of the specimen, in which
n(x, y, z) and n0 represent the refractive indices of the specimen and surrounding medium,
respectively. We note that for plane wave illumination, Eq. (1) is reduced to the complex
scattered phase in conventional optical diffraction tomography [33]. In this study, we
illuminate the specimen with a line-focused beam, which consists of multiple plane waves,
and measure the angular spectra of the scattered light [34]. For tomographic reconstruction,
we record a series of the angular spectra Esamp (kx, y; η)for varying locations η of the sample
while it passes across the line-focused beam. The variable kx is the spatial frequency
coordinate corresponding to the spatial coordinate x. In order to remove any background
phase due to optical aberration, we also record an angular spectrum Ebg(kx, y) before starting
the experiment. With the first-order Rytov approximation [29, 35], the measured angular
spectra Esamp (kx, y;η) and Ebg(kx, y) can be related to the specimen's scattering potential V
(x, y, z) as
(2)
Here, , and w(u) = (k2 – u2)1/2. Taking the
Fourier transform of Eq. (2) with respect to y and η, we obtain Eq. (3), which simply relates
the measured angular spectra with the specimen's scattering potential in the spatial
frequency space.
(3)
where is the 2-D Fourier transform of ūscat(kx,
y;η) with respect to y and η.
Figure 2 shows a schematic of the experimental setup used for this study. It is based on
Mach-Zehnder interferometry, and adopts a He-Ne laser (λ = 633 nm) as the light source.
We generate a line-focused beam with a high-NA condenser lens (Olympus, Numerical
Aperture = 1.4) and a cylindrical lens (f = 100 mm, where f is the focal length of the lens).
We flow samples across this line-focused beam in a microfluidic channel, and collect the
angular spectra of scattered light with a high-NA objective lens. The beam after the tube
lens is expanded using a cylindrical lens CL 2 (f = 400 mm). Two other cylindrical lenses
CL 1 (f = 200 mm) and CL 3 (f = 200 mm) are installed in the beam path to deliver the
image in a 4-f configuration along the non-focusing axis. A complementary metal oxide
Sung et al. Page 3
Phys Rev Appl. Author manuscript; available in PMC 2014 November 19.
NIH
-PA
Author M
anuscriptN
IH-P
A A
uthor Manuscript
NIH
-PA
Author M
anuscript

semiconductor (CMOS) camera (1024PCI, Photron Inc.) located at the back focal plane of
CL 2 records the complex angular spectra while the samples flow across the line-focused
beam. Importantly, we adopt off-axis holography and record both the amplitude and phase
of angular spectrum in a single shot for each location of the flowing sample. Specifically, we
tilt the reference beam slightly with respect to the sample beam for the raw interferogram
images to have about a three-pixel fringe period [19]. The camera is triggered by an internal
clock to capture the interferograms at the frame rate of 5,000 frames/sec. Both the high
frame rate for camera and the high NA for capturing high-angle scattering are important to
achieve high spatial resolution in our method. In this study, we adjust the flow speed so as to
acquire about 500 images per cell. The corresponding speed of cells in the channel is about
150 μm/sec assuming the cell diameter of 15 μm. The thickness of the upper
Polydimethylsiloxane (PDMS) layer of microfluidic device has to be smaller than the
working distance of the high-NA condenser lens (~ 200 μm). In addition, to minimize the
cell tumbling and rotation within the channel, we design the channel height to be slightly
larger than the average diameter of cells. Using precise control of the soft-lithography
process (see Materials and Methods for more explanation), we have made a microfluidic
device that meets these criteria. The dimension of the channel cross-section used for this
study is 30 × 400 μm2 (height × width).
Results
Figure 3 shows the data processing for raw interferogram images. Figure 3(i) shows an
example interferogram image recorded using our set-up (Fig. 2), and Fig. 3(ii) is the
amplitude of the Fourier transform of Fig. 3(i). The region in the dotted circle contains the
information about the specimen, which is separated from the unscattered light (the peak at
the center). Selecting the dotted region, moving it to the center and taking the inverse
Fourier transform, we can retrieve the complex angular spectra Esamp (kx, y; η)for each
location η of the sample (see Materials and Methods for detailed description). Figures 3 (iii,
iv) show the amplitude and phase, respectively, of the angular spectra retrieved from Fig.
3(i). Similarly, we process the other raw interferogram images to obtain a series of angular
spectra for varying locations of the flowing specimen [Fig. 4(a)]. Taking the Fourier
transform of the data cube along the kx and η axes, we can obtain a sinogram [Fig. 4(b)],
where x and y are spatial coordinates and kη corresponds to the angle of illumination.
Instead, we take the Fourier transform of the original data cube with respect to y and η, and
map it in the 3-D spatial frequency space using the Fourier diffraction theorem, Eq.(3).
Figure 4(c) shows cross-section images of the spatial frequency map Ṽ of an RKO human
colon cancer cell after the mapping. In our set-up, samples flow across a line-focused beam,
and this is equivalent to changing the angle of illumination along one axis in rotating-beam
geometry [35]. Thus, the spatial resolution and optical sectioning capability are the same as
those for plane wave tomography adopting one-axis scanning, which explains an empty
region resembling an apple core near the center of the image in Fig. 4(c) (i) [36]. The kx – kz
cross-section [Fig. 4(c) (ii)] shows a similarly empty region, which is due to the limited
angular coverage of the condenser and objective lenses [37]. These empty regions in the 3-D
spatial frequency map generate missing angle artifacts, elongation of the object in the
reconstructed image and underestimation of its refractive index. In this work, we adopt an
Sung et al. Page 4
Phys Rev Appl. Author manuscript; available in PMC 2014 November 19.
NIH
-PA
Author M
anuscriptN
IH-P
A A
uthor Manuscript
NIH
-PA
Author M
anuscript

algorithm utilizing the nonnegativity of mass density, which accurately provides mean
refractive index values of cells [37]. For more complete compensation of the missing angle
data, we can apply additional constraints, e.g., piecewise-smoothness of the refractive index
profile, in the reconstruction process. Figure 5(a) shows the refractive index map of an RKO
human colon cancer cell after 200 iterations. Figure 5(a) (i), the center cross-section of the
3-D map clearly shows the nucleus and nucleolus of the cell. Figure 5(a) (ii) shows
horizontal cross-sections extracted for varying heights (1.5 μm spacing between the slices),
which show varying structures in the cell with high optical sectioning capability.
Measuring the mass and volume of cells is connected to the fundamental question of
biology: how the cells grow and their growth is regulated [10, 38, 39]. The refractive index
of a biological specimen is known to be proportional to the concentration of organic
molecules within the specimen [5-7]. Adopting this relationship, we can obtain the density
of non-aqueous materials inside a cell, called dry density, from
(4)
where the quantity α is the average specific refractive index increment, α = 0.190 (g/mL)−1
[40]. The volume of a sample can be calculated by counting the number of voxels after
applying thresholding to the reconstructed refractive index map. The total dry mass within
the cell can be obtained by taking the integral of the 3-D density map, given by Eq. (4), over
the cell volume. To validate our method, we imaged 10-μm polystyrene beads flowing in the
index matching oil of refractive index 1.54. The diameter of polystyrene beads (N = 8) was
measured to be 9.89 ± 0.35 μm, and the refractive index n was determined as 1.583 ± 0.005.
These values match well with the values provided by the manufacturer (10 μm diameter, n =
1.585). When normalized with the manufacturer's specifications, the measured volume and
refractive index of the beads are 0.980 ± 0.110 and 0.986 ± 0.032, respectively. These
values may be used as estimates for the accuracy of the proposed method in volume and
density measurement. Next, we imaged RKO human colon cancer cells and RPMI8226
human multiple myeloma cells (N = 60 each) [see Figs. 5(b) (i)-(iii)]. The distributions of
mass and volume are broad because the measurement was applied to an asynchronous
population of cells. Interestingly, the mean volume of RPMI8226 cells (1654 ± 69 fl) is 11.6
± 6.3 % smaller than that of RKO cells (1845 ± 70 fl), while the mean dry mass of
RPMI8226 cells (345 ± 13 pg) is 15.0 ± 5.8 % larger than that of RKO cells (300 ± 11 pg).
We note that the volume of two cell types is not statistically different (p > 0.05, two-tailed t-
test, N = 60), but RPMI8226 cells (170 ± 5 g/l) have 17.2 ± 5.4 % larger mean (dry) density
than RKO cells (145 ± 5 g/l) due to their larger mass. Both the dry mass and density are
measured to be significantly different in two cell types (p < 0.01, two-tailed t-test, N = 60).
Discussion
Major contrast mechanism in flow cytometry is fluorescence, externally administered or
generated through genetic manipulation. However, the fluorescent labeling is not always a
viable option especially for primary cells. In addition, accurate quantification of the target
molecules is challenged by photobleaching and non-uniform binding of the labeling agents
[41]. Three-dimensional refractive index measurement enables to quantify the cell
Sung et al. Page 5
Phys Rev Appl. Author manuscript; available in PMC 2014 November 19.
NIH
-PA
Author M
anuscriptN
IH-P
A A
uthor Manuscript
NIH
-PA
Author M
anuscript

metabolism by measuring the mass of entire cell and internal organelles with minimal
perturbation [11]. Using plane-wave tomography, we have shown that adherently growing
cells have size-dependent growth rate as floating cells, while division asymmetry is higher
in the former [10]. In conjunction with low-noise diffraction phase microscopy, we also
showed that mammalian chondrocytes undergo three distinct phases of volume increase
[42]. Recent results show that molecular-specific signatures of cells can be also obtained
from refractive index measurement at multiple wavelengths [11, 43, 44].
The refractive index of a complex biological specimen can be obtained with measuring the
sample-induced wavefront distortion for varying illumination angle [24-26]. Inspired by
synthetic aperture tomography in ultrasound imaging [29], we demonstrated a method to
obtain the refractive index of cells translated across a line-focused laser beam [30]. In our
previous demonstration, however, the angular spectra of light scattered from the sample
were measured using phase-shifting interferometry, which requires the sample to be
stationary for each location of the sample. Thus, we mounted the sample on a translation
stage and translated it across the line-focused beam in a discrete fashion, which cannot be
applied to continuously flowing samples. We also adopted the inverse Radon transform for
tomographic reconstruction, which generates the diffraction artifact when applied in the
optical imaging [35].
In this study, we demonstrated 3-D refractive index imaging of continuously flowing cells in
a microfluidic channel. For this, we have adopted off-axis digital holography that can
measure the complex angular spectrum in a single-shot for each location of the flowing
sample. For tomographic reconstruction, we adopted an algorithm based on the scalar
diffraction theory to correct the artifacts due to defocused organelles and cells flowing at
different heights. Using these methods, we obtained 3-D maps of refractive index of two cell
types in the flow configuration, from which we quantified the volume, dry mass and dry
density of the cells. The existing method of obtaining the cell density in flow configuration
relies on the buoyant mass measurement using a suspended micro-channel resonator for two
different density liquids [45]. Removing the liquid-switching step, the method proposed in
this study can be applied for high throughput or long-term imaging of cells in an intact,
natural condition. In addition, our method can provide the 3-D density of map inside the
cells.
The tomographic reconstruction algorithm derived and adopted in this study assumes that
cells’ vertical position in the channel is fixed and their rotation is negligible for the period of
data collection or for complete passage of each cell across the line-focused beam. Observing
the cells under a collimated laser illumination and with a high-speed camera, we confirm
that cell tumbling is minimal for the design and flow conditions used in this study. However,
without a mechanism to stabilize the cells flowing in a microfluidic channel [46-48], the
possibility of cell rotation cannot be completely ruled out. In microfluidic systems the cell
rotation is caused by shear forces acting on a cell which is proportional to the speed of the
flow and inversely with size of the cell. A cell larger than half the height of the channel will
be less affected by this shear as the difference in fluid velocity on the sides of the cell
diminishes when the cell straddles the mid-height of the channel. By imaging PDMS beads
with air defects, we estimate that the maximum rotation of cells (mean diameter ~ 15 μm)
Sung et al. Page 6
Phys Rev Appl. Author manuscript; available in PMC 2014 November 19.
NIH
-PA
Author M
anuscriptN
IH-P
A A
uthor Manuscript
NIH
-PA
Author M
anuscript

during the data acquisition (0.1 sec) is about 4 degrees at the Reynolds number used in this
sutdy (5 × 10⁻³). The minimal effect of this rotation is further confirmed by the sharp
boundaries of the cell and nucleus in the reconstructed image of Fig. 5(a) (i) where the
rotation would likely cause blurring.
Conclusion
We have reported a method that provides 3-D refractive index map of cells continuously
flowing in a microfluidic channel. Specifically, we flow samples across a line-focused beam,
and record the angular spectra of scattered light using off-axis digital holography. The
microfluidic device is carefully designed and fabricated to minimize cell tumbling as well as
to enable the use of high-NA condenser and objective lenses. For tomographic
reconstruction of 3-D refractive index map, we have adopted an algorithm derived from the
scalar diffraction theory to compensate for defocusing of the cells in channel and to reduce
the diffraction artifacts that arise from defocused organelles inside cells. An iterative
constraint algorithm is applied to minimize the artifacts due to limited angular coverage of
the incident beam. Importantly, the reported method does not require any moving elements,
and permits high-speed acquisition of desired information. The proposed method therefore
holds great promise for single cell characterization; it can be readily incorporated into the
downstream of existing flow cytometry configurations for additional cell screening based on
accurate 3-D refractive index mapping. The measured refractive index map can be further
related to the distribution of mass at cellular or subcellular levels, and thus the metabolism
of cellular organelles.
Materials and Methods
Sample preparation
RKO human colon cancer cells are cultured in Dulbecco Modified Eagle medium
(Invitrogen, 21063-029) supplemented with 10 % FBS (Invitrogen, 10438026) and 1 %
100X penicillin-streptomycin solution (Invitrogen, 15140-122). RPMI8226 human multiple
myeloma cells are cultured in RPMI 1640 media (Invitrogen, 11835-030) supplemented
with 10 % FBS, and 1 % 100X penicillin-streptomycin solution. At 70 - 80 % confluency,
cells are collected with 0.25 % Trypsin-EDTA (Invitrogen, 25200-114), diluted 1:100 in
fresh culture media, and injected into the microfluidic channel with a syringe. 10-μm
polystyrene beads and refractive index liquids are purchased from Polysciences, Inc.
(17136-5) and Cargille (1809X), respectively. Beads with air defects are created by
vortexing a mixture of uncured PDMS (1:10 ratio of curing agent and PDMS elastomer base
that has been thoroughly mixed) and water with 0.1% Tween 20 (Sigma– Aldrich, P9416) at
an overall ratio of 10:1 (water to PDMS). Once vortexed, the emulsion is then heated to 65
°C in a water bath for 6 hours to cure the PDMS particles. The bead solution is then filtered
to obtain beads of a certain diameter and sedimentation can be used to collect particles with
air defects.
Sung et al. Page 7
Phys Rev Appl. Author manuscript; available in PMC 2014 November 19.
NIH
-PA
Author M
anuscriptN
IH-P
A A
uthor Manuscript
NIH
-PA
Author M
anuscript

Holographic recording of angular spectra
The amplitude and phase of angular spectra are recorded using off-axis holography. Figure 3
illustrates the process to analyze raw interferogram images. The irradiance [Fig. 3(i)] on the
detector can be expressed as:
(5)
where IS(x, y) and IR are the irradiances of the sample and reference beams, respectively,
and ΔΦ(x, y) is the phase difference between the two beams. The vector (p,q) indicates the
relative angle of incidence of the sample beam on the detector plane with respect to the
reference beam. The magnitude and direction of the vector explain the spacing and
orientation of the spatial fringes (see the inset of Fig. 3(i)), respectively, in the raw
interferogram. Figure 3(ii) shows the magnitude of the Fourier transform of Fig. 3(i) on a
logarithmic scale (base 10). The region inside the dotted circle can be described by
(6)
where is the Fourier transform of . Thus,
one can obtain the function Φ(x, y) by selecting the region in the dotted circle, moving it to
the origin of the frequency coordinates, and taking its inverse Fourier transform. The images
in Figs. 3(iii-iv) are the amplitude and phase images, respectively, obtained from Fig. 3(i).
Fabrication of a microfluidic device
Microfluidic devices were manufactured by replica molding of Polydimethylsiloxane
(PDMS, Dow Corning, Midland, MI) on a micro-fabricated master mold. The mold was
fabricated using standard photolithographic technique as briefly described below. A silicon
wafer was baked in an oven set to 200 °C for 30 minutes, cleaned with oxygen plasma
(March, Concord, CA), and then spin coated with SU-8 25 photoresist (SU8, Microchem,
Newton, MA) at 1850 rpm to achieve a final thickness of approximately 30 μm and
processed following the standard protocol as recommended by the manufacturer. A thin
layer of PDMS was prepared, degassed in a vacuum chamber for 1 hour, and then spun on
the wafer at 600 rpm for 15 seconds. After baking for 8 hours at 65 °C, the thin PDMS layer
covering the master along with thicker, cured, and previously-cut PDMS pieces (length ~ 1
cm, width ~ 0.5 cm, height ~ 0.3 cm) were exposed to 20 seconds of oxygen plasma and
bonded on the inlet and outlet regions. Next, the mold was baked at 75 °C for 10 minutes,
cut, slowly peeled off the master mold, and then punched with a 0.75 mm puncher to define
the inlet and the outlet holes of the device. Finally, a 48 × 65 mm No. 1 gold-coated cover
glass (Fisher Scientific, Pittsburgh, PA) along with the punched membrane-based channel
device were exposed to 20 seconds of oxygen plasma and carefully bonded at 75 °C for 10
minutes to define the microfluidic channels. Two pieces of flexible plastic tubing (Tygon,
ID 0.010 inch × OD 0.030 inch, Greene Rubber Co., Woburn, MA) were cut to a length of ~
3 cm and then inserted into the inlet and outlet holes of the device. A 30 g blunt needle
(Brico Medical Supplies, Dayton, NJ) was then inserted into one of the tubes to allow for a
syringe to be connected for sample loading purposes.
Sung et al. Page 8
Phys Rev Appl. Author manuscript; available in PMC 2014 November 19.
NIH
-PA
Author M
anuscriptN
IH-P
A A
uthor Manuscript
NIH
-PA
Author M
anuscript
Acknowledgments
This work was funded by the National Institutes of Health (9P41EB015871-26A1 and P41 EB002503), and Hamamatsu Photonics, Japan.
References
1. Huang D, et al. Science. 1991; 254:1178. [PubMed: 1957169]
2. Fujimoto JG. Nature biotechnology. 2003; 21:1361.
3. Backman V, et al. Nature. 2000; 406:35. [PubMed: 10894529]
4. Chalut KJ, Ostrander JH, Giacomelli MG, Wax A. Cancer Research. 2009; 69:1199. [PubMed: 19141640]
5. Barer R. Nature. 1952; 169:366. [PubMed: 14919571]
6. Barer R, Tkaczyk S. Nature. 1954; 173:821. [PubMed: 13165653]
7. Barer R. J. Opt. Soc. Am. 1957; 47:545. [PubMed: 13429433]
8. Mir M, Wang Z, Shen Z, Bednarz M, Bashir R, Golding I, Prasanth SG, Popescu G. Proceedings of the National Academy of Sciences. 2011; 108:13124.
9. Popescu G, Park YK, Lue N, Best-Popescu C, Deflores L, Dasari RR, Feld MS, Badizadegan K. American Journal of Physiology-Cell Physiology. 2008; 295:C538. [PubMed: 18562484]
10. Sung Y, Tzur A, Oh S, Choi W, Li V, Dasari RR, Yaqoob Z, Kirschner MW. Proceedings of the National Academy of Sciences. 2013:201315290.
11. Sung Y, Choi W, Lue N, Dasari RR, Yaqoob Z. PloS one. 2012; 7:e49502. [PubMed: 23166689]
12. Zysk AM, Chaney EJ, Boppart SA. Physics in medicine and biology. 2006; 51:2165. [PubMed: 16625033]
13. Wax A, Yang C, Müller MG, Nines R, Boone CW, Steele VE, Stoner GD, Dasari RR, Feld MS. Cancer Research. 2003; 63:3556. [PubMed: 12839941]
14. Singh S. Physica Scripta. 2002; 65:167.
15. Saleh, BE.; Teich, MC.; Saleh, BE. Fundamentals of photonics. Vol. 22. Wiley; New York: 1991.
16. Grimm B, Goelz S, Bille JF. JOSA A. 1994; 11:1949. [PubMed: 8071736]
17. Bon P, Maucort G, Wattellier B, Monneret S. Optics express. 2009; 17:13080. [PubMed: 19654713]
18. Creath K. Progress in optics. 1988; 26:349.
19. Ikeda T, Popescu G, Dasari RR, Feld MS. Optics letters. 2005; 30:1165. [PubMed: 15945142]
20. Iwai H, Fang-Yen C, Popescu G, Wax A, Badizadegan K, Dasari RR, Feld MS. Optics letters. 2004; 29:2399. [PubMed: 15532280]
21. Wang Z, Millet L, Mir M, Ding H, Unarunotai S, Rogers J, Gillette MU, Popescu G. Optics express. 2011; 19:1016. [PubMed: 21263640]
22. Reed Teague M. JOSA. 1983; 73:1434.
23. Streibl N. Optics communications. 1984; 49:6.
24. Lauer V. Journal of Microscopy. 2002; 205:165. [PubMed: 11879431]
25. Charrière F, Marian A, Montfort F, Kuehn J, Colomb T, Cuche E, Marquet P, Depeursinge C. Optics Letters. 2006; 31:178. [PubMed: 16441022]
26. Choi W, Fang-Yen C, Badizadegan K, Oh S, Lue N, Dasari R, Feld M. Nature Methods. 2007; 4:717. [PubMed: 17694065]
27. Isikman SO, Bishara W, Mavandadi S, Yu FW, Feng S, Lau R, Ozcan A. Proceedings of the National Academy of Sciences. 2011; 108:7296.
28. Bon P, Aknoun S, Savatier J, Wattellier B, Monneret S. SPIE BiOS (International Society for Optics and Photonics. 2013:858918.
29. Nahamoo D, Pan S, Kak AC. IEEE transactions on sonics and ultrasonics. 1984; 31:218.
30. Lue N, Choi W, Popescu G, Badizadegan K, Dasari RR, Feld MS. Optics express. 2008; 16:16240. [PubMed: 18825263]
Sung et al. Page 9
Phys Rev Appl. Author manuscript; available in PMC 2014 November 19.
NIH
-PA
Author M
anuscriptN
IH-P
A A
uthor Manuscript
NIH
-PA
Author M
anuscript

31. Kak A, Slaney M. 1988
32. Born, M.; Wolf, E. Principles of optics: electromagnetic theory of propagation, interference and diffraction of light. CUP Archive; 1999.
33. Wolf E. Optics Communications. 1969; 1:153.
34. Goodman, J. Introduction to Fourier optics. Roberts & Company Publishers; 2005.
35. Sung Y, Choi W, Fang-Yen C, Badizadegan K, Dasari R, Feld M. Optics Express. 2009; 17:266. [PubMed: 19129896]
36. Haeberlé O, Belkebir K, Giovaninni H, Sentenac A. Journal of Modern Optics. 2010; 57:686.
37. Sung Y, Dasari RR. J. Opt. Soc. Am. A. 2011; 28:1562.
38. Tzur A, Kafri R, LeBleu VS, Lahav G, Kirschner MW. Science. 2009; 325:167. [PubMed: 19589995]
39. Son S, Tzur A, Weng Y, Jorgensen P, Kim J, Kirschner MW, Manalis SR. Nature methods. 2012; 9:910. [PubMed: 22863882]
40. Zhao H, Brown PH, Schuck P. Biophysical Journal. 2011; 100:2309. [PubMed: 21539801]
41. Lakowicz JR, Masters BR. Journal of Biomedical Optics. 2008; 13:029901.
42. Cooper K, Oh S, Sung Y, Dasari RR, Kirschner MW, Tabin CJ. Nature. 2013 in press.
43. Rinehart MT, Shaked NT, Jenness NJ, Clark RL, Wax A. Optics letters. 2010; 35:2612. [PubMed: 20680075]
44. Fu D, Choi W, Sung Y, Yaqoob Z, Dasari RR, Feld M. Biomedical optics express. 2010; 1:347. [PubMed: 21113234]
45. Grover WH, Bryan AK, Diez-Silva M, Suresh S, Higgins JM, Manalis SR. Proceedings of the National Academy of Sciences. 2011; 108:10992.
46. Fuh CB. Analytical chemistry. 2000; 72266 A
47. Giddings JC. Separation science and technology. 1992; 27:1489.
48. Gascoyne PR, Vykoukal J. Electrophoresis. 2002; 23:1973. [PubMed: 12210248]
Sung et al. Page 10
Phys Rev Appl. Author manuscript; available in PMC 2014 November 19.
NIH
-PA
Author M
anuscriptN
IH-P
A A
uthor Manuscript
NIH
-PA
Author M
anuscript

Figure 1. Schematic of three-dimensional holographic imaging of continuously flowing cells.
Sung et al. Page 11
Phys Rev Appl. Author manuscript; available in PMC 2014 November 19.
NIH
-PA
Author M
anuscriptN
IH-P
A A
uthor Manuscript
NIH
-PA
Author M
anuscript
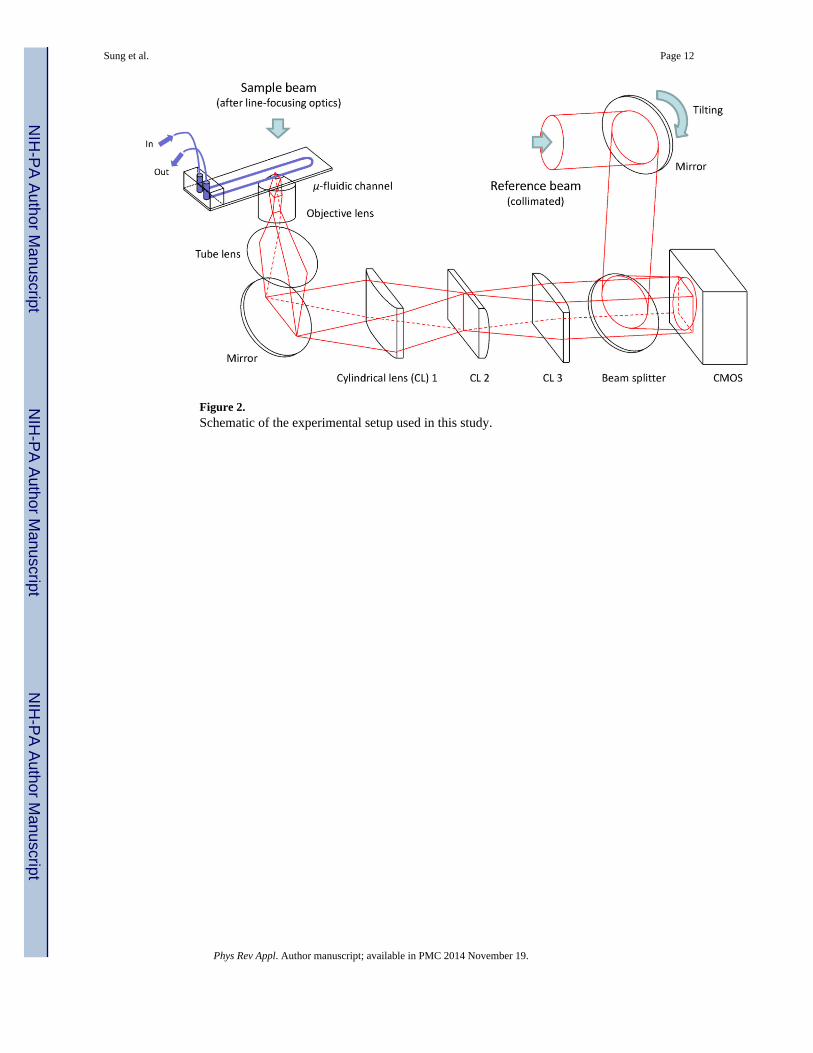
Figure 2. Schematic of the experimental setup used in this study.
Sung et al. Page 12
Phys Rev Appl. Author manuscript; available in PMC 2014 November 19.
NIH
-PA
Author M
anuscriptN
IH-P
A A
uthor Manuscript
NIH
-PA
Author M
anuscript

Figure 3. Data processing to extract the amplitude and phase of angular spectrum(i) An example of raw interferogram image. (ii) Magnitude of the Fourier transform of (i),
shown in a logarithmic scale (base 10). (iii, iv) Amplitude and phase images, respectively,
extracted from (ii).
Sung et al. Page 13
Phys Rev Appl. Author manuscript; available in PMC 2014 November 19.
NIH
-PA
Author M
anuscriptN
IH-P
A A
uthor Manuscript
NIH
-PA
Author M
anuscript

Figure 4. Mapping of the complex fields in the spatial frequency space(a) A series of raw interferogram images recorded for different locations of the sample and
corresponding phase images. (b) Sinogram, complex scattered fields plotted for varying
values of spatial frequency kη. (c) Spatial frequency spectrum of an RKO human colon
cancer cell after the mapping: (i)kx – ky cross-section; (ii) kx – kz cross-section; and (iii) ky –
kz cross-section containing the dotted line in (ii). Scale bar (1 μm−1) in (i) also applies to (ii)
and (iii).
Sung et al. Page 14
Phys Rev Appl. Author manuscript; available in PMC 2014 November 19.
NIH
-PA
Author M
anuscriptN
IH-P
A A
uthor Manuscript
NIH
-PA
Author M
anuscript

Figure 5. Refractive index measurement of RKO cells, and RPMI8226 cells(a) Reconstructed refractive index map of the RKO cell: (i) center cross-section (scale bar,
10 μm); and (ii) cross-sections at multiple heights extracted with 15 μm interval. (b)
Volume, dry mass, and dry density of RPMI8226 and RKO cells: (i) volume of RPMI8226
(1654 ± 69 fl) and RKO cells (1845 ± 70 fl); (ii) dry mass of RPMI8226 (345 ± 13 pg) and
RKO cells (300 ± 11 pg); (iii) dry density of RPMI8226 (170 ± 5 g/l) and RKO cells (145 ±
5 g/l). N = 60 for both cells in (i), (ii), and (iii). A volume-rendered image of the same cell in
Fig. 5(a) is shown on the left with the center cross-section exposed.
Sung et al. Page 15
Phys Rev Appl. Author manuscript; available in PMC 2014 November 19.
NIH
-PA
Author M
anuscriptN
IH-P
A A
uthor Manuscript
NIH
-PA
Author M
anuscript