Measuring Crust Color with Hyperspectral Imaging
14
MEASURING CRUST COLOR WITH HYPERSPECTRAL IMAGING
Transcript of Measuring Crust Color with Hyperspectral Imaging
MEASURING CRUST COLOR WITH
HYPERSPECTRALIMAGING
Introduction
The crust color in bakery products is a good indicator of the product quality. Finding the optimal baking time and tempera-ture reduces waste and as a result, cost.
Determining the optimal color can be a challenge. While the human eye can see colors relatively well, the results are very subjective and there is significant variation between individu-als. RGB cameras color perception is significantly worse than the human eye, and the accuracy is not enough for many of the applications.
Hyperspectral instruments have the accuracy that outper-forms the human eye when it comes to color measurements. Colors can be determined reliably and objectively, and the results are fully comparable.
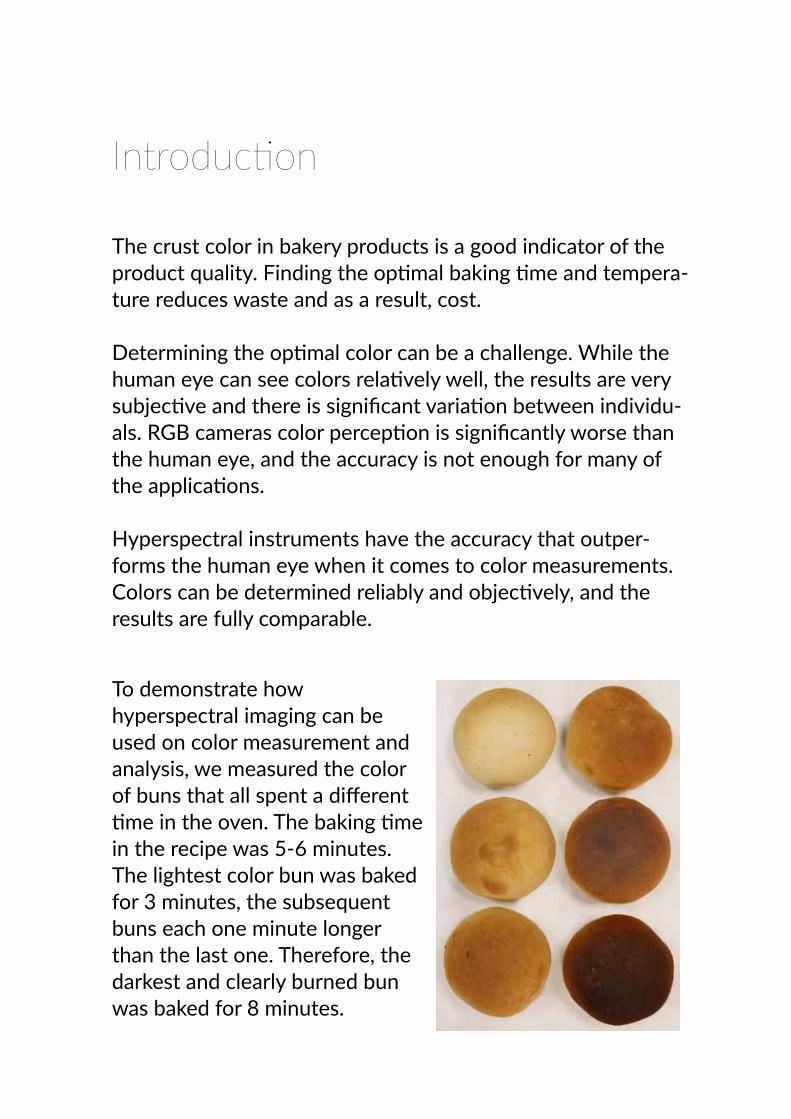
To demonstrate how hyperspectral imaging can be used on color measurement and analysis, we measured the color of buns that all spent a different time in the oven. The baking time in the recipe was 5-6 minutes. The lightest color bun was baked for 3 minutes, the subsequent buns each one minute longer than the last one. Therefore, the darkest and clearly burned bun was baked for 8 minutes.
Table of Contents
01. Lab color space02. Test setup and measurements03. Analysis and results04. Conclusion
Specim, Spectral Imaging Oy Ltd. ©2018Measuring crust color with hyperspectral imaging ver1-2018
Lab color space
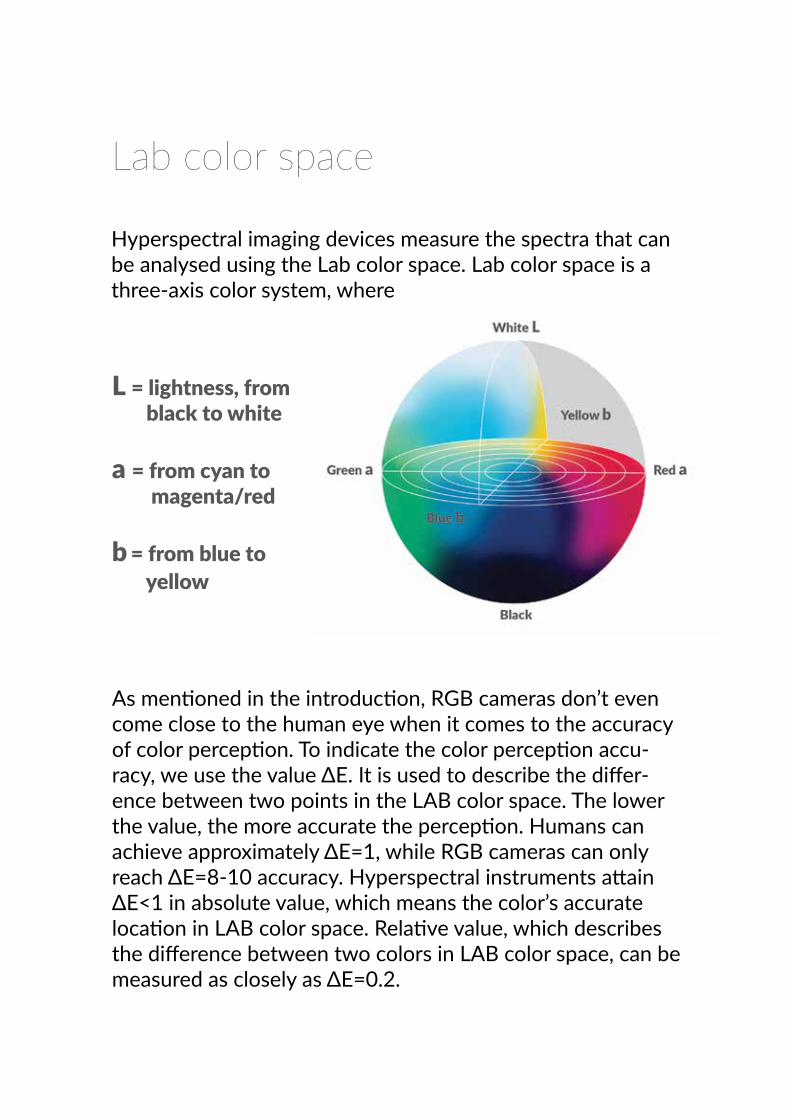
Hyperspectral imaging devices measure the spectra that can be analysed using the Lab color space. Lab color space is a three-axis color system, where
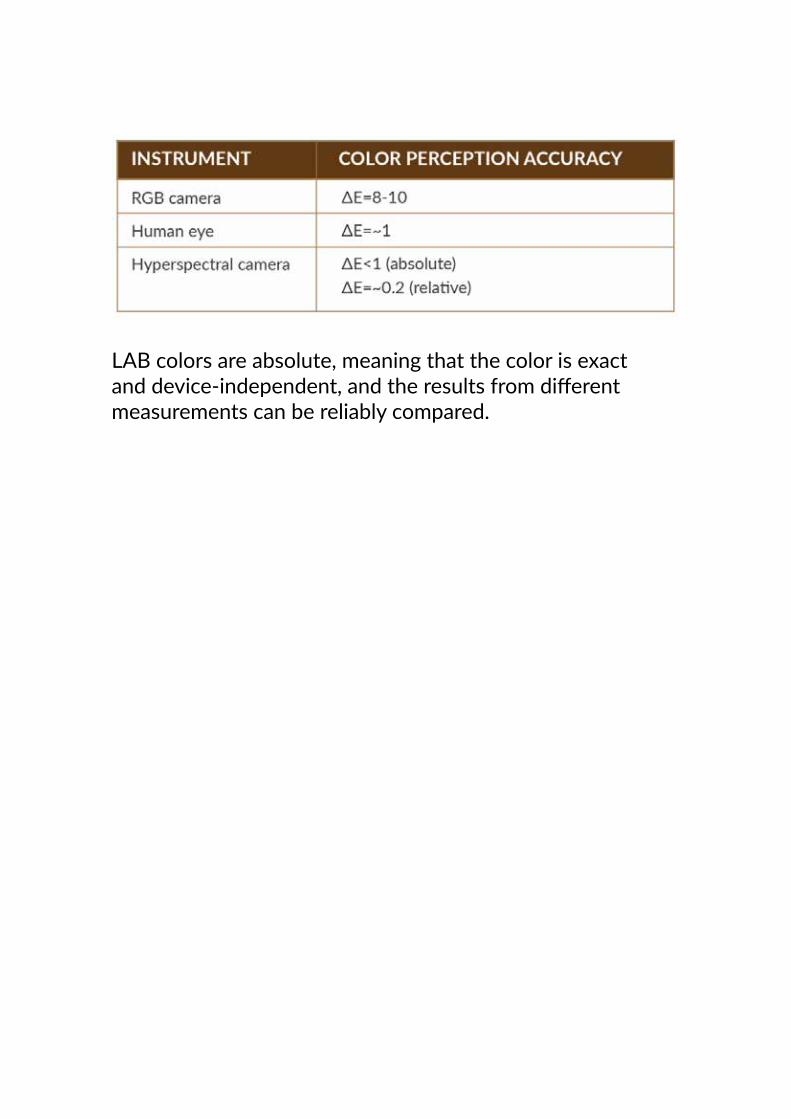
As mentioned in the introduction, RGB cameras don’t even come close to the human eye when it comes to the accuracy of color perception. To indicate the color perception accu-racy, we use the value ∆E. It is used to describe the differ-ence between two points in the LAB color space. The lower the value, the more accurate the perception. Humans can achieve approximately ∆E=1, while RGB cameras can only reach ∆E=8-10 accuracy. Hyperspectral instruments attain ∆E<1 in absolute value, which means the color’s accurate location in LAB color space. Relative value, which describes the difference between two colors in LAB color space, can be measured as closely as ∆E=0.2.
L = lightness, from black to white
a = from cyan to magenta/red
b = from blue to yellow
LAB colors are absolute, meaning that the color is exact and device-independent, and the results from different measurements can be reliably compared.
Specim FX10c Specim Labscanner 40x20 6 pcs halogen DECOSTAR 51 ALU 35W 12V 36deg GU5.3 lamps Data acquisition PC and Lumo Recorder SW
Test setup and measurements
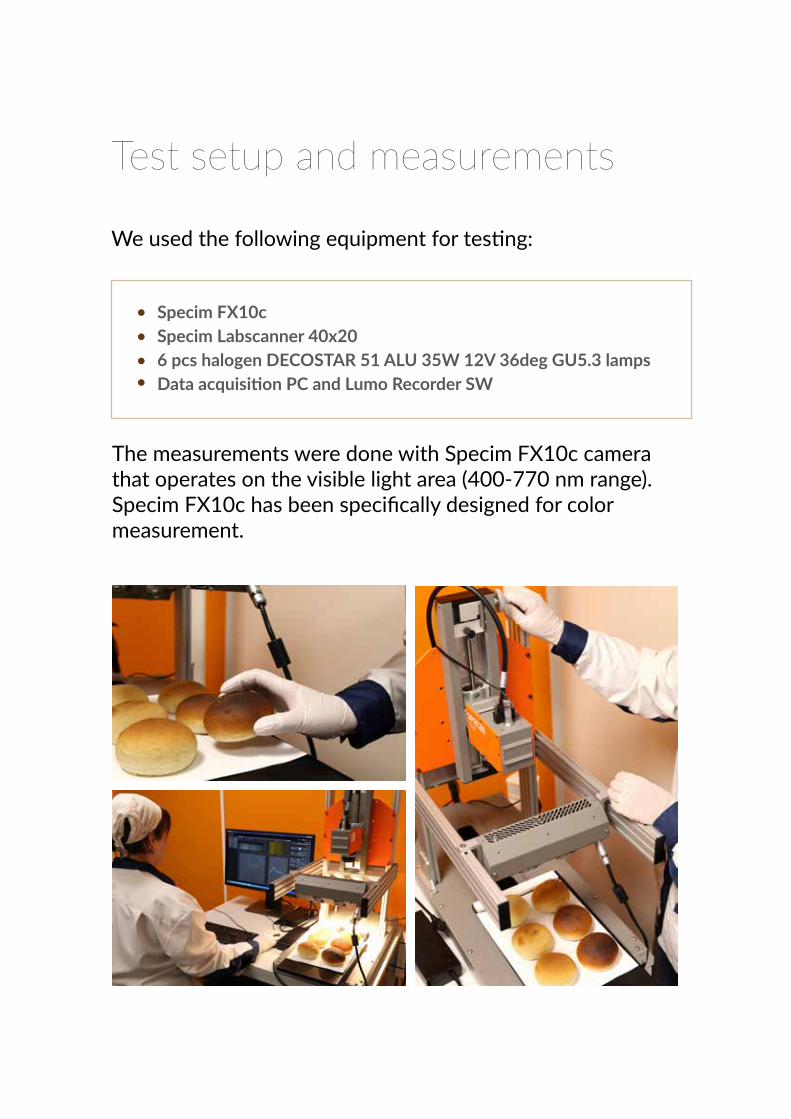
We used the following equipment for testing:
The measurements were done with Specim FX10c camera that operates on the visible light area (400-770 nm range). Specim FX10c has been specifically designed for color measurement.
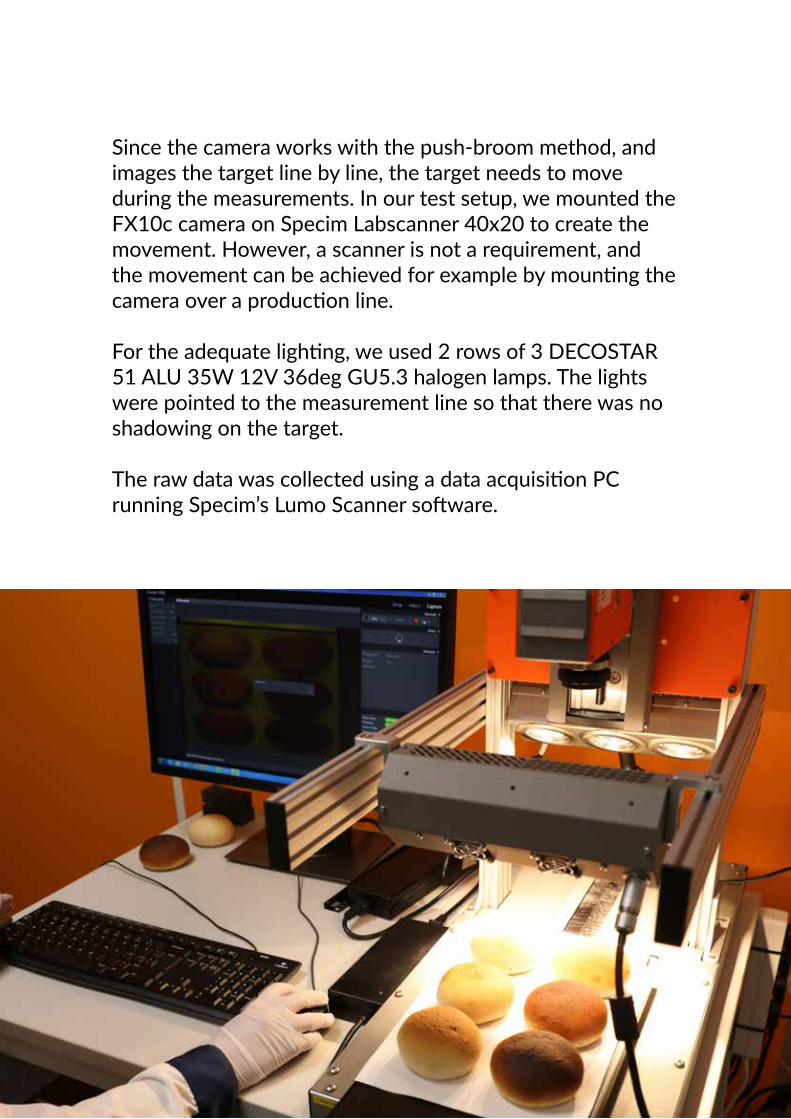
Since the camera works with the push-broom method, and images the target line by line, the target needs to move during the measurements. In our test setup, we mounted the FX10c camera on Specim Labscanner 40x20 to create the movement. However, a scanner is not a requirement, and the movement can be achieved for example by mounting the camera over a production line.
For the adequate lighting, we used 2 rows of 3 DECOSTAR 51 ALU 35W 12V 36deg GU5.3 halogen lamps. The lights were pointed to the measurement line so that there was no shadowing on the target.
The raw data was collected using a data acquisition PC running Specim’s Lumo Scanner software.
Analysis and results
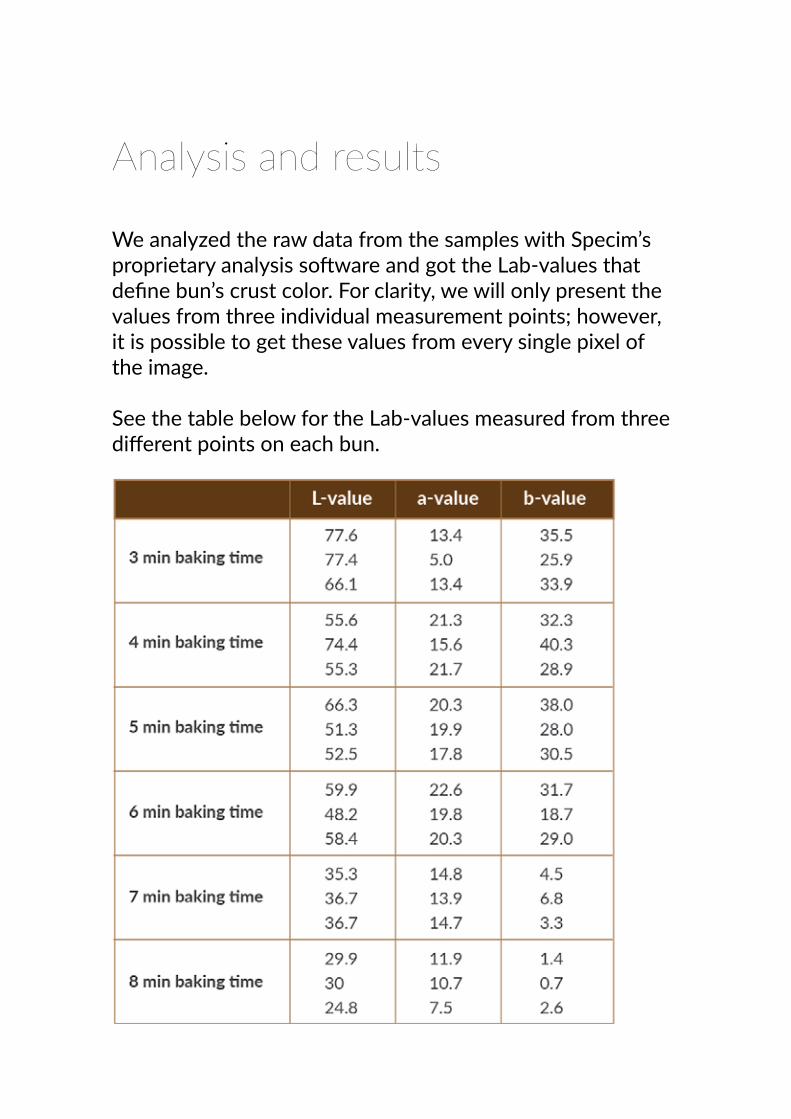
We analyzed the raw data from the samples with Specim’s proprietary analysis software and got the Lab-values that define bun’s crust color. For clarity, we will only present the values from three individual measurement points; however, it is possible to get these values from every single pixel of the image.
See the table below for the Lab-values measured from three different points on each bun.
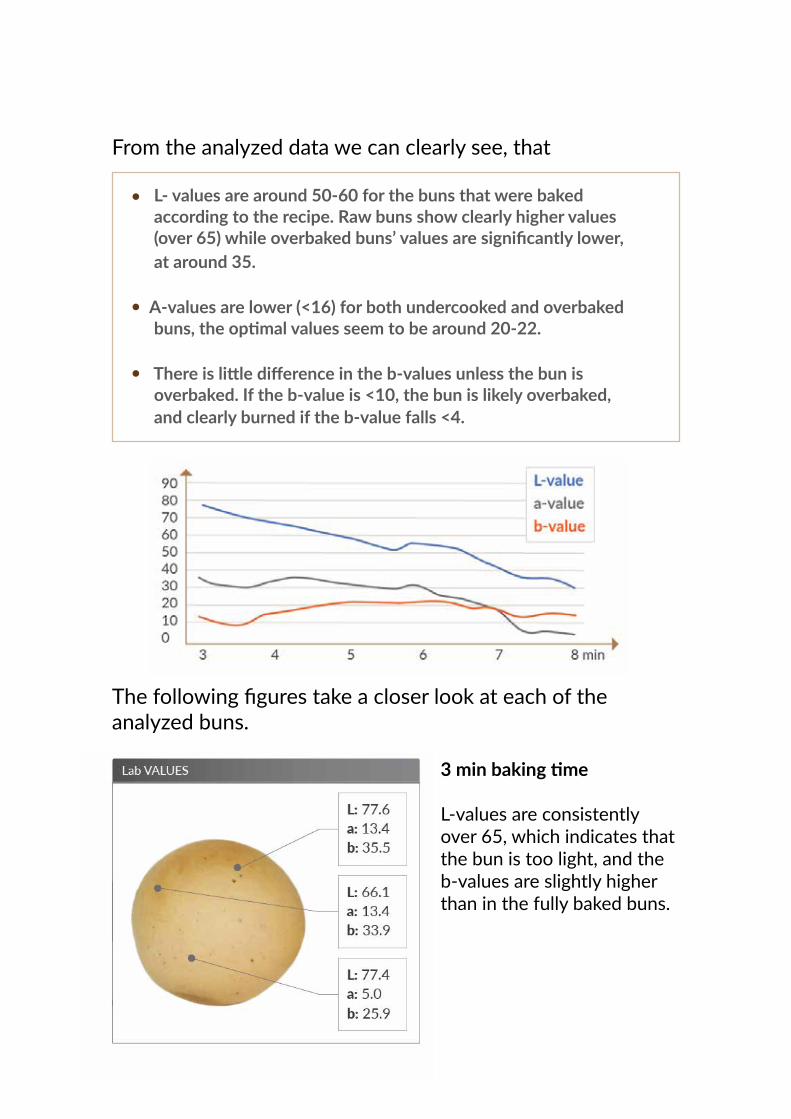
From the analyzed data we can clearly see, that
L- values are around 50-60 for the buns that were baked according to the recipe. Raw buns show clearly higher values (over 65) while overbaked buns’ values are significantly lower, at around 35.
A-values are lower (<16) for both undercooked and overbaked buns, the optimal values seem to be around 20-22.
There is little difference in the b-values unless the bun is overbaked. If the b-value is <10, the bun is likely overbaked, and clearly burned if the b-value falls <4.
3 min baking time
L-values are consistently over 65, which indicates that the bun is too light, and the b-values are slightly higher than in the fully baked buns.
The following figures take a closer look at each of the analyzed buns.
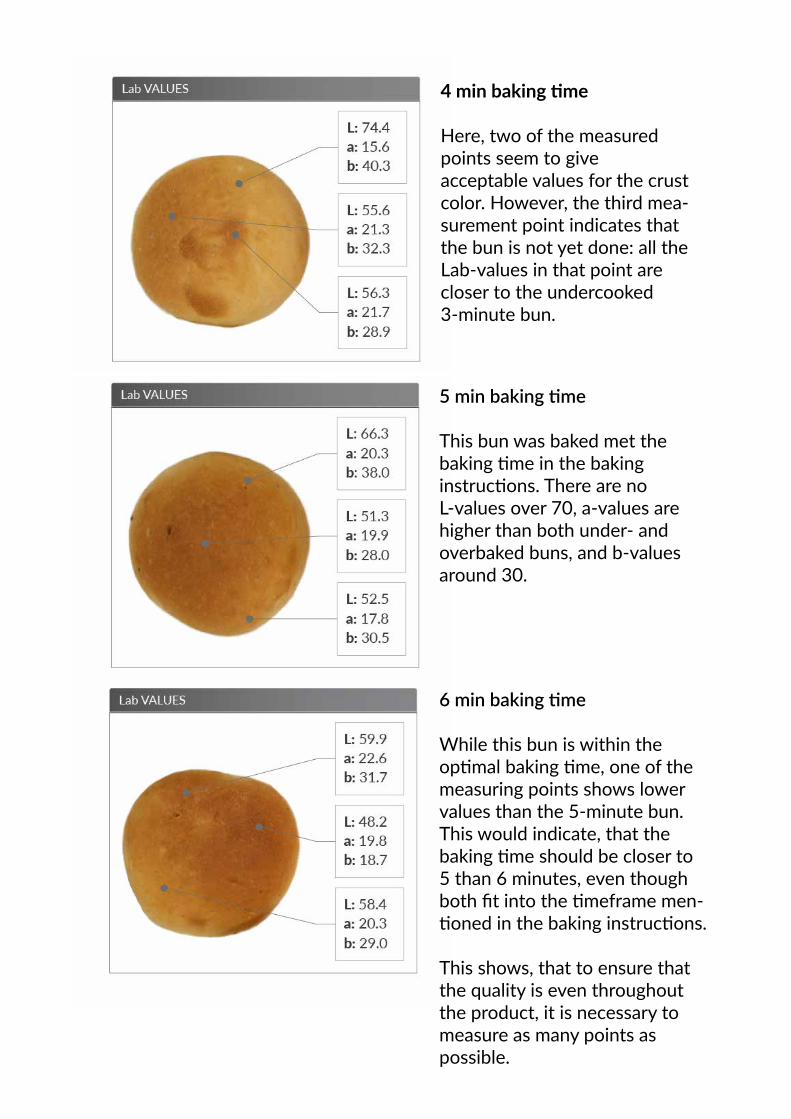
4 min baking time
Here, two of the measured points seem to give acceptable values for the crust color. However, the third mea-surement point indicates that the bun is not yet done: all the Lab-values in that point are closer to the undercooked 3-minute bun.
5 min baking time
This bun was baked met the baking time in the baking instructions. There are no L-values over 70, a-values are higher than both under- and overbaked buns, and b-values around 30.
6 min baking time
While this bun is within the optimal baking time, one of the measuring points shows lower values than the 5-minute bun. This would indicate, that the baking time should be closer to 5 than 6 minutes, even though both fit into the timeframe men-tioned in the baking instructions.
This shows, that to ensure that the quality is even throughout the product, it is necessary to measure as many points as possible.
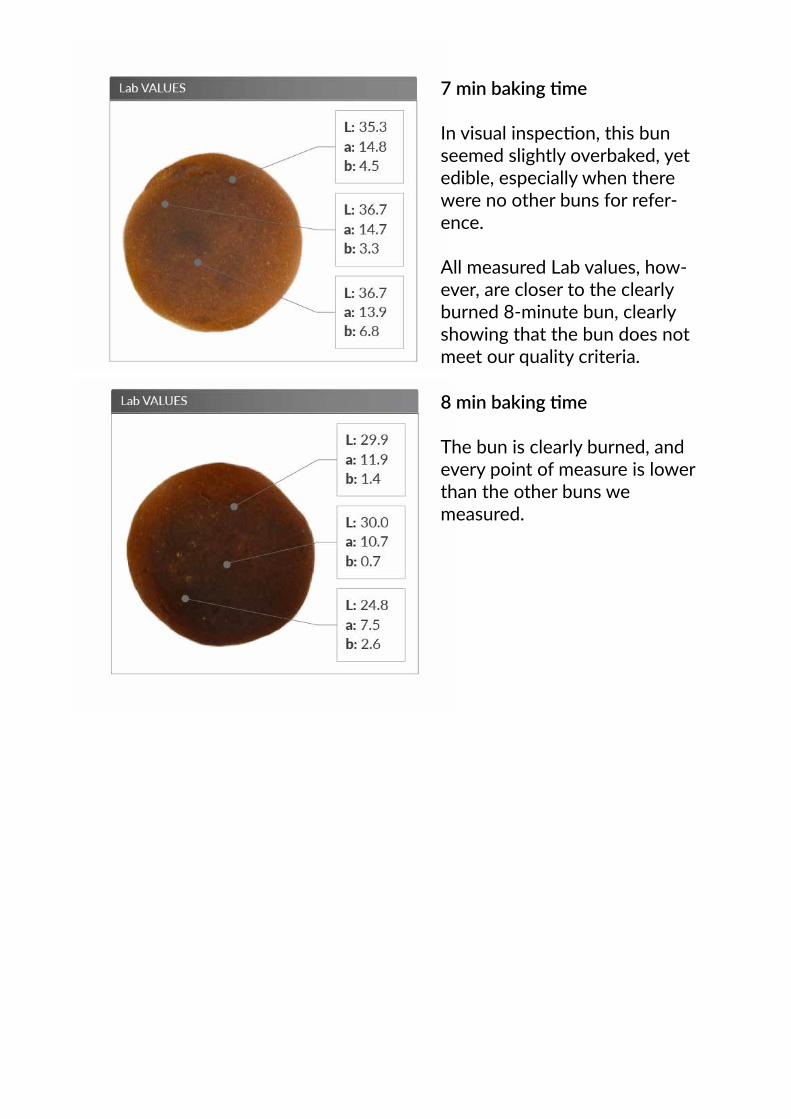
7 min baking time
In visual inspection, this bun seemed slightly overbaked, yet edible, especially when there were no other buns for refer-ence.
All measured Lab values, how-ever, are closer to the clearly burned 8-minute bun, clearly showing that the bun does not meet our quality criteria.
8 min baking time
The bun is clearly burned, and every point of measure is lower than the other buns we measured.
Conclusion
The hyperspectral camera is well suited for color measurements, since it is more accurate than RGB cameras and, unlike visual inspection, completely objective. It is pos-sible to define the target’s absolute color in Lab color space with the accuracy of ∆E<1 which is better than human color perception (∆E=1), or its relative color in relation to another target as accurately as ∆E=0.2.
In the baking industry, it is possible to determine the exact crust color and adjust the baking process to improve the product quality. This will lead to a reduced amount of waste and, as a result, reduced cost. Push-broom technology makes it possible to measure every point of the target, which ensures that the product is not unevenly baked. What is more, the single line of measurement used with the push-broom method requires that only the measurement line needs to be illuminated, which reduces the amount of lighting needed.
To test the suitability of hyperspectral imaging in the baking industry, we measured buns with different baking times and crust color. Even with the small test batch, it was easy to see how baking time affected the color values. The L-values, which measure the lightness/darkness, diminished as the baking times increased. The overcooked buns also had clearly lower b-values than others. From these results, it would be quite simple to determine acceptance limits for baked goods that would help not only to sort the products based on quality but also to adjust the baking process to achieve the best results.

Hyperspectral imaging possibilities are not limited to color measurements: with this technology, it is possible to identify foreign object contamination, the amount of sugar or mois-ture, or to check that the filling is evenly spread, and so on. The measurements are fast and reliable, and they can significantly improve food quality and safety.
Specim Spectral Imaging Ltd. – Light is our passion. With more than 4 000 instruments and spectrographs delivered and in daily use, Specim, Spectral Imaging Ltd. is the world leading manufacturer of hyperspectral imaging instruments and systems. Specim’s success is driven by our passion for light. Today that passion has resulted in a range of products from the most advanced remote sensing applications to industrial OEM segment and easy-to-use handheld devices.
For more information visit www.specim.fi