Meaningful & mutually beneficial trading relationship ... · 94 95 96 97 98 99 '00 '01 '02 '03 '04...
32
Is there a meaningful and mutually beneficial trading relationship between the USA and South Africa. Any opportunities for Agribusiness? John Purchase South Africa Protein Seminar 3 March 2011
Transcript of Meaningful & mutually beneficial trading relationship ... · 94 95 96 97 98 99 '00 '01 '02 '03 '04...

Is there a meaningful and mutually beneficial trading relationship
between the USA and South Africa. Any opportunities for Agribusiness?
John Purchase
South Africa Protein Seminar
3 March 2011
Content
• Background
• South Africa’s agriculture
• South Africa’s agricultural trade
• SA/US Agricultural trade
• Opportunities for agribusiness?
• Conclusion
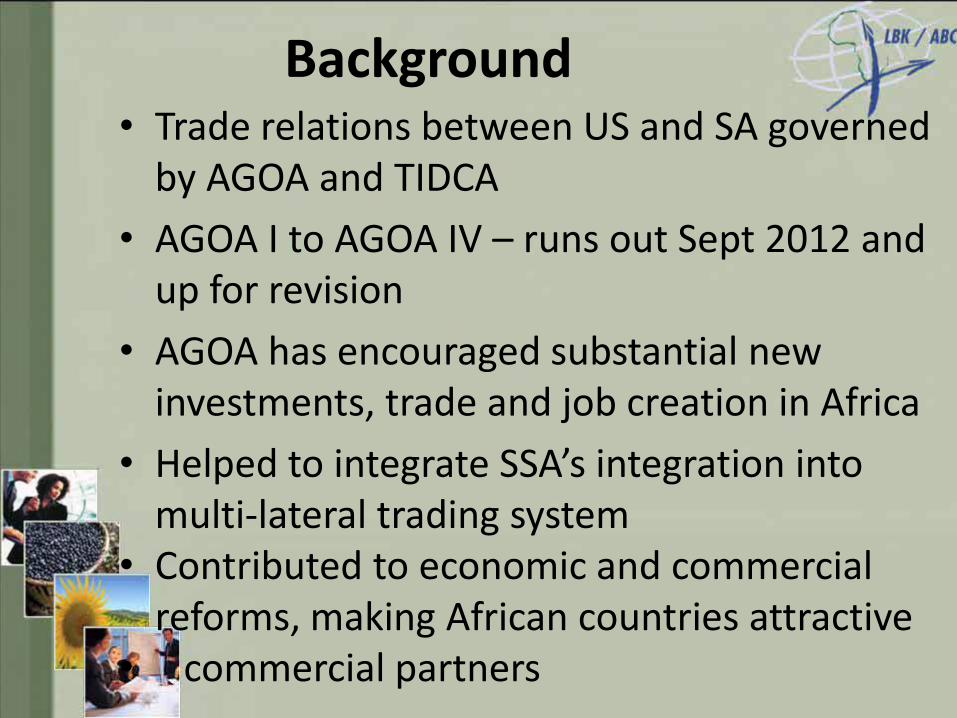
Background • Trade relations between US and SA governed
by AGOA and TIDCA
• AGOA I to AGOA IV – runs out Sept 2012 and up for revision
• AGOA has encouraged substantial new investments, trade and job creation in Africa
• Helped to integrate SSA’s integration into multi-lateral trading system
• Contributed to economic and commercial reforms, making African countries attractive
• commercial partners

Background AGOA Implementation:• Determination of country eligibility• Determination of products eligible for zero
tariff under expansion of GSP• Determinations of compliance with the
conditions of apparel benefits• Establishment of US-SSA Trade & Economic
Forum• Provisions for technical assistance to help
countries qualify for benefits

Background
• US-SACU TIDCA signing in Washington in July 2008
• Promotes an attractive investment climate expands and diversifies trade between SACU (incl. SA) and US
• Consultative Group to ensure fulfilment of above objectives
• Consultation and Cooperation provisions

Content
• Background
• South Africa’s agriculture
• South Africa’s agricultural trade
• SA/US Agricultural trade
• Opportunities for agribusiness?
• Conclusion

Role of Agriculture in
SA Economy• Strategic sector – provides food, fiber, wine & beer,
satisfying two basic needs of man (+ others!)
• Has provided national food security since the start
of the 20th century (Pop: ~4,0 million), right
through to the 21st century (Pop: ~49,0 million,
~60% in urban areas)

Contribution of Primary Agriculture to GDP (Source: Statssa)
2
3
4
5
94 95 96 97 98 99 '00 '01 '02 '03 '04 '05 06 07 08 09
%

SA economic growth: Tradable goods sectors lag the non-tradable goods sectors
Source: StatsSA
0
50
100
150
200
250
2000 2001 2002 2003 2004 2005 2006 2007 2008 2009
IND
EX
GDP Index per Sector of Economy
GDP
Agric
Mining
Manufacturing
Construction
Trade
Transport
Finance

Inflation
Source: AMT, 2010

Commercial Agric Census 2007
Indicator 1993 2002 2007
Farming units 57 980 45 818 39 982
Gross Farm income (R x1 000 000) 19 620 53 329 79 544
Employees Remuneration (R X1 000 000) 3 637 6 216 8 611
Paid employees 1 093 265 940 820 796 806
Expenditure (R X1 000 000) (Current & Cap) 16 377 45 038 54 072
Market value of assets (R X1 000 000) 66 905 98 428 178 647
Farming debt (R X1 000 000) 15 295 30 857 37 090
Ratio between Farming Debt and GFI (%) 78,0 57,9 46,6
Source: StatsSA

OIL SEED & GRAIN CROP PRODUCTION IN THE RSA (TON)(2006/2007-2010/2011 MARKETING SEASONS)
CROP 2006/2007 2007/2008 2008/2009 2009/2010 2010/2011
White maize 4,187,400 4,315,000 7,480,000 6,775,000 7,822,400
Yellow maize 2,430,600 2,810,000 5,220,000 5,275,000 5,220,600
Sorghum 96,000 176,000 255,000 276,500 220,093
Groundnuts 74,000 58,000 88,800 99,500 87,880
Sunflower 520,000 300,000 872,000 801,000 516,265
Soybeans 424,000 205,000 282,000 516,000 560,950
Cotton seed 25,962 19,525 17,378 15,658 14,576
Wheat 2,105,000 1,905,000 2,130,000 1,958,000 1,570,980
Canola 36,500 38,150 30,800 40,350 39,650
Source: NCEC, PRF
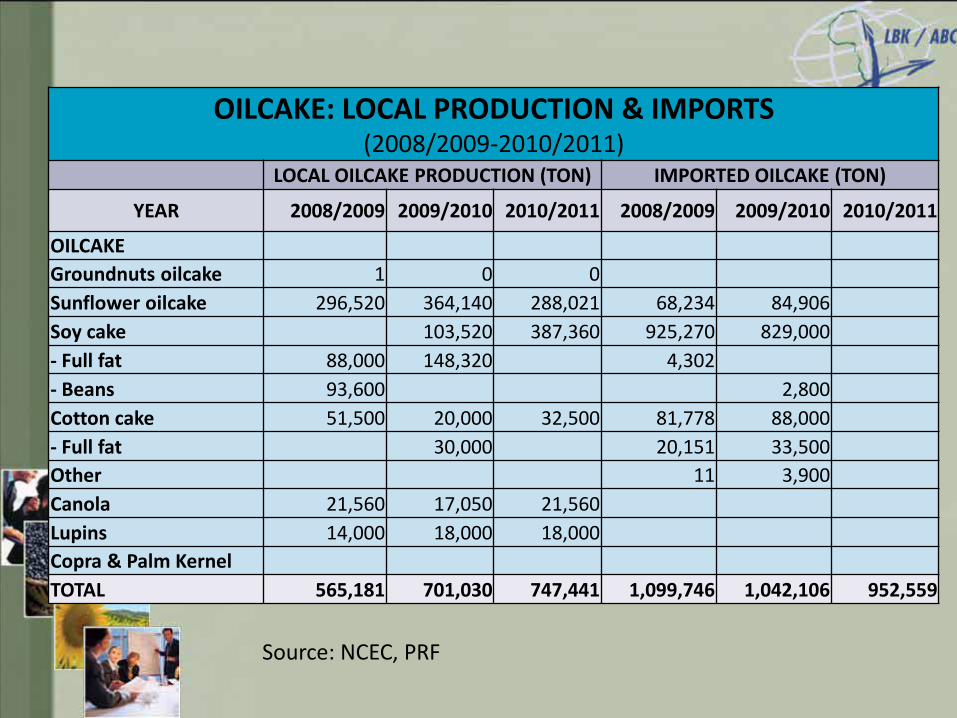
OILCAKE: LOCAL PRODUCTION & IMPORTS(2008/2009-2010/2011)
LOCAL OILCAKE PRODUCTION (TON) IMPORTED OILCAKE (TON)
YEAR 2008/2009 2009/2010 2010/2011 2008/2009 2009/2010 2010/2011
OILCAKE
Groundnuts oilcake 1 0 0
Sunflower oilcake 296,520 364,140 288,021 68,234 84,906
Soy cake 103,520 387,360 925,270 829,000
- Full fat 88,000 148,320 4,302
- Beans 93,600 2,800
Cotton cake 51,500 20,000 32,500 81,778 88,000
- Full fat 30,000 20,151 33,500
Other 11 3,900
Canola 21,560 17,050 21,560
Lupins 14,000 18,000 18,000
Copra & Palm Kernel
TOTAL 565,181 701,030 747,441 1,099,746 1,042,106 952,559
Source: NCEC, PRF
2150
2650
3150
3650
4150
4650
5150
5650
6150
6650
2-J
an
-08
1-F
eb
-08
2-M
ar-
08
1-A
pr-
08
1-M
ay-0
8
31
-Ma
y-0
8
30
-Ju
n-0
8
30
-Ju
l-0
8
29
-Au
g-0
8
28
-Se
p-0
8
28
-Oct-
08
27
-Nov-0
8
27
-Dec-0
8
26
-Ja
n-0
9
25
-Fe
b-0
9
27
-Ma
r-0
9
26
-Ap
r-0
9
26
-Ma
y-0
9
25
-Ju
n-0
9
25
-Ju
l-0
9
24
-Au
g-0
9
23
-Se
p-0
9
23
-Oct-
09
22
-Nov-0
9
22
-Dec-0
9
21
-Ja
n-1
0
20
-Fe
b-1
0
22
-Ma
r-1
0
21
-Ap
r-1
0
21
-Ma
y-1
0
20
-Ju
n-1
0
20
-Ju
l-1
0
19
-Au
g-1
0
18
-Se
p-1
0
18
-Oct-
10
17
-Nov-1
0
17
-Dec-1
0
16
-Ja
n-1
1
15
-Fe
b-1
1
Ran
d/t
on
Date
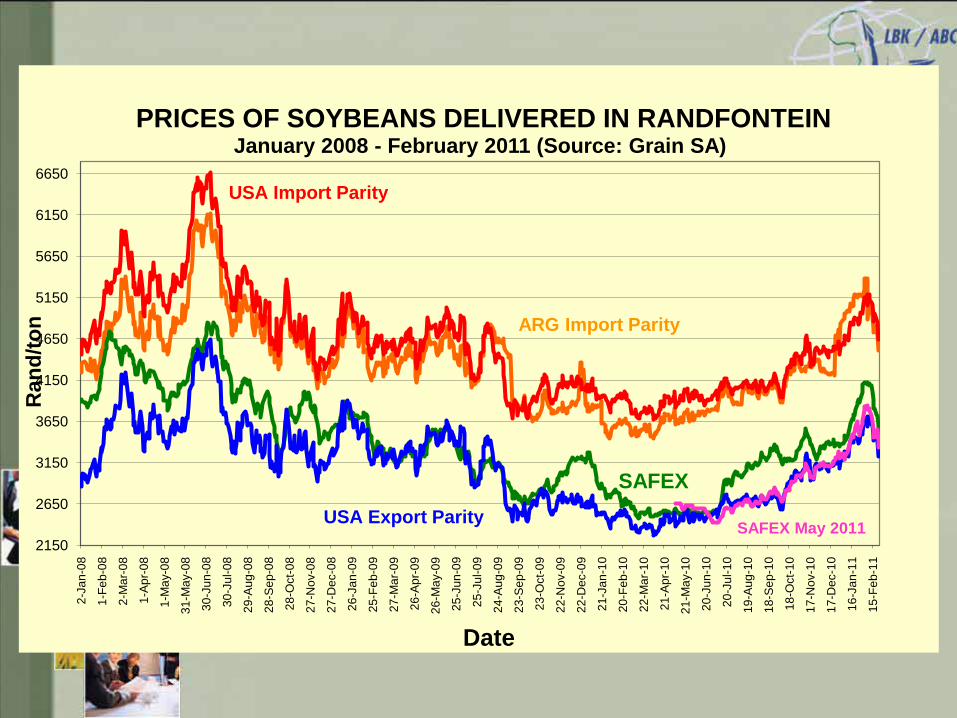
PRICES OF SOYBEANS DELIVERED IN RANDFONTEINJanuary 2008 - February 2011 (Source: Grain SA)
ARG Import Parity
USA Import Parity
SAFEX
USA Export ParitySAFEX May 2011

Content
• Background
• South Africa’s agriculture
• South Africa’s agricultural trade
• SA/US Agricultural trade
• Opportunities for agribusiness?
• Conclusion

Agricultural trade trends
16
Source: DAFF/NAMC, 2009.
Total
-
5
10
15
20
25
2004 2005 2006 2007 2008
R b
illi
on
Year
Primary exports Primary imports Primary trade balance
Primary
-10
-5
-
5
10
15
20
25
30
35
2004 2005 2006 2007 2008
R b
illi
on
Year
Processed exports Processed imports Processed trade balance
Processed
Agricultural trade
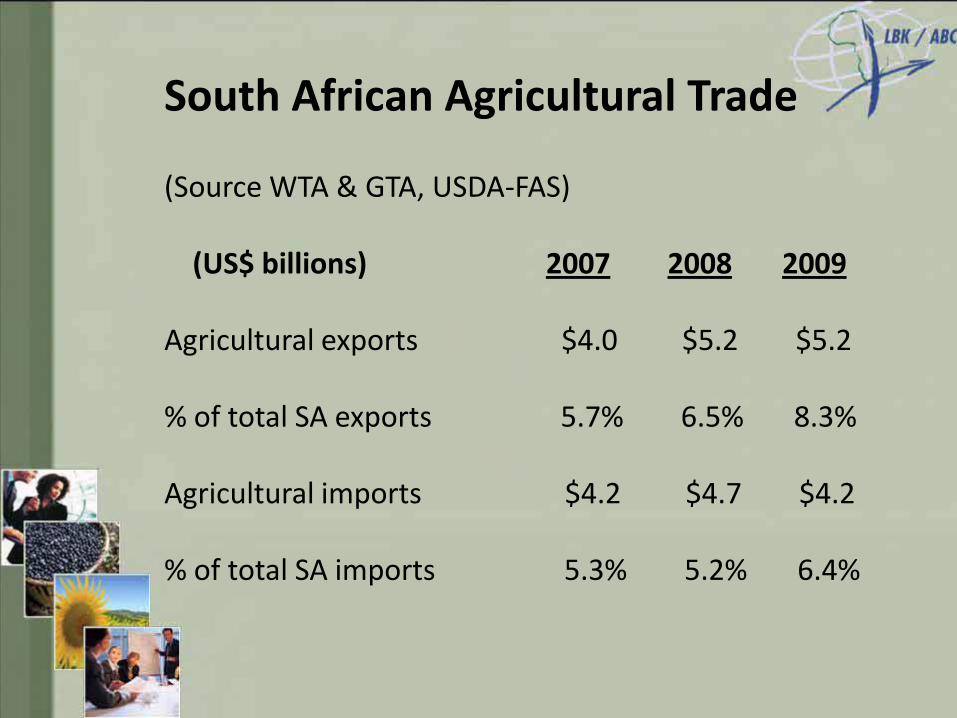
South African Agricultural Trade
(Source WTA & GTA, USDA-FAS)
(US$ billions) 2007 2008 2009
Agricultural exports $4.0 $5.2 $5.2
% of total SA exports 5.7% 6.5% 8.3%
Agricultural imports $4.2 $4.7 $4.2
% of total SA imports 5.3% 5.2% 6.4%

Major agricultural products exported:
(US$ millions) 2007 2008 2009
Wine $673.6 $753.9 $727.5
Citrus $613.1 $711.4 $667.1
Corn $32.1 $510.3 $444.6
Table grapes $364.5 $387.6 $379.7
Apples $329.5 $367.3 $364.7
Sugar $276.1 $217.9 $386.7

Major export destinations (2009)
United
Kingdom
Netherlands
Zimbabwe
Kenya
Mozambique
Germany
United States
China
0.0% 2.0% 4.0% 6.0% 8.0% 10.0% 12.0%
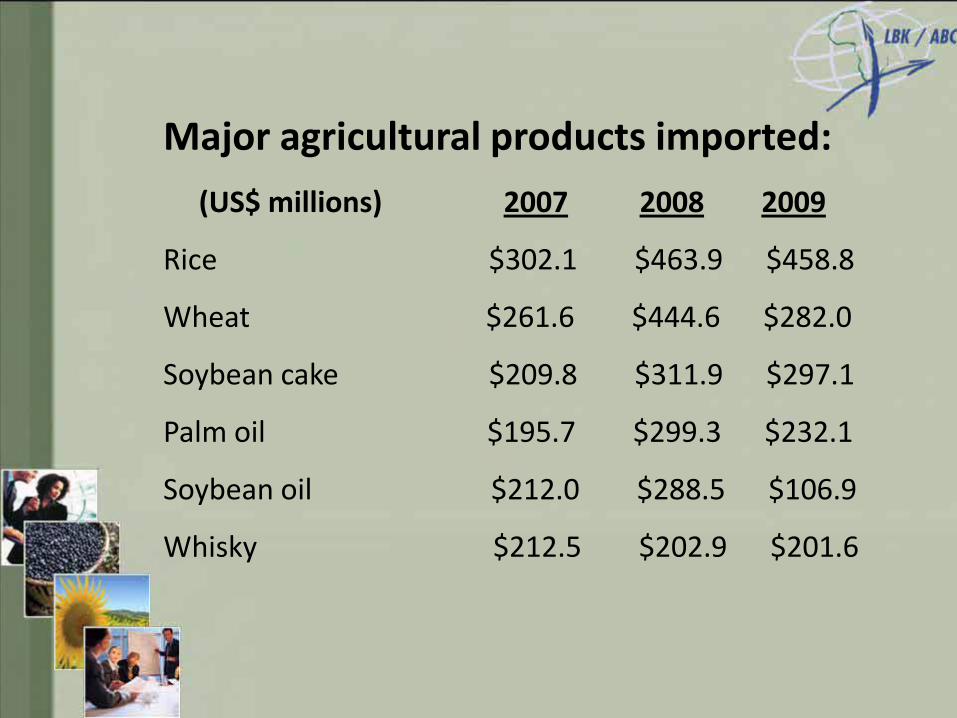
Major agricultural products imported:
(US$ millions) 2007 2008 2009
Rice $302.1 $463.9 $458.8
Wheat $261.6 $444.6 $282.0
Soybean cake $209.8 $311.9 $297.1
Palm oil $195.7 $299.3 $232.1
Soybean oil $212.0 $288.5 $106.9
Whisky $212.5 $202.9 $201.6

Major countries imported from (2009)
Argentina
Brazil
Thailand
Germany
Malaysia
China
Netherlands
Indonesia
United States
0% 2% 4% 6% 8% 10% 12% 14% 16%

Content
• Background
• South Africa’s agriculture
• South Africa’s agricultural trade
• SA/US Agricultural trade
• Opportunities for agribusiness?
• Conclusion

US – SA Agricultural trade
(US$ millions) 2007 2008 2009 2010
SA ag-exports to US $174.8 $174.6 $173.5 $223.6
% of total exports to US 2.1% 1.9% 3.2% N/A
SA ag-imports from US $290.6 $393.2 $161.7 $291.9
% of total imports from US 4.8% 4.3% 3.1% N/A

Major agricultural products exported
to the US:
(US$ millions) 2007 2008 2009 2010
Wine & Beer $41.7 $44.5 $39.9 $45.1
Fresh fruit $46.7 $41.8 $40.3 $50.5
Sugar $10.2 $0.0 $21.1 $25.1
Tree nuts $11.1 $14.2 $15.9 $28.5
Fruit juice $10.8 $14.7 $11.9 $15.8
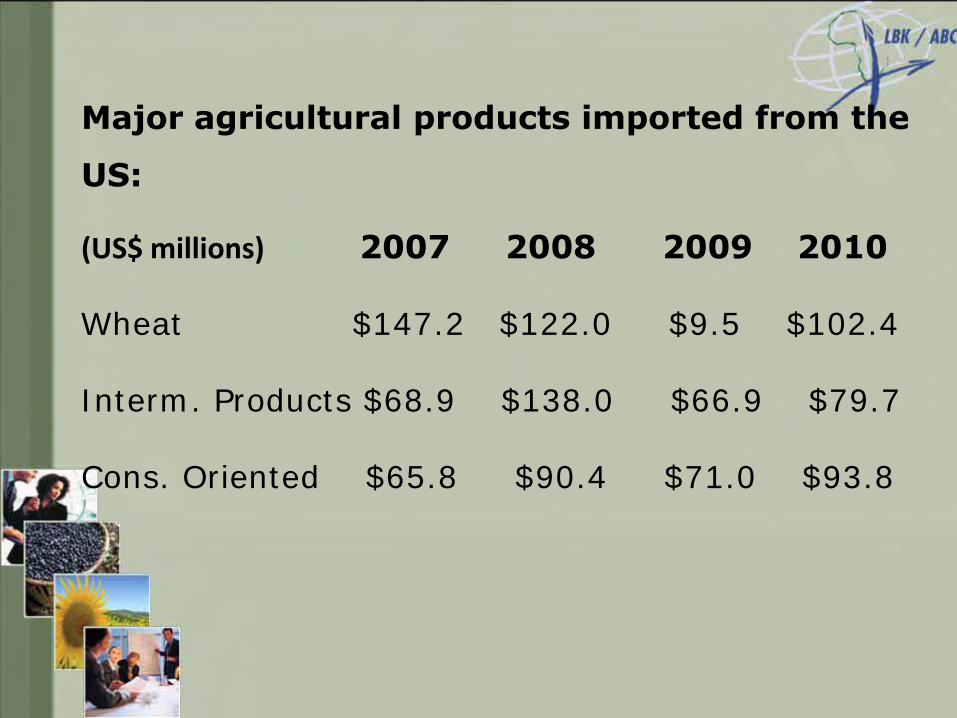
Major agricultural products imported from the
US:
(US$ millions) 2007 2008 2009 2010
Wheat $147.2 $122.0 $9.5 $102.4
Interm. Products $68.9 $138.0 $66.9 $79.7
Cons. Oriented $65.8 $90.4 $71.0 $93.8
Content
• Background
• South Africa’s agriculture
• South Africa’s agricultural trade
• SA/US Agricultural trade
• Opportunities for agribusiness?
• Conclusion

SAARF LSM Segments: Proportion of SA adult population and average monthly household
income in 2009
Source: SAARF (2010a) & BFAP, 2010
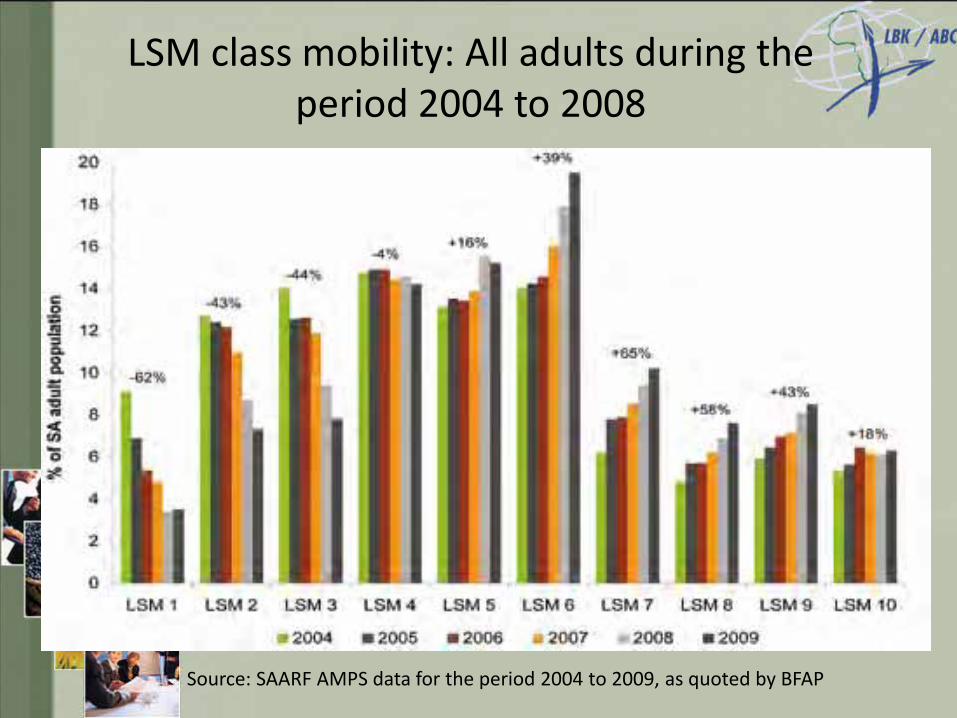
LSM class mobility: All adults during the period 2004 to 2008
Source: SAARF AMPS data for the period 2004 to 2009, as quoted by BFAP

Opportunities for agribusiness?
• SA population: ~49.8 million, and growing.
• Growing SA middle class – market expansion
• Consumer behaviour patterns changing
• Value added and processed products, e.g. dairy & processed veg & fruit
• Niche markets developing faster, e.g. Organics, etc.
• Wheat

Content
• Background
• South Africa’s agriculture
• South Africa’s agricultural trade
• SA/US Agricultural trade
• Opportunities for agribusiness?
• Conclusion

Conclusion
• Is there a meaningful and mutually beneficial trading relationship between the USA and South Africa?
Yes, most certainly, and growing.
• Any opportunities for Agribusiness?Yes, but need to look for specific opportunities and do good market research.

Thank you
www.agbiz.co.za