McDonald’s Case B1: THE CLAMSHELL CONTROVERSYpdf.wri.org/bcs_mcdonalds_caseb1.pdf · McDonald’s...
14
World Resources Institute ble Enterprise Program Sustaina A program of the World Resources Institute For more than a decade, WRI's Sustainable Enterprise Program (SEP) has harnessed the power of business to create profitable solutions to environment and development challenges. BELL, a project of SEP, helps universities, graduate schools and corporations integrate environmental issues into their educational programs, and provides new thinking about the relationship between business and the environment. To order this case visit www.wristore.com or call 1.800.537.5487. Please contact [email protected] to obtain reprinting permission. This case is printed on 100% unbleached, recycled paper. McDonald’s Case B1: THE CLAMSHELL CONTROVERSY Introduction The Joint Task Force of McDonald’s Corporation and the Environmental Defense Fund (EDF) was in its third month of collaboration when a decision needed to be made about the expansion of McDonald’s polystyrene recycling program. The task force, formed through a mutual agreement between the parties, had been charged with finding ways to reduce McDonald’s solid waste through source reduction, reuse, recycling, and composting. However, one aspect of McDonald’s operations seemed to attract the public’s attention - the polystyrene “clamshell” sandwich containers. Although these packages represented only a minute fraction of total municipal solid waste, to the public they symbolized the “throw-away” society. Debate over McDonald’s packaging materials started in the 1970s when the public became concerned that too many trees were being cut down to make packaging. In response to this interest, Ray Kroc, McDonald’s founder, commissioned the Stanford Research Institute (SRI) to conduct an environmental impact study comparing the paperboard packaging McDonald’s was then using to polystyrene packaging. By analyzing all aspects of the two alternatives from manufacturing though disposal, SRI concluded that plastic was preferred. They reasoned that the coating on the paperboard made it nearly impossible to recycle, while polystyrene was recyclable and used less energy in production. This case was written by Susan Svoboda of the University of Michigan‘s Corporate Environmental Management Program (CEMP), under the supervision of Stuart Hart, director of CEMP and assistant professor of Corporate Strategy and Organizational Behavior at the U-M School of Business Administration, as the basis for class discussion rather than to illustrate either effective or ineffective handling of an administrative situation. Distributed with permission from the National Pollution Prevention Center for Higher Education
-
Upload
hoangthien -
Category
Documents
-
view
226 -
download
5
Transcript of McDonald’s Case B1: THE CLAMSHELL CONTROVERSYpdf.wri.org/bcs_mcdonalds_caseb1.pdf · McDonald’s...

World Resources Institute
ble Enterprise Program Sustaina A program of the World Resources Institute
For more than a decade, WRI's Sustainable Enterprise Program (SEP) has harnessed the power of business to create profitable solutions to environment and development challenges. BELL, a project of SEP, helps universities, graduate schools and corporations integrate environmental issues into their educational programs, and provides new thinking about the relationship between business and the environment. To order this case visitwww.wristore.com or call1.800.537.5487. Pleasecontact [email protected] to obtain reprinting permission. This case is printed on 100% unbleached, recycled paper.
McDonald’s Case B1: THE CLAMSHELL CONTROVERSY Introduction The Joint Task Force of McDonald’s Corporation and the Environmental Defense Fund (EDF) was in its third month of collaboration when a decision needed to be made about the expansion of McDonald’s polystyrene recycling program. The task force, formed through a mutual agreement between the parties, had been charged with finding ways to reduce McDonald’s solid waste through source reduction, reuse, recycling, and composting. However, one aspect of McDonald’s operations seemed to attract the public’s attention - the polystyrene “clamshell” sandwich containers. Although these packages represented only a minute fraction of total municipal solid waste, to the public they symbolized the “throw-away” society. Debate over McDonald’s packaging materials started in the 1970s when the public became concerned that too many trees were being cut down to make packaging. In response to this interest, Ray Kroc, McDonald’s founder, commissioned the Stanford Research Institute (SRI) to conduct an environmental impact study comparing the paperboard packaging McDonald’s was then using to polystyrene packaging. By analyzing all aspects of the two alternatives from manufacturing though disposal, SRI concluded that plastic was preferred. They reasoned that the coating on the paperboard made it nearly impossible to recycle, while polystyrene was recyclable and used less energy in production.
This case was written by Susan Svoboda of the University of Michigan‘s Corporate Environmental Management Program (CEMP), under the supervision of Stuart Hart, director of CEMP and assistant professor of Corporate Strategy and Organizational Behavior at the U-M School of Business Administration, as the basis for class discussion rather than to illustrate either effective or ineffective handling of an administrative situation. Distributed with permission from the National Pollution Prevention Center for Higher Education

As a result, McDonald’s switched to polystyrene for their cups and sandwich containers, and launched an environmental education program to communicate to the public their rationale for the switch from paperboard to plastic. In 1989, McDonald’s piloted a recycling program in 450 of their New England restaurants by asking in-store customers to sort their trash into designated trash bins. The polystyrene was then shipped to one to eight plastic recycling plants formed in a joint venture of eight plastics companies. The program gained enough success that soon it was expanded to California and Oregon at the request of state officials, and involved a total of 1,000 stores. McDonald’s began planning a national expansion of the program. However, EDF Director Fred Krupp told Ed Rensi, Chief Operating Officer and President of McDonald’s USA, that he would publicly refuse to endorse the recycling program, because he did not regard it as the best environmental solution. Packaging in the Waste Stream Packaging is essential to a product’s performance. It protects the product throughout production, distribution and storage, provides consumers with product and usage information, and differentiates the product. Food manufacturers and distributors also expect packaging to extend the product’s shelf life and to preserve the appearance, freshness, flavor, and moisture content of food. Effective packaging reduces food spoilage-rates and diverts more than its own weight from disposal. The composition of solid waste has changed significantly over the past three decades. Paper and plastics have grown to a combined total of 50 percent, while metal, food and yard waste, and glass have decreased. See Exhibit 1 for a breakdown of municipal solid waste (MSW). Further, the total weight of packaging in MSW doubled between 1960 and 1990. However, as shown in Exhibit 2, the EPA estimates source reduction efforts will reduce the packaging content of MSW to 30 percent by the year 2000 (from a high of 36 percent in 1970). The growing trends of single-parent families and dual-career couples have popularized single-use and microwave containers for which no recycling infrastructure currently exists. These packages offer convenience but often replace more durable or reusable options. If the present rate of growth continues, the proportion of plastics in packaging is expected to be 15 percent by the year 2000 (see Exhibit 3). Both manufacturers and consumers value the flexible, durable, and insulating properties of plastics. However, plastics have become a topic of debate as citizens try to reconcile the desire for convenience with “greening” attitudes. Recent Greenwatch studies by J. Walter Thompson indicate that 78 percent of those surveyed say that they are willing to pay extra for products with recyclable or biodegradable components, and 77 percent report that their purchase decisions are influenced by a company’s reputation on environmental issues. Although actual consumer behavior may not necessarily match intended behavior, this growing sentiment is prompting manufacturers to search for new technologies to make their packages thinner or lighter in order to “green” their packaging. In addition, many companies are looking to find ways to overcome the diminished performance characteristics of recycled materials so that they can replace virgin materials with recycled ones. Clamshells, Paperboard, and Quilt-wrap McDonald’s selects packaging based on long-standing criteria derived from its founding principles of Quality, Service, Cleanliness, and Value (Q.S.C. &V.) considering: packaging availability, its ability to keep food insulated and control its moisture level, its ease of handling, its customer appeal, and its cost. McDonald’s packaging philosophy is to “evolve as new applications and materials that meet our customer’s needs become available. If there is a better package… we’ll use it!” Perseco, an independent and privately owned company that purchases from over 100 suppliers, handles the procurement of all McDonald’s paper and plastic food-service packaging, including direct food packaging as well as utensils, cups, bags, and napkins. McDonald’s packaging must provide customers with a convenient way to take food out while keeping it fresh, hot, and moist, since a typical McDonald’s restaurant serves 2,000 people per day,
2

60-70 percent of whom take their food outside the restaurant. As the task force began reviewing sandwich packaging options, they basically had two alternatives: paper-board containers costing approximately 2.5-3 cents per sandwich and polystyrene clamshells at approximately 2-2.5 cents per sandwich.1 To help the joint task force understand how packaging was used in McDonald’s operations, Perseco was requested to perform an audit of all packaging - primary, secondary, and tertiary - used in a restaurant. Secondary packaging, used to contain and ship supplies, includes corrugated cardboard, inner wraps, packs, and dividers. Tertiary packaging includes customer-related packaging such as utensils, napkins, carry-out bags, etc. The results, shown in Exhibit 4, indicated that paper products constitute 81 percent of McDonald’s primary packaging. As the task force members contemplated the complexity of the environmental issues before them, they knew that they must develop a comprehensive framework that would enable them to assess the advantages and disadvantages of various options. For example, some options aimed at improving one particular aspect of a package may have other detrimental environmental impacts. Foremost, the clamshell issue needed to be resolved. Although current public opinion opposed the clamshells, McDonald’s had selected polystyrene clamshells over 20 years before because they were shown to be more environmentally “friendly” than coated paperboard, which could not be recycled. In the meantime, McDonald’s had made a strong commitment to recycling polystyrene in both its relationship with the National Polystyrene Recycling Center and in its efforts to educate the public. Also, plain paper wraps had been eliminated as a viable alternative since they did not satisfactorily insulate the sandwiches. The task force decided to let the waste management hierarchy and the life cycle assessment methodology guide their analysis. Life cycle assessment gives consideration to all impacts that occur during each stage of the product’s or packaging material’s life cycle, from extraction of the raw materials through manufacturing, transportation, use, and disposal. In addition, the team found that time spent learning about McDonald’s operations, suppliers, and customers was invaluable to their decision-making when factoring in qualitative measures of public perception of the magnitude of an option’s impact on the environment; the health or safety risk to McDonald’s employees, customers, or the communities they serve; and how an option could be integrated into both pilot tests and full-scale operations. Finally, they considered the feasibility of the option being replicated in the many local conditions of the McDonald’s restaurants and supporting communities. Task Force Adopts Life Cycle Methodology Understanding the important linkages between different stages of a package’s or product’s “life” is a dynamic process where, for example, a change in an input to the manufacturing process would result in corresponding changes in disposal figures. The analysis is further complicated by the fact that many inputs or releases have not been measured and tracked over time, and some are not even quantifiable. The task force turned to Franklin Associates Ltd., specialists in life cycle analysis, for a complete review of the relative merit of packaging materials. See the Note on Life Cycle Analysis for background on this methodology. Franklin Associates Ltd. gathered data from a number of sources including: material manufacturers, product manufacturers, published literature, government sources, and Franklin’s existing materials and manufacturing database. Data from a 1990 Franklin Associates study, prepared for the Council of Solid Waste Solutions, that compared polystyrene clamshell to bleached paperboard containers at various recycling rates is shown in Appendix A. Also included as Appendix B is data from a second study that compares clamshells to a new “quilt-wrap” packaging developed by the James River Corporation. Quilt-wrap is a layered paper package that was introduced while the task force was in progress. The inner tissue-paper layer protects the sandwich from absorbing grease. The middle layer is a thin polyethylene film that acts as a barrier to moisture and insulates the food. The outer layer of plastic gives the paper strength. This wrap is not recyclable and is estimated to cost 1.5-2 cents per sandwich.2 1 “The Greening of the Golden Arches,” Rolling Stone, August 22, 1991, p. 36; personal communication with Jackie Prince, EDF, March 29, 1993. 2 Stillwell, J., Contz, C., Kopf, P., and Montrome, M., Packaging for the Environment, New York: American Management Association, 1991.
3

As both the public and government agencies have become more environmentally concerned over the past 20 years, several studies have been conducted to evaluate the impact of containers. However, confusion remains over how to measure and compare all the environmental risks associated with them. In many cases, impacts such as pollution emissions have not been measured, and in other cases the long-term risks have not been determined. Assumptions and limitations of the life cycle assessment methodology have spurred debate over the value of such assessments. Franklin Associates provides only life cycle inventories - listings of quantifiable environmental inputs and releases. Such inventories usually lead clients to develop improvement assessments - studies that use inventory results to pinpoint opportunities for improvement. Other groups such as Green Cross and Green Seal have used life cycle data to attempt to estimate a product’s environmental impact. However, consumer labeling efforts often attempt to make product comparisons of products for which comprehensive data have yet to be collected. Currently, no general formula is available to make this comparison, and comparison of entire categories such as plastics versus paper is virtually meaningless. The validity of environmental labeling without a scientific basis or widely accepted standard continues to be debated by environmental, business, and consumer groups. Life Cycle Inventory Data - The Clamshell Decision The life cycle inventories prepared by Franklin Associates to aid task force decision-making provided information on the systems that produce the products, in this case sandwich packaging. Here a system is defined as “the collection of operations that’ together perform some defined function.” Each individual stage or process can be viewed as a subsystem of the total system, as shown in Exhibit 5. The following is a description of the systems used to produce polystyrene clamshell containers and paper-based sandwich wraps. Variations in the production of either paperboard or quilt-wrap are noted. POLYSTYRENE PRODUCTION Polystyrene containers result from a multistage process with several production and manufacturing subsystems (see Exhibit 6). A description of the various processes follows.
Raw Materials Acquisition Crude Oil Production Oil is produced by drilling into porous rock formations several thousand feet under the earth’s surface that contain oil. Pumps are used to extract the oil and the accompanying “brine” water. The brine is separated from the oil at the surface. Approximately 90 percent of water with minimal oil residue is sent to separate wells that are specifically designed for its storage, and the remaining 10 percent is discharged into surface water. Hydrocarbons may also be emitted to the air in this process as many oil fields also contain natural gas. Crude oil passes through a distillation and desalting process in order to remove salt, sediment, and water. Natural Gas Production Although natural gas flows quite freely to the earth’s surface, it requires energy to pump it to the surface. Hydrocarbons are released during the process. Since approximately 25 percent of natural gas is produced in combination with oil, brine water is produced at the same time as natural gas. Hydrocarbons are also produced with natural gas and are released into the air during venting at the well-site. Transportation Oil and natural gas may be shipped in truck or railroad tanks, by ocean tanker, or by pipelines. Oil leaks and spills are potential risks. Transportation of highly explosive natural gas necessitates special equipment and safety precautions.
4
Material Manufacture Natural Gas Processing Processing plants use compression, refrigeration, and oil absorption to extract light hydrocarbons. When components of the gas are removed they are stored in controlled conditions until being transported away. The primary pollutants in this process are hydrocarbons. In some cases, natural gas must undergo a “sweetening” process in which sulfur dioxide is emitted. Ethylene Production Ethylene is produced by a process called thermal cracking - hydrocarbons and steam are fed into the cracking furnace, where they are heated, compressed, and distilled. Typical feedstocks used in U.S. in this process are approximately 75 percent ethane/propane and 25 percent naphtha. Benzene Production Benzene is naturally produced from crude oil as it is distilled in the refining process. It can also be produced using a reforming operation that uses decontaminated naphtha from ethylene production. Benzene has been found to cause blood disorders and leukemia in workers exposed to high concentrations for a long period of time. It is regulated by the Comprehensive Environmental Response, Compensation and Liability Act (CERCLA/Superfund), the Resource Conservation and Recovery Act (RCRA), and the Occupational Safety and Health Administration (OSHA). Styrene Production Styrene is produced by combining benzene and ethylene using a catalyst and then dehydrogenating the resulting ethylbenzene. Ethylbenzene is listed as a volatile contaminant by the Environmental Protection Agency (EPA) and is a standard priority pollutant for monitoring of water discharges. Styrene is a clear, colorless liquid which is flammable and toxic and requires special precautions. Exposure to high levels may result in irritation to eyes, skin, and the respiratory tract. The Health Hazard Assessment Group and the EPA’s Office of Drinking Water classifies styrene as a probable carcinogen; however, the Science Advisory Board refutes this claim. Styrene is regulated under Superfund and by OSHA and the Food and Drug Administration (FDA). Polystyrene Resin Styrene is converted to polystyrene by holding styrene in a chamber under controlled temperatures to remove solvents, unreacted materials, and other volatiles from the end product. It is then fed through a die where strands and pellets are formed. Blowing Agent Production Isopentane, n-pentane, isobutane, n-butane, CFCs, and HCFCs are all blowing agents for foam plastic. CFCs are commonly used in the production of polymer foams, but used only 2.3 percent of the time in the production of polystyrene. Of that 2.3 percent, most is used to produce insulation board. Common blowing agents for polystyrene include pentane and HCFCs. Pentane does not affect the ozone layer, but may contribute to low-level smog if not recovered. The EPA has endorsed HCFC-22 as an “excellent alternative” to CFCs as it reduces ozone depletion by 95 percent over CFCs. However, federal law requires a phase-out of all ozone-depleting chemicals, and by 1993 HCFC-22 will be prohibited by federal law from use in the production of foam packaging.3 Final Product Fabrication Crystal polymers are combined with blowing agents under pressure in an extruder. The pressure drops as they exit the extruder, which causes the polystyrene to bubble and foam. Sheets are produced and thermo-formed into desired shapes. Most of the solid waste generated during this stage is recycled. 3 Environmental Defense Fund and McDonald’s Corporation. “Waste Reduction Task Force Final Report,” Oak Brook, IL: McDonald’s, 1991. p. 22.
5
Packaging and Transportation Polystyrene products are typically wrapped in polyethylene sleeves and packaged in corrugated boxes and shipped by truck or rail. Disposal Landfilling Plastics are an inert material that add stability to a landfill, first by acting as a liner that reduces leaching of toxins in landfills and second by not producing methane gas. Landfill characteristics do not foster the biodegradability of plastics. Plastics may take as long as 20 years to break down and even then will only break into smaller pieces, retaining the same volume. However, pressure within a landfill is estimated at 50 pounds per square inch, enough to compress all the air out of plastics, thereby reducing their volume. Incineration Plastics burn easily because the fuel value remaining in the plastic is released during incineration. The heat generated from combustion of polystyrene is much higher than that released by average MSW, and over twice that of paperboard containers.4 Recycling After polystyrene is transported to the recycling facility, it is washed and food contaminants are removed as sludge. The polystyrene is ground, dried, re-extruded, and pelletized. Energy needed to melt plastics for recycling is 2-8 percent of tile energy needed to make virgin plastics.5 Recycling efforts are hampered by economic and operational factors. First, the sale of polystyrene waste to recyclers generates little revenue relative to hauling costs because recycled materials are generally purchased by weight and polystyrene is very light. Second, residual food contamination can hurt the quality of the recycled material making it potentially unsalable. Operationally, cleaning is labor-intensive and requires large amounts of water. Recycled plastics are usually weaker or less durable than non-recycled plastics of the same weight, so they are often combined with additives or formed in multiple layers to increase strength. Biodegradable plastics complicate recycling efforts. Manufacturers are working to improve the degradability of plastics intended for landfill. However, biodegradable plastics, if recycled, may deteriorate while still in use. Finally, recycling postpones disposal, but it does not eliminate eventual disposal. PAPER PRODUCTION Paper, paperboard, and quilt-wrap packaging result from multistage processes with several production and manufacturing subsystems (see Exhibit 7). The various processes are essentially the same for each of the packaging materials unless otherwise noted. Raw Material Acquisition Logging Operations Logging operations can be divided into the following four stages: Harvest Planning. Decreasing timber supplies relative to expected demand has made the planning stage increasingly important to improve wood utilization and to reduce environmental impacts. Planning decisions include logging techniques, the volume and species to be harvested, and road layout. Cutting Practices. Trees are cut down as low to the ground as possible using power saws. Machines known as “feller-bunchers” cut the timber into smaller segments and gather them for transportation. The logs are then roughly 4 Personal Communication with Robert Langert, March 29, 1993. 5 Ibid.
6

scaled, classified for best usage, and graded and measured for length and diameter. Yarding Practices. Logs are moved from the forest to a centralized loading area using either tractors to pull tile logs or cable lines to transport logs above the forest. Loading and Hauling. Logs are transported from the loading area to the manufacturing plant using truck, rail, or water. Harvesting can lead to soil erosion, which causes the pesticides and fertilizer applied before harvesting to be washed into the water as well as the soil. Ongoing erosion may change the run-off patterns of a watershed. And the power tools, tractors, and trucks used all consume energy and release emissions. Materials Manufacture Pulping Pulping is a process whereby cellulose fiber, the material used to make paper, is separated from the other components found in wood. Wood is comprised of 50 percent cellulose fiber, 30 percent lignin, and 20 percent oils and carbohydrates. Mechanical Process. Logs that do not meet lumber-quality standards are debarked by a rotating drum that wears away the bark. Logs are chopped into blocks which are combined with wood chips in a continuous grinding machine. A stream of water flows through the grinder and washes the pulp away. The sludge pulp is pumped over several screens to remove coarse material and water, and is stored in tanks until needed. Mechanical pulping tears the cellulose into shorter fibers and allows more lignin to be included in the pulp, which creates weaker paper that yellows easily. Chemical Process. Debarked logs are chipped and placed in large steel tanks called digesters where they are “cooked” with a combination of soda, sulfite, and sulfate at high temperatures. This pulpy substance is blown into cyclones to remove steam and gas and then sent to large tanks where the cooking chemicals are separated from the pulp. Tile pulp is pumped over screens to remove the water, which is usually 100 to 500 tons of water per ton of pulp. The pulp is thickened and rolled through presses to make sheets of pulp, or moved directly into papermaking operations. Pulp and paper mills use an average of 50,000 gallons of water per ton of paper output. The industry reuses water to conserve usage. In fact, total water use is usually three times higher than actual intake. In addition, mills employ internal recovery systems that recover the liquors used in pulpmaking. Emissions into tile air include particulates of sulphur dioxide and organic sulfur compounds. Scrubbers that “wash” the air to collect fly ash, and boilers and furnaces equipped with air pollution controls are used to reduce emissions. Final Product Fabrication Bleaching If bleached paper is desired, the pulp is either treated with an oxidizing agent such as chlorine or a reducing agent such as sulfate dioxide. Salt, limestone, and sulfur mining processes extract the raw materials used in the bleaching process. In the bleaching process, approximately 10 percent of the chlorine used combines with organic molecules in the wood and produces toxic chlorine compounds called organochlorines. One organochlorine that has received particular attention is dioxin. Bleaching is done in several stages with continuous agitation and washing to achieve the desired brightness. The bleaching process can be skipped if natural brown paper is acceptable to the customer, or accomplished with non-chlorine processes such as oxygen bleaching. Packaging and Transportation
7
Paper wraps are packaged in corrugated boxes and shipped by truck or rail. Disposal Landfilling Biodegradability is not a factor in modern landfills since the sunlight and air required for quick decomposition does not exist. In fact, the “Garbage Project” at the University of Arizona has been investigating and exhuming landfills since the 1970s and has determined that 40-50 percent of garbage is paper which has not decomposed. Composting Paper is organic so it is compostable so long as it is not wax coated or laminated. Recycling Waste paper is pulped using the same processes as virgin paper and is passed through a filter to remove any foreign materials. If de-inking is required, the pulp is aerated so that the ink rises to the surface as foam and is removed by a vacuum. In some processes, heat and chemicals aid the de-inking process. The rest of the process is the same as for virgin papermaking. Recycling waste paper consumes less energy than is consumed during the harvesting, production, and transporting of lumber required for virgin paper. However, this is somewhat offset by the energy used to collect and transport waste paper to the recycling center. Neither paperboard nor quilt-wrap packaging is currently recyclable due to wax and polyethylene content, and possible food contamination. The Decision As the task force members considered their decision of whether or not to endorse McDonald’s recycling program for clamshells, they reviewed the data found in the Franklin studies. They knew that they were going to have to make some assumptions about future disposal methods, unmeasured impacts and consumer response. Clamshells had become a high-profile decision. Not only would this decision affect McDonald’s environmental image but it may also be used to judge the effectiveness of this type of joint task force. Should McDonald’s continue clamshell recycling efforts, or drop clamshells altogether?
8

Appendix A: Comparison of Polystyrene Foam and Bleached Paperboard Selected Data from Franklin Associates’ Resource and Environmental Profile Analysis of Foam Polystyrene and Bleached Paperboard Containers. Prairie Village, Kansas, June 1991.
APPENDIX A-1: LANDFILL VOLUMES OF POLYSTYRENE FOAM AND PAPERBOARD FOOD CONTAINERS (PER 10,000 UNITS)
Weight for 10,000 Landfill Density Landfill Volume Units (pounds) (lb/cu yd) (Cu yd) 4-inch Hinged Containers
PS foam 112.3 180 0.62
LDPE-coated paperboard 323.2 800 0.41
Source: Franklin Associates, Ltd.
APPENDIX A-2: ENERGY REQUIREMENTS BY COMPONENTS FOR HINGED CONTAINERS (MILLION BTU PER 10,000 HINGED CONTAINERS)
0% recycled 100% recycled Containers Energy Percent Energy Percent Foam Polystyrene Container 5.62 86.9 366 81.7
Secondary Packaging 0.80 12.4 0.80 17.9 Disposal 0.05 0.8 0.02 0.4
Total 6.47 100.0 4.48 100.0 Paperboard Container 8.88 96.3 Secondary Packaging 0.34 3.6 Disposal 0.00 0.0 Total 9.22 99.9
Source: Franklin Associates, Ltd. APPENDIX A-3: ENERGY REQUIREMENTS FOR DELIVERY OF HINGED CONTAINERS (MILLION BTU PER 10,000 HINGED CONTAINERS) Total Energy Energy Credit Net Energy Requirements from Incineration6 Requirements Foam Polystyrene 0% recycled 6.47 0.37 6.10 25% recycled 5.97 0.29 5.68 50% recycled 5.48 0.22 5.26 75% recycled 4.98 0.14 4.84 100% recycled 4.48 0.072 4.41 Paperboard 9.22 0.47 8.75
Source: Franklin Associates, Ltd.
6Assumes 15% incineration energy credit based upon solid waste available after recycling. 2 Energy credit associated with secondary packaging which is not assumed to be recycled.
9

APPENDIX A-4: SUMMARY OF ENVIRONMENTAL IMPACT DATA FOR POLYSTYRENE HINGED CONTAINERS (IMPACTS PER 10,000 CONTAINERS)
Process Pollutants Fuel-Related Pollutants Total Pollutants 0% 100% 0% 100% 0% 100% Recycling Recycling Recycling Recycling Recycling Recycling Atmospheric (lbs)
Particulates 0.23 0.20 0.65 0.69 0.9 0.9
Nitrogen Oxides 0.086 0.065 2.0 1.7 2.1 1.8
Hydrocarbons 4.9 3.9 1.9 1.3 6.8 5.2
Sulfur Oxides 0.55 0.36 2.5 2.6 3.1 3.0
Carbon Monoxide 0.098 0.094 0.85 0.73 0.9 0.8
Aldehydes 0.010 0.0055 0.016 0.012 0.0 0.0
Other Organics 0.0038 0.0038 0.021 0.018 0.0 0.0
Odorous Sulfur 0.0022 0.0011 - - 0.0 0.0
Ammonia 0.0076 0.0038 0.0015 0.0014 0.0 0.0
Hydrogen Fluoride - - - - - -
Lead 2.8E-04 2.8E-04 1.1E-05 1.1E-.05 0.0 0.0
Mercury - - - - - -
Chlorine - - - - - -
Waterborne (Ibs)
Fluorides - - - - - -
Dissolved Solids 1.4 0.72 0.20 0.17 1.6 0.9
BOD 0.12 0.11 - - 0.1 0.1
Phenol 9.2E-04 4.6E-04 - - 0.0 0.0
Sulfides 0.0012 5.9E-04 - - 0.0 0.0
Oil 0.027 0.014 - - 0.0 0.0
COD 0.079 0.041 - - 0.1 0.0
Suspended Solids 0.27 0.20 - - 0.3 0.2
Acid - 0.25 0.29 0.3 0.3
Metal Ion - - 0.033 0.037 0.0 0.0
Chemicals - - - - - -
Cyanide - - - - - -
Chromium 2.2E-05 1.1 E-05 - - 0.0 0.0
Iron - - - -
Aluminum - -
Nickel - - - - - -
Mercury - - - - - -
Lead - - - - - -
Phosphates - - - - - -
Zinc - -
Ammonia 1.4E-04 7.2E-05 - - 0.0 0.0 Other - - 0.067 0.059 0.1 0.1
Source: Franklin Associates, Ltd.
10

APPENDIX A-5: SUMMARY OF ENVIRONMENTAL IMPACT DATA FOR PAPERBOARD HINGED CONTAINERS 0% RECYCLING (IMPACTS PER 10,000 CONTAINERS)
Process Pollutants Fuel-Related
Pollutants Total
Pollutants
Atmospheric (Ibs)
Particulates 3.0 2.1 5.1
Nitrogen Oxides 1.9 3.3 5.2
Hydrocarbons 1.3 2.2 3.5
Sulfur Oxides 3.2 6.5 9.7
Carbon Monoxide 0.62 1.2 1.8
Aldehydes 0.0077 0.017 0.0
Other Organics 0.026 0.035 0.1
Odorous Sulfur -
Ammonia 2.4E-04 0.0042 0.0
Hydrogen Fluoride -
Lead 0.0020 3.2E-05 0.0
Mercury
Chlorine 0.37 0.4 Waterborne (Ibs) Fluorides
Dissolved Solids 0.41 0.24 0.7
BOD 0.90 0.9
Phenol 1 .2E-06 - 0.0
Sulfides
Oil 0.0033 0.0
COD 0.029 0.0
Suspended Solids 1.5 1.5
Acid 0.058 1.0 1.1
Metal Ion 0.080 0.1
Chemicals
Cyanide
Chromium 2.4E-06 - 0.0
Iron
Aluminum
Nickel
Mercury
Lead
Phosphates
Zinc
Ammonia 1 SE-OS - 0.0
Other 0.093 0.1
Source: Franklin Associates, Ltd.
11

Appendix B: Comparison of Polystyrene Foam, Paperboard, Wax-Coated Paper, and “Quilt-Wrap” Paper Selected Data from Franklin Associates’ Summary of Life Cycle Analyses of Four Sandwich Packages. Prairie Village, Kansas, June 1991.
12
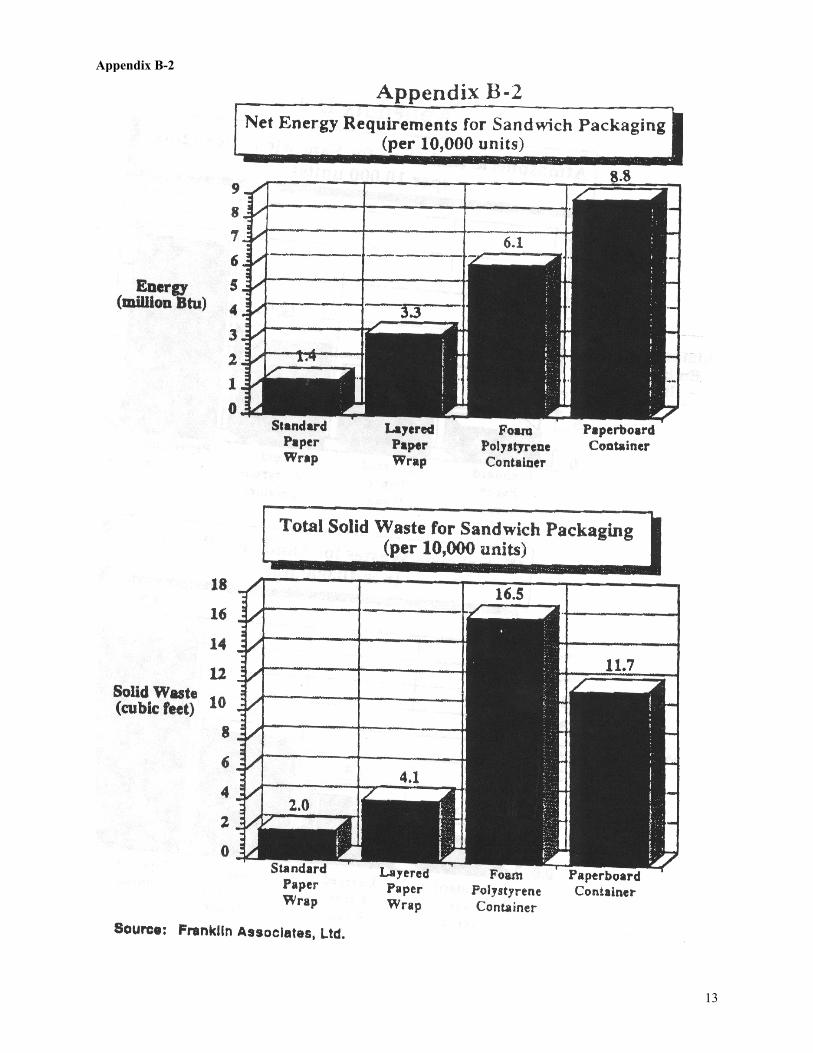
Appendix B-2
13

APPENDIX B-3: ENERGY REQUIREMENTS AND ENVIRONMENTAL EMISSIONS FOR THE PRODUCTION, DELIVERY AND DISPOSAL OF 10,000 SANDWICH PACKAGING PRODUCTS
APPENDIX B-4: DATA FOR SANDWICH PACKAGING PRODUCTS
14