MC2: Boosted AGN and star-formation activity in CIZA J2242 ...
34
8 MC 2 : Boosted AGN and star-formation activity in CIZA J2242.8+5301, a massive post-merger cluster at z = 0.19 Cluster mergers may play a fundamental role in the formation and evolution of cluster galax- ies. Stroe et al. (2014a) revealed unexpected over-densities of candidate Hα emitters near the ∼ 1 Mpc-wide shock fronts of the massive (∼ 2 × 10 15 M ) “Sausage” merging cluster, CIZA J2242.8+5301. We used Keck/DEIMOS and WHT/AF2 to confirm 83 Hα emitters in and around the merging cluster. We find that cluster star-forming galaxies in the hottest X-ray gas and/or in the cluster sub-cores (away from the shock fronts) show high [Sii] 6716/[Sii] 6761 and high [Sii] 6716/Hα, implying very low electron densities (< 30× lower than all other star- forming galaxies outside the cluster) and significant contribution from supernovae, respec- tively. All cluster star-forming galaxies near the cluster centre show evidence of significant outflows (blueshifted Na D ∼ 200 - 300 km s -1 ), likely driven by supernovae. Strong outflows are also found for the cluster Hα AGN. Hα star-forming galaxies in the merging cluster follow the z ∼ 0 mass-metallicity relation, showing systematically higher metallicity (∼0.15-0.2 dex) than Hα emitters outside the cluster (projected R > 2.5 Mpc). This suggests that the shock front may have triggered remaining metal-rich gas which galaxies were able to retain into forming stars. Our observations show that the merger of impressively massive (∼ 10 15 M ) clusters can provide the conditions for significant star-formation and AGN activity, but, as we witness strong feedback by star-forming galaxies and AGN (and given how massive the merging cluster is), such sources will likely quench in a few 100 Myrs. Sobral, Stroe, Dawson et al. MNRAS in press (2015) 1
Transcript of MC2: Boosted AGN and star-formation activity in CIZA J2242 ...
8MC2: Boosted AGN and
star-formation activity in CIZAJ2242.8+5301, a massive
post-merger cluster at z = 0.19
Cluster mergers may play a fundamental role in the formation and evolution of cluster galax-ies. Stroe et al. (2014a) revealed unexpected over-densities of candidate Hα emitters near the∼ 1 Mpc-wide shock fronts of the massive (∼ 2 × 10¹⁵ M) “Sausage” merging cluster, CIZAJ2242.8+5301. We used Keck/DEIMOS and WHT/AF2 to confirm 83 Hα emitters in andaround the merging cluster. We find that cluster star-forming galaxies in the hottest X-ray gasand/or in the cluster sub-cores (away from the shock fronts) show high [Sii] 6716/[Sii] 6761and high [Sii] 6716/Hα, implying very low electron densities (< 30× lower than all other star-forming galaxies outside the cluster) and significant contribution from supernovae, respec-tively. All cluster star-forming galaxies near the cluster centre show evidence of significantoutflows (blueshifted Na D∼ 200− 300 km s−1), likely driven by supernovae. Strong outflowsare also found for the cluster HαAGN. Hα star-forming galaxies in the merging cluster followthe z ∼ 0 mass-metallicity relation, showing systematically higher metallicity (∼0.15-0.2 dex)than Hα emitters outside the cluster (projected R > 2.5 Mpc). This suggests that the shockfront may have triggered remaining metal-rich gas which galaxies were able to retain intoforming stars. Our observations show that the merger of impressively massive (∼ 1015 M)clusters can provide the conditions for significant star-formation and AGN activity, but, aswe witness strong feedback by star-forming galaxies and AGN (and given how massive themerging cluster is), such sources will likely quench in a few 100 Myrs.
Sobral, Stroe, Dawson et al.MNRAS in press (2015)
1
2 CHAPTER 8. BOOSTED AGN AND STAR-FORMATION
8.1 Introduction
Star-forming galaxies have evolved dramatically in the 11 Gyr between z ∼ 2.5 (the likelypeak of the star formation history of the Universe) and the present day (e.g. Madau et al.1996; Sobral et al. 2009; Karim et al. 2011; Sobral et al. 2014). The co-moving star formationrate density of the Universe has dropped by more than an order of magnitude over this time inall environments (Rodighiero et al. 2011; Karim et al. 2011; Gilbank et al. 2011; Sobral et al.2013a), and also specifically in clusters (e.g. Kodama et al. 2013; Shimakawa et al. 2014). Thebulk of this evolution is described by the continuous decrease of the typical star formation rate,SFR∗, which is found to affect the star-forming population at all masses (Sobral et al. 2014).Surprisingly, the decline of SFR∗ seems to be happening (for star-forming galaxies) in allenvironments, at least since z ∼ 2 (e.g. Koyama et al. 2013).
Locally, star formation activity has been found to be very strongly dependent on envi-ronment (e.g. Lewis et al. 2002; Gómez et al. 2003; Tanaka et al. 2004; Mahajan et al. 2010).Clusters of galaxies are dominated by passively-evolving galaxies, while star-forming galaxiesare mostly found in low-density/field environments (Dressler 1980). It is also well-established(e.g. Gómez et al. 2003; Kauffmann et al. 2004; Best 2004) that both the typical star formationrates of galaxies and the star-forming fraction decrease with local environmental density bothin the local Universe and at moderate redshift (z ∼ 0.4, e.g. Kodama et al. 2004). This is inline with the results at z ∼ 0.2 − 0.3 from Couch et al. (2001) or Balogh et al. (2002) whofound that the Hα luminosity (an excellent tracer of recent star-formation activity) function inrich, relaxed clusters have the same shape as in the field, but have a much lower normalisation(∼ 50 per cent lower), consistent with a significant suppression of star formation in highlydense environments.
The strong positive correlation between star formation rate (SFR) and stellar mass (e.g.Brinchmann et al. 2004; Noeske et al. 2007; Peng et al. 2010), while being a strong functionof cosmic time/redshift, seems to depend little on environment (Koyama et al. 2013), eventhough cluster star-forming galaxies seem to be more massive than field star-forming galax-ies. Thus, the fundamental difference between cluster and field environments (regarding theirrelation with star formation) seems to be primarily the fraction of star-forming galaxies, orthe probability of being a star-forming galaxy: it is much lower in cluster environments thanin field environments. Studies looking at the mass-metallicity relation with environment alsoseem to find relatively little difference at z ∼ 1 (comparing groups and fields; Sobral et al.2013a), or just a slight offset (+0.04 dex) for relaxed cluster galaxies in the Local Universe,as compared to the field (using Sloan Digital Sky Survey, SDSS; Ellison et al. 2009). Furtherstudying the mass-metallicity relation (and the Fundamental Metallicity Relation, FMR, e.g.Maiolino et al. 2008; Mannucci et al. 2010; Stott et al. 2013b) in clusters and comparing tothe field could provide further important information.
While there are increasing efforts to try to explain the SFR dependence on the environ-ment, by conducting surveys at high redshift (e.g. Hayashi et al. 2010; Sobral et al. 2011;Matsuda et al. 2011; Muzzin et al. 2012; Koyama et al. 2013; Tal et al. 2014; Darvish et al.2014), so far such studies have not been able to fully reveal the physical processes leading tothe ultimate quenching of (satellite) star-forming galaxies (e.g. Peng et al. 2010; Muzzin et al.2012, 2014). Several strong processes have been proposed and observed, such as harassment(e.g. Moore et al. 1996), strangulation (e.g. Larson et al. 1980) and ram-pressure stripping
8.1. INTRODUCTION 3
(e.g. Gunn & Gott 1972; Fumagalli et al. 2014). Observations are also showing a variety ofblue-shifted rest-frame UV absorption lines which indicate that most star-forming galaxies atleast at z ∼ 1 − 2, are able to drive powerful gas outflows (e.g. Shapley et al. 2003; Weineret al. 2009; Kornei et al. 2012) which may play a significant role in quenching, particularly ifthose happen in high density environments. Evidence of such galactic winds have also beenseen in e.g. Förster Schreiber et al. (2009) through broad components in the rest-frame opticalHα and [Nii] emission line profiles (e.g. Genzel et al. 2011). Spatially resolved observationsallow for constraints on the origin of the winds within galaxies, and on the spatial extent ofthe outflowing gas, which are essential to derive mass outflow rates. In field environments,it is expected that such outflows will not be able to escape the halo (as long as it is massiveenough and it is not a satellite), and in many conditions would likely come back and furtherfuel star formation (e.g. Hopkins et al. 2013). However, in the most massive clusters, suchstrong outflows will likely result in significant amounts of gas being driven out of the sub-halos that host star-forming galaxies, enriching the ICM and quickly quenching star-forminggalaxies (SFGs) with the highest SFRs/highest outflow rates.
Many studies often have environmental classes simply divided into (relaxed) “clusters"or “fields". However, in a ΛCDM Universe, most clusters are expected to be the result ofgroup/smaller cluster mergers – some of which can be extremely violent. Little is knownabout the role of cluster and group mergers in galaxy formation and evolution, and whetherthey could be important in setting the environmental trends which have now been robustlymeasured and described. It is particularly important to understand if cluster mergers triggerstar formation (e.g. Miller & Owen 2003; Owen et al. 2005; Ferrari et al. 2005; Hwang & Lee2009; Wegner et al. 2015), if they quench it (e.g. Poggianti et al. 2004), or, alternatively, ifthey have no direct effect (e.g. Chung et al. 2010). Results from Umeda et al. (2004), studyinga merging cluster at z ∼ 0.2 (Abell 521) found tentative evidence that merging clusters couldperhaps trigger star-formation. More recently, Stroe et al. (2014a) conducted a wide fieldHα narrow-band survey over two merging clusters with a simple geometry, with the mergerhappening in the plane of the sky. Stroe et al. (2014a) find a strong boost in the normalisationof the Hα luminosity function of the CIZA J2242.8+5301 (“Sausage") cluster, several timesabove the field and other clusters. The authors suggest that they may be witnessing star-formation enhancement or triggered due to the passage of the shock wave seen in the radioand X-rays. Interestingly, Stroe et al. (2014a) do not find this effect on the other similarmerging cluster studied (“Toothbrush"), likely because it is a significantly older merger (about1Gyr older, c.f. Stroe et al. 2014a, 2015), and thus displays only the final result (an excessof post-starburst galaxies instead of Hα emitters). The results are in very good agreementwith simulations by Roediger et al. (2014) and recent observational results by Pranger et al.(2014). 1 In order to investigate the nature of the numerous Hα emitter candidates in andaround the “Sausage" merging cluster, we have obtained deep spectroscopic observations ofthe bulk of the sample presented in Stroe et al. (2015), using Keck/DEIMOS (PI Wittman;Dawson et al. 2015) and the William Herschel Telescope (WHT) AutoFib2+WYFFOS (AF2)instrument (PI: Stroe; this paper). In this paper, we use these data to confirm candidate Hαemitters, unveil their nature, masses, metallicities and other properties. We use a cosmologywith ΩΛ = 0.7, Ωm = 0.3, and H0 = 70 km s−1 Mpc−1. All quoted magnitudes are on the ABsystem and we use a Chabrier initial mass function (IMF; Chabrier 2003).
4 CHAPTER 8. BOOSTED AGN AND STAR-FORMATION
8.2 Sample Selection, Observations & Data Reduction
8.2.1 The “Sausage" Merging Cluster
The CIZA J2242.8+5301 cluster (nicknamed “Sausage” cluster, referred simply as Sausagefor the rest of the paper; see Figure 8.1) is a z = 0.1921, X-ray luminous (L0.1−2.4keV =
6.8 × 1044 erg s−1; Kocevski et al. 2007), disturbed (Akamatsu & Kawahara 2013; Ogreanet al. 2013a; Ogrean et al. 2014, Akamatsu et al. 2015) cluster that hosts double radio relicstowards its northern and southern outskirts (van Weeren et al. 2010; Stroe et al. 2013, seeFigure 8.1). The radio relics (Mpc-wide patches of diffuse radio emission) trace Mpc-wideshock fronts travelling through the intra-cluster medium (see Figure 8.1) thought to have beenproduced at the core-passage of two massive clusters during major merger in the plane of thesky (van Weeren et al. 2010; Stroe et al. 2013, 2014c,a). Despite being an interesting cluster,the CIZA J2242.8+5301 cluster (Sausage cluster from now on) remained mostly unexploreduntil very recently, due to significant Galactic extinction (c.f. Stroe et al. 2014a; Jee et al.2015; Stroe et al. 2015).
Dynamics inferred from spectroscopic observations suggest the two sub-clusters each havemasses of ∼ 1.3 − 1.6 × 10¹⁵M (Dawson et al. 2015), in agreement with independent weaklensing analysis which points towards ∼ 1.0 − 1.1 × 10¹⁵M (Jee et al. 2015). The weaklensing (Jee et al. 2015), and the dynamics (Dawson et al. 2015) point towards a total mass of≈ 2 × 10¹⁵ M, making it one of the most massive clusters known to date. The virial radiusfor the total system from weak lensing (Jee et al. 2015) is r200 ∼ 2.63 Mpc..
Dawson et al. (2015) presents a detailed dynamics analysis of the cluster merger. Ob-servations and information from lensing, spectroscopy, broad-band imaging, radio and otherconstraints imply that the merger likely happened around 0.7±0.2 Gyrs ago (see also Aka-matsu et al. 2015, in very good agreement). Clusters were likely travelling at a velocity of∼ 2000−2200 km s−1 towards each other when they merged (Dawson et al. 2015, Akamatsu etal. 2015). This is in excellent agreement with the analysis presented in Stroe et al. (2014c) thatshows that the shock wave seems to be moving with a similar speed (∼ 2000 − 2500 km s−1).Because the shock does not slow down due to gravitational effects, it can be thought as a proxyof the collisional velocity, further supporting a speed of ∼ 2000 km s−1 (see also Akamatsu etal. 2015 who find this is also the case from X-rays). We use the detailed information fromDawson et al. (2015), Jee et al. (2015), Akamatsu et al. (2015), Stroe et al. (2015), and ref-erences therein, to put our results into context and to explore potential interpretations of theresults. The reader is referred to those papers for more information on the cluster itself.
8.2.2 Narrow-band survey and the sample of Hα candidates
By using a custom-designed narrow-band filter (λ = 7839± 55Å, PI: Sobral) mounted on theWide Field Camera at the prime-focus of the Isaac Newton Telescope, Stroe et al. (2014a)imaged the Sausage cluster over 0.3 deg2 and selected 181 potential line emitters, down to aHα luminosity of 1040.8 erg s−1 (see Stroe et al. 2014a). They discover luminous, extended,tens-of-kpc-wide candidate Hα emitters in the vicinity of the shock fronts, corresponding to asignificant boost in the normalisation of the Hα luminosity function, when comparing to notonly the field environment (Shioya et al. 2008; Drake et al. 2013), but also to other relaxedand merging clusters (e.g. Umeda et al. 2004).
8.2. SAMPLE SELECTION, OBSERVATIONS & DATA REDUCTION 5
Star-formingStar-forming (+Outflow)NL AGNNL AGN (+Outflow)
Ha (NB, Stroe+15)Spectroscopically confirmed
BL AGN
100 kpc 1 Mpc
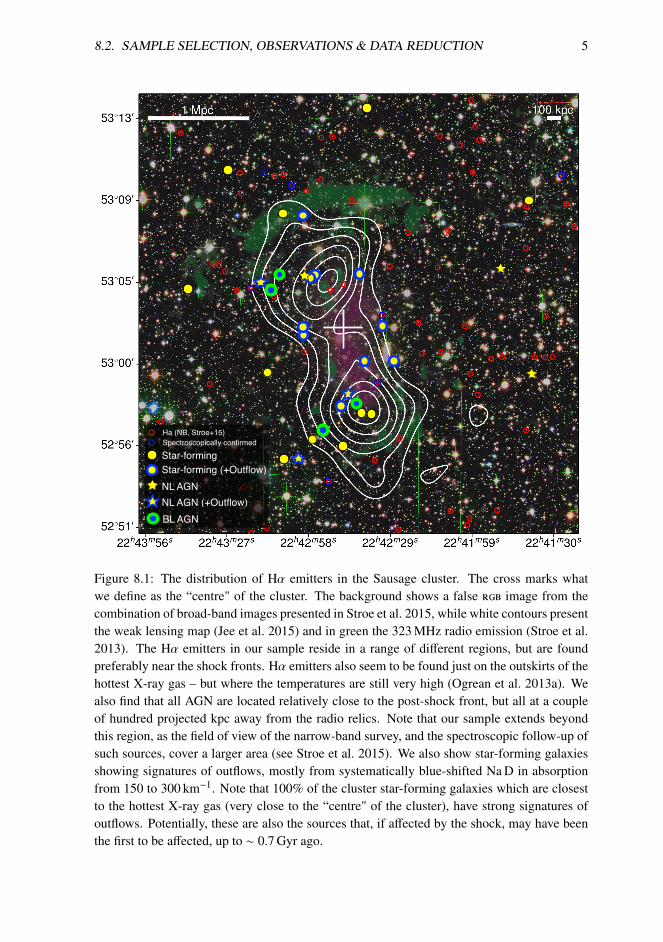
Figure 8.1: The distribution of Hα emitters in the Sausage cluster. The cross marks whatwe define as the “centre" of the cluster. The background shows a false rgb image from thecombination of broad-band images presented in Stroe et al. 2015, while white contours presentthe weak lensing map (Jee et al. 2015) and in green the 323 MHz radio emission (Stroe et al.2013). The Hα emitters in our sample reside in a range of different regions, but are foundpreferably near the shock fronts. Hα emitters also seem to be found just on the outskirts of thehottest X-ray gas – but where the temperatures are still very high (Ogrean et al. 2013a). Wealso find that all AGN are located relatively close to the post-shock front, but all at a coupleof hundred projected kpc away from the radio relics. Note that our sample extends beyondthis region, as the field of view of the narrow-band survey, and the spectroscopic follow-up ofsuch sources, cover a larger area (see Stroe et al. 2015). We also show star-forming galaxiesshowing signatures of outflows, mostly from systematically blue-shifted Na D in absorptionfrom 150 to 300 km−1. Note that 100% of the cluster star-forming galaxies which are closestto the hottest X-ray gas (very close to the “centre" of the cluster), have strong signatures ofoutflows. Potentially, these are also the sources that, if affected by the shock, may have beenthe first to be affected, up to ∼ 0.7 Gyr ago.
6 CHAPTER 8. BOOSTED AGN AND STAR-FORMATION
Stroe et al. (2015) presents deeper narrow-band and i band imaging, along with new multi-band data (BVriZ), and find a total of 201 candidate line emitters. Here we use the full sampleof candidate line emitters in and around the Sausage merging cluster, without any pre-selectionon the likelihood of them being Hα, along with the corrected broad-band photometry (due toGalactic dust extinction, see Stroe et al. 2015). We take this approach in order to increase thecompleteness of our Hα sample and avoid any biases (even if small) caused by the need to usebroad-band colours and/or photometric redshifts (photo-zs). Spectroscopic redshifts obtainedhere are used in Stroe et al. (2015) to test their selection, improve completeness, and reducecontamination by other emission lines.
8.2.3 Follow-up spectroscopy with Keck and WHT
Keck/DEIMOS observations
We conducted a spectroscopic survey of the Sausage cluster with the DEep Imaging Multi-Object Spectrograph (DEIMOS; Faber et al. 2003) on the Keck II 10 m telescope over twoobserving runs on 2013 July 14 and 2013 September 5. For full details on the observationsand data reduction, see Dawson et al. (2015). Here we provide just a brief summary.
We observed a total of four slit masks with approximately 120 slits per mask. For eachmask we took three 900 s exposures, for a total exposure time of 2.7 ks. The average seeingwas approximately 0.7′′. For both observing runs we used 1′′ wide slits with the 1200 line mm−1
grating, tilted to a central wavelength of 6700 Å, resulting in a pixel scale of 0.33 Å pixel−1, aresolution of ∼ 1 Å (∼ 45 km s−1, observed and just below 40 km s−1 rest-frame for our clusterHα emitters), and typical wavelength coverage of 5400 Å to 8000 Å. The actual wavelengthcoverage is in practice shifted by ∼ ±400 Å depending where the slit is located along the widthof the slit-mask. For most cluster members this enabled us to observe Hβ, [Oiii]4959&5007, MgI(b), FeI, NaI (D) , [Oi], Hα, [Nii] and [Sii]. We used the DEEP2 version of the spec2d package(Newman et al. 2013) to reduce the data. spec2d performs wavelength calibration, cosmicray removal and sky subtraction on slit-by-slit basis, generating a processed two-dimensionalspectrum for each slit. The spec2d pipeline also generates a processed one-dimensional spec-trum for each slit. This extraction creates a one-dimensional spectrum of the target, containingthe summed flux at each wavelength in an optimised window.
Our primary DEIMOS targets were candidate red sequence/cluster galaxies and for detailson the full sample, the reader is referred to Dawson et al. (2015). Here we focus on theobserved 40 Hα emitters within the DEIMOS data-set (see e.g. Figure 8.2), out of which 32are found to be cluster members (see Dawson et al. 2015). The remaining 8 sources werefound to be at slightly higher and slightly lower redshifts, and will be used as part of thecomparison sample (Hα emitters outside the cluster, which are either at a different redshiftfrom the cluster, or are at a projected distance higher than 2.5 Mpc from the cluster).
WHT/AF2 observations
We followed up 103 candidate line emitters from Stroe et al. (2015) using AF2 on the WHTin La Palma on two nights during 2014 July 2–3. In order to allocate spare fibres, we used ourBVriZ photometric catalogue (Stroe et al. 2015) to select other potential cluster candidates(using colour-colour selections; see Stroe et al. 2015). We observed six of these sources. We
8.2. SAMPLE SELECTION, OBSERVATIONS & DATA REDUCTION 7
6500 6550 6600 6650 6700 6750Restframe Wavelength (A)
0.1
0.3
0.5
0.7
0.9
1.1
Nor
mal
ised
Flux
[NII
]H
α
[NII
]
[SII
][S
II]
6500 6550 6600 6650 6700 6750Restframe Wavelength (A)
0.1
0.3
0.5
0.7
0.9
1.1
Nor
mal
ised
Flux
[NII
]H
α
[NII
]
[SII
][S
II]
6500 6550 6600 6650 6700 6750Restframe Wavelength (A)
0.1
0.3
0.5
0.7
0.9
1.1
Nor
mal
ised
Flux
[NII
]H
α
[NII
]
[SII
][S
II]
6500 6550 6600 6650 6700 6750Restframe Wavelength (A)
0.1
0.3
0.5
0.7
0.9
1.1
Nor
mal
ised
Flux
[NII
]H
α
[NII
]
[SII
][S
II]
6500 6550 6600 6650 6700 6750Restframe Wavelength (A)
0.1
0.3
0.5
0.7
0.9
1.1
Nor
mal
ised
Flux
[NII
]H
α
[NII
]
[SII
][S
II]
6500 6550 6600 6650 6700 6750Restframe Wavelength (A)
0.1
0.3
0.5
0.7
0.9
1.1
Nor
mal
ised
Flux
[NII
]H
α
[NII
]
[SII
][S
II]
6500 6550 6600 6650 6700 6750Restframe Wavelength (A)
0.1
0.3
0.5
0.7
0.9
1.1
Nor
mal
ised
Flux
[NII
]H
α
[NII
]
[SII
][S
II]
6500 6550 6600 6650 6700 6750Restframe Wavelength (A)
0.1
0.3
0.5
0.7
0.9
1.1
Nor
mal
ised
Flux
[NII
]H
α
[NII
]
[SII
][S
II]
6500 6550 6600 6650 6700 6750Restframe Wavelength (A)
0.1
0.3
0.5
0.7
0.9
1.1
Nor
mal
ised
Flux
[NII
]H
α
[NII
]
[SII
][S
II]
6500 6550 6600 6650 6700 6750Restframe Wavelength (A)
0.1
0.3
0.5
0.7
0.9
1.1
Nor
mal
ised
Flux
[NII
]H
α
[NII
]
[SII
][S
II]
6500 6550 6600 6650 6700 6750Restframe Wavelength (A)
0.1
0.3
0.5
0.7
0.9
1.1
Nor
mal
ised
Flux
[NII
]H
α
[NII
]
[SII
][S
II]
6500 6550 6600 6650 6700 6750Restframe Wavelength (A)
0.1
0.3
0.5
0.7
0.9
1.1
Nor
mal
ised
Flux
[NII
]H
α
[NII
]
[SII
][S
II]
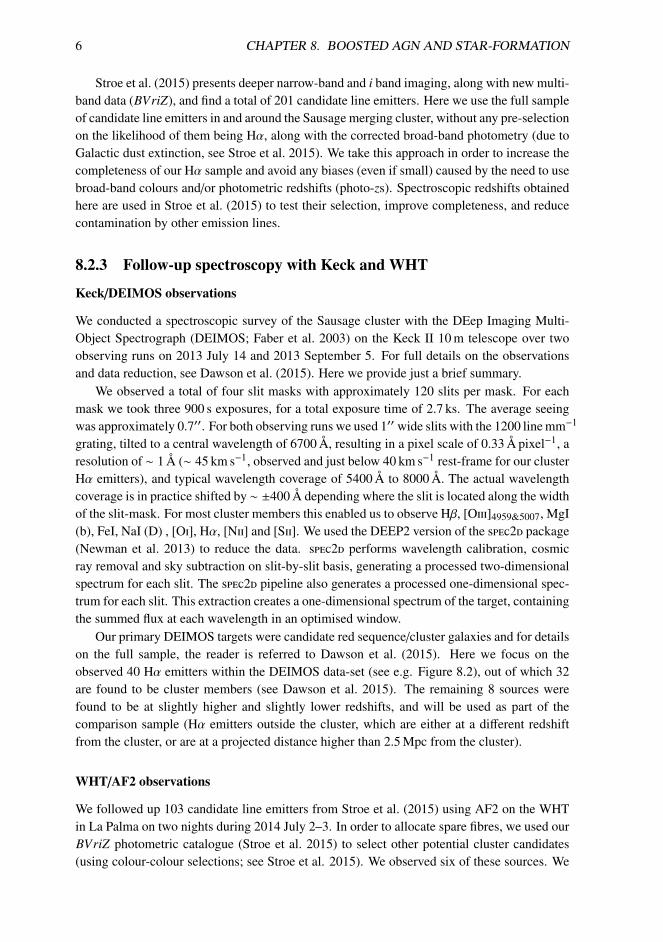
Figure 8.2: Some examples of our Hα emitters from the Keck/DEIMOS data and the Gaussianfits we derived in order to measure emission line ratios. We find a variety of line ratios andFWHMs, but are able to fit all emission lines with simple Gaussian profiles.
found no evidence of emission lines in any of these sources, but have a very high success ratein detecting emission lines for the main sample of emission line candidates.
The seeing was 0.8-1.0′′ throughout the observing run. The AF2 instrument on WHT ismade of ∼ 150 fibres, each with a diameter of 1.6′′, which can be allocated to sources withina ∼ 30 × 30 arcmin2 field of view, although with strong spatial constraints/limitations. Thespectral coverage varies slightly depending on the fibre and field location, but for a source atz = 0.19 all our spectra cover the main emission lines we are interested in: Hβ, [Oiii], Hα,[Nii] and [Sii]. We obtained 2 different pointings: one centred on the cluster, with a totalexposure time of 9 ks (where we were able to allocate 63 fibres to targets, and 3 fibres to sky),and one slightly to the North, with a total exposure time of 5.4 ks (46 fibres allocated to targetsand 4 to sky). We also obtained some further sky exposures to improve the sky subtraction(2.7 ks per field).
We took standard steps in the reduction of optical multi-fibre spectra, also mimickingthe steps followed for DEIMOS. Biases and lamp flats were taken at the beginning of eachnight. Arcs using neon, helium and mercury lamps were taken on the sky for each fibreconfiguration. The traces of the fibres on the CCD were curved in the dispersion direction (yaxis on the CCD). The lamp flats were used to correct for this distortion. Each fibre shape wasfit with a Y pixel coordinate polynomial as function of X coordinate. All CCD pixels werecorrected according to the polynomial for the closest fibre. This was done separately for eachconfiguration, on the biases, flats, lamp arcs and the science data.
The final 2D bias subtracted and curvature corrected frames were then sky subtractedusing the sky position exposure(s). In order to improve the sky subtraction we also used sky-dedicated fibres (which observe sky in all positions) to scale the counts. We further obtained
8 CHAPTER 8. BOOSTED AGN AND STAR-FORMATION
-16 -15.5 -15 -14.5 -14 -13.5log10 Flux (erg s−1 cm−2)
0
10
20
30
40
50
60N
umbe
rof
Sour
ces
All NB ExcessAll Hα NB candidatesHα spectroscopy
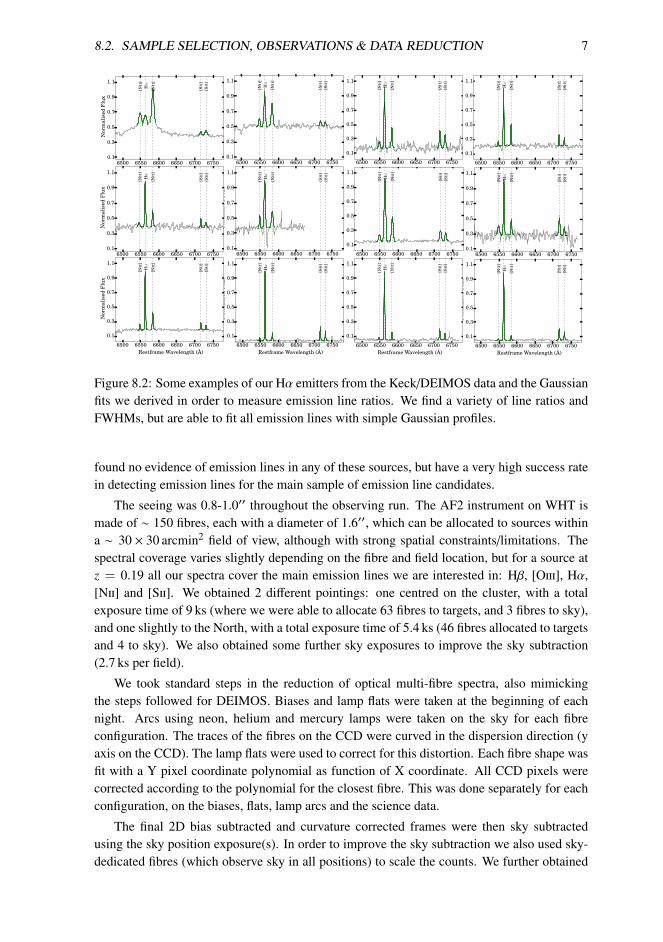
Figure 8.3: The distribution of emission line fluxes in the full sample of narrow-band selectedHα emitters, and those in our spectroscopic sample. Fluxes shown here are derived fromnarrow-band photometry (full flux, including both Hα and [Nii] fluxes), and corrected forGalactic extinction. This shows that we are complete down to ∼ 6 × 10⁻¹⁶ erg s−1 cm−2, butthat, particularly due to the use of Keck, we also have Hα emitters with significantly loweremission line fluxes in our sample, although we are clearly not complete for those fluxes.
the best scaling factor by minimising the residuals after sky subtraction. After subtracting thesky, we extracted sources along the dispersion axis, summing up the counts. We obtained afirst order wavelength calibration by using the arcs and obtain a final wavelength calibrationper fibre by using the wealth of sky lines on that particular fibre. This gives a wavelengthcalibration with an error (rms) of less than 1 Å.
In total, out of the 109 targeted sources, we obtained high enough S/N to determine a red-shift for 73 sources (65 candidate line emitters selected with the NB). The remaining sourceseither had very low S/N, were targeted by fibres with low throughput and/or for which skysubtraction was only possible with the dedicated (different) sky fibre (thus resulting in poorsky subtraction). All the sources for which we did not get high enough S/N to detect an emis-sion line are the emitters with the lowest emission line fluxes, expected to remain undetectedwith the achieved flux limit. Figure 8.3 shows the distribution of fluxes for the full sampleof candidate Hα emitters (only a fraction of those were targeted) and those we have detectedat high S/N – this shows that we are complete for “intrinsic" (i.e., after correcting for Galaxyextinction) fluxes of > 6 × 10⁻¹⁶ erg s−1 cm−2 (see Figure 8.3). We note that while our the
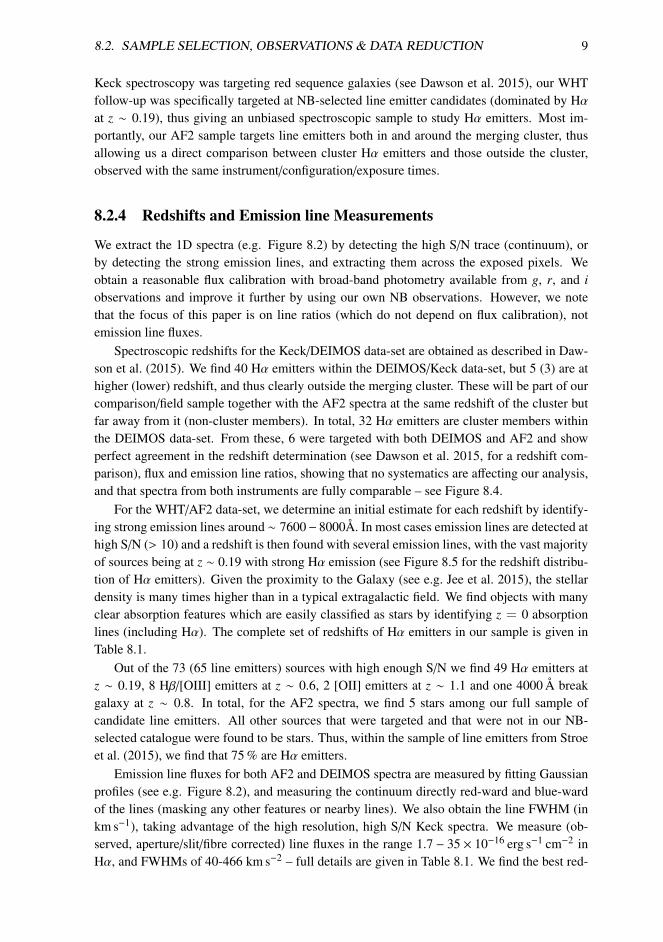
8.2. SAMPLE SELECTION, OBSERVATIONS & DATA REDUCTION 9
Keck spectroscopy was targeting red sequence galaxies (see Dawson et al. 2015), our WHTfollow-up was specifically targeted at NB-selected line emitter candidates (dominated by Hαat z ∼ 0.19), thus giving an unbiased spectroscopic sample to study Hα emitters. Most im-portantly, our AF2 sample targets line emitters both in and around the merging cluster, thusallowing us a direct comparison between cluster Hα emitters and those outside the cluster,observed with the same instrument/configuration/exposure times.
8.2.4 Redshifts and Emission line Measurements
We extract the 1D spectra (e.g. Figure 8.2) by detecting the high S/N trace (continuum), orby detecting the strong emission lines, and extracting them across the exposed pixels. Weobtain a reasonable flux calibration with broad-band photometry available from g, r, and iobservations and improve it further by using our own NB observations. However, we notethat the focus of this paper is on line ratios (which do not depend on flux calibration), notemission line fluxes.
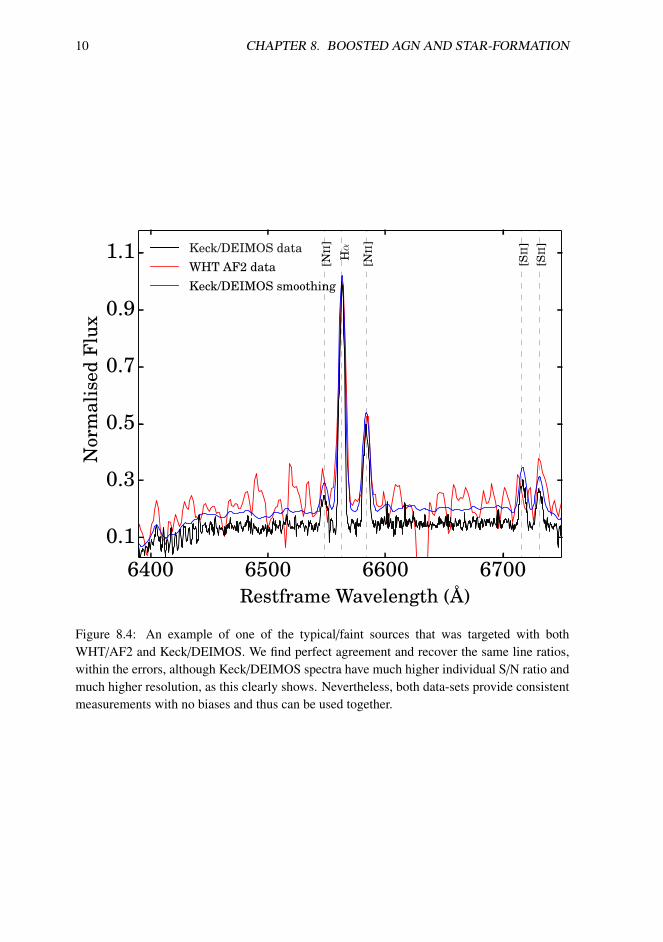
Spectroscopic redshifts for the Keck/DEIMOS data-set are obtained as described in Daw-son et al. (2015). We find 40 Hα emitters within the DEIMOS/Keck data-set, but 5 (3) are athigher (lower) redshift, and thus clearly outside the merging cluster. These will be part of ourcomparison/field sample together with the AF2 spectra at the same redshift of the cluster butfar away from it (non-cluster members). In total, 32 Hα emitters are cluster members withinthe DEIMOS data-set. From these, 6 were targeted with both DEIMOS and AF2 and showperfect agreement in the redshift determination (see Dawson et al. 2015, for a redshift com-parison), flux and emission line ratios, showing that no systematics are affecting our analysis,and that spectra from both instruments are fully comparable – see Figure 8.4.
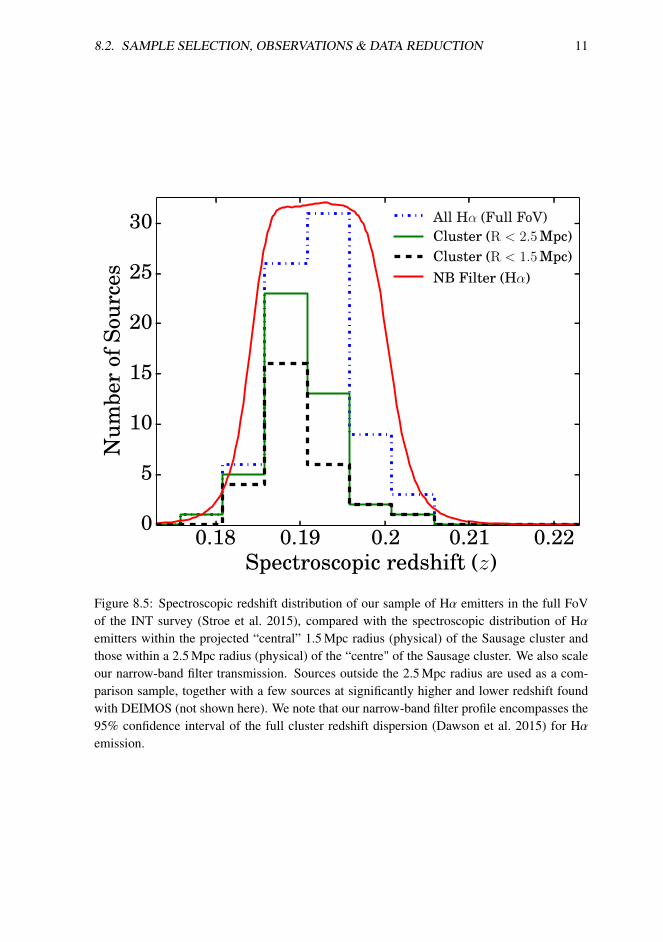
For the WHT/AF2 data-set, we determine an initial estimate for each redshift by identify-ing strong emission lines around ∼ 7600− 8000Å. In most cases emission lines are detected athigh S/N (> 10) and a redshift is then found with several emission lines, with the vast majorityof sources being at z ∼ 0.19 with strong Hα emission (see Figure 8.5 for the redshift distribu-tion of Hα emitters). Given the proximity to the Galaxy (see e.g. Jee et al. 2015), the stellardensity is many times higher than in a typical extragalactic field. We find objects with manyclear absorption features which are easily classified as stars by identifying z = 0 absorptionlines (including Hα). The complete set of redshifts of Hα emitters in our sample is given inTable 8.1.
Out of the 73 (65 line emitters) sources with high enough S/N we find 49 Hα emitters atz ∼ 0.19, 8 Hβ/[OIII] emitters at z ∼ 0.6, 2 [OII] emitters at z ∼ 1.1 and one 4000 Å breakgalaxy at z ∼ 0.8. In total, for the AF2 spectra, we find 5 stars among our full sample ofcandidate line emitters. All other sources that were targeted and that were not in our NB-selected catalogue were found to be stars. Thus, within the sample of line emitters from Stroeet al. (2015), we find that 75 % are Hα emitters.
Emission line fluxes for both AF2 and DEIMOS spectra are measured by fitting Gaussianprofiles (see e.g. Figure 8.2), and measuring the continuum directly red-ward and blue-wardof the lines (masking any other features or nearby lines). We also obtain the line FWHM (inkm s−1), taking advantage of the high resolution, high S/N Keck spectra. We measure (ob-served, aperture/slit/fibre corrected) line fluxes in the range 1.7 − 35 × 10−16 erg s−1 cm−2 inHα, and FWHMs of 40-466 km s−2 – full details are given in Table 8.1. We find the best red-
10 CHAPTER 8. BOOSTED AGN AND STAR-FORMATION
6400 6500 6600 6700Restframe Wavelength (A)
0.1
0.3
0.5
0.7
0.9
1.1
Nor
mal
ised
Flux
[NII
]H
α
[NII
]
[SII
][S
II]Keck/DEIMOS data
WHT AF2 dataKeck/DEIMOS smoothing
Figure 8.4: An example of one of the typical/faint sources that was targeted with bothWHT/AF2 and Keck/DEIMOS. We find perfect agreement and recover the same line ratios,within the errors, although Keck/DEIMOS spectra have much higher individual S/N ratio andmuch higher resolution, as this clearly shows. Nevertheless, both data-sets provide consistentmeasurements with no biases and thus can be used together.
8.2. SAMPLE SELECTION, OBSERVATIONS & DATA REDUCTION 11
0.18 0.19 0.2 0.21 0.22Spectroscopic redshift (z)
0
5
10
15
20
25
30
Num
ber
ofSo
urce
s
All Hα (Full FoV)Cluster (R < 2.5 Mpc)Cluster (R < 1.5 Mpc)NB Filter (Hα)
Figure 8.5: Spectroscopic redshift distribution of our sample of Hα emitters in the full FoVof the INT survey (Stroe et al. 2015), compared with the spectroscopic distribution of Hαemitters within the projected “central” 1.5 Mpc radius (physical) of the Sausage cluster andthose within a 2.5 Mpc radius (physical) of the “centre" of the Sausage cluster. We also scaleour narrow-band filter transmission. Sources outside the 2.5 Mpc radius are used as a com-parison sample, together with a few sources at significantly higher and lower redshift foundwith DEIMOS (not shown here). We note that our narrow-band filter profile encompasses the95% confidence interval of the full cluster redshift dispersion (Dawson et al. 2015) for Hαemission.
12 CHAPTER 8. BOOSTED AGN AND STAR-FORMATION
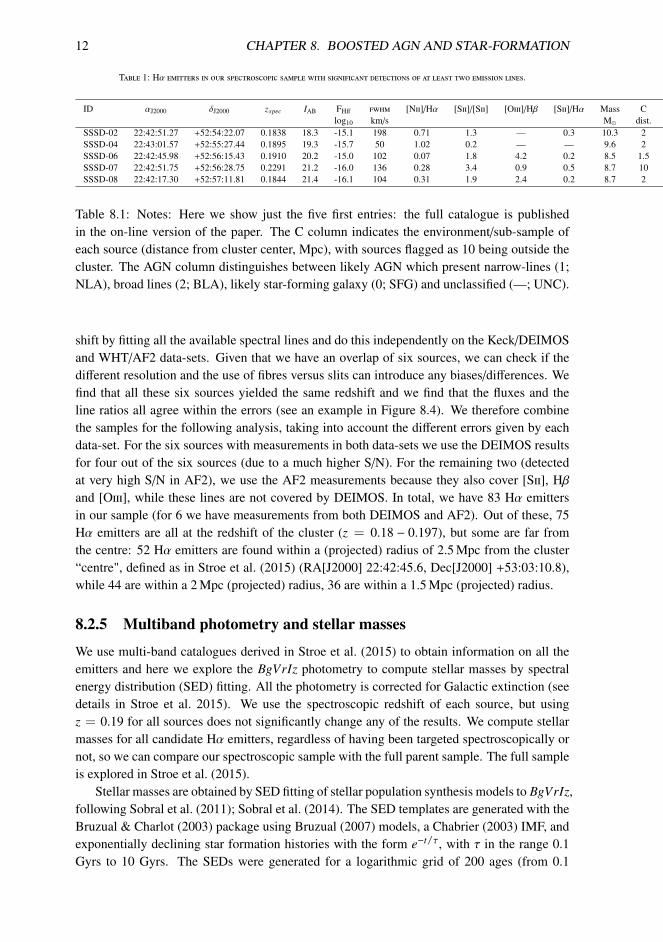
Table 1: Hα emitters in our spectroscopic sample with significant detections of at least two emission lines.
ID αJ2000 δJ2000 zspec IAB FHff fwhm [Nii]/Hα [Sii]/[Sii] [Oiii]/Hβ [Sii]/Hα Mass C AGNlog10 km/s M dist.
SSSD-02 22:42:51.27 +52:54:22.07 0.1838 18.3 -15.1 198 0.71 1.3 — 0.3 10.3 2 —SSSD-04 22:43:01.57 +52:55:27.44 0.1895 19.3 -15.7 50 1.02 0.2 — — 9.6 2 1SSSD-06 22:42:45.98 +52:56:15.43 0.1910 20.2 -15.0 102 0.07 1.8 4.2 0.2 8.5 1.5 0SSSD-07 22:42:51.75 +52:56:28.75 0.2291 21.2 -16.0 136 0.28 3.4 0.9 0.5 8.7 10 0SSSD-08 22:42:17.30 +52:57:11.81 0.1844 21.4 -16.1 104 0.31 1.9 2.4 0.2 8.7 2 —
Table 8.1: Notes: Here we show just the five first entries: the full catalogue is publishedin the on-line version of the paper. The C column indicates the environment/sub-sample ofeach source (distance from cluster center, Mpc), with sources flagged as 10 being outside thecluster. The AGN column distinguishes between likely AGN which present narrow-lines (1;NLA), broad lines (2; BLA), likely star-forming galaxy (0; SFG) and unclassified (—; UNC).
shift by fitting all the available spectral lines and do this independently on the Keck/DEIMOSand WHT/AF2 data-sets. Given that we have an overlap of six sources, we can check if thedifferent resolution and the use of fibres versus slits can introduce any biases/differences. Wefind that all these six sources yielded the same redshift and we find that the fluxes and theline ratios all agree within the errors (see an example in Figure 8.4). We therefore combinethe samples for the following analysis, taking into account the different errors given by eachdata-set. For the six sources with measurements in both data-sets we use the DEIMOS resultsfor four out of the six sources (due to a much higher S/N). For the remaining two (detectedat very high S/N in AF2), we use the AF2 measurements because they also cover [Sii], Hβand [Oiii], while these lines are not covered by DEIMOS. In total, we have 83 Hα emittersin our sample (for 6 we have measurements from both DEIMOS and AF2). Out of these, 75Hα emitters are all at the redshift of the cluster (z = 0.18 − 0.197), but some are far fromthe centre: 52 Hα emitters are found within a (projected) radius of 2.5 Mpc from the cluster“centre", defined as in Stroe et al. (2015) (RA[J2000] 22:42:45.6, Dec[J2000] +53:03:10.8),while 44 are within a 2 Mpc (projected) radius, 36 are within a 1.5 Mpc (projected) radius.
8.2.5 Multiband photometry and stellar masses
We use multi-band catalogues derived in Stroe et al. (2015) to obtain information on all theemitters and here we explore the BgVrIz photometry to compute stellar masses by spectralenergy distribution (SED) fitting. All the photometry is corrected for Galactic extinction (seedetails in Stroe et al. 2015). We use the spectroscopic redshift of each source, but usingz = 0.19 for all sources does not significantly change any of the results. We compute stellarmasses for all candidate Hα emitters, regardless of having been targeted spectroscopically ornot, so we can compare our spectroscopic sample with the full parent sample. The full sampleis explored in Stroe et al. (2015).
Stellar masses are obtained by SED fitting of stellar population synthesis models to BgVrIz,following Sobral et al. (2011); Sobral et al. (2014). The SED templates are generated with theBruzual & Charlot (2003) package using Bruzual (2007) models, a Chabrier (2003) IMF, andexponentially declining star formation histories with the form e−t/τ, with τ in the range 0.1Gyrs to 10 Gyrs. The SEDs were generated for a logarithmic grid of 200 ages (from 0.1
8.2. SAMPLE SELECTION, OBSERVATIONS & DATA REDUCTION 13
Myr to the maximum age at z = 0.19). Dust extinction was applied to the templates usingthe Calzetti et al. (2000) law with E(B − V) in the range 0 to 0.5 (in steps of 0.05), roughlycorresponding to AHff ∼ 0 − 2. The models are generated with five different metallicities(Z = 0.0001 − 0.05), including solar (Z = 0.02). Here we use the best-fit template to obtainour estimate of stellar mass, but we also compute the median stellar mass across all solutionsin the entire multi-dimensional parameter space for each source, which lie within 1σ of thebest-fit and thus also obtain the median mass of the 1σ best-fits.
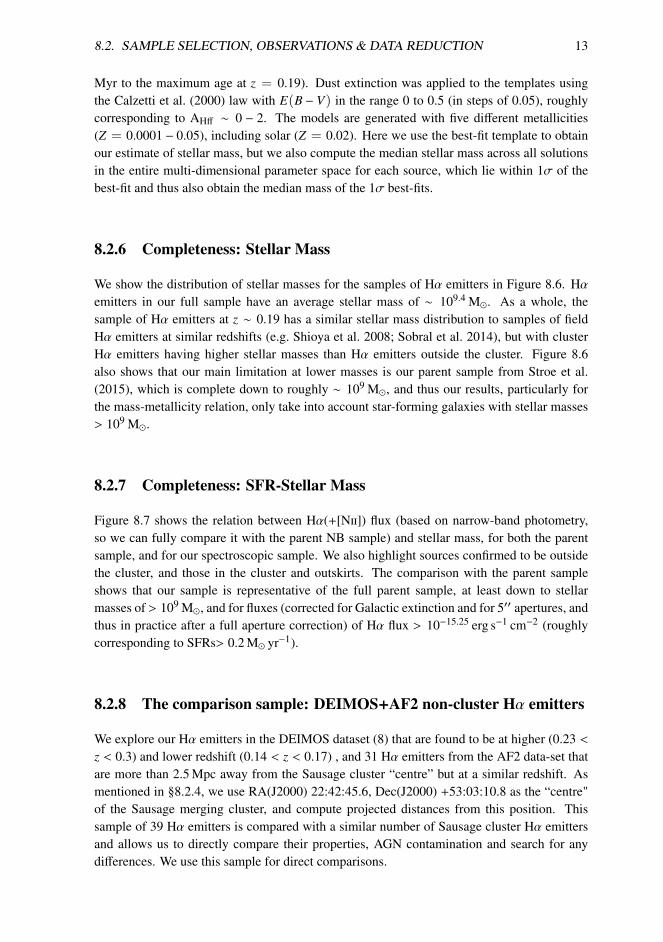
8.2.6 Completeness: Stellar Mass
We show the distribution of stellar masses for the samples of Hα emitters in Figure 8.6. Hαemitters in our full sample have an average stellar mass of ∼ 109.4 M. As a whole, thesample of Hα emitters at z ∼ 0.19 has a similar stellar mass distribution to samples of fieldHα emitters at similar redshifts (e.g. Shioya et al. 2008; Sobral et al. 2014), but with clusterHα emitters having higher stellar masses than Hα emitters outside the cluster. Figure 8.6also shows that our main limitation at lower masses is our parent sample from Stroe et al.(2015), which is complete down to roughly ∼ 109 M, and thus our results, particularly forthe mass-metallicity relation, only take into account star-forming galaxies with stellar masses> 109 M.
8.2.7 Completeness: SFR-Stellar Mass
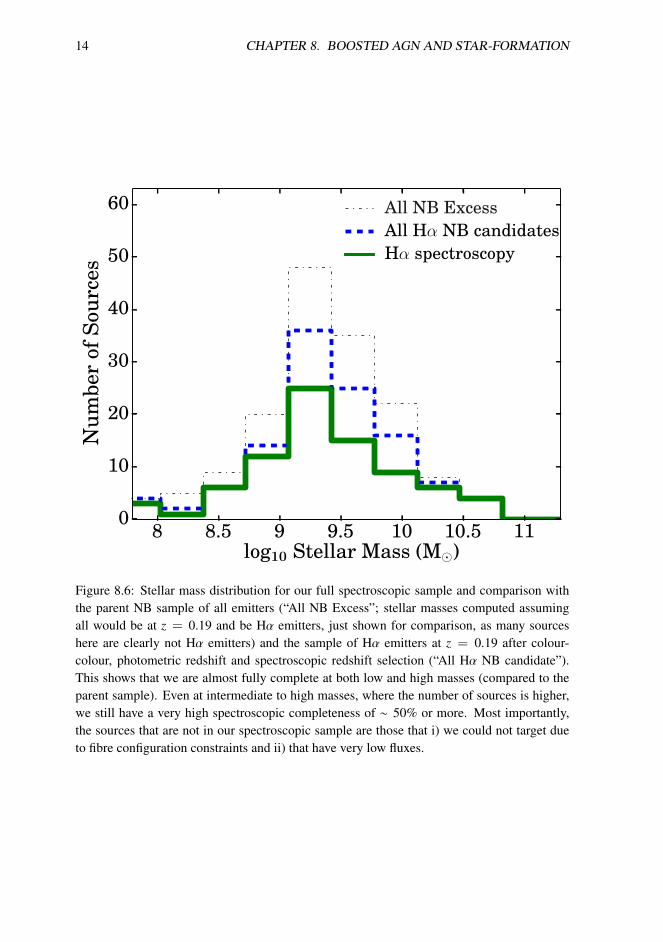
Figure 8.7 shows the relation between Hα(+[Nii]) flux (based on narrow-band photometry,so we can fully compare it with the parent NB sample) and stellar mass, for both the parentsample, and for our spectroscopic sample. We also highlight sources confirmed to be outsidethe cluster, and those in the cluster and outskirts. The comparison with the parent sampleshows that our sample is representative of the full parent sample, at least down to stellarmasses of > 109 M, and for fluxes (corrected for Galactic extinction and for 5′′ apertures, andthus in practice after a full aperture correction) of Hα flux > 10−15.25 erg s−1 cm−2 (roughlycorresponding to SFRs> 0.2 M yr−1).
8.2.8 The comparison sample: DEIMOS+AF2 non-cluster Hα emitters
We explore our Hα emitters in the DEIMOS dataset (8) that are found to be at higher (0.23 <z < 0.3) and lower redshift (0.14 < z < 0.17) , and 31 Hα emitters from the AF2 data-set thatare more than 2.5 Mpc away from the Sausage cluster “centre” but at a similar redshift. Asmentioned in §8.2.4, we use RA(J2000) 22:42:45.6, Dec(J2000) +53:03:10.8 as the “centre"of the Sausage merging cluster, and compute projected distances from this position. Thissample of 39 Hα emitters is compared with a similar number of Sausage cluster Hα emittersand allows us to directly compare their properties, AGN contamination and search for anydifferences. We use this sample for direct comparisons.
14 CHAPTER 8. BOOSTED AGN AND STAR-FORMATION
8 8.5 9 9.5 10 10.5 11log10 Stellar Mass (M⊙)
0
10
20
30
40
50
60
Num
ber
ofSo
urce
s
All NB ExcessAll Hα NB candidatesHα spectroscopy
Figure 8.6: Stellar mass distribution for our full spectroscopic sample and comparison withthe parent NB sample of all emitters (“All NB Excess”; stellar masses computed assumingall would be at z = 0.19 and be Hα emitters, just shown for comparison, as many sourceshere are clearly not Hα emitters) and the sample of Hα emitters at z = 0.19 after colour-colour, photometric redshift and spectroscopic redshift selection (“All Hα NB candidate”).This shows that we are almost fully complete at both low and high masses (compared to theparent sample). Even at intermediate to high masses, where the number of sources is higher,we still have a very high spectroscopic completeness of ∼ 50% or more. Most importantly,the sources that are not in our spectroscopic sample are those that i) we could not target dueto fibre configuration constraints and ii) that have very low fluxes.
8.2. SAMPLE SELECTION, OBSERVATIONS & DATA REDUCTION 15
8.0 8.5 9.0 9.5 10.0 10.5 11.0log Stellar Mass (M⊙)
-15.4
-15.2
-15.0
-14.8
-14.6
-14.4
-14.2
-14.0
log
Hα
+[N
II](
erg
s−1cm
−2) Hα spectroscopic sample (Cluster+Outskirts)
Hα spectroscopic sample (Outside)Hα (NB sample)
Figure 8.7: The relation between Hα+[Nii] flux (corrected for Galactic extinction, but notcorrected for intrinsic dust extinction), based on 5′′ narrow-band photometry and stellar mass,for the parent sample, selected using narrow-band, and our spectroscopic sample. Our spec-troscopically confirmed sources sample the vast majority of the parameter space, both forgalaxies in the cluster (R < 1.5 Mpc) and outskirts (1.5 < R < 2.5 Mpc) and for those out-side the cluster. We are particularly complete, relative to the parent sample, for stellar masses> 109 M. We preferentially miss sources with the lowest fluxes and with stellar masses lowerthan ∼ 109 M.
16 CHAPTER 8. BOOSTED AGN AND STAR-FORMATION
0.05 0.1 0.2 0.4 0.8 1.6[NII]/Hα
0.1
1.0
10.0
[OII
I]/H
β
60 000 KKewley+
AGN (cluster)Star-forming (cluster)Unclassified (cluster)
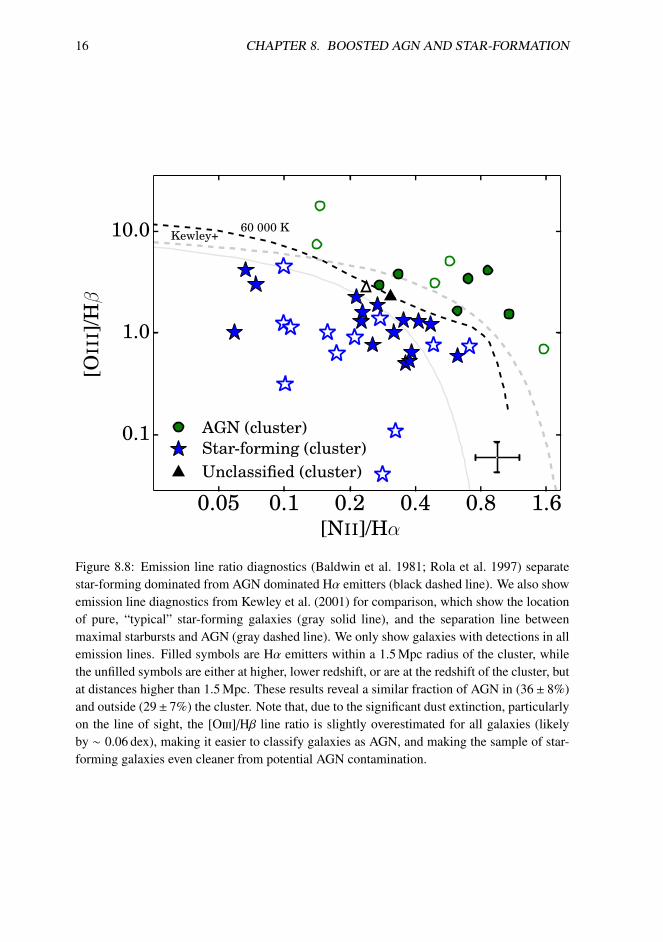
Figure 8.8: Emission line ratio diagnostics (Baldwin et al. 1981; Rola et al. 1997) separatestar-forming dominated from AGN dominated Hα emitters (black dashed line). We also showemission line diagnostics from Kewley et al. (2001) for comparison, which show the locationof pure, “typical” star-forming galaxies (gray solid line), and the separation line betweenmaximal starbursts and AGN (gray dashed line). We only show galaxies with detections in allemission lines. Filled symbols are Hα emitters within a 1.5 Mpc radius of the cluster, whilethe unfilled symbols are either at higher, lower redshift, or are at the redshift of the cluster, butat distances higher than 1.5 Mpc. These results reveal a similar fraction of AGN in (36 ± 8%)and outside (29± 7%) the cluster. Note that, due to the significant dust extinction, particularlyon the line of sight, the [Oiii]/Hβ line ratio is slightly overestimated for all galaxies (likelyby ∼ 0.06 dex), making it easier to classify galaxies as AGN, and making the sample of star-forming galaxies even cleaner from potential AGN contamination.
8.3. RESULTS 17
6500 6550 6600 6650 6700 6750Restframe Wavelength (A)
0.1
0.3
0.5
0.7
0.9
1.1
Nor
mal
ised
Flux
[NII
]H
α
[NII
]
[SII
][S
II]
4800 4850 4900 4950 5000 5050 5100Restframe Wavelength (A)
0.1
0.3
0.5
0.7
0.9
1.1
Nor
mal
ised
Flux
Hβ
[OII
I]
[OII
I]
6500 6550 6600 6650 6700 6750Restframe Wavelength (A)
0.1
0.3
0.5
0.7
0.9
1.1
Nor
mal
ised
Flux
[NII
]H
α
[NII
]
[SII
][S
II]
4800 4850 4900 4950 5000 5050 5100Restframe Wavelength (A)
0.1
0.3
0.5
0.7
0.9
1.1
Nor
mal
ised
Flux
Hβ
[OII
I]
[OII
I]
6500 6550 6600 6650 6700 6750Restframe Wavelength (A)
0.1
0.3
0.5
0.7
0.9
1.1
Nor
mal
ised
Flux
[NII
]H
α
[NII
]
[SII
][S
II]
4800 4850 4900 4950 5000 5050 5100Restframe Wavelength (A)
0.1
0.3
0.5
0.7
0.9
1.1
Nor
mal
ised
Flux
Hβ
[OII
I]
[OII
I]
6500 6550 6600 6650 6700 6750Restframe Wavelength (A)
0.1
0.3
0.5
0.7
0.9
1.1
Nor
mal
ised
Flux
[NII
]H
α
[NII
]
[SII
][S
II]
4800 4850 4900 4950 5000 5050 5100Restframe Wavelength (A)
0.1
0.3
0.5
0.7
0.9
1.1
Nor
mal
ised
Flux
Hβ
[OII
I]
[OII
I]
6500 6550 6600 6650 6700 6750Restframe Wavelength (A)
0.1
0.3
0.5
0.7
0.9
1.1
Nor
mal
ised
Flux
[NII
]H
α
[NII
]
[SII
][S
II]
4800 4850 4900 4950 5000 5050 5100Restframe Wavelength (A)
0.1
0.3
0.5
0.7
0.9
1.1
Nor
mal
ised
Flux
Hβ
[OII
I]
[OII
I]
6500 6550 6600 6650 6700 6750Restframe Wavelength (A)
0.1
0.3
0.5
0.7
0.9
1.1
Nor
mal
ised
Flux
[NII
]H
α
[NII
]
[SII
][S
II]
4800 4850 4900 4950 5000 5050 5100Restframe Wavelength (A)
0.1
0.3
0.5
0.7
0.9
1.1
Nor
mal
ised
Flux
Hβ
[OII
I]
[OII
I]
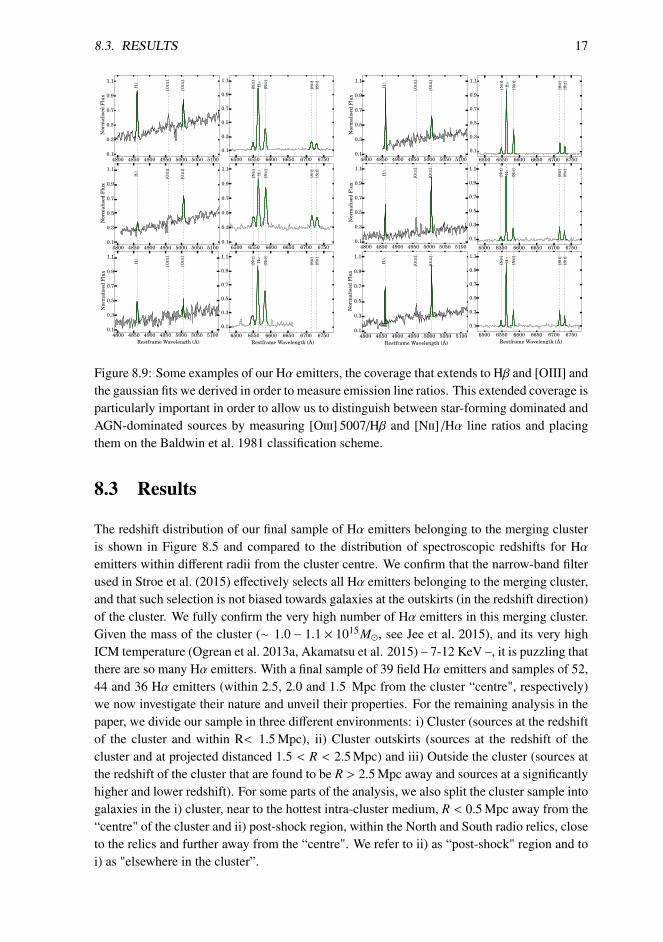
Figure 8.9: Some examples of our Hα emitters, the coverage that extends to Hβ and [OIII] andthe gaussian fits we derived in order to measure emission line ratios. This extended coverage isparticularly important in order to allow us to distinguish between star-forming dominated andAGN-dominated sources by measuring [Oiii] 5007/Hβ and [Nii] /Hα line ratios and placingthem on the Baldwin et al. 1981 classification scheme.
8.3 Results
The redshift distribution of our final sample of Hα emitters belonging to the merging clusteris shown in Figure 8.5 and compared to the distribution of spectroscopic redshifts for Hαemitters within different radii from the cluster centre. We confirm that the narrow-band filterused in Stroe et al. (2015) effectively selects all Hα emitters belonging to the merging cluster,and that such selection is not biased towards galaxies at the outskirts (in the redshift direction)of the cluster. We fully confirm the very high number of Hα emitters in this merging cluster.Given the mass of the cluster (∼ 1.0 − 1.1 × 10¹⁵M, see Jee et al. 2015), and its very highICM temperature (Ogrean et al. 2013a, Akamatsu et al. 2015) – 7-12 KeV –, it is puzzling thatthere are so many Hα emitters. With a final sample of 39 field Hα emitters and samples of 52,44 and 36 Hα emitters (within 2.5, 2.0 and 1.5 Mpc from the cluster “centre", respectively)we now investigate their nature and unveil their properties. For the remaining analysis in thepaper, we divide our sample in three different environments: i) Cluster (sources at the redshiftof the cluster and within R< 1.5 Mpc), ii) Cluster outskirts (sources at the redshift of thecluster and at projected distanced 1.5 < R < 2.5 Mpc) and iii) Outside the cluster (sources atthe redshift of the cluster that are found to be R > 2.5 Mpc away and sources at a significantlyhigher and lower redshift). For some parts of the analysis, we also split the cluster sample intogalaxies in the i) cluster, near to the hottest intra-cluster medium, R < 0.5 Mpc away from the“centre" of the cluster and ii) post-shock region, within the North and South radio relics, closeto the relics and further away from the “centre". We refer to ii) as “post-shock" region and toi) as "elsewhere in the cluster”.
18 CHAPTER 8. BOOSTED AGN AND STAR-FORMATION
8.3.1 Nature of Hα emitters: SF vs AGN
In order to differentiate between star-forming and AGN, the [Oiii] 5007/Hβ and [Nii] 5007/Hαline ratios were used (see Figure 8.8); these have been widely used to separate AGN from star-forming galaxies (e.g. Baldwin et al. 1981; Rola et al. 1997; Kewley et al. 2001, 2013). Weshow some examples of spectra in Figure 8.9. These line ratios are also for emission lines suf-ficiently close that dust extinction has little effect. However, for the case of the [Oiii] 5007/Hβemission line ratios, due to the significant total dust extinction affecting our galaxies, particu-larly due to the Galaxy, line ratios may be over-estimated by ∼ 0.06 dex. Because we do notcorrect for this, the [Oiii] 5007/Hβ line ratios are all closer to AGN. This means, however, thatour sample of star-forming galaxies will be even more conservative and robust (if anything,some star-forming galaxies may be classified as AGN). Because corrections are relatively un-reliable, and because applying unreliable corrections could lead to including potential AGN inour samples of star-forming galaxies, we opted not to correct for this effect. Only spectra withall lines detected at S/N> 3.0 were used, but we also place limits on those with lower S/N.Figure 8.8 shows data-points for the line ratios, while the black dashed curve shown representmaximum line ratios for a star-forming galaxy (from OB stars with effective temperatures of60000 K; Baldwin et al. 1981; Rola et al. 1997). We also show curves from Kewley et al.(2001) and Kewley et al. (2013) encompassing “pure”, “typical” star-forming galaxies (graysolid line), and encompassing up to maximal starbursts (gray dashed line).
Over our full AF2 and DEIMOS sample, we find 4 broad line AGNs. All these broadline AGNs are found to be in the cluster. Furthermore, in total, we have measurements of[Oiii] 5007/Hβ and [Nii] /Hα line ratios with individual line detections above 3σ which allowus to distinguish between AGN and SF for 42 sources. For these 42 sources, we find 14 AGN(10 narrow-line AGN and 4 BL-AGN), and 28 likely star-forming dominated Hα emitters. Weshow the location of these sources in Figure 8.1, revealing that AGN in the cluster are all inthe post-shock regions, just behind both the North and South radio relics/shock fronts.
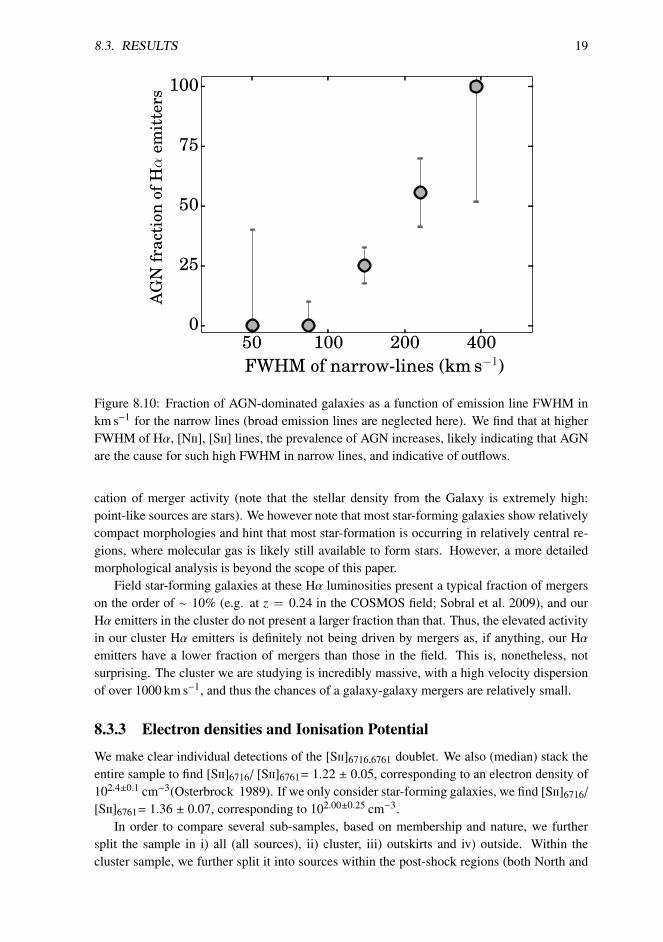
For the sources we can classify we also have measured the FWHM of the narrow emissionlines. We show the fraction of AGN sources as a function of FWHM of the narrow lines inFigure 8.10. This clearly shows that at the highest FWHM, the AGN fraction is very high.We note that these are FWHM of narrow lines, and thus this is likely indicative of outflowshappening in the AGN in our sample, dominated by those in the Sausage cluster.
We split sources between those in the cluster (see Figure 8.1) and outskirts (25 classifiedsources) and those outside the cluster (17 classified sources). We find 9/25 sources in thecluster+outskirts to be AGN (including the 4 broad-line AGN), resulting in an AGN fractionof 36 ± 8 % (Poissonian errors), while outside the cluster we find 5/17 sources to be AGN,resulting in an AGN fraction of 29 ± 7 %, lower than in the cluster, but still consistent. Itshould be noted that both samples have very similar median Hα luminosities, and thus shouldbe fully comparable. For Hα emitters within the Sausage merging cluster (R< 1.5 Mpc), wefind an AGN fraction of 35 ± 6% (see Figure 8.1).
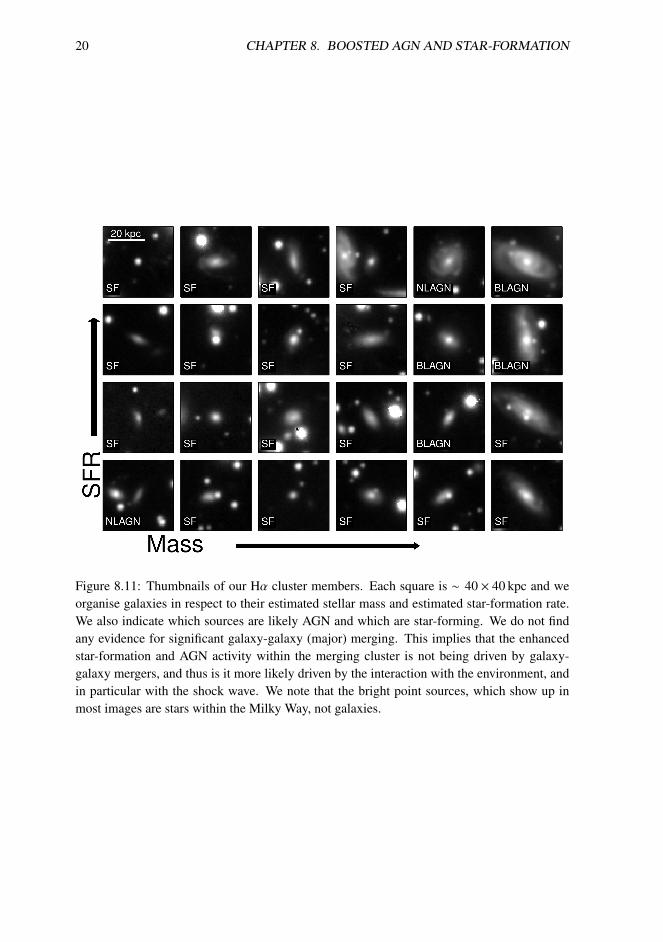
8.3.2 Morphologies
By exploring deep i band Subaru images (see also Stroe et al. (2014a)), we investigate themorphologies of our Hα emitters. We show thumbnails of all our Hα cluster galaxies, alsolabelling them as AGN or star-forming galaxies, in Figure 8.3.2. We find little to no indi-
8.3. RESULTS 19
50 100 200 400FWHM of narrow-lines (km s−1)
0
25
50
75
100
AG
Nfr
acti
onof
Hα
emit
ters
Figure 8.10: Fraction of AGN-dominated galaxies as a function of emission line FWHM inkm s−1 for the narrow lines (broad emission lines are neglected here). We find that at higherFWHM of Hα, [Nii], [Sii] lines, the prevalence of AGN increases, likely indicating that AGNare the cause for such high FWHM in narrow lines, and indicative of outflows.
cation of merger activity (note that the stellar density from the Galaxy is extremely high:point-like sources are stars). We however note that most star-forming galaxies show relativelycompact morphologies and hint that most star-formation is occurring in relatively central re-gions, where molecular gas is likely still available to form stars. However, a more detailedmorphological analysis is beyond the scope of this paper.
Field star-forming galaxies at these Hα luminosities present a typical fraction of mergerson the order of ∼ 10% (e.g. at z = 0.24 in the COSMOS field; Sobral et al. 2009), and ourHα emitters in the cluster do not present a larger fraction than that. Thus, the elevated activityin our cluster Hα emitters is definitely not being driven by mergers as, if anything, our Hαemitters have a lower fraction of mergers than those in the field. This is, nonetheless, notsurprising. The cluster we are studying is incredibly massive, with a high velocity dispersionof over 1000 km s−1, and thus the chances of a galaxy-galaxy mergers are relatively small.
8.3.3 Electron densities and Ionisation Potential
We make clear individual detections of the [Sii]6716,6761 doublet. We also (median) stack theentire sample to find [Sii]6716/ [Sii]6761= 1.22 ± 0.05, corresponding to an electron density of102.4±0.1 cm−3(Osterbrock 1989). If we only consider star-forming galaxies, we find [Sii]6716/
[Sii]6761= 1.36 ± 0.07, corresponding to 102.00±0.25 cm−3.In order to compare several sub-samples, based on membership and nature, we further
split the sample in i) all (all sources), ii) cluster, iii) outskirts and iv) outside. Within thecluster sample, we further split it into sources within the post-shock regions (both North and
20 CHAPTER 8. BOOSTED AGN AND STAR-FORMATION
Figure 8.11: Thumbnails of our Hα cluster members. Each square is ∼ 40 × 40 kpc and weorganise galaxies in respect to their estimated stellar mass and estimated star-formation rate.We also indicate which sources are likely AGN and which are star-forming. We do not findany evidence for significant galaxy-galaxy (major) merging. This implies that the enhancedstar-formation and AGN activity within the merging cluster is not being driven by galaxy-galaxy mergers, and thus is it more likely driven by the interaction with the environment, andin particular with the shock wave. We note that the bright point sources, which show up inmost images are stars within the Milky Way, not galaxies.
8.3. RESULTS 21
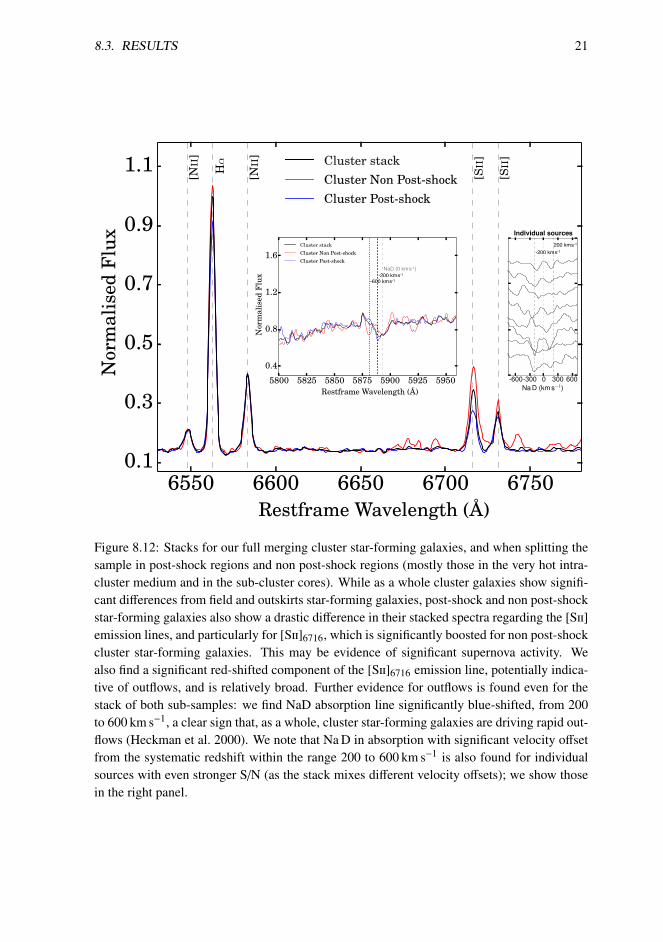
6550 6600 6650 6700 6750Restframe Wavelength (A)
0.1
0.3
0.5
0.7
0.9
1.1
Nor
mal
ised
Flux
[NII
]
Hα
[NII
]
[SII
]
[SII
]Cluster stackCluster Non Post-shockCluster Post-shock
5800 5825 5850 5875 5900 5925 5950Restframe Wavelength (A)
0.4
0.8
1.2
1.6N
orm
alis
edFl
uxCluster stackCluster Non Post-shockCluster Post-shock
-200 km s-1NaD (0 km s-1)
-600 km s-1
-600-300 0 300 600Na D (km s1)
0.0
1.0
2.0
3.0
Nor
mal
ised
Flux
Hb
[OIII
]
[OIII
]
Mg
I(b)
FeI
[NII
]
H↵
[NII
]
[SII
]
[SII
]
-200 km s-1
200 km s-1
Individual sources
Figure 8.12: Stacks for our full merging cluster star-forming galaxies, and when splitting thesample in post-shock regions and non post-shock regions (mostly those in the very hot intra-cluster medium and in the sub-cluster cores). While as a whole cluster galaxies show signifi-cant differences from field and outskirts star-forming galaxies, post-shock and non post-shockstar-forming galaxies also show a drastic difference in their stacked spectra regarding the [Sii]emission lines, and particularly for [Sii]6716, which is significantly boosted for non post-shockcluster star-forming galaxies. This may be evidence of significant supernova activity. Wealso find a significant red-shifted component of the [Sii]6716 emission line, potentially indica-tive of outflows, and is relatively broad. Further evidence for outflows is found even for thestack of both sub-samples: we find NaD absorption line significantly blue-shifted, from 200to 600 km s−1, a clear sign that, as a whole, cluster star-forming galaxies are driving rapid out-flows (Heckman et al. 2000). We note that Na D in absorption with significant velocity offsetfrom the systematic redshift within the range 200 to 600 km s−1 is also found for individualsources with even stronger S/N (as the stack mixes different velocity offsets); we show thosein the right panel.
22 CHAPTER 8. BOOSTED AGN AND STAR-FORMATION
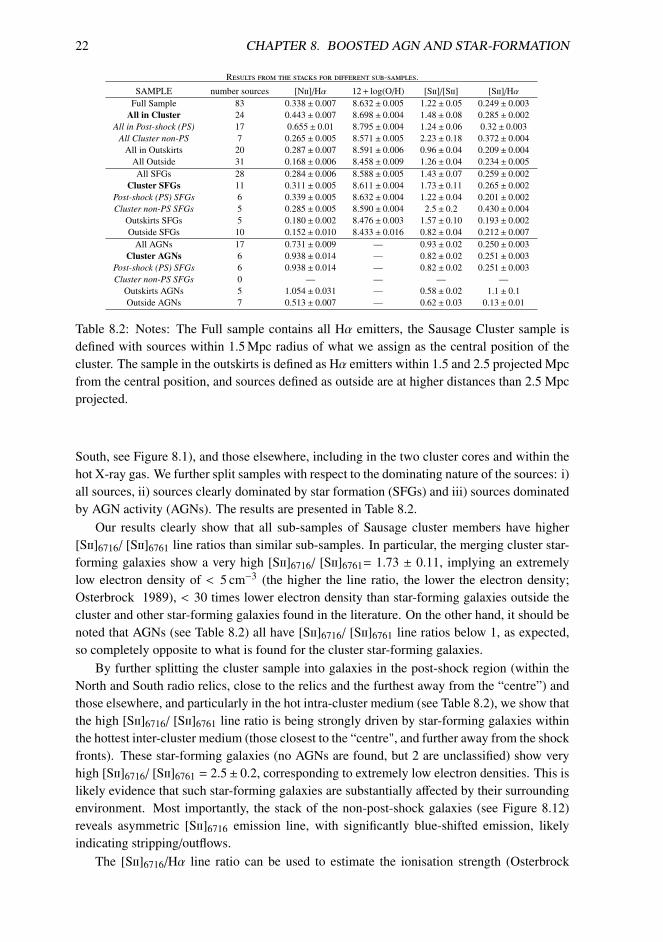
Results from the stacks for different sub-samples.
SAMPLE number sources [Nii]/Hα 12 + log(O/H) [Sii]/[Sii] [Sii]/HαFull Sample 83 0.338 ± 0.007 8.632 ± 0.005 1.22 ± 0.05 0.249 ± 0.003
All in Cluster 24 0.443 ± 0.007 8.698 ± 0.004 1.48 ± 0.08 0.285 ± 0.002All in Post-shock (PS) 17 0.655 ± 0.01 8.795 ± 0.004 1.24 ± 0.06 0.32 ± 0.003
All Cluster non-PS 7 0.265 ± 0.005 8.571 ± 0.005 2.23 ± 0.18 0.372 ± 0.004All in Outskirts 20 0.287 ± 0.007 8.591 ± 0.006 0.96 ± 0.04 0.209 ± 0.004
All Outside 31 0.168 ± 0.006 8.458 ± 0.009 1.26 ± 0.04 0.234 ± 0.005All SFGs 28 0.284 ± 0.006 8.588 ± 0.005 1.43 ± 0.07 0.259 ± 0.002
Cluster SFGs 11 0.311 ± 0.005 8.611 ± 0.004 1.73 ± 0.11 0.265 ± 0.002Post-shock (PS) SFGs 6 0.339 ± 0.005 8.632 ± 0.004 1.22 ± 0.04 0.201 ± 0.002Cluster non-PS SFGs 5 0.285 ± 0.005 8.590 ± 0.004 2.5 ± 0.2 0.430 ± 0.004
Outskirts SFGs 5 0.180 ± 0.002 8.476 ± 0.003 1.57 ± 0.10 0.193 ± 0.002Outside SFGs 10 0.152 ± 0.010 8.433 ± 0.016 0.82 ± 0.04 0.212 ± 0.007
All AGNs 17 0.731 ± 0.009 — 0.93 ± 0.02 0.250 ± 0.003Cluster AGNs 6 0.938 ± 0.014 — 0.82 ± 0.02 0.251 ± 0.003
Post-shock (PS) SFGs 6 0.938 ± 0.014 — 0.82 ± 0.02 0.251 ± 0.003Cluster non-PS SFGs 0 — — — —
Outskirts AGNs 5 1.054 ± 0.031 — 0.58 ± 0.02 1.1 ± 0.1Outside AGNs 7 0.513 ± 0.007 — 0.62 ± 0.03 0.13 ± 0.01
Table 8.2: Notes: The Full sample contains all Hα emitters, the Sausage Cluster sample isdefined with sources within 1.5 Mpc radius of what we assign as the central position of thecluster. The sample in the outskirts is defined as Hα emitters within 1.5 and 2.5 projected Mpcfrom the central position, and sources defined as outside are at higher distances than 2.5 Mpcprojected.
South, see Figure 8.1), and those elsewhere, including in the two cluster cores and within thehot X-ray gas. We further split samples with respect to the dominating nature of the sources: i)all sources, ii) sources clearly dominated by star formation (SFGs) and iii) sources dominatedby AGN activity (AGNs). The results are presented in Table 8.2.
Our results clearly show that all sub-samples of Sausage cluster members have higher[Sii]6716/ [Sii]6761 line ratios than similar sub-samples. In particular, the merging cluster star-forming galaxies show a very high [Sii]6716/ [Sii]6761= 1.73 ± 0.11, implying an extremelylow electron density of < 5 cm−3 (the higher the line ratio, the lower the electron density;Osterbrock 1989), < 30 times lower electron density than star-forming galaxies outside thecluster and other star-forming galaxies found in the literature. On the other hand, it should benoted that AGNs (see Table 8.2) all have [Sii]6716/ [Sii]6761 line ratios below 1, as expected,so completely opposite to what is found for the cluster star-forming galaxies.
By further splitting the cluster sample into galaxies in the post-shock region (within theNorth and South radio relics, close to the relics and the furthest away from the “centre”) andthose elsewhere, and particularly in the hot intra-cluster medium (see Table 8.2), we show thatthe high [Sii]6716/ [Sii]6761 line ratio is being strongly driven by star-forming galaxies withinthe hottest inter-cluster medium (those closest to the “centre", and further away from the shockfronts). These star-forming galaxies (no AGNs are found, but 2 are unclassified) show veryhigh [Sii]6716/ [Sii]6761 = 2.5± 0.2, corresponding to extremely low electron densities. This islikely evidence that such star-forming galaxies are substantially affected by their surroundingenvironment. Most importantly, the stack of the non-post-shock galaxies (see Figure 8.12)reveals asymmetric [Sii]6716 emission line, with significantly blue-shifted emission, likelyindicating stripping/outflows.
The [Sii]6716/Hα line ratio can be used to estimate the ionisation strength (Osterbrock
8.3. RESULTS 23
1989; Collins & Rand 2001) of the inter-stellar medium (ISM). We derive, for our full sam-ple (median stack), [Sii]6716/Hα = 0.249 ± 0.003 (see Table 8.2), which corresponds to anionisation parameter log10(U, cm3) = −4.06 ± 0.05 (Collins & Rand 2001). Cluster mem-bers show the highest [Sii]6716/Hα ratios. Focusing on the Hα star-forming galaxies in theSausage merging cluster, we find [Sii]6716/Hα = 0.265 ± 0.002, which corresponds to a ioni-sation strength of the ISM about half of that of the field and outskirts sample. However, Hαstar-forming galaxies in the outskirts and outside the cluster are significantly more metal poor(see §8.3.5), which is enough to explain the difference. When matched in metallicities, wefind no significant difference within the errors.
When we further split the cluster sample into sources in the post-shock region and thoseelsewhere (mostly in the hottest X-ray gas region, near the “centre" of the cluster and/or in thesub-cluster cores), we find that the high [Sii]6716/Hα ratio within the cluster is mostly drivenby cluster star-forming galaxies outside the post-shock region, again indicating that thesegalaxies are affected by their surroundings. In practice, with a [Sii]6716/Hα= 0.430 ± 0.004,cluster star-forming galaxies away from the post-shock regions have an ionisation parameterlog10(U, cm3) = −4.5 ± 0.05, more than 4 times lower than all other star-forming galaxies inthe cluster. This could be interpreted as further evidence that these galaxies are already hav-ing their star-formation activity quenched. However, we note that this very high [Sii]6716/Hαratio could also be interpreted as a significant contribution from supernova remnants. Sincewe do not find any difference in the typical SFRs of these galaxies relative to the other star-forming galaxies in and outside the cluster, the supernova explanation is strongly favoured.Furthermore, as we find evidence for outflows (see Figure 8.12), both in redshifted [Sii]6716
emission, but particularly in strongly blue-shifted Na D (see e.g. Heckman et al. 2000) ab-sorption (∼ 600 km −1) for these star-forming galaxies, it may well be that these outflows arebeing driven by supernovae.
8.3.4 Outflows
Particularly focusing on the Keck/DEIMOS sample (where the S/N is the highest, detectingthe continuum for the bulk of the sample), we inspect the Hα, [Nii] and [Sii] lines to lookfor asymmetric profiles, broad components (for the forbidden lines) and P Cygni profiles,all potential signatures of strong outflows. We find strong evidence for at least one of suchsignatures in 7 of our 24 cluster galaxies, while we find no such signatures for galaxies outsidethe cluster (but the Keck/DEIMOS sample outside is smaller). For the Keck/DEIMOS sampleonly (as it is the only data-set that actually allows us to detect such signatures at the necessarilyhigh S/N in a complete way), we find such signatures in ∼ 22 % of the cluster sample, and100% of these are in the post-shock regions (see Figure 8.1). For the 7 sources, the absorptionfeatures show offsets of 600-1000 km/s. Many of these are AGNs and, as discussed in §8.3.1,all cluster AGNs are in the post shock-front regions of both north and south relics/shock-waves(see Figure 8.1).
We also attempt to fit emission lines with a combination of a narrow and a broad compo-nent. Whenever the S/N for the bluer lines (Hβ and [Oiii]) is lower than 10 we use only Hα,[Nii] and [Sii]. We find that a single Gaussian profile (with a FWHM of up to 500 km s−1) isable to fully fit all the spectra apart from the BL-AGNs. This also holds true for the stacks. Wenote that given the lower spectral resolution of WHT/AF2 when compared to Keck/DEIMOS
24 CHAPTER 8. BOOSTED AGN AND STAR-FORMATION
(and lower S/N per Å, see e.g. Figure 8.4), we find that we can only reliably measure FWHMof emission lines with AF2 if they are larger than 160 km s−1. With DEIMOS, we can measureFWHM down to 60-80 km s−1. For the Keck/DEIMOS sample, we find that that the averageFWHM is 156 ± 84 km s−1 (for AF2 we find an average of 174 ± 70 km s−1). The line ra-tios and other properties for our full sample are given in Table 8.1. We find that the fractionof AGN correlates with increasing FWHM of narrow lines (see Figure 8.10), indicating thatAGN are likely driving strong outflows.
Finally, for the sources with the highest S/N in the continuum, for which we can de-tect clear absorption lines, we also measure systematic velocity offsets from the absorp-tion and emission lines. We find strong evidence for outflows (see Figure 8.12), both inredshifted [Sii]6716 emission, but particularly in strongly blue-shifted Na D absorption (∼200 − 600 km −1) for cluster star-forming galaxies as a whole (median stack). We also lookat Na D in absorption which may be offset significantly on a source by source basis. We dothis by fitting Na D with a Gaussian profile, and then comparing net velocity offsets whencompared to the median redshift given by all the emission lines. We find strong evidence foroutflows in all cluster star-forming galaxies except one (see Figure 8.12). We find an averagevelocity offset of 210±70 km s−1, in line with the stack. The most important result is that thevast majority of the Sausage merging cluster star-forming galaxies are driving strong outflows,and thus are experiencing (stellar) feedback. An alternative would be that these galaxies arehaving their gas stripped into the intra-cluster medium. However, if the latter was the case,one would expect that the velocity offsets would largely average out to zero, since the relativemotion of the galaxies with respect to the gas should be random. We therefore argue that it ismuch more likely that we are witnessing strong stellar feedback which, of course, given theenvironment, will likely mean all the gas is permanently removed from the galaxies.
8.3.5 Metallicities
We use the [Nii]/Hα emission line ratio to infer the metallicity of the gas for each star-forminggalaxy (AGNs are neglected). We obtain metallicities for each star-forming source, but alsofor sub-samples: see Table 8.2. For our full sample (median stack), we find [Nii] / Hα= 0.338±0.007. The [Nii]/Hα line ratio can be used to obtain the metallicity of our star-forming galax-ies (oxygen abundance), [12 + log(O/H)], by using the conversion of Pettini & Pagel (2004):12 + log(O/H) = 8.9 + 0.57 log([Nii] / Hα). The galaxies in our full sample (without excludingAGN) have a median metallicity of 8.632± 0.005, which is consistent with solar (8.66±0.05),but we note that we are sampling galaxies with a range of masses, and thus we need to takethat into account when properly comparing the samples – this is done in §8.3.6.
Our results reveal that cluster Hα emitters have the highest [Nii] / Hα= 0.443 ± 0.007 lineratios. However, AGN typically have high [Nii] / Hα line ratios, and it is mandatory to ex-clude them if metallicities are to be robustly estimated from this line ratio. Nevertheless,even when considering only Hα star-forming galaxies (in the cluster, outskirts or field), wefind cluster star-forming galaxies to be significantly metal rich, with a median metallicity12 + log(O/H) =8.611 ± 0.004, which compares with 12 + log(O/H) =8.476 ± 0.003 for thecluster outskirts and 12 + log(O/H) =8.433 ± 0.016 for outside the cluster. Our results thusclearly indicate that star-forming galaxies in the merging clusters are significantly metal rich,practically solar, being about ∼ 0.15 dex more metal rich than other star-forming galaxies
8.3. RESULTS 25
9.0 9.3 9.6 9.9 10.2 10.5 10.8log Stellar Mass (M⊙)
8.0
8.2
8.4
8.6
8.8
12+l
og(O
/H)
([NII
]/Hα
)
Merging cluster stackBest fit (cluster)Outside cluster stackBest fit (outside)SDSS z = 0.07 (Maiolino+2008)z ∼ 0.7 (Maiolino+2008)
9.0 9.3 9.6 9.9 10.2 10.5 10.8log Stellar Mass (M⊙)
8.0
8.2
8.4
8.6
8.8
9.0
12+l
og(O
/H)
([NII
]/Hα
)
Hα (Cluster, SFG)Hα (Cluster, AGN)Hα (Outside, SFG)Hα (Outside, AGN)
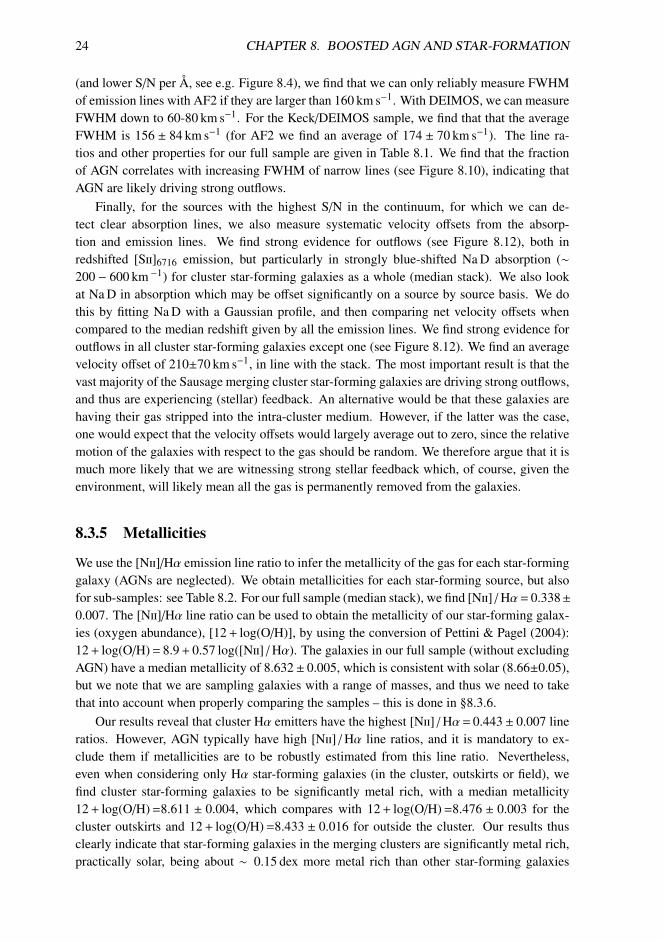
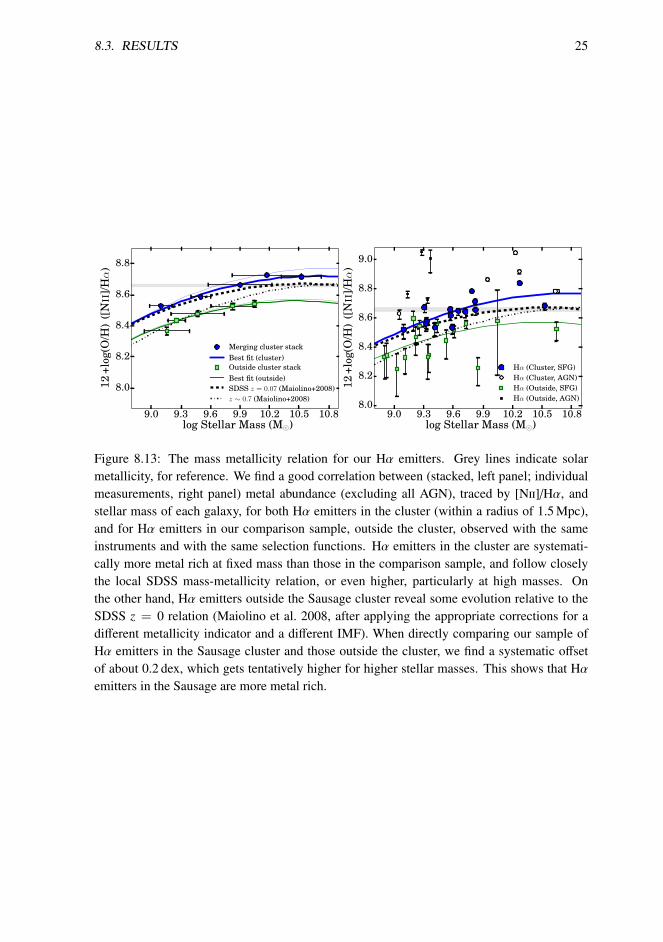
Figure 8.13: The mass metallicity relation for our Hα emitters. Grey lines indicate solarmetallicity, for reference. We find a good correlation between (stacked, left panel; individualmeasurements, right panel) metal abundance (excluding all AGN), traced by [Nii]/Hα, andstellar mass of each galaxy, for both Hα emitters in the cluster (within a radius of 1.5 Mpc),and for Hα emitters in our comparison sample, outside the cluster, observed with the sameinstruments and with the same selection functions. Hα emitters in the cluster are systemati-cally more metal rich at fixed mass than those in the comparison sample, and follow closelythe local SDSS mass-metallicity relation, or even higher, particularly at high masses. Onthe other hand, Hα emitters outside the Sausage cluster reveal some evolution relative to theSDSS z = 0 relation (Maiolino et al. 2008, after applying the appropriate corrections for adifferent metallicity indicator and a different IMF). When directly comparing our sample ofHα emitters in the Sausage cluster and those outside the cluster, we find a systematic offsetof about 0.2 dex, which gets tentatively higher for higher stellar masses. This shows that Hαemitters in the Sausage are more metal rich.
26 CHAPTER 8. BOOSTED AGN AND STAR-FORMATION
outside the cluster.We find that star-forming galaxies in the cluster show significantly higher metallicities
than star-forming galaxies in the outskirts or in the field environment, although star-forminggalaxies in the post-shock regions show an even higher metallicity, fully consistent with solarmetallicity. We note, however, that star-forming galaxies in the post-shock regions also havea slightly higher median stellar mass (+0.12 dex), and thus the slightly higher metallicitieswhen compared with the remaining galaxies in the cluster, can be fully explained by the mass-metallicity relation (see §8.3.6). Thus, both sub-samples show a very high metal-enrichment.
We note that star-forming galaxies in the cluster are also slightly more massive, as awhole, than those in the other environments, and thus it is very important to look at the mass-metallicity relation, in order to address whether the higher metallicity is simply a consequenceof higher stellar masses, or a genuine higher metallicity even at fixed mass.
8.3.6 The Mass-Metallicity relation for the Sausage merging cluster
Having found that our merging cluster star-forming galaxies have higher metallicities thanthose in lower density environments, we investigate the mass-metallicity relation. We showour results in Figure 8.13. We find a strong relation between metallicity (here traced by the[Nii] / Hα ratio and using the conversion of Pettini & Pagel 2004 for star-forming galaxies)and stellar mass, both when we look at individual sources (Figure 8.13: right panel) andparticularly when we look at stacks as a function of stellar mass (Figure 8.13: left panel).We find that Hα emitters in both the cluster and the field have metallicities that correlate withstellar mass. We also show where AGNs would be placed had they not been excluded from ouranalysis, clearly showing that they would bias the metallicities to higher values. We note thatall AGNs were excluded from the metallicity analysis, both for the fits with individual sourcesand for all the stacks that measured metallicities (the only exceptions are for “full" samples inTable 2, but we make explicit notes that those values are still contaminated by AGN). We alsonote that because of significant dust extinction on the line of sight, the [Oiii] 5007/Hβ ratio isoverestimated, thus making our cuts even more conservative in excluding potential AGN.
Our results clearly reveal, both based on the combination of individual measurements,and based on the stacks for each sub-sample, that our merging cluster star-forming galaxiesare significantly more metal-rich than those outside the cluster. We find this to be valid formasses higher than 109 M (for which we are reasonably complete), although the differenceseems to be even higher for masses > 1010 M. We note that this difference, of about 0.15to 0.2 dex, found at all masses, is based on two fully comparable samples, with the same se-lection function, same completeness, with the sole difference being the environment in whichthese star-forming galaxies reside in. We also compute metallicities using the O3N2 indica-tor (Alloin et al. 1979) and recover similar results. However, measurements based on O3N2have much lower S/N, due to the high level of dust extinction affecting both [Oiii] 5007 andHβ (up to ∼ 3 mag). In addition, because of the difference in wavelength between the twolines (∼ 176 Å), the [Oiii] 5007 and Hβ emission lines suffer from different dust extinctionvalues. Therefore, the [Oiii] 5007/Hβ line ratio is biased high (average ∼ 0.06 dex), while[Nii] / Hα ratio provides, in this case, a much better metallicity estimator. With [Nii] / Hα wecan measure metallicities at much higher S/N, in exactly the same way for our fully compa-rable samples in and outside the cluster and without the potential biases from dust extinction,
8.4. DISCUSSION: SHOCK INDUCED STAR-FORMATION, COOLING OR TURBULENCE?27
as [Nii] and Hα are only separated by 20.8 Å.We also compare our results with those in the literature, particularly with SDSS (Maiolino
et al. 2008, after applying the appropriate corrections for a different metallicity indicator anda different IMF). In practice, we find that star-forming galaxies in the Sausage merging clusterfollow the local (z ∼ 0) mass-metallicity perfectly, even though they are being studied 2.3 Gyrbefore it was established. On the other hand, star-forming galaxies outside the cluster followa mass-metallicity relation more applicable to slightly higher redshift galaxies (Maiolino et al.2008). We also use the parameterisation of Maiolino et al. (2008) to fit our mass-metallicityrelations for cluster and star-forming galaxies outside the cluster. The parameterisation isgiven by: 12 + log(O/H) =−0.0864 × (log M −M0)2 + K0. For Cluster star-forming galaxieswe find M0 = 10.68± 0.04 and K0 = 8.72± 0.01, while for star-forming galaxies outside thecluster the best fit is given by M0 = 10.49 ± 0.14 and K0 = 8.56 ± 0.03.
While we find evidence that the Fundamental Metallicity Relation (Mannucci et al. 2010)is somewhat applicable to our data (at all environments), our sample (particularly when splitin different environments and only focusing on robust star-forming galaxies) is too small toproperly address how these sources fit into the FMR and particularly to attempt to constrain it.However, we note that both samples (cluster and outside the cluster) are very well matched inSFR (see Figure 8.7 and Stroe et al. (2015)), and thus the difference in metallicity for a fixedmass cannot be explained by a typically lower SFR. Nevertheless, it should be noted that thescatter on individual measurements in Figure 8.13 (right panel) seems to be mostly driven, atfixed stellar mass and fixed environment, by SFR.
8.4 Discussion: Shock induced star-formation, cooling orturbulence?
By obtaining high S/N spectra of the bulk of the sample of candidate line emitters in theSausage cluster, we were able to confirm them as Hα emitters. We find that about 65% areconsistent with being powered by star-formation, with about 35% being AGN. We find Hαstar-forming galaxies in the cluster to be highly metal-rich and to already follow the SDSSz ∼ 0 mass metallicity relation. We also find striking evidence of ubiquitous outflows in themajority of our cluster Hα emitters: not only strong P Cygni profiles, mostly in cluster AGN,but also for star-forming galaxies, where we find redshifted emission lines and particularlysignificantly blue-shifted Na D emission. We find that such outflows are consistent with be-ing driven by AGN for sources with clear AGN activity, while for star-forming galaxies inthe cluster, and particularly for those with very high [Sii]6716/Hα, away from the post-shockregions, these are likely driven by supernova. It is also likely that star-forming galaxies inthe post-shock region are in a relatively earlier evolution phase compared to those away fromit (which are likely in final phase of star-formation, showing the strongest outflows and thestrongest evidence for supernova). We argue that the merger must have had a significant effecton all these Hα emitters. This is because the cluster, despite being extremely massive, showsa surprising number of active Hα emitters, but also because all Hα emitters in the cluster showsignificant differences in their properties to field galaxies.
A requirement for the shock and cluster merger to increase star formation and AGN activ-ity is that the galaxies within the sub-clusters are still relatively gas rich or have at least some
28 CHAPTER 8. BOOSTED AGN AND STAR-FORMATION
remaining amount of relatively cool molecular gas, capable of being turned into stars in a fewMyrs, or be accreting such gas at a sufficient rate. The Hα emitters in the ‘Sausage’ clusterpresent masses 109−10.7 M and are in general very metal-rich, particularly given their mass,following the SDSS relation at z = 0. Field Hα emitters at the same redshift but outside thecluster show systematically lower metallicities at all masses (see Figure 8.13). The metallicityas measured from nebular lines for the Hii regions is essentially solar for cluster star-forminggalaxies, suggesting that these Hα emitters are using relatively metal rich gas to form newstars at all stellar masses. What is the source of these reservoirs of gas?
A source of gas would be a reservoir of high-metallicity Z ∼ 0.3 ICM gas (Lecca-rdi & Molendi 2008), compared to field galaxies which may preferentially accrete low(er)-metallicity gas (Z ∼ 0.01 at z ∼ 0.2, Fox 2011) from their inter-galactic (filamentary) medium.Accretion of ICM gas was also proposed as an interpretation for the metal-rich (Z ∼ 1.1Z)spirals found in the Virgo cluster (Skillman et al. 1996). By contrast, if we assume the galaxiesto be closed-boxes, supernova explosions (SN) of asymptotic giant branch (AGB) stars wouldenrich the intra-galactic medium with metals and, given the higher-mass of the galaxies andthe large potential of the cluster, this gas could be retained and fall back into the galaxies.
A slight elevation of 0.04 dex was also found in the metallicities of a large sample ofcluster galaxies, as compared to the field (Ellison et al. 2009) – our results go in the samedirection, but we find an even higher offset. Cooper et al. (2008) also find that galaxies atlow redshift residing in higher density environments tend to have higher metallicities, at fixedmass, than those in lower density regions, in agreement with our findings. Interestingly, thistrend is also being found at higher redshift. By studying an over-density of Hα emitters atz = 0.8 with KMOS, Sobral et al. (2013a) find that star-forming galaxies in the high-densitygroup-like or filamentary structure are more metal rich than those in the field. However, thedifference can be explained by the fact that galaxies residing in higher density regions are alsomore massive. On the other hand, and at higher redshift, Kulas et al. (2013) used MOSFIRE tostudy a “proto-cluster” at z ∼ 2.3. They also find that galaxies in the proto-cluster environmentare, on average, more metal rich than those in the field comparison (which the authors alsoobtain with the same instrument and set-up, to be fully comparable), particularly for stellarmasses of ∼ 1010 M. Similar results are found by Shimakawa et al. (2015), who study tworich over-densities at z ∼ 2.2 and z ∼ 2.5. Shimakawa et al. (2015) find that galaxies residingin over-densities likely have higher metallicities than those in the field sample presented byErb et al. (2006).
As long as there is some relatively cool gas in cluster galaxies, and even if that gas isrelatively unlikely to form stars on its own (e.g. not dense enough/too stable), the passage ofa shock wave can likely introduce the turbulence needed for that to happen. Given the shockproperties and velocity, the shock is expected to traverse galaxies within a relatively veryshort timescale of about 10 − 50 Myr. Hence the shock induces turbulence quickly, whichmay lead to further gas cooling and collapse of any gas that is still available in the galaxies –although due to the time needed for that to happen, a time delay is expected from the passageof the shock wave to the star-formation episodes. However, the enhancement of star formationand AGN activity following the shock passage can quickly deplete the gas reservoir. This isbecause while part of the gas fuels SF and goes into stars, we also find evidence of strongoutflows in our cluster Hα star-forming galaxies, and also for our Hα cluster AGN: these caneasily further remove gas and lead to relatively short depletion times. We therefore expect the
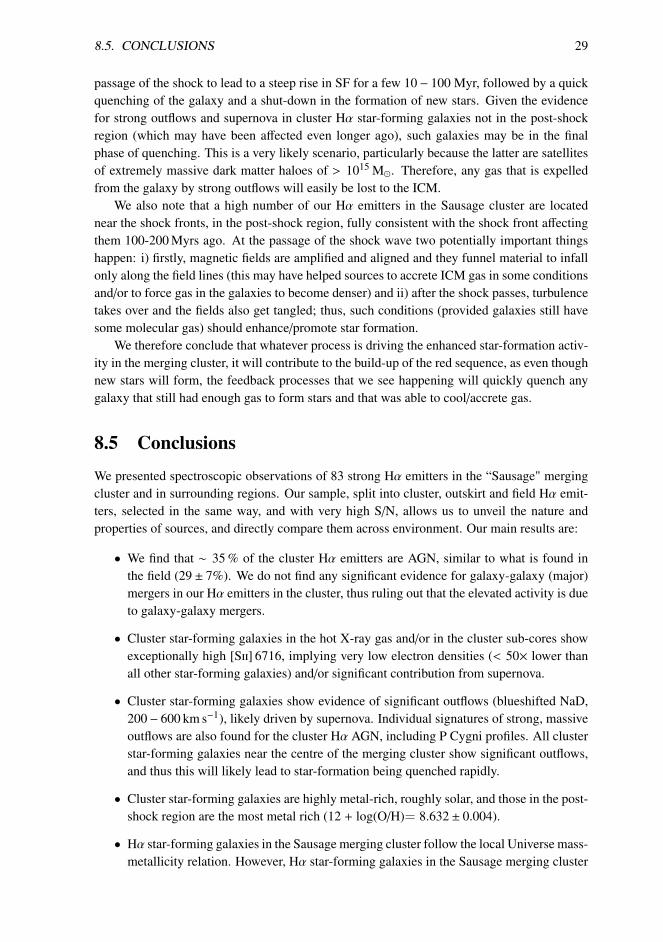
8.5. CONCLUSIONS 29
passage of the shock to lead to a steep rise in SF for a few 10 − 100 Myr, followed by a quickquenching of the galaxy and a shut-down in the formation of new stars. Given the evidencefor strong outflows and supernova in cluster Hα star-forming galaxies not in the post-shockregion (which may have been affected even longer ago), such galaxies may be in the finalphase of quenching. This is a very likely scenario, particularly because the latter are satellitesof extremely massive dark matter haloes of > 1015 M. Therefore, any gas that is expelledfrom the galaxy by strong outflows will easily be lost to the ICM.
We also note that a high number of our Hα emitters in the Sausage cluster are locatednear the shock fronts, in the post-shock region, fully consistent with the shock front affectingthem 100-200 Myrs ago. At the passage of the shock wave two potentially important thingshappen: i) firstly, magnetic fields are amplified and aligned and they funnel material to infallonly along the field lines (this may have helped sources to accrete ICM gas in some conditionsand/or to force gas in the galaxies to become denser) and ii) after the shock passes, turbulencetakes over and the fields also get tangled; thus, such conditions (provided galaxies still havesome molecular gas) should enhance/promote star formation.
We therefore conclude that whatever process is driving the enhanced star-formation activ-ity in the merging cluster, it will contribute to the build-up of the red sequence, as even thoughnew stars will form, the feedback processes that we see happening will quickly quench anygalaxy that still had enough gas to form stars and that was able to cool/accrete gas.
8.5 Conclusions
We presented spectroscopic observations of 83 strong Hα emitters in the “Sausage" mergingcluster and in surrounding regions. Our sample, split into cluster, outskirt and field Hα emit-ters, selected in the same way, and with very high S/N, allows us to unveil the nature andproperties of sources, and directly compare them across environment. Our main results are:
• We find that ∼ 35 % of the cluster Hα emitters are AGN, similar to what is found inthe field (29 ± 7%). We do not find any significant evidence for galaxy-galaxy (major)mergers in our Hα emitters in the cluster, thus ruling out that the elevated activity is dueto galaxy-galaxy mergers.
• Cluster star-forming galaxies in the hot X-ray gas and/or in the cluster sub-cores showexceptionally high [Sii] 6716, implying very low electron densities (< 50× lower thanall other star-forming galaxies) and/or significant contribution from supernova.
• Cluster star-forming galaxies show evidence of significant outflows (blueshifted NaD,200− 600 km s−1), likely driven by supernova. Individual signatures of strong, massiveoutflows are also found for the cluster Hα AGN, including P Cygni profiles. All clusterstar-forming galaxies near the centre of the merging cluster show significant outflows,and thus this will likely lead to star-formation being quenched rapidly.
• Cluster star-forming galaxies are highly metal-rich, roughly solar, and those in the post-shock region are the most metal rich (12 + log(O/H)= 8.632 ± 0.004).
• Hα star-forming galaxies in the Sausage merging cluster follow the local Universe mass-metallicity relation. However, Hα star-forming galaxies in the Sausage merging cluster
30 CHAPTER 8. BOOSTED AGN AND STAR-FORMATION
also show systematically higher metallicity (∼0.15-0.2 dex) for M > 109 M when di-rectly comparing with our Hα emitters outside the cluster. This suggests that the shockfront may have triggered remaining gas which galaxies were able to retain into formingstars.
Our observations show that the merger of massive (∼ 1015 M) clusters can provide theconditions for significant star-formation and AGN activity, but, as we witness strong feedbackby star-forming galaxies and AGN (and given how massive the merging cluster is), and partic-ularly because these sources reside in very massive haloes of > 1015 M which will not likelyallow galaxies to re-accrete gas, such sources will likely be quenched in a few 100 Myrs.
Acknowledgements
We thank the referee for many helpful comments and suggestions which greatly improved theclarity and quality of this work. DS acknowledges financial support from the NetherlandsOrganisation for Scientific research (NWO) through a Veni fellowship, from FCT througha FCT Investigator Starting Grant and Start-up Grant (IF/01154/2012/CP0189/CT0010) andfrom FCT grant PEst-OE/FIS/UI2751/2014. AS and HR acknowledge financial support froman NWO top subsidy (614.001.006). R.J.W. is supported by NASA through the Einstein Post-doctoral grant number PF2-130104 awarded by the Chandra X-Ray Center, which is operatedby the Smithsonian Astrophysical Observatory for NASA under contract NAS8-03060. Part ofthis work performed under the auspices of the U.S. DOE by LLNL under Contract DE-AC52-07NA27344. Some of the data presented herein were obtained at the W.M. Keck Observatory,which is operated as a scientific partnership among the California Institute of Technology, theUniversity of California and the National Aeronautics and Space Administration. The Obser-vatory was made possible by the generous financial support of the W.M. Keck Foundation.This research has made use of the NASA/IPAC Extragalactic Database (NED) which is oper-ated by the Jet Propulsion Laboratory, California Institute of Technology, under contract withthe National Aeronautics and Space Administration. This research has made use of NASA’sAstrophysics Data System. Dedicated to the memory of C. M. Sobral (1953-2014).
Bibliography
Akamatsu, H., & Kawahara, H. 2013, PASJ, 65, 16
Alloin D., Collin-Souffrin S., Joly M., Vigroux L., 1979, A&A, 78, 200
Athreya, R. 2009, ApJ, 696, 885
Bahcall, N. A. 1977, ApJL, 218, L93
Baldwin, J. A., Phillips, M. M., & Terlevich, R. 1981, PASP, 93, 5
Balogh, M. L., Couch, W. J., Smail, I., Bower, R. G., & Glazebrook, K. 2002, MNRAS, 335,10
Barnes, J. E. 2004, MNRAS, 350, 798
BIBLIOGRAPHY 31
Bertin, E. 2006, Astronomical Data Analysis Software and Systems XV, 351, 112
Best P. N., 2004, MNRAS, 351, 70
Brinchmann J., Charlot S., White S. D. M., Tremonti C., Kauffmann G., Heckman T.,Brinkmann J., 2004, MNRAS, 351, 1151
Bruzual, G., & Charlot, S. 2003, MNRAS, 344, 1000
Bruzual, G. 2007, From Stars to Galaxies: Building the Pieces to Build Up the Universe, 374,303
Calzetti D., Armus L., Bohlin R. C., Kinney A. L., Koornneef J., Storchi-Bergmann T., 2000,ApJ, 533, 682
Chabrier, G. 2003, PASP, 115, 763
Chung S. M., Gonzalez A. H., Clowe D., Markevitch M., Zaritsky D., 2010, ApJ, 725, 1536
Collins J. A., Rand R. J., 2001, ApJ, 551, 57
Cooper M. C., Tremonti C. A., Newman J. A., Zabludoff A. I., 2008, MNRAS, 390, 245
Couch, W. J., Balogh, M. L., Bower, R. G., et al. 2001, ApJ, 549, 820
Dawson, W. A. 2013, ApJ, 772, 131
Dawson, W. A., Jee, M. J., Stroe, A., et al. 2015, arXiv:1410.2893
Darvish B., Sobral D., Mobasher B., et al. 2014, ApJ, 796, 51
Drake, A. B., Simpson, C., Collins, C. A., et al. 2013, MNRAS, 433, 796
Dressler, A. 1980, ApJ, 236, 351
Drury, L. O. 1983, Reports on Progress in Physics, 46, 973
Ellison, S. L., Simard, L., Cowan, N. B., et al. 2009, MNRAS, 396, 1257
Erb D. K., Shapley A. E., Pettini M., et al. 2006, ApJ, 644, 813
Faber, S. M., Phillips, A. C., Kibrick, R. I., et al. 2003, Proc. SPIE, 4841, 1657
Ferrari C., Benoist C., Maurogordato S., et al. 2005, A&A, 430, 19
Förster Schreiber et al., 2009, ApJ, 706, 1364
Fox A. J., 2011, ApJ, 730, 58
Fumagalli, M., Fossati, M., Hau, G. K. T., et al. 2014, MNRAS, 445, 4335
Geach, J. E., Smail, I., Best, P. N., et al. 2008, MNRAS, 388, 1473
Genzel R., et al., 2011, ApJ, 733, 101
Gilbank D. G., Bower R. G., Glazebrook K., et al. 2011, MNRAS, 414, 304
32 CHAPTER 8. BOOSTED AGN AND STAR-FORMATION
Gómez, P. L., Nichol, R. C., Miller, C. J., et al. 2003, ApJ, 584, 210
Gunn, J. E., & Gott, J. R., III 1972, ApJ, 176, 1
Hayashi, M., Kodama, T., Koyama, Y., et al. 2010, MNRAS, 402, 1980
Heckman T. M., Lehnert M. D., Strickland D. K., Armus L., 2000, ApJs, 129, 493
Hopkins P. F., Keres D., Onorbe J., et al. 2013, arXiv:1311.2073
Hwang H. S., Lee M. G., 2009, MNRAS, 397, 2111
Jee, M. J., Stroe, A., Dawson, W., et al. 2014, arXiv:1410.2898
Karim A., Schinnerer E., Martínez-Sansigre A., et al. 2011, ApJ, 730, 61
Kauffmann G., White S. D. M., Heckman T. M., et al. 2004, MNRAS, 353, 713
Kennicutt, R. C., Jr. 1998, ARA&A, 36, 189
Kewley L. J., Dopita M. A., Sutherland R. S., Heisler C. A., Trevena J., 2001, ApJ, 556, 121
Kewley L. J., Maier C., Yabe K., et al. 2013, ApJl, 774, L10
Kocevski, D. D., Ebeling, H., Mullis, C. R., & Tully, R. B. 2007, ApJ, 662, 224
Kodama, T., Balogh, M. L., Smail, I., Bower, R. G., & Nakata, F. 2004, MNRAS, 354, 1103
Kodama T., Hayashi M., Koyama Y., et al., eds, IAU Symposium Vol. 295 of IAU Symposium,Mahalo-Subaru: Mapping Star Formation at the Peak Epoch of Massive Galaxy Formation.pp 74–77
Kornei K. A., Shapley A. E., Martin C. L., et al., 2012, ApJ, 758, 135
Koyama, Y., Smail, I., Kurk, J., et al. 2013, MNRAS, 434, 423
Kulas K. R., McLean I. S., Shapley A. E., et al. 2013, ApJ, 774, 130
Larson, R. B., Tinsley, B. M., & Caldwell, C. N. 1980, ApJ, 237, 692
Leccardi, A., & Molendi, S. 2008, A&A, 487, 461
Lewis, I., Balogh, M., De Propris, R., et al. 2002, MNRAS, 334, 673
Madau P., Ferguson H. C., Dickinson M. E., et al. 1996, MNRAS, 283, 1388
Mahajan S., Haines C. P., Raychaudhury S., 2010, MNRAS, 404
Maiolino R., et al., 2008, A&A, 488, 463
Mannucci F., Cresci G., Maiolino R., Marconi A., Gnerucci A., 2010, MNRAS, 408, 2115
Matsuda Y., Smail I., Geach J. E., et al. 2011, MNRAS, 416, 2041
Miller N. A., Owen F. N., 2003, AJ, 125, 2427
BIBLIOGRAPHY 33
Miniati, F. 2002, MNRAS, 337, 199
Moore, B., Katz, N., Lake, G., Dressler, A., & Oemler, A. 1996, Nature, 379, 613
Muzzin A., van der Burg R. F. J., McGee S. L., et al. 2014, arXiv:1402.7077
Muzzin A., Wilson G., Yee H. K. C., et al. 2012, ApJ, 746, 188
Newman J. A., et al., 2013, ApJs, 208, 5
Noeske K. G., Weiner B. J., Faber S. M., et al. 2007, ApJL, 660, L43
Ogrean, G. A., Brüggen, M., Röttgering, H., et al. 2013a, MNRAS, 429, 2617
Ogrean, G. A., Brüggen, M., van Weeren, R. J., et al. 2014, MNRAS, 440, 3416
Osterbrock D. E., 1989, Astrophysics of gaseous nebulae and active galactic nuclei
Owen F. N., Ledlow M. J., Keel W. C., Wang Q. D., Morrison G. E., 2005, AJ, 129, 31
Peng, Y.-j., Lilly, S. J., Kovac, K., et al. 2010, ApJ, 721, 193
Pettini M., Pagel B. E. J., 2004, MNRAS, 348, L59
Petrosian, V. 2001, ApJ, 557, 560
Poggianti B. M., Bridges T. J., Komiyama Y., et al. 2004, ApJ, 601, 197
Pranger, F., Böhm, A., Ferrari, C., et al. 2014, A&A, 570, A40
Reynolds, S. P. 2008, ARA&A, 46, 89
Rodighiero G., Daddi E., Baronchelli I., et al. 2011, ApJL, 739, L40
Roediger, E., Brüggen, M., Owers, M. S., Ebeling, H., & Sun, M. 2014, MNRAS, 443, L114
Rola C. S., Terlevich E., Terlevich R. J., 1997, MNRAS, 289, 419
Salpeter, E. E. 1955, ApJ, 121, 161
Schechter, P. 1976, ApJ, 203, 297
Shapley A. E., Steidel C. C., Pettini M., Adelberger K. L., 2003, ApJ, 588, 65
Shimakawa R., Kodama T., Tadaki K.-i., Hayashi M., Koyama Y., Tanaka I., 2015, MNRAS,448, 666
Shimakawa R., Kodama T., Tadaki K.-i., et al. 2014, MNRAS, 441, L1
Shioya, Y., Taniguchi, Y., Sasaki, S. S., et al. 2008, ApJS, 175, 128
Skillman, E. D., Kennicutt, R. C., Jr., Shields, G. A., & Zaritsky, D. 1996, ApJ, 462, 147
Stott J. P., Sobral D., Bower R., et al. 2013b, MNRAS, 436, 1130
Sobral, D., Best, P. N., Geach, J. E., et al. 2009, MNRAS, 398, 75
34 CHAPTER 8. BOOSTED AGN AND STAR-FORMATION
Sobral, D., Best, P. N., Smail, I., et al. 2011, MNRAS, 411, 675
Sobral, D., Smail, I., Best, P. N., et al. 2013a, MNRAS, 428, 1128
Sobral, D., Best, P. N., Smail, I., et al. 2014, MNRAS, 437, 3516
Steinbring, E. 2014, arXiv:1404.7539
Stroe, A., van Weeren, R. J., Intema, H. T., et al. 2013, A&A, 555, A110
Stroe, A., Sobral, D., Röttgering, H. J. A., & van Weeren, R. J. 2014a, MNRAS, 438, 1377
Stroe, A., Harwood, J. J., Hardcastle, M. J., Röttgering, H. J. A. 2014c, MNRAS, 445, 1213
Stroe A., Sobral D., Dawson W., Jee M. J., Hoekstra H., Wittman D., van Weeren R. J.,Brüggen M., Röttgering H. J. A., 2015, arXiv:1410.2891
Tal T., Dekel A., Oesch P., et al. 2014, ApJ, 789, 164
Tanaka, M., Goto, T., Okamura, S., Shimasaku, K., & Brinkmann, J. 2004, AJ, 128, 2677
Tody, D. 1993, Astronomical Data Analysis Software and Systems II, 52, 173
Tribble, P. C. 1993, MNRAS, 261, 57
Umeda, K., Yagi, M., Yamada, S. F., et al. 2004, ApJ, 601, 805
Valdes, F. G. 1998, in Astronomical Society of the Pacific Conference Series, Vol. 145, 53–+
van Weeren, R. J., Röttgering, H. J. A., Brüggen, M., & Hoeft, M. 2010, Science, 330, 347
Vessey, S. J., & Green, D. A. 1998, MNRAS, 294, 607
Wegner G. A., Chu D. S., Hwang H. S., 2015, MNRAS, 447, 1126
Weiner B. J., Coil A. L., Prochaska J. X., et al. 2009, ApJ, 692, 187
Wright, E. L. 2006, PASP, 118, 1711