
Mathematical Modelling of Future Energy Systems Professor Janusz W. Bialek Durham University p1...
22
Mathematical Modelling of Future Energy Systems Professor Janusz W. Bialek Durham University p1 ©J.W. Bialek, 2010
-
Upload
annabella-randall -
Category
Documents
-
view
218 -
download
0
Transcript of Mathematical Modelling of Future Energy Systems Professor Janusz W. Bialek Durham University p1...

Mathematical Modelling of Future Energy Systems
Professor Janusz W. Bialek
Durham University
p1 ©J.W. Bialek, 2010

Outline
Drivers for power system research
Current and future power system
Examples of mathematical and statistical challenges based on my work
Funding opportunities
p2 ©J.W. Bialek, 2010

p3 ©J.W. Bialek, 2010
Main research drivers for power system research in the UK
“Any feasible path to a 80% reduction of CO2 emissions by 2050 will require the almost total decarbonisation of electricity generation by 2030” (Climate Change Committee Building a Low Carbon Economy 2008)
Driver1 : Grid integration of renewables and Smart Grids
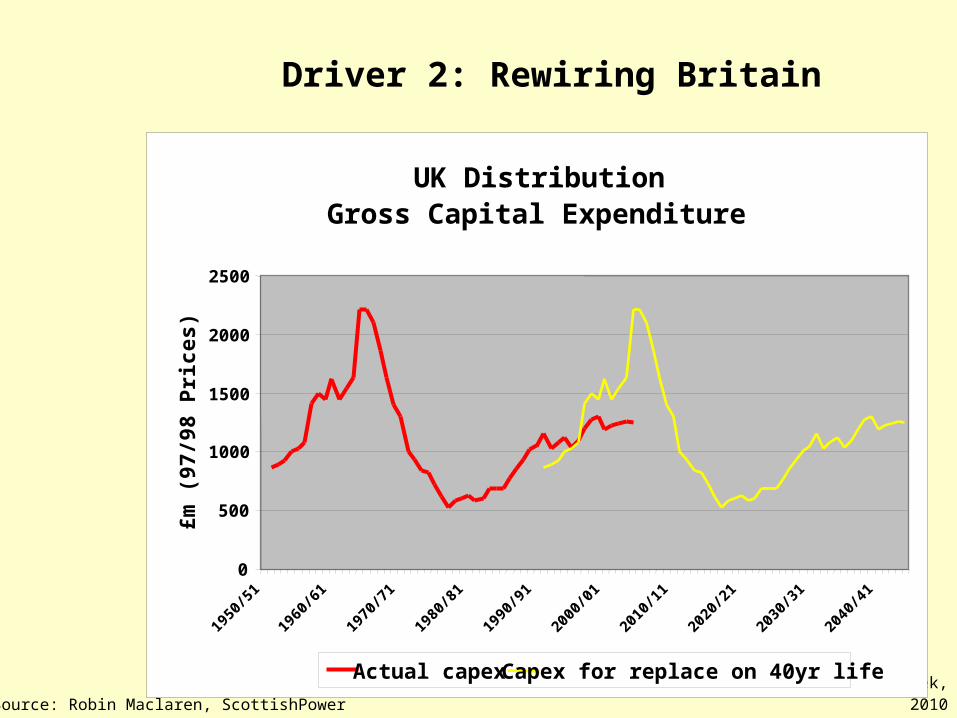
Driver 2: Rewiring Britain
– The UK electricity infrastructure is about 40 years old = lifetime of equipment
– On-shore and off-shore wind requires a significant extension of the existing grid
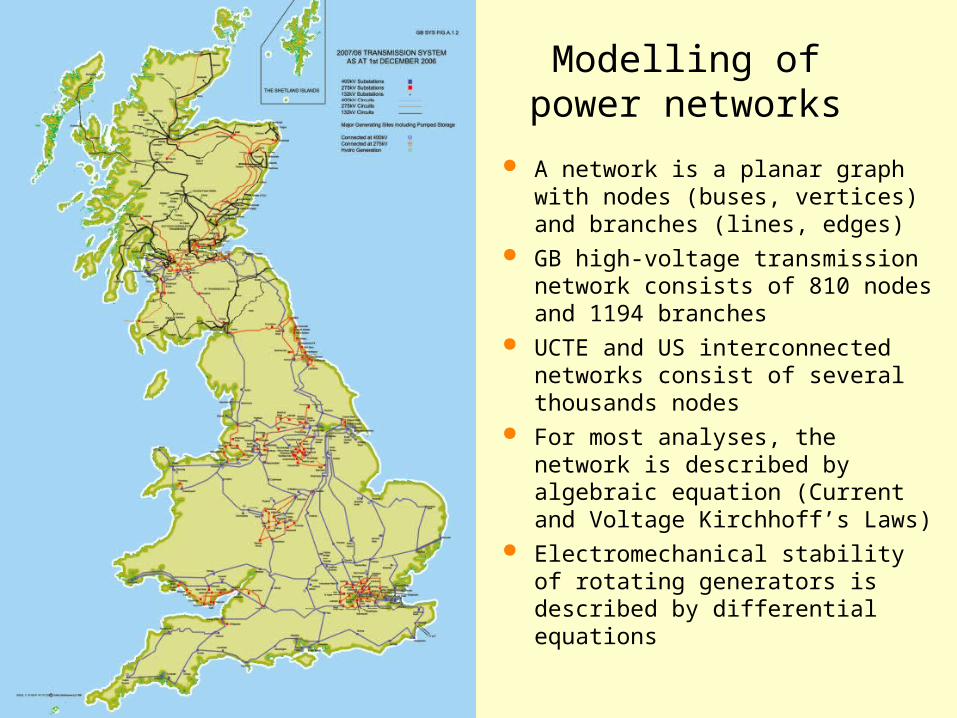
Modelling of power networks
A network is a planar graph with nodes (buses, vertices) and branches (lines, edges)
GB high-voltage transmission network consists of 810 nodes and 1194 branches
UCTE and US interconnected networks consist of several thousands nodes
For most analyses, the network is described by algebraic equation (Current and Voltage Kirchhoff’s Laws)
Electromechanical stability of rotating generators is described by differential equations

p5 ©J.W. Bialek, 2010
o Limited number of controllable power stations
o Demand highly predictable
o Operation demand-driven
o Only transmission network fully modelled (~1000 nodes) as distribution network is passive
o Deterministic planning and operation
• Generation and transmission reserve to account for contingencies: (N-1)
Today’s power system

p6 ©J.W. Bialek, 2010
Future power system (2020/30)
Very high number (1000s) of uncontrollable renewable plants connected at both transmission and distribution level
Stochastic and highly distributed generation
Need to model distribution networks (much denser, tens/hundreds of thousands of nodes)

p7 ©J.W. Bialek, 2010
Smart metering enabling demand response (Smart Grids)
o Demand not deterministic any more
Possible electric cars + storage
o storage and time-shifting demand create much stronger linkages between time periods in power system models
Interactions with gas and transport networks
In short: the future power system will be complex and stochastic

What’s needed
p8 ©J.W. Bialek, 2010
Modelling of highly distributed and stochastic generation and demand
o Stochastic characterisation of resource and demand
o Aggregation of distributed generation and demand
o Modelling of interactions
o Human behaviour
Probabilistic planning and operation tools:
Move from traditional direct control to stochastic and hierarchical control

3 examples based on work in Durham
p9 ©J.W. Bialek, 2010
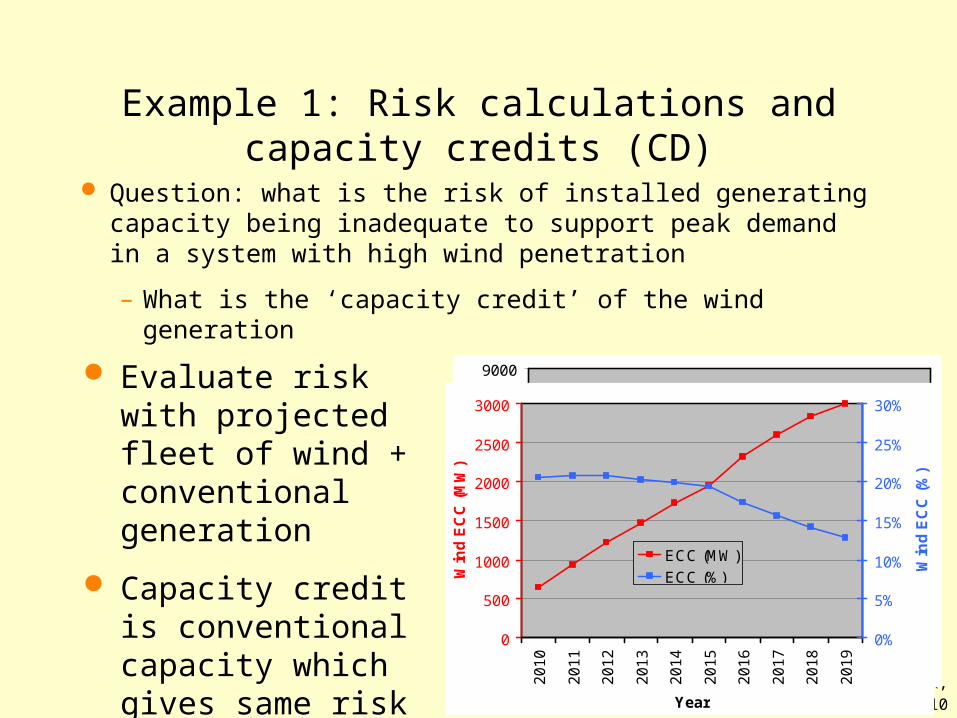
Example 1: Risk calculations and capacity credits (CD)
Question: what is the risk of installed generating capacity being inadequate to support peak demand in a system with high wind penetration
– What is the ‘capacity credit’ of the wind generation
p10 ©J.W. Bialek, 2010
3000
4000
5000
6000
7000
8000
9000
20
10
20
11
20
12
20
13
20
14
20
15
20
16
20
17
20
18
20
19
Year
Eff
ec
tiv
e M
arg
in (
MW
)
With wind
Without wind
Evaluate risk with projected fleet of wind + conventional generation
Capacity credit is conventional capacity which gives same risk in an all-conv system
0
500
1000
1500
2000
2500
3000
20
10
20
11
20
12
20
13
20
14
20
15
20
16
20
17
20
18
20
19
Year
Win
d E
CC
(M
W)
0%
5%
10%
15%
20%
25%
30%
Win
d E
CC
(%
)
ECC (MW)
ECC (%)
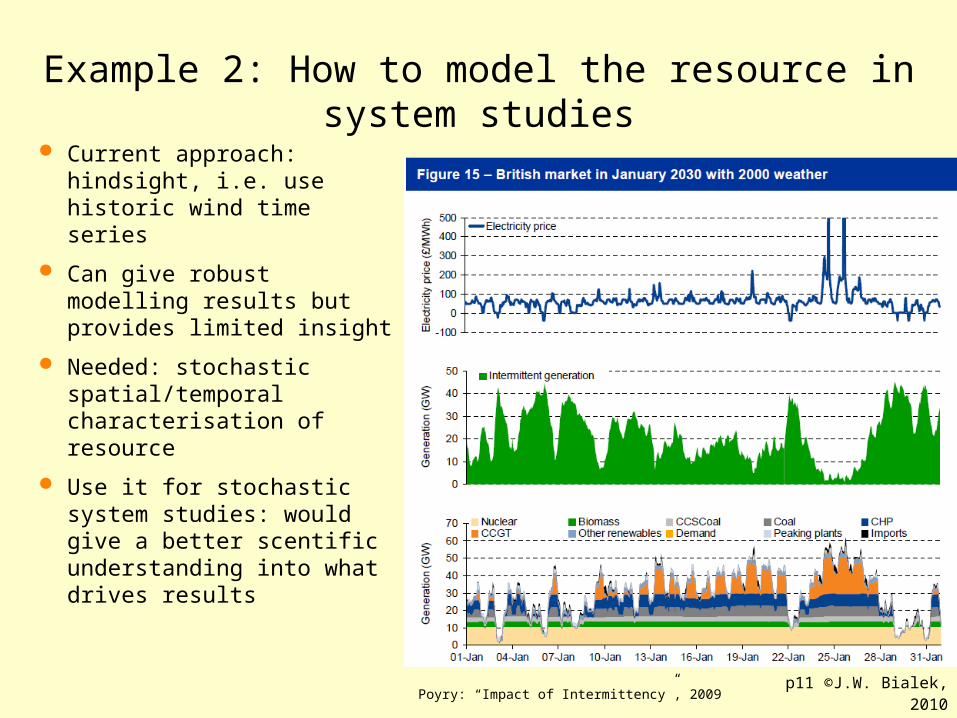
Example 2: How to model the resource in system studies
Current approach: hindsight, i.e. use historic wind time series
Can give robust modelling results but provides limited insight
Needed: stochastic spatial/temporal characterisation of resource
Use it for stochastic system studies: would give a better scentific understanding into what drives results
p11 ©J.W. Bialek, 2010Poyry: “Impact of Intermittency”, 2009

Example 3: Keeping reserve vs just-in-time delivery
p12 ©J.W. Bialek, 2010
Doubling of operating generation reserve by 2020 due to intermittency of wind if current approach is used
National Grid, 2009

p13 ©J.W. Bialek, 2010
Significant cost as reserve needed 24/7
Just-in-time approach: use flexible demand/storage, rather than just thermal generation, to provide a back-up for wind
Must not increase risk
Statistics + Stochastic Control + Operational Research
p14 ©J.W. Bialek, 2010
Driver 2: Rewiring Britain
Source: Robin Maclaren, ScottishPower
The aim: smoothing out the second peak
UK DistributionGross Capital Expenditure
0
500
1000
1500
2000
2500
1950
/51
1960
/61
1970
/71
1980
/81
1990
/91
2000
/01
2010
/11
2020
/21
2030
/31
2040
/41
£m (
97/9
8 P
rice
s)
Actual capex Capex for replace on 40yr life

Asset Management
p15 ©J.W. Bialek, 2010
Age and Condition: which is important?

Asset Management
Asset replacement must be undertakenin a timely way
– Condition monitoring, diagnostics
– Prognostics
– Often limited historical information: equipment is replaced before it fails
New challenge: reliability of offshore wind farms
– £75 billion industry
– Reliability might be a bottleneck due to a limited and costly access
Involvement of statisticians and mathematicians needed: e.g. Bayesian statistics.
p16 ©J.W. Bialek, 2010

Funding opportunities for energy research
RCUK Energy Programme is the largest £220M, bigger than the others taken together (Digital Economy 103M, Nanoscience 39M, Healthcare £36M)
Preference of UKRC for interdisciplinary research
SuperGen (Sustainable Power Generation and Supply) is the flagship initiative in Energy Programme
p17 ©J.W. Bialek, 2010

EPSRC: Grand Challenges in Energy Networks
Look 20-40 years ahead
Scoping workshop held in March 2010
A number of themes identified including
– Flexible Grids– Uncertainty and Complexity– Energy and Power Balancing
£8M (?) Call expected to be announced in summer
p18 ©J.W. Bialek, 2010
EPSRC call: Mathematics Underpinning Digital Economy and Energy
Deadline 1 July 2010, full proposal
£5 million earmarked; 7 -12 proposals will be funded
p19 ©J.W. Bialek, 2010

What is reactive power?
Motors are electromagnetic devices and need coils to produce magnetic fields
Because current is ac (alternating), energy to supply the magnetic field oscillates between the source and the inductor (at 100 Hz)
That oscillating power is called reactive (imaginary) power – symbol Q (real power P)
On average the energy transfer is zero (you cannot use it for any purpose) but there is always an instantaneous flow of energy
There is no reactive power in dc circuits

Nasty effects of reactive power
Causes real power losses (because of oscillating power transfers)
Takes up capacity of wires
Causes voltage drops (proportional to the distance it travels): ΔV= (PR + QX)/V
You cannot transfer reactive power over long distances
Compensation by capacitance (voltage support)
p21 ©J.W. Bialek, 2010

Conclusions
Grid integration of renewables, Smart Grids and the need to rewire Britain create a huge pull for new research
Collaboration with mathematicians and statisticians is crucial
Significant funding opportunities
Reactive power is not small beer!
p22 ©J.W. Bialek, 2010