Math - MyLab & Mastering | Pearson · Welcome Letter • 1 Welcome Letter We are delighted to...
56
MYLAB & MASTERING Efficacy Report • 2014 Math MyMathLab • MyStatLab • MyLabsPlus • MathXL MyFoundationsLab • MyMathTest
Transcript of Math - MyLab & Mastering | Pearson · Welcome Letter • 1 Welcome Letter We are delighted to...

M Y L A B & M A S T E R I N G
Efficacy Report • 2014
MathMyMathLab • MyStatLab • MyLabsPlus • MathXL MyFoundationsLab • MyMathTest

Math Efficacy ReportEdited by Michelle D. Speckler © 2014 Pearson
MyMathLab, MyStatLab, MyLabsPlus, MathXL, MyFoundationsLab, and MyMathTest and are registered trademarks of Pearson. www.pearsonhighered.com

Welcome Letter
www.pearsonmylabandmastering.com • 1
Welcome Letter
We are delighted to share the seventh issue of the Math Efficacy Report (formerly, Making the Grade). Both Pearson and the mathematics community have come a long way since our first issue in 2005—the content and structure of this report directly reflect both these enormous strides and today’s rapidly evolving higher education landscape.
At Pearson, we define efficacy as a measurable impact on improving someone’s life through learning. We are embarking on a global education initiative and dedicating ourselves to the pursuit of efficacy and improved learner outcomes.
On the following pages you’ll find exemplar, data-driven case studies from two- and four-year institutions, as well as fully online implementations, plus the following feature articles inspired by the most talked about topics in higher ed mathematics:
• Studies on Long-Term Success: 10+ Years of Sustained Positive Learning Outcomes
• Personalized and Adaptive Learning: Successful Implementation Models
• College–High School Partnerships: Dual-Enrollment and Bridge Programs
• Changing the Equation: Observed Best Practices
• Getting Started: Planning Your MyMathLab Implementation
Looking for more case studies? Visit the Pearson Results Library, an online repository of more than 400 data-driven case studies quantifying the positive impact of MyLab and Mastering programs on learning outcomes, retention, and subsequent success. This comprehensive database is cross-referenced by institution type, course format, state/province, and more; and is easy to access at www.pearsonmylab.com/results.
We extend our deepest gratitude to each contributing instructor. Each case study was submitted voluntarily and without compensation; each instructor submitted his or her study and remained available for follow-up interviews. Their efforts are invaluable.
We invite you to contact us with any questions about this report, as well as to share your ideas, your best practices, or your results in our next edition. Pearson is happy to provide both consultation and data collection tools to help you measure the impact of a MyLab & Mastering product in your course.
We look forward to hearing from you.
Traci Simons, Senior Efficacy Results Manager [email protected]
John Tweeddale, Senior Vice President, Efficacy and Quality [email protected]
Visit the Pearson Results Library
www.pearsonmylab.com/results

Math Efficacy Report
2 • www.pearsonmylabandmastering.com
Table of Contents
Pearson Standards for Efficacy Research ........................................................ 3
Case Studies ..................................................................................................... 4Four Year East Carolina University, NC .......................................................................... 4
University of Louisville, KY ............................................................................. 6
University of South Alabama, AL .................................................................... 8
University of South Florida, FL ....................................................................... 10
Two Year Chattanooga State Community College, TN ................................................ 12
East Los Angeles College, CA ........................................................................ 14
Guilford Technical Community College, NC ............................................... 16
Reading Area Community College, PA......................................................... 18
South Arkansas Community College, AR ..................................................... 20
Online Florida State College at Jacksonville, FL ......................................................... 22
St. Philip’s College, TX ................................................................................... 24
Studies on Long-Term Success: 10+ Years of Sustained Positive Learning Outcomes .................................. 26
Personalized and Adaptive Learning: Successful Implementation Models ............................................................... 34
College–High School Partnerships: Dual-Enrollment and Bridge Programs ......................................................... 36
Changing the Equation: Observed Best Practices .......................................... 39
Getting Started: Planning Your MyMathLab Implementation ..................... 43
Glossary .......................................................................................................... 45
Conclusion ...................................................................................................... 46
Pearson Results Library: Mathematics and Statistics Case Studies ............. 47
Index: Institutions Included in this Report .................................................... 51

Pearson Standards for Efficacy Research
www.pearsonmylabandmastering • 3
Pearson Standards for Efficacy Research
At Pearson, we believe that learning is a life-changing oppor-tunity, and that education should have a measurable, proven impact on learners’ lives. It’s what Pearson’s efficacy program and tools are all about. Pearson is putting the pursuit of efficacy and learning outcomes at the center of its global education strategy—you can read more at efficacy.pearson.com. When we publish our annual report in 2018, we will, in a rigorous and externally audited way, report on the progress we have made in improving learner outcomes.
Why Pearson Is Interested in Efficacy StudiesLearner outcomes have always been important to Pearson—our fundamental purpose is to help people make progress in their lives through learning. We already have many examples of products that can demonstrate their impact on learners, but going forward our aim is to ensure that every action, every decision, every process, and every investment we make will be driven by a clear sense and understanding of how it will make a measurable impact on learning outcomes.
It is increasingly possible to determine what works and what doesn’t in education, just as in healthcare. Growing research and evidence, advancements in technology and our enhanced ability to harness the power of data offers a huge opportunity to drive improvements in learning. Pearson, as the world’s largest learning company, has both the responsibility and the potential to pursue and lead this conversation. Toward that goal, we actively seek out educators who wish to explore educational research questions and investigate the efficacy of our digital solutions and services.
Pearson’s Efficacy Research TeamOur global efficacy team is headed by Sir Michael Barber, a leading authority on education systems and reform. The North American Efficacy & Quality team includes more than 30 professionals dedicated to helping educators deliver desired learner outcomes.
We provide practical advice about tracking and analyzing student data as part of the implementation of a Pearson digital solution. Experts in psychometrics, educational statistics, and journal publications are available to support instructors who want to (1) conduct efficacy studies, (2) provide our editorial
staff with detailed reports on the quality of our online content, and (3) advise our software engineers of new methodologies for collecting and processing student learning data within our digital solutions.
How Pearson and Instructors Work TogetherEvery research project is unique. The process takes time— generally a semester or longer. Instructors interested in conducting studies should expect an interactive and rewarding partnership.
How Pearson Can Help Instructors Get StartedPearson can provide templates, guidelines, questionnaires, checklists, and samples on course redesign, efficacy studies, data collection, and more. To maintain objectivity, Pearson does not offer compensation for participation in efficacy studies.
Research StandardsPearson adheres to the Software & Information Industry Association guidelines for evaluation of educational technology products. The key guidelines are:
• Ask the right question
• Support the implementation of the product or service
• Plan a study of sufficient size and duration to demonstrate an effect
• Plan for plausible causal claims
• Avoid (the appearance of) conflicts of interest
• Provide a comprehensive and detailed research report
• Make the research findings widely available
• Accurately translate research for customers
Contact [email protected] for more information.

t
4 • www.pearsonmylabandmastering.com
Key Results After redesigning College Algebra using MyMathLab in the National Center for Academic Transformation’s Emporium model, combined fall and spring success rates increased an average of 11.8 percentage points—from 60 percent to 71.8 percent.
Materials in UseTrigsted MyMathLab College Algebra, Kirk Trigsted
ImplementationThe College Algebra course at East Carolina University (ECU) suffered from low passing rates, and budgetary concerns prompted the university to redesign the course to address both issues.
The course serves approximately 3,000 students a year. These large enrollments meant that before the redesign, several instructors taught a large number of sections, with very little consistency among the sections. Although all instructors assigned the same homework problems and gave a common final, some instructors chose to give quizzes, some took attendance, some offered test reviews, some used course packs, and so on.
Course DesignECU modeled their redesigned College Algebra course after Louisiana State University’s College Algebra course. To ease into the redesign, ECU required all instructors to use MyMathLab for one year. Instructors used identical course syllabuses, class notes, and MyMathLab assignments. All homework and quizzes were completed online and each teacher gave his or her own in-class test. During fall 2011, many of the classes had 100–120 students. That same semester, ECU piloted the redesign in one section.
In fall 2012, ECU launched its College Algebra Virtual Environ-ment (CAVE) math lab with 120 computers. The lab is open Monday through Thursday from 9am to 9pm and Friday from 9am to 5pm.
In the redesigned format, students spend one hour per week in class with an instructor, and are required to spend three hours per week in the lab working on MyMathLab homework, quizzes, and tests. They can also use lab time to obtain one-on-one instruction. There is always at least one instructor in the lab and more during peak hours, in addition to undergraduate tutors, graduate students, and a few volunteers.
Assessments45 percent MyMathLab tests
25 percent MyMathLab final exam
10 percent MyMathLab quizzes
10 percent MyMathLab homework
5 percent Class participation
5 percent Lab participation
Use of MyMathLab contributes 90 percent to a student’s final course grade.
EAST CAROLINA UNIVERSITY Greenville, NC
Product Name College Algebra, MyMathLab, Trigsted
Course Name College Algebra
Course Format Hybrid: open lab

www.pearsonmylabandmastering • 5
Submitted by Cathy Wilkerson, Lab Director and Mathematics Instructor (retired) and
April Church, Teaching Instructor and CAVE Director/ Math 1065 Course Coordinator
East Carolina University
East Carolina University
Results and DataPrior to redesign, College Algebra average fall ABC rates were as low as 66.8 percent; average spring ABC rates were as low as 53.2 percent. After redesign with MyMathLab, fall ABC rates increased 5.9 percentage points to 72.7 percent; spring ABC success rates increased 17.7 percentage points to 70.9 (figure 1).
Figure 1. College Algebra Average ABC Rates by Fall and Spring, before Redesign (Fall 2007–Spring 2011), during the Hybrid Format (Fall 2011–Spring 2012), and after Redesign (Fall 2013–Spring 2013)
Fall Spring0%
20%
40%
60%
80%
100%
Perc
enta
ge o
f St
uden
ts
66.8%
75.5% 72.7%
Before Redesign(Fall 2007–Spring 2011)
After Redesign with MyMathLab(Fall 2012–Spring 2013)
Hybrid(Fall 2011–Spring 2012)
53.2%61.4%
70.9%
“Math is not a spectator sport. An instructor can stand up and do the problems all day long, but until students practice it, they’re not going to get it. MyMathLab forces students to do math,
which is what they need to do to see success.”
The Student ExperienceAt first, most students didn’t like the learning curve associated with MyMathLab and the course redesign. Faculty listened to their concerns and made adjustments.
For example, better students who often finished their work before the three hours of lab time per week were up would run out of work to do and become frustrated. Faculty responded by allowing students who had a 95 average after the first exam and a 100 average on all their assignments for the week to be exempt from the three-hour rule that week.
Students appreciate the help and flexibility that MyMathLab provides:
• “The CAVE gave me easy access to instructors for any questions I had, including computer problems and homework. Being allowed to take the quizzes up to 10 times helped my grade and helped me learn.”
• “The online assignments walking me through the problems and helped me understand them.”
• “Having instructors in the math lab is a good resource for when we don’t understand the material.”
ConclusionEast Carolina University is seeing significant positive results in a short amount of time. With the data they’ve gathered thus far, the math department plans to continue modifying the program to include personalized homework assignments and a new coursepack that requires students to read the e-text prior to attending class.

6 • www.pearsonmylabandmastering.com
t
UNIVERSITY OF LOUISVILLE Louisville, KY
Product Name MyMathLab
Course Name Engineering Analysis 1 (Calculus 1)
Course Format Hybrid: face-to-face and online on tablets in class
Key Results Frequent low-stakes assessments in MyMathLab in an ongoing calculus redesign is resulting in consistent course delivery across sections and semesters, plus increased opportunities for multimodal learning and mastery of course material.
Materials in UseCustom text derived from Thomas’ Calculus by Weir, Haas, Giordano; Fundamentals of Differential Equations by Nagle, Saff, Snider; and Precalculus by Blitzer
ImplementationUniversity of Louisville engineering students are required to take a calculus sequence from the J.B. Speed School of Engineering’s Department of Engineering Fundamentals. Engineering Analysis 1, the first course in the sequence offers an in-depth understanding of extensive problem solving in differential and integral calculus.
Class meets five times a week: Monday, Wednesday, and Friday for 50 minutes; Tuesday and Thursday for 75 minutes.
The implementation started in 2012 by transitioning from paper-and-pencil homework assignments to custom-created MyMathLab homework assignments managed by MyMathLab’s coordinator course feature. Students have unlimited attempts on homework and all learning aids are available to them. They may continue to work on the homework after the due date but are assessed a two percent penalty per day. Each unit has a single set of homework problems.
The department recently began developing videos to replace parts of the traditional class lecture. For each unit, some material is covered in videos that students watch outside of class, thereby reducing the total number of class meeting hours per week by 40 minutes (Tuesday classes meet for 40 minutes). This material is not covered during lecture—it is the students’ responsibility to watch the videos, which they access as MyMathLab media assignments within their homework assignments. Video assignments have a due date but may be reviewed later.
Once homework fully shifted to MyMathLab, the department began using MyMathLab for formal testing. Currently there is a MyMathLab test for each unit in the course. Tests are proc-tored and available for two days. Some sections have required students to earn at least 70 percent on the homework in order to take the associated unit test. Students have 40 minutes to complete each test, have one attempt, and no learning aids are available. The department uses MyMathLab’s Lockdown Browser feature to ensure security.
Other ways to use MyMathLab for formal assessment are being evaluated, including unannounced, in-class pop-quizzes and a proctored, final exam in advance of the paper-and-pencil final exam.
The department uses MyMathLab’s prerequisites feature to ensure mastery—students are required to earn at least 70 percent before moving to the next assignment. It also employs question pooling in quizzes and tests to help differentiate the questions each student receives.
Assessments55 percent Exams
(13, paper-and-pencil, each covers two units)
25 percent Final exam (paper-and-pencil)
15 percent MyMathLab tests (13, each covers one unit)
5 percent MyMathLab homework
Use of MyMathLab contributes 20 percent to each student’s final course grade.

www.pearsonmylabandmastering.com • 7
Submitted by Jeffrey Hieb, Ph.D., Assistant Professor
Department of Engineering Fundamentals
University of Louisville
University of Louisville
Results and DataA primary benefit of the redesign lies in the data-collection capability of MyMathLab. Item analysis of MyMathLab unit tests helps identify areas of difficulty, often confirming what instructors have long suspected. Many instructors use this feature to prepare for review days. “A benefit that the department hopes to soon realize is creation of assessments in MyMathLab that can be reused each semester and compared across semesters,” says Jeffrey Hieb, assistant professor of Engineering Fundamentals.
Hieb reports that the department has realized real benefits without a dip in student performance. After tracking and analyzing the average final exam scores of three cohorts throughout their calculus sequences, he found no significant negative impact (figure 1). “It may seem counter-intuitive to be pleased with ‘doing no harm’ to students, but in a short amount of time we have made substantial changes to the delivery of our calculus courses that saved money and time,” says Hieb. “‘Doing no harm’ is a victory for us at this point. Students now have more accessible, high-quality resources at their disposal. Our latest objectives include adding components to the course that help students understand how to make use of these resources, and to use MyMathLab to hold students accountable for gaining proficiency on specific topics before taking their paper tests.”
In addition, because student graders are no longer needed for homework and quizzes, the school has decreased its instructional costs.
Figure 1. Average Final Exam Scores as Use of MyMathLab Increased, Fall 2010–Fall 2012 (n=736)
Fall 2010 Fall 2011 Fall 2012 No MyMathLab 50% of homework Homework and in MyMathLab quizzes in MyMathLab
0%
20%
40%
60%
80%
100%
Ave
rage
Fin
al E
xam
Sco
re 72.3%
65.5% 65.3%
The Student ExperienceHieb first employed MyMathLab to replace the paper home-work assignments for his calculus III class. He recalls how positive students’ reactions were to the change, “Students liked the fact that they could practice the homework as many times as they chose. Several asked if MyMathLab would be available next semester.”
Since scaling the implementation, Hieb and his colleagues have realized that students’ attitudes toward their assignments are critical to their success. “When students don’t make the con-nection between the homework or quiz and the exam, they don’t take the results seriously and they don’t view their grade as an indicator of their comprehension, when in reality, it is a good indicator,” says Hieb. “One of the areas we would like to improve is getting students to see the importance of taking the quiz results and using that to direct their learning. MyMathLab’s Study Plan is one way to do this.”
ConclusionThe Engineering Fundamentals Department has learned a variety of lessons, including the importance of change. “You can’t just take what you used to do and replace it with MyMathLab,” says Hieb. “You must change the way you’ve thought about your course and use MyMathLab to its fullest potential. That’s why at the onset we invested time writing our own problems in MyMathLab—we wanted to ensure that students were receiving the engineering application problems we wanted them to have. They are receiving the same course students took in 2010, just more automated and with grade information more readily available. In addition, instructors are spending more time teaching and less time grading, and the department is realizing cost savings.”
The department is pleased with the results they’ve seen since implementing MyMathLab—and they realize they’re not finished yet. “We’ve got the homework portion figured out,” says Heib. “Now it’s time to get some more mileage from the testing.” To that end, Hieb plans to employ the Personalized Homework feature in MyMathLab so that students have the opportunity to take the online exams, remediate, and show improvement on the paper exams. The department also has begun tracking and measuring the specific cost and time savings.

8 • www.pearsonmylabandmastering.com
t
Materials in UseBeginning and Intermediate Algebra, Martin-Gay
ImplementationIntermediate Algebra is a three-credit-hour course that satisfies the math requirements for conditional freshmen with an appropriate math placement score (60–69) or students who place into it with a Math ACT of 19–21 and need to satisfy the prerequisite for Precalculus Algebra.
The class meets two times per week with split time between lecture and the Math Technology Lab. Students are required to spend an additional 100 minutes per week in the math lab working on homework or taking quizzes and tests.
Homework assignments are completed in MyLabsPlus at home, in class, or in open lab, and can be repeated an infinite number of times before the due date. The last submitted answer is used for grading purposes.
Students must score at least 90 percent on the homework assignments in order to take the associated MyLabsPlus quizzes. They take the quizzes in the lab and must complete them to a minimum of 70 percent by the assigned date. Students may attempt quizzes up to seven times, and the highest score is recorded. They must score at least 70 percent on the quizzes in order to open the associated MyLabsPlus test. Students who do not achieve 70 percent mastery after taking a quiz seven times receive mandatory instructor intervention. Students who do not score at least 90 percent on the homework earn zero percent on the associated quiz.
Assessments75 percent MyLabsPlus tests (four + a final)
Option A: All tests count 15 percent. Option B: Drop lowest test score, final counts 30 percent.
10 percent Participation/attendance
8 percent MyLabsPlus quizzes
7 percent MyLabsPlus homework
Use of MyLabsPlus contributes 90 percent to each student’s final course grade.
Results and DataThe school has attained its redesign goal of increasing Inter- medate Algebra success rates. The success rate has steadily risen from 49 percent in fall 2010, the first semester of the MyLabsPlus implementation, to 63 percent in fall 2013 (figure 1).
In spring 2014, the faculty replaced the cumulative homework with a 25-question pretest that more closely resembles the exam and does not include student learning aids. Test 1 results showed a positive improvement over previous semesters: 60 percent of students who attempted the test received an A—a 22 percent increase over Test 1 results in the previous semester (figure 2).
Key Results After implementing a MyLabsPlus-supported hybrid format, student success rates increased by 29 percent.
UNIVERSITY OF SOUTH ALABAMA Mobile, AL
Product Name MyLabsPlus
Course Name Intermediate Algebra
Course Format Hybrid: meets two times per week in lecture and lab + 100 additional minutes per week in lab
“We want students to be engaged and to know that they have a faculty who truly cares about their success.”

www.pearsonmylabandmastering.com • 9
University of South Alabama
Submitted by Leslie Whiston, Interim Cochair,
Department of Developmental Studies
University of South Alabama
Figure 1. Intermediate Algebra Success Rates, Fall 2010–Spring 2014 (n=2,898)
0%
20%
40%
60%
80%
100%
Perc
enta
ge o
f St
uden
ts
49% 52%
Fall 2010/ Fall 2011/ Fall 2012/ Fall 2013/ Spring 2011 Spring 2012 Spring 2013 Spring 2014
60%63%
Figure 2. Intermediate Algebra Test 1 Grade Distribution before and after Practice Test Implementation, Fall 2013–Spring 2014 (n=550)
0%
20%
40%
60%
80%
100%
Perc
enta
ge o
f St
uden
ts
49%
60%
A B C F Did Not Attempt
30% 28%
12%9% 9%
3%
17%21%
Fall 2013 Spring 2014
The Student ExperienceThe majority of students surveyed about the implementation report having a positive experience with MyLabsPlus. Student surveys indicated that students agreed or strongly agreed with the following statements:
92% MyLabsPlus gave me the opportunity to work extra problems, which helped me understand the material better.
65% Overall the computer software used in the course is good/excellent.
63% MyLabsPlus helped me gain confidence in problem-solving.
60% Because of MyLabPlus, I was able to obtain a higher grade than in a traditional classroom.
55% The video lectures helped me to learn concepts.
ConclusionUniversity of South Alabama’s redesign taught the school’s faculty the importance of never giving up. In 2010, the math department redesigned from a face-to-face, lecture format to a full emporium model that was completely self-paced with an open lab and no hour requirements. When the results were not satisfactory, the course was adjusted to a full mastery-based model. When the results were still not as desired, the school modified the redesign once again by adding test deadlines and implementing clickers and class activities in lecture. Today the school believes it has “hit the mark,” and its results show that to be true. “We want students to be engaged and to know that they have a faculty who truly cares about their success,” says Leslie Whiston, instructor.
“I never learned math as quickly as I did with this software. It took me from being a C student in math to an A+ student.”
—Student

t
10 • www.pearsonmylabandmastering.com
Key Results After redesigning College Algebra using MyLabsPlus in an emporium model, success (ABC) rates increased nearly 12 percent and final exam pass rates increased 21 percent.
Materials in UsePrecalculus: A Unit Circle Approach, Ratti and McWaters
ImplementationCollege Algebra is a prerequisite for several of USF’s science, technology, engineering, and mathematics programs, but in the traditional model, the average success rate for the course was only 65 percent (2007–2010). Redesign was one way the school sought to increase student outcomes.
The redesigned course, based on the National Center for Academic Transformation’s Emporium model, promotes student engagement in the learning process. Each week, students are required to attend a large discussion session and spend at least three hours in the computer lab using MyLabsPlus. In the discussion session, students use a personal response system (clickers) to collaborate and respond to ques-tions posed by the instructor. In the lab, they are encouraged to use MyLabsPlus’s interactive learning resources, including tutorials with immediate feedback, videos, and animated slide presentations. In addition, graduate teaching assistants and math tutors are available for one-on-one assistance.
All tests, the final exam, homework, and course content quizzes are completed in MyLabsPlus. Students are given three attempts on each homework assignment, and they must score a minimum of 70 percent in order to access that section’s quiz. Students are then given one attempt on the timed quiz. Students may earn up to three possible extra credit points by completing MyLabsPlus Study Plans.
UNIVERSITY OF SOUTH FLORIDA Tampa, FL
Product Name MyLabsPlus
Course Name College Algebra
Course Format Emporium: open lab + face-to-face discussion, fixed due dates
“The average final exam pass rate for the redesigned classes was 11.8 percentage
points higher than the rate for the traditional classes—a full letter grade.”
Assessments45 percent MyLabsPlus tests (3)
25 percent MyLabsPlus final exam
10 percent MyLabsPlus quiz
8 percent MyLabsPlus homework
6 percent Lab attendance
4 percent Discussion session clicker grade
1 percent Prerequisite skills assessment
0.5 percent How to enter answers quiz
0.5 percent Lab orientation quiz
Use of MyLabsPlus contributes 88 percent to each student’s final course grade.
www.pearsonmylabandmastering • 11
University of South Florida
Summarized from a study by Fran Hopf, Ruthmae Sears, Ana Torres, and Matthew Maher
Submitted by Marcus McWaters, Department Chair University of South Florida
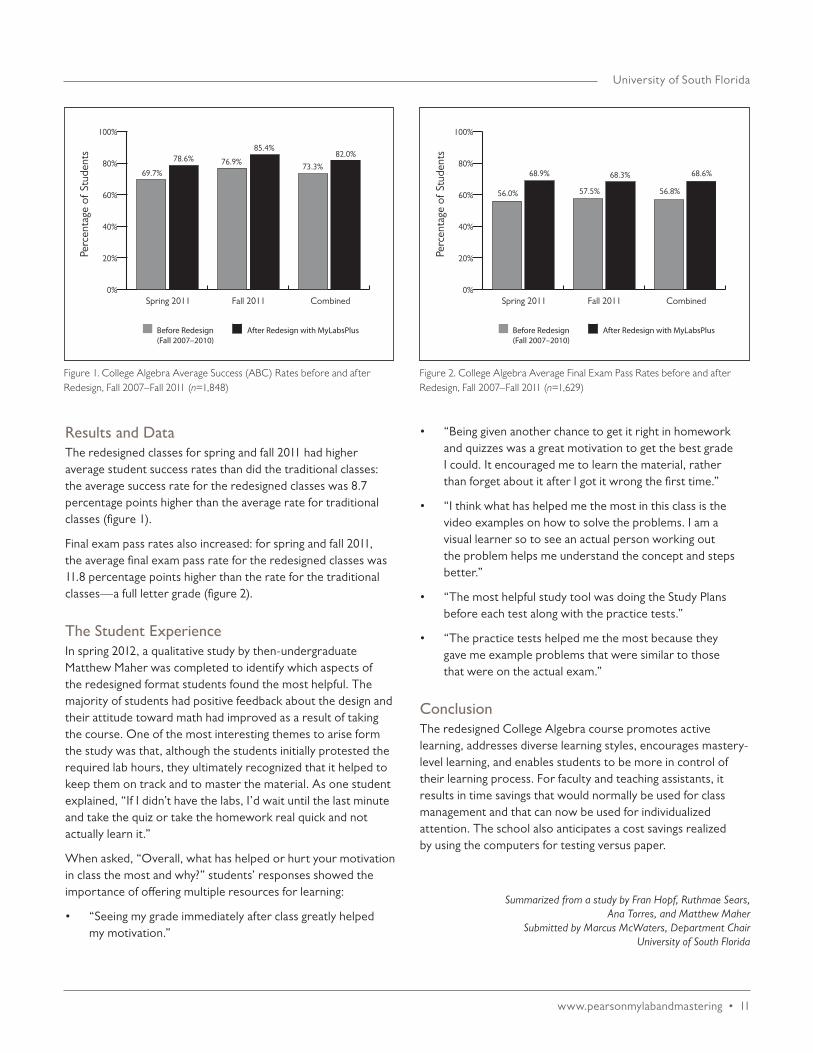
Results and DataThe redesigned classes for spring and fall 2011 had higher average student success rates than did the traditional classes: the average success rate for the redesigned classes was 8.7 percentage points higher than the average rate for traditional classes (figure 1).
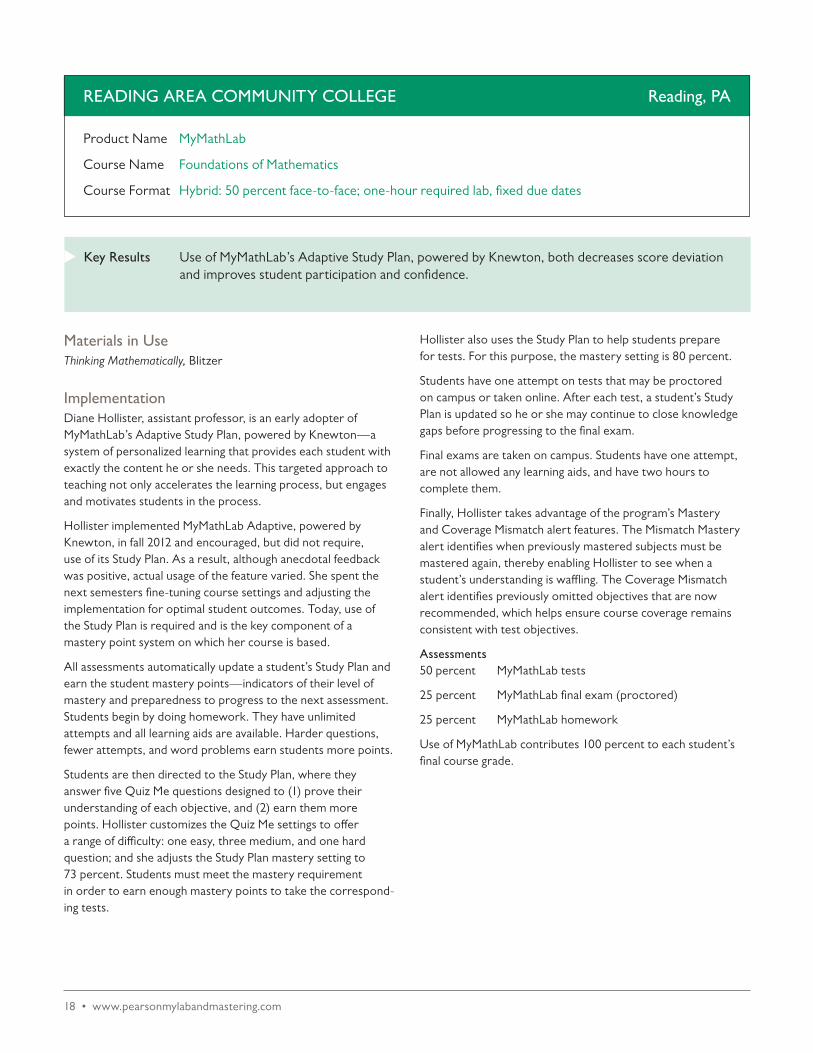
Final exam pass rates also increased: for spring and fall 2011, the average final exam pass rate for the redesigned classes was 11.8 percentage points higher than the rate for the traditional classes—a full letter grade (figure 2).
The Student ExperienceIn spring 2012, a qualitative study by then-undergraduate Matthew Maher was completed to identify which aspects of the redesigned format students found the most helpful. The majority of students had positive feedback about the design and their attitude toward math had improved as a result of taking the course. One of the most interesting themes to arise form the study was that, although the students initially protested the required lab hours, they ultimately recognized that it helped to keep them on track and to master the material. As one student explained, “If I didn’t have the labs, I’d wait until the last minute and take the quiz or take the homework real quick and not actually learn it.”
When asked, “Overall, what has helped or hurt your motivation in class the most and why?” students’ responses showed the importance of offering multiple resources for learning:
• “Seeing my grade immediately after class greatly helped my motivation.”
• “Being given another chance to get it right in homework and quizzes was a great motivation to get the best grade I could. It encouraged me to learn the material, rather than forget about it after I got it wrong the first time.”
• “I think what has helped me the most in this class is the video examples on how to solve the problems. I am a visual learner so to see an actual person working out the problem helps me understand the concept and steps better.”
• “The most helpful study tool was doing the Study Plans before each test along with the practice tests.”
• “The practice tests helped me the most because they gave me example problems that were similar to those that were on the actual exam.”
ConclusionThe redesigned College Algebra course promotes active learning, addresses diverse learning styles, encourages mastery-level learning, and enables students to be more in control of their learning process. For faculty and teaching assistants, it results in time savings that would normally be used for class management and that can now be used for individualized attention. The school also anticipates a cost savings realized by using the computers for testing versus paper.
Figure 1. College Algebra Average Success (ABC) Rates before and after Redesign, Fall 2007–Fall 2011 (n=1,848)
Spring 2011 Fall 2011 Combined0%
20%
40%
60%
80%
100%
Perc
enta
ge o
f St
uden
ts
69.7%
78.6% 76.9%
Before Redesign(Fall 2007–2010)
After Redesign with MyLabsPlus
85.4%
73.3%
82.0%
Figure 2. College Algebra Average Final Exam Pass Rates before and after Redesign, Fall 2007–Fall 2011 (n=1,629)
Spring 2011 Fall 2011 Combined0%
20%
40%
60%
80%
100%
Perc
enta
ge o
f St
uden
ts
56.0%
68.9%
57.5%
Before Redesign(Fall 2007–2010)
After Redesign with MyLabsPlus
68.3%
56.8%
68.6%

12 • www.pearsonmylabandmastering.com
t
Materials in UseDevelopmental Math, Squires & Wyrick
ImplementationChattanooga State’s math department employs U Do the Math, a nationally acclaimed program and winner of the 2009 Bellwether Award and 2014 Bellwether Legacy Award conceived by John Squires, math department head.
Classes are limited to 24 students; most classes have 15–20 students. There is one tutor or faculty member for each 15–20 students in the lab. Students receive individual help in both the lab and classroom.
The math curriculum is organized into modules of one to five sections and 50 problems of homework per week. Students watch videos of the material and complete the module home-work on MyLabsPlus. Students are required to show their notes to the faculty and tutors when testing and as part of their attendance grade. After watching the videos and completing the homework, students take a module quiz comprising 10 problems from the module homework. Each course includes a midterm and a final exam consisting of 15 problems each. Quizzes and exams are taken in the classroom or the lab.
Students must score at least 90 percent on homework, 80 percent on quizzes, and 75 percent on exams. They may take quizzes multiple times and only their best scores count. Students who fail quizzes receive help, are assigned more work, and may attempt the quizzes again. Once they pass their quizzes, they may retake them again for even higher scores.
Chattanooga State also implements a continuous enrollment system in which students who complete one course—develop- mental or college-level—can start their next course immedi-ately. Students who complete multiple courses in one semester may add the second course and receive credit for the course that semester. Students that start in a course and only complete part of the course may take the course the next semester and the work they have completed will transfer in. The effect of the continuous enrollment plan is that it encourages students to keep working and it rewards them for doing so.
Assessments60 percent MyLabsPlus unit exams
15 percent MyLabsPlus quizzes
15 percent MyLabsPlus homework
10 percent Work ethic (weekly class and lab attendance, plus demonstrated progress in the course)
Use of MyLabsPlus contributes 90 percent to each student’s final course grade.
Results and DataSince implementing U Do the Math, Chattanooga State’s success rates have dramatically improved (figure 1):
• Developmental math success rates increased 37.5 percent—from 48 percent before redesign to 66 percent after implementation.
• College math success rates increased 13.8 percent— from 65 percent before redesign to 74 percent after implementation.
the number of students succeeding in college math has increased by more than 60 percent since the redesign, and college math enrollment has exceeded developmental math enrollment for the past seven semesters (figure 2).
Key Results The Do the Math modified emporium model increased pass rates and closed the achievement gap between the college’s low-income and other students.
CHATTANOOGA STATE COMMUNITY COLLEGE Chattanooga, TN
Product Name MyLabsPlus
Course Names Elementary Algebra, Intermediate Algebra, and other College Math courses
Course Format Modified emporium: mastery-based, flexible pacing, scheduled classes, and open lab
Read more about how U Do the Math helps students gain an edge in math. Visit the online education technology blog, edCetera, where the program was spotlighted on April 3, 2014. http://edcetera.rafter.com/tools-to-help-students-pass-college-level-math-courses/

www.pearsonmylabandmastering.com • 13
Chattanooga State Community College
Low-income students performed at nearly identical levels when compared to all students and experienced accelerated progress through the developmental math sequence:
• Low-income students in Elementary and Intermediate Algebra achieved within two percentage points of overall success rates.
• Fall-to-spring retention rates for low-income students in Elementary and Intermediate Algebra were nearly identical to overall retention rates.
• In Elementary Algebra, the percentage of low-income students completing more than one course was within one percentage point of the overall rate.
Finally, independent research group, SRI International, in conjunction with Next Generation Learning Challenges, found that U Do the Math has a “statistically significant impact on student outcomes” (z=14.670).
The Student ExperienceSquires reports that students who participate in U Do the Math display none of the anxiety problems that exist in typical math classes. “The low stakes quizzes and tests and the mastery approach to learning combine to eliminate testing anxiety,”
he says. “Students focus on learning the material, not simply performing acceptably on high-stakes tests on a given day.” Students realize they can get their questions answered in both the class and lab. Squires also observes that students with special needs and disabilities do well in the redesign program.
In addition, students like the continuous enrollment option and they take advantage of it. In academic year 2012/13, 385 students completed multiple math courses in one semester, including some students who completed three courses.
ConclusionEstablishing a friendly environment in both the lab and the classrooms has been critical to the success of the program. “We tell students that they are here to work on math and that the instructors are here to help them,” says Squires. “We also tell them that they are going to do more work than ever before and get more help than ever before.” Since there is no difference between what students do in the classroom and the lab, the tone of each course is established from the onset.
Submitted by John Squires, U Do the Math Program Director and Math Department Head
Chattanooga State Community College
Figure 1. Developmental and College Math Success Rates before and after Redesign with MyLabsPlus, Fall 2007 and Fall 2012 (n=8,300)
Develomental Math College Math 0%
20%
40%
60%
80%
100%
Perc
enta
ge o
f St
uden
ts
48%
66%
Before redesign with MyLabsPlus (fall 2007)
After redesign with MyLabsPlus (fall 2012)
65%
74%
Figure 2. Developmental and College Math Enrollment and College Math Passing Data per Semester before and after Redesign with MyLabsPlus
Develomental Math College Math Students Passing Enrollment Enrollment College Math
0
500
1000
1500
2000
2500
Num
ber
of S
tude
nts
2500
1800
Before redesign with MyLabsPlus After redesign with MyLabsPlus
1800
2500
1100
1800
“Students focus on learning the material, not simply performing acceptably on high stakes tests on a given day.”

t
14 • www.pearsonmylabandmastering.com
Key Results Approximately 49 percent of students in a Math Advancement Program using MyMathLab completed both Beginning Algebra and Intermediate Algebra in one semester.
Materials in UseElementary and Intermediate Algebra: Concepts and Applications, Bittinger
ImplementationEast Los Angeles College found a strong relationship between the length of time between sequential developmental math courses and success in the course: students who received an A in Elementary Algebra had a 55.6 percent chance of passing Intermediate Algebra if they waited two or more semesters, but their chance of passing the subsequent course increased to 82.8 percent if they took the course the next semester.
Program DesignTo alleviate time lapses between courses, the college created the Math Advancement Program (MAP). The MAP condenses two courses into two eight-week sessions. All students take the Elementary Algebra course the first eight weeks, and if they pass, they progress to Intermediate Algebra. No material is omitted in either course, and courses cover the same amount of material in half the time by meeting twice as often. Students who participate in MAP attend a special orientation session at the start of the semester. Classes meet four days a week for 2.5 hours a day. In addition, students are required to spend 1.5 hours on campus every Friday to work on material selected by the instructor or to take exams. This is also when students receive one-on-one help with homework and instructors make sure students are on track.
East Los Angeles College uses MyMathLab for homework and quizzes. Each homework comprises about 25 questions, which sometimes include media assignments. In addition, instructors use the Search/E-mail by Criteria function in the Gradebook to target students who are falling behind.
Assessments45 percent Paper-and-pencil exams (3)
25 percent Final exam
10 percent MyMathLab quizzes
10 percent MyMathLab homework
10 percent Extra in-class packages
Use of MyMathLab contributes 20 percent to each student’s final course grade.
EAST LOS ANGELES COLLEGE Montery Park, CA
Product Name MyMathLab
Course Names Beginning Algebra, Intermediate Algebra
Course Format Hybrid: face-to-face + 1.5 hours in open lab
“Students are required to spend 1.5 hours on campus every Friday to work on material selected by the instructor or to take exams.
This is also when students receive one-on-one help with homework and instructors make sure
students are on track.”

www.pearsonmylabandmastering • 15
East Los Angeles College
Submitted by Rahim Faradineh, Professor and Ruben Arenas, Associate Professor
East Los Angeles College
Results and DataOn average, MAP students completed the two-course algebra sequence at a much higher rate than their peers: 48.5 percent of MAP students successfully completed the sequence, compared to the collegewide rate of 28.7 percent for students who took the first course in the fall semester and the second in the winter or spring semester.
Success rates also improved. In aggregate, MAP students were more successful with 62.3 percent of Beginning Algebra students earning an A, B, or C, compared to 42.9 percent collegewide (figure 1). Of the 72 students who enrolled in MAP for Beginning Algebra, 39 progressed to Intermediate Algebra in the same semester and 33 of those students successfully completed it—that’s an 84.6 percent success rate for Inter- mediate Algebra, compared to the collegewide success rate of 45.9 percent (figure 2).
The Student ExperienceUnderscoring the tremendous success of the school’s MAP program is the program’s significantly higher percentage of first-time students compared to the traditional courses: 32.9 percent compared to 5.8 percent. In addition, MAP students were generally younger than the general Beginning Algebra population: 57.5 percent were under 20 years of age, compared to 36 percent in the traditional courses.
Because first-time students formed such a large population in the MAP, the school looked at their performance:
• 62.5 percent of first-time students passed the MAP Beginning Algebra, compared to 43.5 percent collegewide.
• 92.3 percent of first-time students passed the MAP Intermediate Algebra, compared to 46.7 percent collegewide.
ConclusionIn addition to continuing its Math Advancement Program, East Los Angeles College has plans to create a comprehensive, data-driven program that leverages the MAP’s successes. Plans include replacing Friday tutoring with a one-unit course designed to reinforce and extend skills such as solving word problems and study skills, and determing the student popula-tions best served by the MAP model. Current data indicates that first-time students are a good target population, as they succeeded at the subsequent course at almost twice the rate of their counterparts who did not participate in the MAP.
Figure 1. Beginning Algebra Average Success Rates for MAP Students Using MyMathLab and Collegewide, Spring 2012 (n=1,921)
Spring 2012 Aggregate 0%
20%
40%
60%
80%
100%
Perc
enta
ge o
f St
uden
ts
45.4%
56.9%
East Los Angeles College Math Advancement Program with MyMathLab
42.9%
62.3%
Figure 2. Intermediate Algebra Average Success Rates for MAP Students Using MyMathLab and Collegewide, Spring 2012 (n=2,181)
Spring 2012 Aggregate 0%
20%
40%
60%
80%
100%
Perc
enta
ge o
f St
uden
ts
45.9%
84.6%
East Los Angeles College Math Advancement Program with MyMathLab
51.0%
60.0%

16 • www.pearsonmylabandmastering.com
t
Materials in UseDevelopmental Math, Martin-Gay; custom workbook
ImplementationStudents watch lectures and read the workbook at home, then receive on-demand tutoring from instructors and tutors during class, which meets in the lab. The emphasis is on active reading, critical thinking, and personal responsibility for student learning.
For each semester that they participate in the program, students register for a Shell Course in which content is divided into eight modules, also called DMAs. Flexible pacing allows students to both work ahead and devote more time to difficult topics. The average time to complete each DMA is four weeks.
Each module is completed in MyLabsPlus and includes the following:
• Diagnostic test. Students who earn a score of at least 85 immediately progress to the next module. Students who score less than 85 are required to complete both the module in MyLabsPlus and its corresponding sections in the LEAP Log (workbook). Students only complete the material within the module that they have not demonstrated mastery on.
• The LEAP Log. Each section includes reading and written exercises. Students must show all work and turn it in to be checked for completion before proceeding to the test. Corresponding MyLabsPlus lecture videos are optional but highly recommended.
• Homework. Students must earn a score of 100 before proceeding to the next section. Students may request help from an instructor, they have unlimited attempts, and all learning aids are available except “Show Me an Example.”
• Quizzes. Students take one quiz halfway through the module and another at the end of it. No instructor or tutor assistance is allowed and learning aids are turned off. Students have four attempts to score at least 85 before they are required to repeat the section. Instructor intervention is required after two failed attempts.
• Review Homework. Students complete a comprehensive homework assignment at the end of each module. A score of 100 is required to progress from the section. No learning aids are allowed, students have unlimited attempts.
• Module Test (proctored, password protected). Upon completion of the rest of the module, students take a comprehensive Module Test. They have four attempts and must score at least 80 to pass the module. Each time a student scores less than 80, they remediate via personalized MyLabsPlus homework. Students must score 100 on the personalized homework before retaking the Module Test. After four unsuccessful attempts, a student must rework the entire module.
GTCC utilizes almost every feature of MyLabsPlus, including Personalized Homework, Prerequisites, Instructor Tips, and the Study Plan.
Assessments (each module)90 percent MyLabsPlus module exam (proctored)
5 percent MyLabsPlus quizzes
5 percent MyLabsPlus homework
Use of MyMathLab contributes 100 percent to each student’s final course grade
Key Results After redesigning its developmental math sequence with MyLabsPlus in an emporium model, Guilford Technical Community College significantly increased the average success rate of each developmental math course and achieved an 85 percent average subsequent course success rate.
GUILFORD TECHNICAL COMMUNITY COLLEGE Jamestown, NC
Product Name MyLabsPlus
Course Name Developmental Math Sequence
Course Format Emporium: scheduled meeting times, flexible pacing, mastery learning

www.pearsonmylabandmastering.com • 17
Submitted by Susan Barbitta, Developmental Math Instructor
Guilford Technical Community College
Guilford Technical Community College
Results and DataDevelopmental math success rates have steadily increased with the MyLabsPlus redesign. Intermediate Algebra success rates, for example, increased from 62 percent in spring 2011 to 87 percent in summer 2012 (table 1).
In addition, students are experiencing increased success in subsequent courses. At the end of summer 2012, develop- mental math students saw an average 85 percent success rate in their next math courses (figure 1).
The Student ExperienceSusan Barbitta, developmental math instructor, reports that students quickly realized the benefits of the MyLabsPlus redesigned format. The following student comments reflect their preference for the new program’s flexibility and individualized instruction:
• “I hate to work at someone else’s pace. This course gives me the ability to learn the way I learn.”
• “I like that I can complete the course at my own speed and not the speed of the class. I comprehend more at my own rate.”
• “All of my class time is actively used, instead of getting lectured at and being lost.”
• “I like the individualized attention—a teacher is always available to answer my questions.”
Student comments have helped spur programmatic changes. By listening to students, faculty learned that different explanations from different tutors created confusion. As a result, the depart-ment agreed on one method to explain concepts, and all tutors now adhere to that method.
Figure 1. Average Subsequent Success (ABC) Rates for Developmental Math Students, Spring 2011–Summer 2012 (n=7,000)
Essential Math Introductory Intermediate Algebra Algebra
0%
20%
40%
60%
80%
100%
Ave
rage
Fin
al C
ours
e G
rade
TraditionalSpring 2011–Fall 2011
RedesignSpring 2011–Fall 2011
65%59%
RedesignFall 2011–Summer 2012
65% 87%
62%
86%82% 83%
80%
Essential Introductory Intermediate Semester Format Math Algebra Algebra
Spring Traditional 66% 73% 62% 2011 Redesign 93% 80% 72%
Fall Traditional 73% 73% 66% 2011 Redesign 80% 58% 59%
Spring 2012 Redesign 72% 82% 64%
Summer 2012 Redesign 82% 82% 87%
Table 1. Average Success (ABC) Rates before and after MyLabsPlus Redesign, Spring 2011–Summer 2012 (n=7,000)
ConclusionGuilford Technical Community College’s developmental math redesign enhances its students’ quality of learning. The guided module design offers students immediate feedback and promotes that they become more active and engaged learners.
“The personalized homework feature in MyLabsPlus enables students to focus on what they don’t know, and gives them credit for concepts in which they can demonstrate mastery,” says Barbitta. “This combination of guided content learning, acceleration, and remediation as needed, helps students successfully complete their courses. The mastery approach, reinforced by regular testing, increases the cumulative learning effect from module to module. As a result, students are more successful in subsequent math courses.”
According to another faculty member, “Students learn by doing, not by watching. With MyLabsPlus, they are responsible for what they learn and how quickly they learn it.”
t
18 • www.pearsonmylabandmastering.com
Key Results Use of MyMathLab’s Adaptive Study Plan, powered by Knewton, both decreases score deviation and improves student participation and confidence.
Materials in UseThinking Mathematically, Blitzer
ImplementationDiane Hollister, assistant professor, is an early adopter of MyMathLab’s Adaptive Study Plan, powered by Knewton—a system of personalized learning that provides each student with exactly the content he or she needs. This targeted approach to teaching not only accelerates the learning process, but engages and motivates students in the process.
Hollister implemented MyMathLab Adaptive, powered by Knewton, in fall 2012 and encouraged, but did not require, use of its Study Plan. As a result, although anecdotal feedback was positive, actual usage of the feature varied. She spent the next semesters fine-tuning course settings and adjusting the implementation for optimal student outcomes. Today, use of the Study Plan is required and is the key component of a mastery point system on which her course is based.
All assessments automatically update a student’s Study Plan and earn the student mastery points—indicators of their level of mastery and preparedness to progress to the next assessment. Students begin by doing homework. They have unlimited attempts and all learning aids are available. Harder questions, fewer attempts, and word problems earn students more points.
Students are then directed to the Study Plan, where they answer five Quiz Me questions designed to (1) prove their understanding of each objective, and (2) earn them more points. Hollister customizes the Quiz Me settings to offer a range of difficulty: one easy, three medium, and one hard question; and she adjusts the Study Plan mastery setting to 73 percent. Students must meet the mastery requirement in order to earn enough mastery points to take the correspond-ing tests.
Hollister also uses the Study Plan to help students prepare for tests. For this purpose, the mastery setting is 80 percent.
Students have one attempt on tests that may be proctored on campus or taken online. After each test, a student’s Study Plan is updated so he or she may continue to close knowledge gaps before progressing to the final exam.
Final exams are taken on campus. Students have one attempt, are not allowed any learning aids, and have two hours to complete them.
Finally, Hollister takes advantage of the program’s Mastery and Coverage Mismatch alert features. The Mismatch Mastery alert identifies when previously mastered subjects must be mastered again, thereby enabling Hollister to see when a student’s understanding is waffling. The Coverage Mismatch alert identifies previously omitted objectives that are now recommended, which helps ensure course coverage remains consistent with test objectives.
Assessments50 percent MyMathLab tests
25 percent MyMathLab final exam (proctored)
25 percent MyMathLab homework
Use of MyMathLab contributes 100 percent to each student’s final course grade.
READING AREA COMMUNITY COLLEGE Reading, PA
Product Name MyMathLab
Course Name Foundations of Mathematics
Course Format Hybrid: 50 percent face-to-face; one-hour required lab, fixed due dates
www.pearsonmylabandmastering • 19
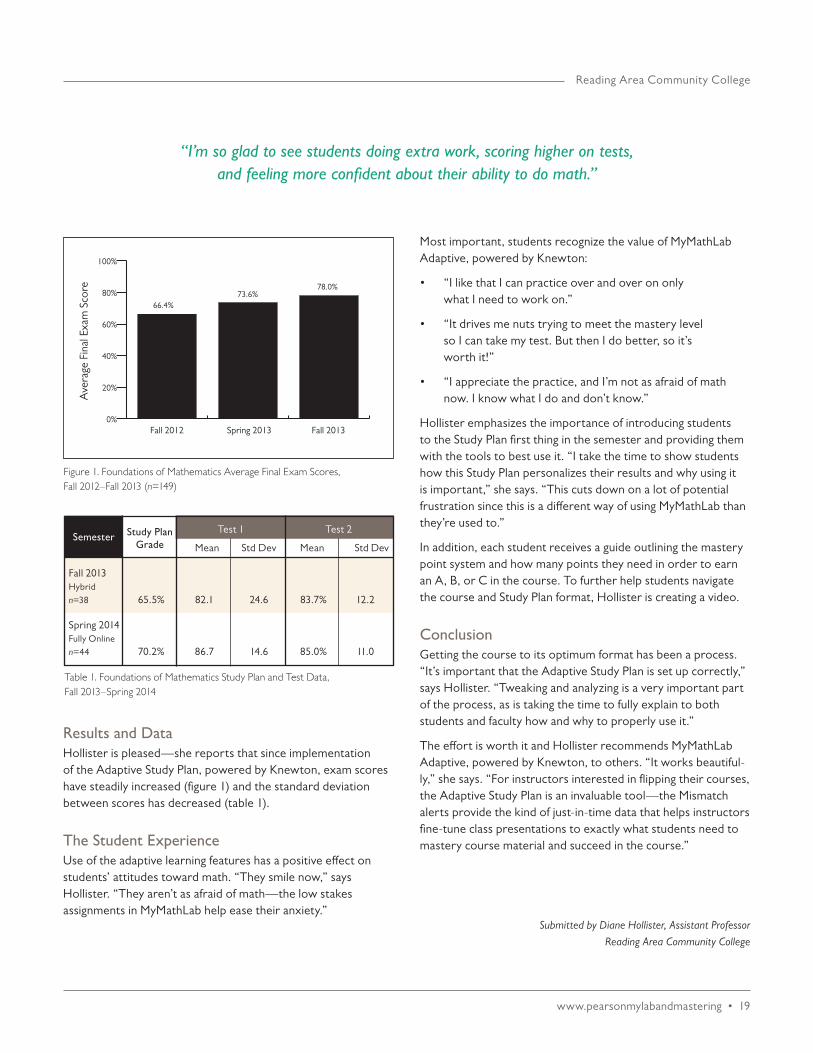
Results and DataHollister is pleased—she reports that since implementation of the Adaptive Study Plan, powered by Knewton, exam scores have steadily increased (figure 1) and the standard deviation between scores has decreased (table 1).
The Student ExperienceUse of the adaptive learning features has a positive effect on students’ attitudes toward math. “They smile now,” says Hollister. “They aren’t as afraid of math—the low stakes assignments in MyMathLab help ease their anxiety.”
Reading Area Community College
Submitted by Diane Hollister, Assistant Professor
Reading Area Community College
“I’m so glad to see students doing extra work, scoring higher on tests, and feeling more confident about their ability to do math.”
Test 1 Test 2
Mean Std Dev Mean Std Dev
Fall 2013 Hybrid n=38 65.5% 82.1 24.6 83.7% 12.2
Spring 2014 Fully Online n=44 70.2% 86.7 14.6 85.0% 11.0
Semester
Table 1. Foundations of Mathematics Study Plan and Test Data, Fall 2013–Spring 2014
Study Plan Grade
Most important, students recognize the value of MyMathLab Adaptive, powered by Knewton:
• “I like that I can practice over and over on only what I need to work on.”
• “It drives me nuts trying to meet the mastery level so I can take my test. But then I do better, so it’s worth it!”
• “I appreciate the practice, and I’m not as afraid of math now. I know what I do and don’t know.”
Hollister emphasizes the importance of introducing students to the Study Plan first thing in the semester and providing them with the tools to best use it. “I take the time to show students how this Study Plan personalizes their results and why using it is important,” she says. “This cuts down on a lot of potential frustration since this is a different way of using MyMathLab than they’re used to.”
In addition, each student receives a guide outlining the mastery point system and how many points they need in order to earn an A, B, or C in the course. To further help students navigate the course and Study Plan format, Hollister is creating a video.
ConclusionGetting the course to its optimum format has been a process. “It’s important that the Adaptive Study Plan is set up correctly,” says Hollister. “Tweaking and analyzing is a very important part of the process, as is taking the time to fully explain to both students and faculty how and why to properly use it.”
The effort is worth it and Hollister recommends MyMathLab Adaptive, powered by Knewton, to others. “It works beautiful-ly,” she says. “For instructors interested in flipping their courses, the Adaptive Study Plan is an invaluable tool—the Mismatch alerts provide the kind of just-in-time data that helps instructors fine-tune class presentations to exactly what students need to mastery course material and succeed in the course.”
Figure 1. Foundations of Mathematics Average Final Exam Scores, Fall 2012–Fall 2013 (n=149)
Fall 2012 Spring 2013 Fall 20130%
20%
40%
60%
80%
100%
Ave
rage
Fin
al E
xam
Sco
re
66.4%73.6%
78.0%

t
20 • www.pearsonmylabandmastering.com
Key Results Moving to a MyLabsPlus-supported, hybrid model produced dramatic increases in pass rates, including a 129.9 percent boost for Intermediate Algebra.
Materials in UseBasic College Mathematics, Bittinger; Elementary and Intermediate Algebra, Bittinger, Ellenbogen, and Johnson
ImplementationApproximately 70 percent of incoming freshmen at South Arkansas Community College require remediation in math. For them, the college offers three course levels: Fundamentals of Arithmetic, Elementary Algebra, and Intermediate Algebra. For approximately six years, SouthArk offered developmental math classes using the emporium (self-paced) model without significant success. Low pass rates adversely affected student morale and retention rates, students complained as they were forced to repeat courses, and instructors struggled to make the model work.
In fall 2011, the school moved from the self-paced model to a hybrid model. The new approach requires students to attend class four days a week—two in lecture/discussion and two in computer labs with qualified tutors and instructors. Assignments are developed with prerequisites for progres-sion and due dates. Students are allowed unlimited attempts on homework before the due date and are penalized for late assignments. In addition, students are allowed ten attempts on quizzes, and one attempt on tests and the comprehensive final.
Students use MyLabsPlus for homework, quizzes, tests, and the final exam. They also use its Study Plan and interactive learning features. Instructors use a variety of MyLabsPlus diagnostics and features to evaluate student strengths and weaknesses, including the Study Plan and Item Analysis feature in the Gradebook.
Assessments55 percent MyLabsPlus tests (five)
25 percent MyLabsPlus final
10 percent MyLabsPlus quiz
10 percent MyLabsPlus homework
Use of MyMathLab contributes 100 percent to each student’s final course grade.
Results and DataAfter implementing MyLabsPlus in the new hybrid system, students’ course grades have made impressive gains. Figure 1 shows significant increases in pass rates since fall 2011, most notably a jump in Intermediate Algebra pass rates from 30.5 percent in fall 2010 to 73.9 percent in fall 2011.
SOUTH ARKANSAS COMMUNITY COLLEGE El Dorado, AR
Product Name MyLabsPlus
Course Names Fundamentals of Arithmetic, Elementary Algebra, Intermediate Algebra
Course Format Hybrid: scheduled lab and fixed due dates

www.pearsonmylabandmastering • 21
South Arkansas Community College
Submitted by Joseph Agbeko, Assistant Professor and Developmental Math Coordinator
South Arkansas Community College
“The most gratifying aspect of the whole experience has been the dramatic change in student success rates and student feedback.”
Figure 1. Pass Rates for Developmental Math Sequence before and after MyLabsPlus Implementation and Program Redesign
0%
20%
40%
60%
80%
100%
Perc
enta
ge o
f St
uden
ts
Fundamentalsof Arithmetic
Intermediate Algebra
Elementary Algebra
Fall 2
008
Sprin
g 2009
Fall 2
009
Sprin
g 2010
Fall 2
010
Sprin
g 2011
Fall 2
011
Sprin
g 2012
Fall 2
012
Sprin
g 2013
Before MyLabsPlus After MyLabsPlus
The Student ExperienceThe school has a widely varied student population, from stu-dents who graduated very recently to those who haven’t taken a math class since 1971. Many students worry that they will continue to fail at math as they did in prior math courses. One student said, “Everything about math is frightening… it scares me.” When asked to what he attributed his success in the new math course, that same student replied, “Without MyLabsPlus I wouldn’t be sitting right where I am right now.”
Other students also had positive feedback about the program and MyLabsPlus:
• “With MyLabsPlus I didn’t have to find a tutor because I already had a personal tutor in it. I also liked Help Me Solve This—it took me through all the steps and made me solve another problem, so I had to learn it.”
• “MyLabsPlus provided help when I didn’t understand something, but it challenged me to figure out the answer.”
• “I live 30 miles from school, so it’s not convenient for me to use the computers at school—MyLabsPlus makes it conve-nient for me to do my homework at home.”
ConclusionFaculty attribute the success of the redesigned developmental math program to three main factors: (1) the teamwork of dedi-cated instructors, (2) the new model’s use of both classroom instruction and individualized lab work, and (3) the support of Pearson’s software and textbooks.
“We were initially concerned about implementing our new developmental math program, but we have experienced very positive results. The most gratifying aspect of the whole experience has been the dramatic change in student success rates and in student feedback,” says Assistant Professor and Developmental Math Coordinator, Joseph Agbeko.
With the success of the redesigned developmental math courses, the school plans to apply a similar model to its college-level math courses during the 2014-15 academic year.

22 • www.pearsonmylabandmastering.com
t
Pilot InformationSummer 2012 PilotStudies show that students who start college fully college ready are more likely to persist term-to-term and to degree or certificate completion. With this in mind, in summer 2012 Florida State College at Jacksonville (FSCJ) ran a PERT Diagnostic, Remediation, and Retest pilot at Kent Campus using software from a non-Pearson vendor. The goal of the pilot was to accelerate student progression from developmental courses to college credit-bearing courses for the fall semester. Students who tested into two or fewer upper-level developmental courses (based on their PERT scores) were selected to partici-pate. Students paid a $22 PERT retake fee, took a diagnostic in the appropriate area(s), and worked on their own time on the learning outcomes in which they needed remediation. After two to four weeks, they retested on the PERT.
In the 2012 pilot, 34.7 percent of students passed their PERT math, reading, or writing retests. The program did not meet school expectations in mathematics and lacked tutorial support. The program was reassessed and another pilot was planned for summer 2013.
PERT Placement Score AnalysisI wanted to find out if PERT placement test cut score ranges are a predictor for likelihood of success. Analysis had already been conducted to examine the relationship between PERT placement score ranges and subsequent course success for 1,227 students who completed Basic Math for the fall 2012 term. Students who scored in the upper half of the PERT placement score range had a 75.8 percent average likelihood of success in the course compared to 54.2 percent of students with PERT scores in the lower half of the range.
Additional analysis was done in upper level developmental math, reading, and writing courses comparing course success to PERT placement score ranges divided into quartiles. We found a high correlation between students who had math PERT scores
in the upper two quartiles of the placement range and likelihood of success in the course. There was no statistical significance in writing and moderate statistical significance in reading. We used this data to plan a summer 2013 pilot using MyFoundationsLab.
Summer 2013 PilotA new, collegewide pilot was launched in summer 2013 with MyFoundationsLab and Smarthinking math tutors. The goal of the program is to provide a zero-cost way to accelerate a specific group of students into college credit-bearing courses. The program is run out of each campus’s assessment and certification center and is funded by the $22 PERT retest fees.
A total of 250 students from FSCJ’s five major campuses will complete the pilot. Eligible students are those who place into upper-level developmental courses and have PERT scores in the upper two quartiles for math and reading; for writing, any PERT score placing a student into upper-level writing is acceptable.
ImplementationStudents take the PERT in their campus assessment center. If a student’s PERT scores fall within the required range, the assessment manager calls the student and explains the program, emphasizing that after working in MyFoundationsLab for a short amount of time, the student may retest and accelerate into college credit-bearing courses for the fall.
We let students know why they are a candidate for the program. We are completely transparent with the data and show that if they put in the effort, they are likely to succeed.
Each student takes the MyFoundationsLab Path Builder. Assessment managers review the scores and personalized Learning Paths with each student, explaining which areas are mastered, which still need mastery, and how to progress through the MyFoundationsLab Learning Path. Managers also demonstrate how to use Smarthinking online tutoring.
Key Results Nearly-college-ready students (based on PERT placement scores) seeking to accelerate into college credit-bearing courses are successful via a low-cost, self-directed remediation program using MyFoundationsLab.
FLORIDA STATE COLLEGE AT JACKSONVILLE Jacksonville, FL
Product Name MyFoundationsLab
Course Name Postsecondary Education Readiness Test (PERT) Diagnostic, Remediation, and Retest Pilot
Course Format Online

www.pearsonmylabandmastering.com • 23
Submitted by Rich Turner
Assessment and Certification Center Manager, Kent Campus
Florida State College at Jacksonville
PERT retests are scheduled a minimum of two weeks out. Students who need to retest in more than one area are given at least four weeks before retesting. When students retest, they know it is a big deal. Reality sets in and they don’t want to have to take developmental courses.
Benefits and best practicesWe reduced the Path Builder to 40 questions to harness the robust math portion of MyFoundationsLab, to facilitate navigation of the technology by students who can easily become overwhelmed, and to align with the learning outcomes of Elementary and Intermediate Algebra.
Some students choose not to retest and instead start the fall term in upper-level developmental courses. Via self-directed learning, these students recognize that they aren’t ready for college credit-bearing courses. This in itself is a success story: students recognizing their own needs.
Results and Data• Student success rates on the PERT retest jumped from
27.8 percent to 52.6 percent in Math and from 33.3 percent to 66.6 percent in Writing. Reading rates slightly dropped.
• On average, 55 percent of the students who retested placed into college credit-bearing courses.
• Students who spent more than 40 hours in the math portion of MyFoundationsLab showed the most success when retesting.
The Student ExperienceStudents were completely self-directed and self-motivated to succeed. Instead of spending 16 weeks and hundreds of dollars on developmental education, students are able to start their college education earning credit towards their degree.
ConclusionWe attribute the increased PERT retest rates to the following factors: (1) MyFoundationsLab is more aligned to the program than the software used in the 2012 pilot; (2) the 2013 pilot targets students who are more likely to be successful in the program based on their PERT placement scores; and (3) the proactive approach taken by the Assessment Center managers take in interacting with and encouraging students.
Data analysis tracking the short- and long-term results of students who have completed the pilot program with MyFoundationsLab has already begun. We’ll investigate whether or not the MyFoundationsLab students are more academically successful than their on-campus counterparts who take traditional developmental courses, and if they they are more likely to persist to degree or certificate completion.
The MyFoundationsLab program is an economical option for FSCJ students who place into upper-level developmental education courses. In the future, I see it being used for all developmental education students, as a low-cost, boot camp remediation with faculty oversight, as a gateway course, or in a modularized course.
Florida State College at Jacksonville
Math Reading Writing Total0%
20%
40%
60%
80%
100%
Perc
enta
ge o
f St
uden
ts
52.6
Summer 2012 pilot Summer 2013 pilot(with MyFoundationsLab)
27.8
60.0
52.055.0
34.7
66.6
33.3
Figure 1. Percentage of Students who Retested College-Ready on the PERT (2012 Pilot: n=72 students / Math n=54, Reading n=15, Writing n=3; 2013 Pilot: n=127 / Math n=78; Reading n=25; Writing n=24)
“Instead of spending 16 weeks and hundreds of dollars on developmental education,
students are able to start their college education earning credit towards their degree.”
24 • www.pearsonmylabandmastering.com
t
Materials in UseCollege Algebra, Lial
ImplementationAt St. Philip’s College, part of the Alamo College district, Professor Tony Bower teaches several college algebra sections in a fully online environment. His online students typically are not STEM majors, some are attempting the course for the second time, and many are nontraditional students. Students are required to come to campus only to take the proctored final. Those living outside of the county may, with Bower’s permission, take the final in a confirmed-secure, off-campus, proctored location.
Bower requires that all students register in MyMathLab by the end of the first week of class. Students who do not are dropped from the class. MyMathLab’s 14-day trial period option helps alleviate any issues students may have getting registered due to financial aid issues, so most students are able to comply with this policy. To further help students get started, the first graded MyMathLab homework assignment covers how to use the program, and completion of that assignment is a prerequisite to opening the next three assignments.
Bower generally assigns one homework assignment per section covered in the course; each assignment contains a multimedia feature to be viewed prior to opening the problems. Due dates keep students on track, although there is no penalty for late submissions. Homework assignments remain open for the entire semester, thereby enabling students to work ahead if they wish. Students have unlimited attempts, and all learning aids are available. Students must score at least 50 percent on every homework in order to take the test.
MyMathLab quizzes also remain open all semester, but are timed at approximately 45 minutes. Students may use MyMathLab to both review for the quiz and complete a post-quiz review if they aren’t satisfied with their quiz score.
Students are required to complete a MyMathLab review for each MyMathLab test. Reviews reflect the content of the tests but contain twice as many problems. Students have one attempt at completing each test. If they are not satisfied with their grade, they may complete a post-test review—a Personalized Homework based on the results of their test, on which they must score at least an 80 to regain access to the test for one week. Tests are timed at 120 minutes and must be taken in one sitting.
Assessments45 percent MyMathLab tests (3)
25 percent Final exam (in a proctored facility on or off campus)
15 percent MyMathLab quizzes (2)
15 percent MyMathLab homework
Use of MyMathLab contributes 75 percent to each student’s final course grade.
Key Results Students in a fully online college algebra course who take advantage of an option to retest experience an average test score improvement of 11.56 points.
ST. PHILIP’S COLLEGE San Antonio, TX
Product Name MyMathLab
Course Name College Algebra
Course Format Fully online

www.pearsonmylabandmastering • 25
Submitted by Tony Bower, Professor
St. Philip’s College
Results and DataThe majority of students who took advantage of the test- review-retest option showed significant improvement. Although score improvements ranged from 48 points to -46 points, the average improvement was 11.56 points, a full letter grade (figure 1).
The Student ExperienceBower’s online students appreciate the abundance of material available to them via MyMathLab. End-of-semester feedback included the following comments:
• “The material presented online was very helpful. It was great that when I completed a homework assignment, another one opened. It helped me to stay ahead on my assignments.”
St. Philip’s College
Average Original Average Retest Score Test Score
0%
20%
40%
60%
80%
100%
Ave
rage
Tes
t Sco
re 66.51%
77.07%
Figure 1. Average Original Test Score and Average Retest Score, Fall 2012–13 (n=71)
“I have not done algebra in almost 30 years, so I needed more time to work the problems. Although I work full-time, I was able to catch up and spend extra time on assignments
on weekends and days off.”—Student
• “Doing the course with MyMathLab was fantastic. It kept the material moving, and the notes and videos were easy to follow.”
• “I appreciated the multiple resources for each homework lesson. It provided more than enough information and examples to fully learn the concepts.”
• “I liked that the course used Pearson’s MyMathLab. It was very successful in making sure I understood how problems are solved. The “Help Me Solve This” feature was very helpful. I’d like to take more courses using this program.”
• “Being allowed to complete homework and tests past the due date was key to me being able to pass homework assignments and tests. I have not done algebra in almost 30 years, so I needed more time to work the problems. Although I work full-time, I was able to catch up and spend extra time on assignments on weekends and days off.”
ConclusionBower is happy with his online course. “Flexibility is the biggest reason students take online courses,” he says. “I would encourage other online instructors to use MyMathLab to maintain it in their courses.” To those who are concerned about the integrity of online courses, Bower answers that he tries to ensure academic integrity via the proctored final.
Future considerations including weighting the final exam more and requiring students to achieve a minimum score on the final exam in order to pass the course.

26 • www.pearsonmylabandmastering.com
Math Efficacy Report
It is this willingness to try—and fail—that enables an institution to discover the optimum configuration of practices that work best for its faculty and its students. This is why, in concert with the pedagogical characteristics described below, the University of Alabama’s mathematics department is still experiencing learning gains 15 years after first implement-ing MyMathLab; Louisiana State University’s gains are going strong 10 years later; and Quinisigamond’s results continue to grow after 14 years.
Read on to learn how these and other MyMathLab early adopters are achieving their goals and sustaining them over a very, very long time.
University of AlabamaREQUIRED USE AND MANDATORY ATTENDANCEImproved pass rates throughout the math program were a primary goal at early-adopter, University of Alabama. Not surprisingly, implementation of MyMathLab in an Emporium model in summer 2000 resulted in a rise in redesigned pass rates—from 40 to 50 percent. Administration was inspired, but not finished.
By 2007, the department had heeded students’ requests for the redesign format in higher-level courses. “Students learn math by doing math,” says Joe Bensen, then senior associate dean at the school’s College of Arts and Sciences. Required assignments in MyMathLab and mandatory lab and class attendance enabled more students to do more math.
Although already using the majority of features offered in MyMathLab, including custom-ization, homework, quizzes, tests, and prerequisites, in 2009 the school employed even more of its tools, including item analysis and pooling. “We learned that it takes time,” says Benson. “Administrations need to realize that redesign is unique to each institution. And you have to be patient. Our progress has continued; our numbers go up more every semester.”
As studies have become more longitudinal—data currently spans 13 academic years and covers four courses and seven sections—the school has realized how MyMathLab works best: as part of a larger redesign that includes required use and mandatory attendance. Data consistently show a direct correlation between required attendance in the labs and higher success rates.
Studies on Long-Term Success: 10+ Years of Sustained Positive Learning Outcomes
Schools that choose to address their challenges by redesigning their courses with online learning support, such as MyMathlab, do so with the goal of long-term, sustainable change. Pearson examined some of its most sustainable implementations and discovered that the most critical elements to ensuring the long-term success of a redesign are a willingness to take risks and a commitment to continually reassess results and make changes accordingly.
A successful implementation never truly ends. It is an ongoing process, ever evolving with the emergence of new and improved technology, the entry of each unique cohort of students, and the increased amount of information gleaned via the long-term tracking and measuring of student data.1
116 Proven Ways to Help Your Course Redesign Succeed, www.pearsonmylabandmastering.com/northamerica/results/files/Math_ courseredesign_WP_Mar2013-24.pdf.

www.pearsonmylabandmastering.com • 27
Studies on Long-Term Success
Average Intermediate Algebra success rates are an impressive 70 percent in the fall semesters and 58 percent in the spring semesters (tables 1 and 2). Today, faculty contin-ues to hone the redesign and explore what best supports students—and what doesn’t.
When asked about a recent decrease in fall Intermediate Algebra pass rates, Jamie Glass, lab coordinator, shared the results of some of the school’s recent experiments. “I attri-bute the decrease to adjusting the curriculum in that course plus changing books plus being mandated to change Beginning Algebra quite a bit. We learned that the adjustment didn’t prepare students for Intermediate Math as well as it could, so we are tweaking it to attain continuity between the two courses again. There is always room to try and make things better, which we constantly try to do, and sometimes what we do does not work.”
Quinsigamond Community CollegeCONSISTENT GRADING AND DELIVERY OF OBJECTIVESQuinsigamond Community College caters to a very diverse population, including adult, learning disabled, part-time, nonnative English speaking, and evening students. As such, more than 80 percent of its incoming students test into at least one level of develop- mental math. A rising number of developmental math students was resulting in more developmental math sections, more part-time faculty, and inconsistent delivery of objectives and grading.
In 2001, in an effort to create a measurable way to ensure all students received the same high-quality preparation to progress to and succeed in college-level math, the college redesigned its developmental math program using MyMathLab. By spring 2006, pass rates
Table 1. Success Rates of MyMathLab Implementaton by Semester, Fall 2005–Fall 2013
Fall 00 Fall 01 Fall 02 Fall 03 Fall 04 Fall 05 Fall 06 Fall 07 Fall 08 Fall 09 Fall 10 Fall 11 Fall 12 Fall 13
Beg Algebra 54.6% 56.5% 60.6% 64.2% 73.6% 74.0% 67.8% 67.2% 64.0% 66.7% 84.6% 63.8%Inter Algebra 50.2% 60.5% 62.9% 78.7% 76.2% 67.2% 73.8% 75.2% 78.1% 70.5% 72.2% 65.3% 65.2% 67.8%Finite Math 67.0% 66.5% 70.0% 66.0% 70.27% 74.8% 65.5% 77.7% 73.3% 72.7% 80.1% 73.5%Precalc Algebra 60.5% 70.3% 71.8% 71.6% 66.0% 69.2% 67.1% 72.1% 67.7% 70.4% 73.2% 72.2%Trigonometry 68.2% 55.1% 65.1% 65.1% 45.15% 66.8% 61.2% 61.2% 67.9% 73.4% 70.3% 60.3%Precal Alg/Trig 78.5% 80.0% 79.7% 79.7% 80.6% 73.2% 83.7% 87.8% 85.5% 82.6% 83.6% 77.8%Business Calc 50.7% 64.7% 64.7% 60.4% 61.9% 68.6% 68.2% 67.6% 66.4% 64.7% 56.3%
Sp 01 Sp 02 Sp 03 Sp 04 Sp 05 Sp 06 Sp 07 Sp 08 Sp 09 Sp 10 Sp 11* Sp 12 Sp 13
Beg Algebra 35.8% 37.2% 49.7% 65.5% 53.2% 54.6% 60.9% 49.8% – 47.8% 71.7%Inter Algebra 35.8% 49.8% 38.9% 61.8% 59.1% 56.2% 59.8% 57.3% 66.6% 59.0% – 55.0% 46.2%Finite Math 63.5% 56.2% 65.0% 56.3% 62.0% 65.2% 63.6% 73.0% – 68.7% 76.0%Precalc Algebra 66.6% 68.5% 65.0% 62.6% 57.2% 62.8% 65.9% 60.5% – 71.7% 66.3%Trigonometry 59.7% 66.8% 66.1% 75.2% 69.0% 72.6% 73.0% 64.5% – 71.7% 78.7%Precal Alg/Trig 62.2% 61.4% 80.7% 54.2% 71.4% 57.1% 75.0% 79.4% – 67.2% 72.0%Business Calc 57.4% 64.9% 60.6% 69.8% 72.8% 70.8% 70.8% – 67.1% 64.1%
Table 1. Success Rates of MyMathLab Implementaton by Semester, Fall 2005–Fall 2013 * N/A due to tornado
“Administrations need to realize that redesign is unique to each institution. And you have to be patient. Our progress has continued; our numbers go up more every semester.”
—Joe Benson University of Alabama

28 • www.pearsonmylabandmastering.com
in all three developmental math courses—basic math, beginning algebra, and interme-diate algebra—had significantly increased with beginning algebra showing a nearly 42 percent average increase from the program pilot.
Although faculty was delighted with the progress made, they continued to look for what gaps still remained. They found that a lack of standardization across nearly 70 faculty and adjunct instructors meant neither content nor grading was consistent.
For its next steps, the college emphasized standardization across the developmental math programs. MyMathLab master courses were employed to enabled all levels of instructors to deliver complete, predesigned courses focused on approved objectives. These prede-signed courses can be copied and adjusted for each of the college’s learning environments: computer classrooms, noncomputer classrooms, evening classes, fast-paced courses, online courses, and off-campus remote sites.
Today, all students in a course study the same curriculum, at the same pace, at the same level of difficulty; and they take a mandatory, cumulative, departmental final exam on which they must score at least a 73 percent to progress to the next course. “This require-ment keeps both faculty and students working towards the same goal and enables track-ing of meaningful, comparable data,” says Andreana Grimaldo, professor of mathematics.
Both faculty and adjuncts appreciate the standardization. “Everyone knows exactly what they need to do—no guesswork,” says Grimaldo. “Standardizing the courses has opened a space for sharing and discussion and enabled us to learn from each other.”
This kind of peer collaboration and support helps keep all of the school’s faculty and adjunct instructors on target and communicating. In turn, students are achieving at higher levels and instructors are thriving in an atmosphere of professionalism and collaboration. “This couldn’t happen if everyone wasn’t on the same page,” says Grimaldo.
“Since completion of the redesign in 2006, our measureable data has continued to grow,” says Grimaldo. “Now that we have many, many years of data, as a department we are able to pilot many different approaches and can assess their effectiveness.”
Louisiana State UniversityINITIAL BUY-IN AND MOTIVATING STUDENTS VIA MEANINGFUL LAB PARTICIPATION GRADESIn spring 2005, Louisiana State University ran a 200-student redesign pilot for College Algebra with a lab component. As a way to motivate students to complete the required lab hours, the redesign team led by Phoebe Rouse, precalculus mathematics director, offered bonus points to students who completed two lab hours each week. By the end of the semester it was clear: the students who participated in lab didn’t need the bonus points; those who needed them weren’t coming.
Rouse and the redesign team reassessed the format and considered creating a participa-tion grade. “To test it, we went back over the student data and calculated a participation grade for each student based on our records of class and lab participation,” says Rouse. “We assigned a grade of 0 percent for nonparticipation or 100 percent for participa-tion for each class and lab week throughout the semester, and then we averaged those grades to arrive at a semester participation grade. We then set a cut-off of 70 percent and grouped the students into those who earned at least 70 percent for participation and those who didn’t. We discovered that even though the actual success rate for the course
“Now that we have many, many years of data, as a department we are able to pilot many different approaches and can assess their effectiveness.”
—Andreana Grimaldo Quinsigamond Community College
Math Efficacy Report

www.pearsonmylabandmastering.com • 29
Studies on Long-Term Success
was less than 50 percent in the pilot, of those who earned a participation grade of 70 per-cent or greater, the success rate was approximately 85 percent.” In this way, Rouse and the team concluded that the redesign model of one class a week and required lab hours worked; it was the participation weight that needed adjusting.
Armed with this new information, the team created a participation grade for the next semester valued at 5 percent of the final grade. Data indicated an improvement but clearly there was still room for more.
The next semester, they adjusted again. They raised the criteria to three hours of lab a week, valued lab participation at 5 percent of the final grade, and valued class participa-tion at an additional 5 percent of the final grade. “Combined, lab and class participation are now worth a full letter grade—that got their attention,” says Rouse. “Those who initially weren’t doing their work now did. It needs to matter. For students, that means having the potential to significantly impact their final grade.” Today, fall success rates in the course average about 75 percent.
Rouse describes receiving push-back from students seeking to negotiate the new format. “Students who completed 2.7 hours a week wanted 90 percent of the credit, but participation grades each week are either all or nothing” she says. “Holding the line is sometimes the hardest part of the process!”
Most semesters have 14 lab weeks and 15 class weeks. Because the impact of lab and class participation builds over time, good work habits are consistently reinforced as the semester passes and course content gets more difficult. “We feel confident that we’ve finally arrived at a structure that supports the students, and our outcomes reflect it,” says Rouse.
University of Central FloridaMEASURED CHANGE TO PROMOTE IMPROVED LEARNING, RESPOND TO CHANGES IN CURRICULUM, AND FURTHER FACULTY BUY-INThe University of Central Florida (UCF) adopted MyMathLab in 2005 for its College Algebra course. “Prior to redesign, students were passively listening instead of being actively engaged,” said Tammy Muhs, mathematics coordinator. “And the course suffered from course drift due to a lack of coordinated content among instructors.” Muhs took a slow and measured approach to her redesign and it has paid off—the course pass rate is now significantly higher than the preredesign rate.
Immediately upon implementation, Muhs initiated common homework and quiz assign-ments. The course success rate rose and she slowly worked additional best practices into the implementation over time. “I caution schools about making too many changes at once,” says Muhs. “If problems arise, it’s too difficult to identify the cause. Changes should be controlled and assessable.”
In fall 2006, Muhs introduced weekly due dates and in-class quizzes. After another notice-able increase in the pass rate she incorporated National Center for Academic Transfor-mation principles, including one-on-one assistance for students and online testing. Success rates skyrocketed and in that spring, using a grant from NCAT, she redesigned the now successful course in the modified emporium model using MyLabsPlus. The following years saw such course additions as homework mastery and required lab time.
“[P]articipation grades each week are either all or nothing. Holding the line is sometimes the hardest part of the process.”
—Phoebe Rouse Louisiana State University
“We are constantly checking to see if the implementation is as good as it could be, and we’re not be afraid to make changes to get there.”
—Tammy Muhs University of Central Florida

30 • www.pearsonmylabandmastering.com
Throughout the redesign’s evolution, Muhs ensured that the changes she initiated were well thought out, tracked, and assessed. “We don’t make changes simply for the sake of change—changes are made to promote improved learning, as a response to changes in our curriculum, and sometimes to further faculty buy-in. And they’re always measurable.”
Muhs shares how making an experimental change to support faculty buy-in also resulted in data-proven evidence. “As part of our modified Emporium model, students are required to spend at least three hours a week in our lab,” she says. “If the minimum time requirement is met, the student receives a grade of 100 percent for the weekly partici-pation grade; if not, the student earns a grade of 0 percent for that week’s participation grade. During testing week, instead of completing lab hours, students complete a three-part content review. Students must score at least 75 percent on each of three content sections in order to fulfill the lab requirement for testing week. If one of more of the scores is below 75 percent, the student earns a 0 percent for that participation grade.” At a faculty meeting in 2011, a suggestion was made that the mastery set-up was too harsh and that the requirement be downgraded, thereby allowing students to determine their minimum score and using an average of the three review assignments as their lab grade for the week (versus 0 or 100 percent).
In order to reinforce faculty buy-in, Muhs allowed the change for one semester under the condition that the outcomes were analyzed and the results reported to the department.
While some faculty were surprised by the results, Muhs was not. When students were required to achieve at least 75 percent mastery on each of the three review sections, the overall average for the review assignments was in the low 80s. When the requirement shifted to an average of their scores, the overall review average dropped to the mid 60s and test scores suffered. The correlation was indisputable.
“Students don’t always set the bar high enough for themselves,” says Muhs. “The three-part review assignment covered the learning objectives on the test. Students who were satisfied with their average, and went no further, were unprepared for the test. Faculty was unanimous—we returned to the original requirement the very next semester.”
Thanks to consistent student preparedness, coordination across the program, and rigorous tracking of data, Muhs is able to immediately compare results both over time and from within the program.
For example, during academic year 2012/13 one section of College Algebra had a strong progress monitoring (PM) component; the other sections did not. “At the end of the semester, the section with the strong progress monitoring component had a higher percentage of students earning a C or higher when compared with the other sections,” says Muhs. “This could imply that the best practice of PM is important.”
Changes like those mentioned above enable Muhs to make data-driven decisions, and provide solid answers for chairs, beginning faculty who don’t yet understand the under-pinnings of the course, and students who push back. She is committed to constantly looking ahead. “We never stop thinking about our courses and about our redesign,” she says. “It ensures that the evolution of our implementation is just that: an evolution, and not a revolution.”
“We never stop thinking about our courses and about our redesign. It ensures that the evolution of our implementation is just that: an evolution, and not a revolution.”
—Tammy Muhs University of Central Florida
Math Efficacy Report

www.pearsonmylabandmastering.com • 31
Studies on Long-Term Success
Mississippi State UniversityGETTING THE MOST OUT OF LAB TIMEPrior to fall 2005, the average withdrawal rate for Mississippi State University’s College Algebra course was 15 percent; the average success (ABC) rate was 61 percent. They knew their students could do better, and they decided to make a change.
By redesigning the course from a traditional format that included three hours of lecture and optional homework to a hybrid course in which students spend two hours in lecture and two hours in lab per week using MyMathLab, the school significantly improved its College Algebra outcomes. Today, the MyMathLab-supported course’s average success rate is 75.8 percent—an increase of 14.8 percentage points; and its average withdrawal rate decreased from 15 percent before redesign to 3.7 percent after.
But it wasn’t always a smooth ride to success. “We’ve done a variety of different things to get our students here,” says Kim Walters, mathematics instructor, “based on the knowledge that if they spend more time doing math, they’ll be more successful.” With the redesign as her foundation, Walters experimented with different ways to format and value lab time.
“Initially, we were lax on the lab aspect—it was required, but students needed to individually sign up for time to take quizzes and tests. Not only was this ineffectual, it was a scheduling nightmare.” Walters then shifted the format so that students signed up for a preestablished lab time at registration. Although this streamlined the process, because use of the lab was optional, students only attended it for testing. “Because they weren’t in the lab on a regular basis, they forgot about it.”
In fall 2012, Walters required students to attend lab for 50 minutes a week—and required that they work on math while there. To support the initiative, she made a homework score of at least 70 percent a prerequisite for quizzes. Students complained and initially faculty backed down. By fall 2013, however, comparison data made it clear that the prerequisite made a difference. Walters again required it and faculty stood firm. “Today we have very few students with a low homework average,” she says. “In fact, most students do more than the required 70 percent.”
While the number of factors involved in evolving an implementation mean it isn’t possible to conclude a direct cause and effect relationship, the student learning outcomes are indisputable. A comparison of data from fall 2012 to spring 2014, since requiring lab attendance, to data from prior the requirement shows an increase in the average success rate and a decrease in the average percentage of Ds, Fs, and withdrawals.
What’s more, because students are now doing the homework, data obtained from MyMathLab’s item analysis can be extrapolated for further growth. “At both the end of the semester and the end of every year, when we assess objectives we now have a more realistic version of what works and what doesn’t,” says Walters. “It’s part of the whole process—being able to evaluate our implementation and learn from it. Don’t ever be afraid to try something or go back to something. What works or doesn’t work in one moment may change down the road.”
“Don’t ever be afraid to try something or go back to something. What works or doesn’t work in one moment may change down the road.”
—Kim Walters Mississippi State University

32 • www.pearsonmylabandmastering.com
University of IdahoESTABLISHING EFFECTIVE PREREQUISITE THRESHOLDS AND STAGGERED DUE DATESLike most early adopters of MyMathLab, Kirk Trigsted, mathematics instructor and director of the school’s Polya Mathematics Learning Center at the University of Idaho, took a measured approach to his implementation. “We started in 2001,” he says. “It wasn’t until our second and third years that we started experimenting with the program, its features, and our format.” Today, Trigsted is not only a power user of the program, he’s also the author of Pearson’s Trigsted MyMathLab eCourses, which include a new form of eTexts that are written from the ground up within MyMathLab and include a seamless mix of text, videos, interactive animations, tutorials, and assessment. His students use this new program for weekly homework, weekly quizzes, and exams, and attend 2.5 hours of required lab time each week.
The school’s Intermediate and College Algebra programs are undeniably solid and serve as examples to other institutions. Trigsted credits this success to constant experi-mentation and a willingness to continually push faculty’s expectations of what both the program and their students can accomplish. “Of course missteps occurred along the way,” he said. “That’s how we learned what does work.”
Trigsted was eager to share examples of how seeming missteps helped evolve the school’s implementation into the success it is today. “The first year that we used MyMathLab, we only used it for homework,” he says. The next year, they added MyMathLab quizzes. In 2004, it was a natural next step to make homework completion a prerequisite to opening the quiz; they set the threshold at 75 percent. “It wasn’t a very successful semester,” says Trigsted. “We were disappointed to see that the overall homework average was only about 77 percent. We didn’t expect students to just stop once the requirement was met.” With that information in mind, over the next two semesters Trigsted increased the percentage to 90 percent. “Sure enough,” he says, “now the overall average is about 90 percent. It showed us in no uncertain terms that the majority of students will rise only to the expectation that we present—averages consistently occurred about 2 percentage points higher than the threshold. The better students earn 100 percent, but the mediocre and poor students simply stop.”
Another valuable learning came regarding homework due dates. “In the Emporium model, we meet in class one day a week, and homework deadlines are set according to the class day,” says Trigsted. By staggering due dates, Trigsted accommodates all the students in the school’s limited lab space. Initially, he made the due date the night of class so students could attempt the assignment during the week and then use class time to address any questions. “No one had questions,” he says. “Students do everything at the last minute.” Overnight, Trigsted changed the deadline to the night before class and assigned a quiz the night of class. It’s now a vastly more effective flow: instructors perform an item analysis on the homework before class, and address common issues and prepare students for the quiz during class.
“Over the course of an implementation, tons of little tweaking happens,” says Trigsted. “One thing I’ve definitely learned to do is to document. It’s exceedingly helpful to have ongoing diary of your changes over time—I wish I’d started sooner.”
“One thing I’ve definitely learned to do is to document. It’s exceedingly helpful to have ongoing diary of your changes over time—I wish I’d started sooner.”
—Kirk Trigsted University of Idaho
Math Efficacy Report
www.pearsonmylabandmastering.com • 33
Studies on Long-Term Success
Cleveland State Community CollegeSLOWLY EVOLVING INTERVENTION, MASTERY LEVELS, AND REQUIRED LAB TIMEOriginally, Karen Wyrick, chair of the mathematics department, was skeptical of redesign. “I wasn’t sure it would speak to our caliber of students,” she says. But then she saw that her students both prefer it to the traditional format and achieve more with it, and her attitude did a complete 180. Today she’s one of redesign’s biggest fans.
“Changes are an inherent part of redesign—we change something every semester,” says Wyrick. “We ask how we can make it better via more or less lab time, tutoring time, mastering levels, and so on. We’re continually trying to help our students succeed.”
In spring 2008, the implementation’s onset, students were offered unlimited attempts to take tests. “Our thinking was that they’d ask us to help them with what they didn’t understand,” says Wyrick. “But they didn’t ask.” So in fall 2009, Wyrick reassessed and both limited test attempts to 10 and required completion of an individualized homework set based on the results of the student’s first test attempt. After completion of the homework set, students could attempt the test nine more times without intervention. By 2013, it was clear that even more intervention was needed, and a second individualized homework set was assigned after a fifth attempt.
“We tweak, assess, and tweak some more,” says Wyrick. “We used a similar process to establish course mastery levels and required lab time.”
Initially, mastery levels were set at 70 percent for everything: homework, quizzes, tests, and participation. “We soon found that by raising the mastery percentage, students achieved more,” says Wyrick. “We adjusted them to 90 percent on homework, 80 per-cent on quizzes, and 75 percent on tests—and found that rather than being intimidated, the students consistently reach the bars we set.”
In most college algebra and statistics courses, the last two weeks of the semester are a flurry of students trying to finish assignments at the last minute. With this in mind, Wyrick initially required one hour of lab time per week, plus an additional hour of work elsewhere. But some students did only the one hour of lab time—and no more. “Because we couldn’t track time spent outside the lab, students didn’t do it,” she says. “So in fall 2013, we increased the lab requirement to two hours and dropped the outside hour. As a result, student success went up—the increased practice helped students to stay on track.”
Wyrick plans to improve the program again for summer 2014. “If a student successfully passes the homework assignments for the week, we will waive the lab requirement,” she says. “We believe it will especially be a boon for nontraditional and working students.”
“Nothing stays the same,” says Wyrick. “Cohorts change, state requirements change... a successful redesign demands a constant level of assessment and reassessment in the moment, and the commitment to shift and adjust as needed.”
Cleveland State implemented their redesign in fall 2008 and then in 2012 the State of Tennessee initiated a statewide redesign of developmental math—from course structure to curriculum to testing placements. “Because of all the changes, it can be hard to directly compare data,” says Wyrick. “What I do know is that our success rate was 46 percent when we started, then rose to 68 percent, and is now around 64 percent. Although the rate has slightly dropped, we are now asking more of our students—I still believe that every change we’ve made ultimately has been for the better.”
“We tweak, assess, and tweak some more.”
—Karen Wyrick Cleveland State Community College

34 • www.pearsonmylabandmastering.com
Personalized and Adaptive Learning: Successful Implementation Models
Technological advancements in learning applications plus the recognized value-add of individualized instruction is providing instructors with exciting new ways to address one of higher education’s most pressing issues: the low success rates and high cost of developmental education.
“Whereas the creation and delivery of digital content drove innovation in educa-tional technology in the recent past, assessment and data analytics emerge as the more critical components today.”
—John F. Hartley, Jr. Market to Watch: Adaptive Learning
in Developmental Education
Math Efficacy Report
By combining technology, assessment, and content, personalized and adaptive learning models enable individualized instruction to scale at the classroom level, providing instructors with new ways to accelerate the learning process and engage students via the continuous process of computer-guided learning and assessment.
Although the terms are often used interchangeably, adaptive learning is not the same as personalized learning. Personalized learning substantially moves away from the one-size-fits-all approach to learning by “[drawing from] observation to inform tailored student educational interventions designed to increase the likelihood of learner success.”1 This can be achieved via a variety of means, from very basic (e.g., extra reading for high- achieving students) to more sophisticated (e.g., highly-interactive study plans). Adaptive learning relies on a complex set of computer analytics to take a “sophisticated, data- driven, and in some cases, nonlinear approach to instruction and remediation, adjusting to a learner’s interactions and demonstrated performance level and subsequently anticipating what types of content and resources learners need at a specific point in time to make progress.”2
The following MyMathLab capabilities leverage both of these models and have been documented to increase student learning and decrease institutional costs.
MyMathLab Study PlanA recent analysis of MyMathLab Study Plan engagement3 found that students who are more engaged in MyMathLab/MathXL Study Plans obtain higher scores. The results of the study suggest that the Study Plan is especially beneficial for students with homework and test mastery lower than 70 percent.
A similar study from Northeastern Illinois University supports these findings. In this study, for each module, students completed MyMathLab homework and then had unlimited attempts to complete a MyMathLab practice test. Students were required to score at least 70 percent on the practice test in order to progress to the Study Plan, where they could complete questions based on what they missed in the practice test until they achieved mastery, as indicated by a score of 100 percent. Students who took the
1 http://edgrowthadvisors.com/wp-content/uploads/2013/03/Learning-to-Adapt-White-Paper_Education-Growth-Advisors_March-2013.pdf
2 http://edgrowthadvisors.com/wp-content/uploads/2013/04/Learning-to-Adapt_Report_Supplier-Landscape_Education-Growth-Advisors_April-2013.pdf
3 Conducted in December 2013 by the Pearson Data, Analytics, and Adaptive Learning Technology Group’s Discovery Analytics Team using data from more than 10,000 students.

www.pearsonmylabandmastering.com • 35
Personalized and Adaptive Learning
practice test and then remediated via the Study Plan performed an average of 12.5 percentage points higher on the module exam than those who proceeded from the homework directly to the exam.
MyMathLab Personalized HomeworkMyMathLab’s Personalized Homework feature is another way to integrate personalization into a course. Once the feature is attached to a particular assessment, it analyzes the student’s results and provides personalized assignments on precisely those topics the student has yet to demonstrably master. For example, Liberty University students are required to complete personalized homework assignments if they score less than 70 percent on MyMathLab exams. Once a student has completed the assignment with at least 70 percent mastery, he or she may retake the exam for a higher score. Wayne State University employs personalized homework at the quiz level and requires students to complete personalized homework in order to earn a second quiz attempt. Both strategies promote filling in knowledge gaps prior to reattempting assessments and result in quantifiable performance increases on second attempts.
MyMathLab Adaptive Study Plan, Powered by KnewtonBy making highly targeted, high-quality instruction scalable, adaptive learning enables instructors to provide a higher-quality learning experience (as measured by student engagement, persistence, and outcomes) at reduced cost to both students and institutions. Instructors seeking to implement adaptive learning turn to—and turn on—MyMathLab’s Adaptive Study Plan, powered by Knewton. Once activated, it assesses students’ work continuously and in real time, using data and analytics to target strengths and weaknesses at the concept level and updating remediation recommendations throughout the duration of the course.
At Reading Area Community College, MyMathLab’s Adaptive Study Plan, powered by Knewton, is assigned as a prerequisite to tests. The study plan guides students through concepts they’ve yet to master and alerts them when they are prepared to take the next test. Data indicate a significant rise in student outcomes since the plan’s implementation: exam scores have increased from 66.4 percent in fall 2012 to 78.0 percent in fall 2013. (See page 20.)
At Arizona State University, MyMathLab’s Adaptive Study Plan, powered by Knewton, is employed in a flipped classroom
redesigned in an Emporium model—in lieu of lectures, work takes place on MyMathLab in a computer lab where instructors provide one-on-one and small group tutoring. Students either test out of a lesson by achieving at least 85 percent on a diagnostic or complete a study plan that has been adapted according to work done in MyMathLab.
Positioning Your Pilot for Success In order for these innovative features to deliver truly meaningful improvements in learning outcomes, content, assessment, and analytics must be integrated in a thoughtful manner. Strategically implemented pilot initiatives can provide critical data and enable support for larger-scale investments. Consider the following questions before setting up your pilot:
• What are your institution’s core pedagogical values and do they align with the pedagogical values of your technology provider?
• What kinds of assessment and evaluation will map to those pedagogical values (e.g., competency testing, lab work)?
• How far is your institution willing to go in reimagining instructional roles and the function of class time in pursuit of its objectives?
• What delivery methods offer the best opportunity for deployment and evaluation (e.g., classroom, online, or hybrid; class-paced or self-paced)?
• How will success be measured?
• What professional development will be required to educate key contributors and facilitate collaboration?
The transformative potential for personalized and adaptive learning both in developmental math and across the spectrum of higher education is powerful. More studies are in process and the increased amount of data will help key players further deliver optimum ways to achieve greater student success. Meanwhile, buy-in at the top levels is emerging—in a recent poll of college and university presidents, 66 percent of the survey’s respondents reported that they believe adaptive learning can make a “positive impact on higher education.”4
If you are using one of MyMathLab’s targeted learning features, consider helping Pearson learn more about what worked for your students. To share your results, contact Traci Simons at [email protected].
4 www.insidehighered.com/news/survey/affirmative-action-innovation-and-financial-future-survey-presidents#sthash.4hwCMz7g.UK9xyKzK.dpbs

36 • www.pearsonmylabandmastering.com
As pressure from state and federal governments for increased graduation rates stretch in-coming enrollments at both two- and four-year colleges, administrators are seeking timely and cost efficient ways to meet the widening range of their students’ academic needs.
Sine 2004, institutions have successfully used MyMathLab to help address this perva-sive lack of college readiness, its high cost to schools and students, and its resulting low graduation rates via programs that help students earn college credit in high school and gives them the confidence and support they need to better prepare for college-level math courses.
But some educators worry that students who are “hurried through” are set up to fail. Critics point to a variety of issues, including unqualified instructors and decreased rigor.2 Both the Louisiana State University Dual Enrollment and College Readiness Program and the Tennessee State SAILS Program use MyMathLab to address these potential pitfalls head-on and ensure that their students succeed beyond the dual credit course or bridge program and through to a degree.
Louisiana State University Dual Enrollment and College Readiness Program: Certified Teachers Form a Solid Foundation for SuccessTraditionally, dual enrollment courses were used to offer advanced high school students more challenging coursework, while simultaneously earning them early college credits. Today, the same strategy is used atLouisiana State University (LSU) to prepare students for both dual enrollment courses and later success in college courses.
The LSU College Readiness Program offers a dual enrollment option in which high school students earn credit for both an LSU course and a high school course at the same time, while remaining on their high school campuses. In addition, the program offers the option of MyMathLab courses in grades 6 through Algebra II to teachers at participating dual enrollment schools.
The delivery model in the high school requires that students spend a third of the course time in a face-to-face classroom environment and the remaining two thirds in an on- campus computer lab environment with teacher support.
College–High School Partnerships: Dual-Enrollment and Bridge Programs
Nationwide statistics indicate that up to 80 percent of incoming college fresh-men place into developmental or remedial mathematics courses. That lack of preparedness for college-level math courses is perhaps the foremost barrier to success in college. Students who repeatedly fail those courses take a beating academically, financially, and in terms of self esteem.
Catch them up before they’re behindAt its 2014 meeting, the American Assocation of Community Colleges set a bold goal: to decrease by half the number of students who come to college unprepared. Ideas presented by administrators and faculty included partnerships with local school districts to offer college reme-dial courses to high-school students.1
1 “Some Colleges Try to Catch Students Up Before They’re Behind,” by Sara Lipka, April 8, 2014, The Chronicle of Higher Education
2 “Is Faster Always Better?” by Katherine Mangan, February 17, 2014, The Chronicle of Higher Education
Math Efficacy Report

www.pearsonmylabandmastering.com • 37
College–High School Partnerships
To address one of the biggest criticisms of dual enrollment courses—the potential for varied quality of content—LSU has created a training program that ensures that the high school teachers are well-prepared to handle the math content, the delivery model, and the MyMathLab program. Teachers become “certified” to participate in the College Readiness Program by successfully completing a free, comprehensive, summer work-shop taught by LSU faculty and high school mentor-teachers. Teachers can specialize in any of five dual enrollment courses offered or focus on any math course from 6th Grade through Algebra I.
The workshop comprises two four-day summer sessions at the LSU Math Lab and more than 20 additional hours of indepen-dent math work to be completed between the two workshop sessions. One-day follow-up workshops for those teachers doing dual enrollment courses are held at LSU at the beginning of each fall and spring semester thereafter.
Workshop sessions cover the following:
• Web-based redesign course delivery pedagogy to improve student learning
• MyMathLab use at an advanced level
• Common Core State Standards (CCSS) familiarity
• LSU math classes observations and exposure to students in the LSU Math Lab
• Access to CCSS-aligned courses in MyMathLab
• Certified mentor-teacher guidance and support
Once certified to participate in the College Readiness Program, a high school dual enrollment teacher serves as a classroom
Table 1. Number of Teachers Completing the Louisiana State University College Readiness Program Workshop by Course and Semester, Summer 2006–13
Year 1 Year 2 Year 3 Year 4 Year 5 Year 6 Year 7 Year 8 Summer 2006 Summer 2007 Summer 2008 Summer 2009 Summer 2010 Summer 2011 Summer 2012 Summer 2013 Total
Advanced Math for Dual Enrollment 4 12 22 19 6 4 8 15 90
Algebra II 1 4 9 12 4 6 6 42
Algebra I 1 12 20 5 8 8 54
AP Calculus 19 6 5 2 3 35
Geometry 12 4 5 7 28
Eighth Grade Math 2 77 1 11 91
Seventh Grade Math 2 1 1 7 11
Sixth Grade Math 1 2 10 13
facilitator in the high school setting with an LSU faculty member serving as an Instructor of Record. Students use MyMathLab to do the same homework, quizzes, tests, and final exams as do on-campus students enrolled in the same course.
“The LSU College Readiness Program begins preparing students as early as the 6th grade for dual enrollment math courses and then offers dual enrollment courses to high school students. Students who participate in the program enter college better prepared for success in advanced college coursework, which in turn improves college retention and graduation rates. It is a win-win for all.”
www.math.lsu.edu/programs/CollegeReadiness
Number of Number of Number of Percent Mean High Schools Teachers Students Earning Credit
Fall 2006 3 3 41 66%
Spring 2007 4 7 77 78%
Fall 2007 11 14 397 61%
Spring 2008 12 15 260 48%
Spring 2010 2 2 28 79%
Fall 2010 11 11 163 87%
Spring 2011 11 12 179 82%
Fall 2011 11 12 225 85%
Spring 2012 11 12 234 80%
Fall 2012 13 14 409 92%
Spring 2013 13 14 447 81%
Fall 2014 20 21 571 93%
Semester
Table 2. Dual Enrollment Success Rates, Fall 2006–14 (n=3,031)
38 • www.pearsonmylabandmastering.com
Tennessee State SAILS Program: Supporting Students Reaps Ongoing Academic SuccessIn spring 2012, faculty from four of Tennessee’s community colleges sat down with teachers at local high schools and created a free program of dual enrollment, summer session math labs for high school seniors who are likely to place into remedial math after high school (based on Math ACT scores below 19). Far more than simply a stop-gap measure, the Seamless Alignment and Integrated Learning Support (SAILS) program is a highly strategic response to the one of the State’s greatest educational challenges: the high cost of remedial education and its effect on certificate and degree rates:
• Statewide, 71 percent of students entering community college required at least one remedial level course. [fall 2010/11]
• Ninety-five percent of Chattanooga State Community College students placed in remedial math upon matriculation took more than three years to obtain a certificate or degree. [fall 2010/11]
• In fall 2012, 11,000 TBR CC students paid for remedial math courses that did not count toward graduation—a $12,364,000 cost to the students and taxpayers.
The SAILS program answers to critics who accuse bridge programs of reduced rigor and lack of student support by building bridges between the higher education and high school communities and surrounding students with one-on-one support.
The program aligns and embeds Tennessee Board of Regents college developmental competencies with Tennessee Depart-ment of Education bridge math standards. To ensure uniformity and quality, content and assessments are delivered online.
Students are supported through a blended learning model of MyMathLab instruction plus individual assistance from high school teachers to give students the help they need both at school and at home. Classes meet in a computer classroom at least 50 percent of the time; many classes meet in computer lab 100 percent of the time.
Because of MyMathLab’s transparency and reporting functions, teachers, principals and community college leaders can easily monitor student progress and identify issues. “Teamwork is critical for the success of the program. Pearson’s MyMathLab allows for complete transparency. This helps with teamwork because we can all see what is going on. If there is a problem I instantly see it along with the high school teacher, field coordinator, and principal. It promotes accountability and better planning,” explains Squires, math department head at Chattanooga State Community College.
Mastery learning is a key component of the SAILS program and helps ensure that students receive a proper foundation for success in college. Students are required to complete all assignments and must demonstrate mastery of all competency concepts and skills before progressing to the next competency. Results so far indicate the program is a success.
At Chattanooga State Community College after the success of the original pilot at Red Bank High School, the program was expanded to include 200 high school students. After the first year of using MyMathLab, 83 percent of the students who graduated high school were college ready in math. Approxi-mately 25 percent of those students completed bridge math classes early and were able to complete a college level math course during their final semester in high school enabling them to enter college one semester ahead in math.
At Cleveland State Community College, initially five high schools implemented SAILS, which reached 200 students. After the first year, 70 percent of students completed their bridge math courses and graduated college ready in math. A full 30 percent completed not only the bridge math course, but also completed a college course taken as an elective in high school.
As a result of the success of SAILS, Governor Bill Haslam included funding from his “Drive to 55” initiative for a state-wide scale-up. Drive to 55 seeks to raise the rate of Tennessee residents with a post-secondary credential to 55% by 2025. The Year 1 $1.124 million grant extended SAILS to all 13 community colleges, 122 high schools, and 8,500 students. During the 2013-14 school year, out of those 8,500 high school students more than 5,600 completed the entire course, having saved $6.4 million in tuition and books and 11,471 semesters of math remediation in college. A recently approved $2.45 million infusion for the 2014/15 academic year will now provide SAILS instruction to 79 local education agencies, 184 high schools, and 13,636 students.
http://bit.ly/SAILSChattState
Students are supported through a blended learning model of MyMathLab instruction plus individual assistance from high school
teachers to give students the help they need both at school and at home.
Math Efficacy Report

www.pearsonmylabandmastering • 39
EXCERPTED FROM: 16 Proven Ways to Help Your Course Redesign Succeed: Best practices from developmental math redesigns using MyMathLab in a lab-based setting at community collegeswww.pearsonmylabandmastering.com/northamerica/results/files/Math_courseredesign_WP_Mar2013-24.pdf
The National Center for Academic Transformation (NCAT), a pioneer in driving positive change in higher education, is helping do something about it.
Program OverviewThe NCAT is an independent, nonprofit organization whose research-based methodol-ogy has produced quantifiable results in learning gains, retention, and cost savings since 1999. In support of its mission, the NCAT led the Changing the Equation (CTE) grant program from September 2009 to September 2012. Funded by the Bill & Melinda Gates Foundation, the program was specifically designed to engage U.S. community colleges in successful redesigns of their remedial and developmental math sequences.
A nationwide competition resulted in the program’s acceptance of 38 college participants, collectively representing 114 individual mathematics courses, 4,531 sections, and more than 100,000 students. Each participant redesigned its developmental math sequence using the NCAT’s Emporium Model plus either MyMathLab or another commercially available instructional software. In addition, each participant modularized its curriculum, thereby enabling students to progress faster or slower through the course sequence ac-cording to their needs.
Results from this visionary study were just as NCAT predicted: 32 of the 38 institutions implemented the requirements and experienced improvement in one or more categories. Of those 32 institutions, 25 (78 percent) used Pearson’s MyMathLab.
The results1 achieved by those colleges that used either MyMathLab or MyLabPlus are particularly worthy of note, especially considering the program’s accelerated time frame. Pearson detailed these outcomes in 16 Proven Ways to Help Your Course Redesign Succeed.2 Excerpted here, from the original white paper, are the top eight best practices used by the program’s most successful institutions. Most important, each best practice can be implemented beyond the scope of the original CTE program and to all institutions— whether two-year, four-year, or private—and across the full spectrum of math courses.
Changing the Equation: Observed Best Practices
In 2007, the typical community college had a 38 percent success rate in Introductory Algebra. (Other developmental math courses didn’t fare much better.) Statistics showed that within three years of first taking the course, only 28 percent of students went on to a college-level math course. Of those 28 percent, only 20 percent passed the course on the first try. Faculty, administration, and even students agree: those numbers are not acceptable.
8
“If institutions follow our advice... we guarantee that they will improve student learning, increase completion of the developmental math sequence, prepare students to succeed in college-level math, and reduce instruc-tional costs.”3
—Carol Twigg President and CEO, NCAT
At the onset of the CTE Grant Program
1 www.thencat.org/Mathematics/CTE/CTE_Lessons.html2 www.pearsonmylabandmastering.com/northamerica/results/files/Math_courseredesign_WP_Mar2013-24.pdf3 http://dx.doi.org/10.1080/00091383.2013.806169

40 • www.pearsonmylabandmastering.com
1. Conduct a pilot implementation before embarking on a full-scale rollout. Without exception, every successful project had conducted a redesign pilot in a small number of course sections before conducting a full-scale implementation of its course redesign. After one or two semesters, initial problems got worked out, and the institution was able to smoothly scale its redesign to all course sections.
Robeson Community College During the pilot phase, parallel sections were used to assess student learning. Data obtained from the pilot phase compared student success rates and retention rates between the traditional and the redesigned model. Indirect measures of student success were obtained through student surveys. www.thencat.org/Mathematics/CTE/Abstracts/RCC_Abstract.html
2. Train adjuncts, tutors, and other key players—and keep training them. Consistency is vital to the success of a MyMathLab implementation. Pearson provides product and implementation training to ensure that each implementation is in alignment with the institution’s stated goals. Once an implementation is up and running, weekly meetings and the mentoring of part-time faculty, adjuncts, and tutors can help keep all players connected and on board.
Volunteer State Community College VSCC has moved from a culture of traditional face-to-face lecture to a culture of student-centered, faculty-supported, technologically-based learning. The departmental professional development calendar includes specific ongoing training for emporium faculty and staff. www.thencat.org/Mathematics/CTE/Abstracts/VSCC_Abstract.html
Northwest-Shoals Community College NWSCC has greatly appreciated the input and support from the College’s NCAT Scholar, John Squires. He served as a mentor, solutions expert, and friend. The NCAT workshops allowed the College to interact with other institutions that faced the same challenges. This gave a sense of community among the colleges so that no one felt the sting of isolation throughout the process. www.thencat.org/Mathematics/CTE/Abstracts/NWSCC_Abstract.html
What is course redesign?Course redesign is a data-driven innovation intended to increase quality and improve efficiency in large-enrollment introductory courses. When combined with high-quality teaching and learning courseware like MyMathLab and other MyLab products, institutions that redesign their courses achieve more-effective use of instructor time, increase student time on task and engagement in course material, and reduce institutional—and, frequently, student—costs.
Math Efficacy Report

www.pearsonmylabandmastering • 41
3. Position your students for success. When it comes to positioning students for success, no one has more experience than Pearson Faculty Advisors. When those advisors were asked about their own experiences and those of faculty at schools they’ve helped, two themes rang out loud and clear:
• Conduct a first-day-of-class orientation. Pearson’s customized getting-started presentations, handouts, and email templates help students understand the value of course materials and the connection between learning the course objectives and successful completion of the course. Visit firstdayofclass.com for more information.
• Provide structure. The more structure you build into your implementation, the more success students will have. This includes the presentation of clear expectations and the setting of firm and consistent deadlines.
Northwest-Shoals Community College [T]he first-day orientation class served as one of the most important days for student understanding of the program. www.thencat.org/Mathematics/CTE/Abstracts/NWSCC_Abstract.html
4. Require both attendance and completion of assignments for credit.What most faculty have already observed, the CTE project confirmed: required attendance is critical to the success of both your redesign and your students. Twigg underscores the point in the project’s full report. “It was absolutely necessary to have an incentive for attending class and/or a penalty for not attending. Similarly, assignments must be required. Math faculty and tutorial staff quickly realized that students don’t do optional.”
Oakton Community College Required attendance in class provides a common grade component throughout the department and helps students identify milestones in course progress that indicate success. www.thencat.org/Mathematics/CTE/Abstracts/OCC_Abstract.html
5. Employ personalized learning. The most successful solutions include personalization and immediate feedback that engage students in active learning and that enhance and inform assessment. Students who use MyMathLab are able to complete assessments at their own speed and, via diagnostics performed along the way, can follow a personalized learning path that both targets the exact skills they need to work on and delivers the right material they need to master those skills.
Guilford Technical Community College The guided module design allowed students to be more active and engaged learners, receive immediate feedback about their work, focus on what they did not know and move quickly through what they did know. A combination of guided content learning, acceleration and remediation as needed meant that more students could successfully complete the course and that the cumulative learning effect from module to module would be greater because the mastery approach was reinforced with regular testing. www.thencat.org/Mathematics/CTE/Abstracts/GTCC_Abstract.html
Student engagement Pearson’s Faculty Advisors recom-mend the following techniques to promote student engagement.
• Offer points for everything! They won’t do the work if it doesn’t count!
• Offer self-acceleration options.
• Have students respond to one another by offering them points for responding and sharing ideas.
• Get information to students as early as possible.
• Remind students that they are the ones accountable for their grades. Add the following to your signature line: “Remember: YOU determine your grade.”
Changing the Equation

42 • www.pearsonmylabandmastering.com
6. Conduct frequent assessments. Instructors have long recognized the necessity of assessment as both a measurement of how well students are learning and a tool for critical feedback. A successful MyMathLab implementation increases the power of assessment by increasing the number of assessments, thereby offering students a firsthand account of what they know and what they don’t, and by providing instructors more opportunities to intervene before a student falls too far behind.
Pearl River Community College The redesigned courses 1) had more assignments, more quizzes, and more tests than the traditional courses, 2) included more content than the traditional courses and consequently took longer to finish, and 3) required an 80% mastery level that raised the cut score to earn a C. Overall, redesigned course content was more rigorous to better prepare students for college-level math courses. The math department chair and several instructors have noticed that students who have completed the redesigned developmen-tal math sequence are better prepared and their knowledge base is more consistent. www.thencat.org/Mathematics/CTE/Abstracts/PRCC_Abstract.html
7. Require mastery learning. Students who advance without full competence in skills are doomed to struggle—if not fail. Mastery learning ensures that skills are solidly understood and that they build one upon another, thereby reinforcing previous knowledge and increasing confidence throughout the course sequence. In addition, implementations that employ mastery learning invariably find that students both complete more work and learn more than do students in traditional formats.
8. Track learning gains. What isn’t tracked can’t be measured. And what hasn’t been measured can’t be proven. School faculty who consistently track and measure learning gains are able to make informed decisions about programmatic shifts and can increase their abilities to prove institutional effectiveness, meet accreditation standards, track quality-enhancement plans, and fulfill grant requirements. Pertinent metrics include comparisons of homework grades, exam scores, and final grades with those of past semesters; correlation between time spent and final grades; subsequent success rates; retention rates; and the effective-ness of using the text in tandem with the online product.
Guilford Technical Community College GTCC is deeply committed to research-based decision-making. GTCC evaluated the effects of the redesign by comparing performance on a common final exam in the traditional and redesign sections. GTCC also looked at comparative success rates as well as persistence and retention rates in the developmental courses. www.thencat.org/Mathematics/CTE/Abstracts/GTCC_Abstract.html
Contact Pearson at [email protected] with any questions. For more details on the CTE program, visit “Improving Learning and Reducing Costs: Project Outcomes from Changing the Equation”4 For more case studies using MyMathLab products, see the Pearson Results Library5.
Pearson’s Faculty Advisor Network (FAN) helps instructors improve the teaching and learning experiences at their institutions—it is where educators go to meet and engage with a community of their colleagues eager to share advice, tips, and best practices related to MyLab products. Join the network at http://community.pearson.com/fan.
Subsequent success ratesSome CTE institutions had sufficient longitudinal data to compare how well students who complete the redesigned sequences perform in subsequent college-level courses with those who entered via the traditional format.
At Northern Virginia Community College, the success rate in Math for Liberal Arts for all students was 67.7%; for students who had completed the redesigned developmental math course, the success rate was 72.5%.
The success rate in Precalculus for all students was 57.7%; for students who had completed the redesigned devel-opmental math course, the success rate was 72.0%.
At Northwest-Shoals Community College, the percentage of develop-mental math students successfully completing a college-level math course increased from 42% before the redesign to 76% after the redesign.
At Pearl River Community College, final exam rates in college-level College Algebra increased from a mean of 64.4% in the traditional for-mat to 73.8% after the redesign.
Completion rates in College Algebra went from 59% prior to the redesign to 76% after the redesign.
4 www.thencat.org/Mathematics/CTE/CTE%20Lessons%20Learned.pdf5 pearsonmylabandmastering.com/results
Math Efficacy Report

www.pearsonmylabandmastering.com • 43
Getting Started
1. What are the main issues you are trying to address?
2. What are the quantifiable goals you want to achieve? Example: Increase student retention rates by 10% over the course of a semester; increase student success rates by 15% over the course of a semester.
3. When do you want to start integrating a MyMathLab solution into your course? Will you start with a pilot course? If so, at what point do you foresee moving into a full implementation?
4. What course materials are you using? Do they align with your intended outcome?
5. Have you pursued grants or initiatives? If yes, what are they? Note: Check with your Pearson partner or visit Pearson’s Grant Help Center at www.pearsonhighered.com/granthelp/ to learn more.
6. Do you plan to hold organizational or professional development meetings for faculty, lab staff, IT administrators, or others?
7. What are (at least) three ways to educate the culture of your colleagues involved in the project? Example: Invite guests from institutions that have successfully implemented or redesigned with a Pearson MyMathLab solution.
Getting Started: Planning Your MyMathLab Implementation
Before choosing a software product or text Consider the following questions:
• Will it be used in face-to-face classes? in blended (hybrid) classes? in a lab setting? or in classes that are completely online?
• Does it assess student learning based on performance of assigned objectives?
• Does it assist students in remediation of areas in which an objective is not met?
• Does the software provider offer technical support for instructors, students, and campus IT administrators? Is there dedicated technical support for each of those user groups?
• For the supervision of sections taught by part-time or adjunct instructors, will the software ensure consistency of instruction?
www.pearsonhighered.com/courseredesign/ get-started/choose-a-product/index.html

44 • www.pearsonmylabandmastering.com
8. Who is on your implementation or redesign team (faculty, staff, lab directors, senior administrators)? Who will be responsible for managing the actual implementation or redesign?
9. How will you measure success? Example: Retention rates, final exam scores, final course grades, and subsequent success.
10. Will you use historical data to support the efficacy of your MyMathLab solution? Will you administer common exams and assessments?
11. What percentage will your MyMathLab solution contribute to a student’s final course grade?
12. Do you have—or have to seek—approval from your Institutional Review Board?
13. What is your main concern about implementing a Pearson MyMathLab solution?
14. At the end of the course, would you like assistance in analyzing your data? If so, contact your local Pearson representative.
“A collective commitment is a key factor in the success and the sustainability of redesign projects.”
—Carol Twigg National Center for Academic
Transformation
Math Efficacy Report

www.pearsonmylabandmastering.com • 45
Glossary
Completion rate is the percentage of students who registered for a course and completed the course through the final exam, excluding those students who officially dropped (withdrew from) the course. This is also called the retention rate.
Course redesign is the process of restructuring the way the content of a course is delivered. It generally involves redesigning a whole course (rather than individual classes or sections) usually to achieve better learning outcomes often at a lower cost. This usually is done by taking advantage of the capabilities of technology. Course redesign is most effective in large- enrollment courses.
Distance-learning course is a course where students do not have regular face-to-face class meetings and do not have to maintain a regular presence on the particular campus that is granting the credit. Most if not all learning activities are con-ducted online. Also called an online course.
Drop/fail/withdraw (DFW) rate is the percentage of students who register for a course and at the end earn a grade of D, F, or W (drop, fail, or withdraw) in the course.
Dual enrollment/dual credit programs offer the opportunity for high school students to simultaneously enroll in high school and college courses. Students receive both high school and college credit for successfully completed college classes.
Hybrid course is a course that has both face-to-face classroom activities and lab-based activities.
Integrated use refers to the fact that an instructor makes a MyMathLab product a part of the syllabus and assigns work to be completed by the student.
Lab-based course is a course where much if not all of the student learning takes place in a computer lab where students work independently and use technology to enhance learning. This type of course is called the emporium model when there are few, if any face-to-face meetings in a traditional classroom setting.
Online course is a course where students do not have regular face-to-face class meetings and do not have to maintain a regular presence on the particular campus that is granting the credit. Most if not all learning activities are conducted online. This type of course is also called a distance-learning course.
Pass rate is the percentage of students whose final grade is A, B, C, or D. This is not the same as the success rate, because the grade of D is included in the pass rate.
Required use means an instructor requires the use of a MyMathLab product by students for an individual grade that is part of the final course grade. It is the opposite of optional use.
Retained students are those students who registered for and completed the course through the final exam. This excludes those students who officially dropped (withdrew from) the course.
Retention rate is the percentage of students who registered for a course and completed the course through the final exam, excluding those students who officially dropped (withdrew from) the course. This is also called the completion rate.
Subsequent success (in this report) refers to the success that students experience in higher-level courses due in part to their having first successfully completed other, lower-level MyMathLab courses.
Success rate is the percentage of students who registered for a course and earned a final course grade of A, B, or C. Note that a final grade of D is not included in the success rate.
Traditional course refers to a course that usually is taught in the same way as in years past. This frequently involves a lecture format with little or no use of technology.
Various formats refers to an institution’s use of varied implementation models to teach with a MyMathLab product.
Glossary
To ensure clear and consistent understanding of the terms used in this report, we have taken the liberty of defining several of them here. Please note that these definitions are simply for the purposes of this report and do not necessarily reflect either official or dictionary-true versions.
46 • www.pearsonmylabandmastering.com
Conclusion
More than simply successful implementations, the courses, programs, and initiatives described on the previous pages are victories. Behind the successful outcomes—in the forms of improved final exam grades, increased persistence, success in subsequent courses, college readiness, and other learning gains—are students who have become better equipped to pursue their academic goals and achieve their life dreams.
An Ongoing ProcessWe applaud the institutions included herein for their efforts and determination. But those efforts are not over: a successful technology implementation is an ongoing process, ever evolving with the emergence of new and improved pedagogy, the entry of each unique cohort of students, and the increased amounts of information gleaned via the long-term tracking and measuring of student data.
Pearson’s Faculty Advisor Network (FAN) is available to help you improve the teaching and learning experience in your courses. Visit the FAN site to meet and engage with a community of educators who are eager to share advice, tips, and best practices related to MyLab & Mastering products. Join the network by visiting the site at http://community.pearson.com/fan.
The Pearson Family of Solutions Pearson offers solutions for all kinds of educational needs, for all types of courses, and for all of the ways those courses are taught and delivered. Combined with one of the many proven-successful best practices, the possible configurations of an effective MyLab & Mastering implementation are limitless. Let us help you:
• Increase achievement. Instant access to reliable data can help in the development of personalized learning, assessment, and instruction and can provide a blueprint for faculty and institutional effectiveness.
• Expand access. From digital course materials and real-time assessments to fully online courses, MyLab & Mastering learning solutions are more flexible, more powerful, and more accessible than ever before.
• Enable affordability. Innovative technology offers the best opportunity to deliver personalized, scalable, and engaging solutions that drive results up and drive costs down.
We look forward to hearing about your achievements and to including your experience in the next MyLab & Mastering report. To tell us about your success, contact Traci Simons, senior efficacy results manager, at [email protected].
Below is a list of links developed to inspire, support, promote conversation among educators, and ensure that the latest and most-effective practices are shared across the industry. We hope you find them useful and urge you to share them with colleagues and others committed to improving the teaching and learning experience.
Results Librarywww.pearsonmylabandmastering.com/results
16 Proven Ways to Help Your Course Redesign Succeed: Best practices from developmental math redesigns using MyMathLab in a lab-based setting at community collegeswww.pearsonmylabandmastering.com/northamerica/results/files/Math_ courseredesign_WP_Mar2013-24.pdf
Course Redesign Communityhttp://community.pearson.com/ courseredesign
Course Redesign Websitewww.pearsoncourseredesign.com
Faculty Advisor Networkhttp://community.pearson.com/fan
Math Instructor Exchangewww.instructorexchange.com/
Teaching and Learning Blogwww.pearsonlearningsolutions.com/blog/ channels/college-career-readiness/ask- the-experts-course-redesign-to-boost-achievement-and-lower-costs-part-2
MyLab & Mastering: 10 Best Practices www.pearsonmylabandmastering.com/northamerica/educators/results/
HELPFUL PEARSON LINKS
Math Efficacy Report

www.pearsonmylabandmastering.com • 47
Pearson Results Library: Mathematics and Statistics Case Studies
Pearson Results Library
Accelerate Learning/Course-level AdvancementChattanooga State Community College
Cleveland State Community College
Cochise College
East Los Angeles College
Jackson State Community College
Kapi’olani Community College
Laramie County Community College
Marshalltown Community College
Massachusetts Bay Community College
Montana State University Billings
Mountwest Community & Technical College
Northern Virginia Community College
Oakton Community College
Palo Alto College
Reading Area Community College (Hollister)
Reading Area Community College (Stoner)
Robeson Community College
Roosevelt University
Somerset Community College
Stark State College
Volunteer State Community College (2012, 2013)
West Virginia University at Parkersburg
Wilbur Wright College, City Colleges of Chicago
Improve College ReadinessBroadmoor High School
Campbellsville High School
The Dunham School
Howard High School
Kapi’olani Community College
Massachusetts Bay Community College
Northeast High School
Northeastern Illinois University
Palo Alto College
Reading Area Community College (Stoner)
Riverside High School
Roosevelt University
Sherwood Middle School
St. John Vianney High School
Tara High School
Woodlawn High School
Address Diverse Students and Skill LevelsChattanooga State Community College
East Los Angeles College
South Arkansas Community College
Enable Early InterventionNorthern Virginia Community College
Santa Ana College
West Virginia University at Parkersburg
Improve Final Exam ScoresArt Institute of Houston
Bowling Green Technical College
College of the Sequoias
Florence-Darlington Technical Community College
Looking for user-provided evidence to support your implementation? The Pearson Results Library is a searchable, online archive of evidence-based case studies, white papers, and journal articles conveniently referenced by course format, discipline, institution type, and state/province. Visit www.pearsonmylab.com/results to download any of the following math and statistics case studies.
48 • www.pearsonmylabandmastering.com
Florida State College at Jacksonville
Front Range Community College
Guilford Technical Community College (2013)
Kapi’olani Community College
Lurleen B. Wallace Community College
Mississippi State University
Montana State University–Billings
Northern Virginia Community College
Oakton Community College
Pearl River Community College
Riverside Community College District
Robeson Community College
Santa Ana College
Sherwood Middle School
Somerset Community College
Southern Illinois University–Carbondale
St. Philip’s College
Stark State College
Umpqua Community College
University at Albany
University of Houston–Downtown
University of Idaho
University of Mississippi (Ole Miss)
University of South Alabama
University of South Florida
University of Toledo
Volunteer State Community College (2012, 2013)
Implement Flipped Classroom/Interactive Learning Northern Virginia Community College
Reading Area Community College (Hollister 2014)
University of Louisville
West Virginia University at Parkersburg
Track and Quantify Learning Outcomes Heartland Community College
Laramie County Community College
Mountwest Community & Technical College
Nashville State Community College
Northern Virginia Community College
Stark State College
Incorporate Mastery Learning Baker College System
Bowling Green Technical College
Cabrini College
Cleveland State Community College
College of the Sequoias
Dallas County Community College District– Eastfield College
Florence-Darlington Technical College
Guilford Technical Community College (2013, 2014)
Jackson State Community College
Montana State University–Billings
Nashville State Community College
Northeastern Illinois University
Northern Virginia Community College
Pearl River Community College
Reading Area Community College (Stoner)
Robeson Community College
Somerset Community College
St. Philip’s College
Stark State College
Triton College
The University of Alabama in Huntsville
University of Houston–Downtown
University of Idaho
University of Louisville
University of South Alabama
Volunteer State Community College (2012, 2013)
Boost Pass, Retention, and/or Success Rates Algonquin College
Art Institute of Houston
Augusta State University
Baker College System
Blinn College, Bryan Campus
Bossier Parish Community College
Broadmoor High School
Cabrini College
Central Texas College
Chattanooga State Community College
Cleveland State Community College
Math Efficacy Report

www.pearsonmylabandmastering.com • 49
Pearson Results Library
Coastline Community College
Cochise College
College of the Sequoias
Dallas County Community College District– Brookhaven College
Dallas County Community College District– Eastfield College
Dallas County Community College District– El Centro College
DeVry University
The Dunham School
East Carolina University
Florence-Darlington Technical Community College
Florida State College at Jacksonville
Front Range Community College
Guilford Technical Community College (2013, 2014)
Henry Ford Community College
Hillsborough Community College
Indiana University Southeast
Iowa State University
Ivy Tech Community College
Jackson State Community College
Louisiana State University
Marshalltown Community College
Massachusetts Bay Community College
Mississippi State University
Montana State University–Billings
Northeastern Illinois University
Norwalk Community College
Northwest-Shoals Community College
Odessa College
Pearl River Community College
Quinsigamond Community College
Reading Area Community College (Hollister 2014)
Reading Area Community College (Stoner)
Riverside Community College District
Rock Valley College
Roosevelt University
SAIT Polytechnic
Santa Ana College
Seton Hall University
South Arkansas Community College
South Suburban College
Southeastern Louisiana University
Southern Illinois University–Carbondale
Texas Woman’s University
Triton College
Umpqua Community College
University at Albany
University of Central Florida
University of Houston–Downtown
University of Idaho
University of Memphis
University of Mississippi (Ole Miss)
University of South Alabama
University of Toledo
Volunteer State Community College (2012, 2013)
Wilbur Wright College, City Colleges of Chicago
Integrate Personlized Learning Reading Area Community College (Hollister 2014)
South Arkansas Community College
Redesign Multiple Courses/Change Course Format Algonquin College
Baker College System
Blinn College, Bryan Campus
Bowling Green Technical College
Cabrini College
Cleveland State Community College
Cochise College
Dallas County Community College District– Brookhaven College
Guilford Technical Community College (2013, 2014)
Jackson State Community College
Laramie County Community College
Louisiana State University
Lurleen B. Wallace Community College

50 • www.pearsonmylabandmastering.com
Mississippi State University
Mountwest Community & Technical College
Northwest-Shoals Community College
Quinsigamond Community College
Reading Area Community College (Hollister)
Riverside Community College District
Rock Valley College
Seton Hall University
South Arkansas Community College
Southeastern Louisiana University
Texas Woman’s University
Triton College
University of Central Florida
University of Idaho
Volunteer State Community College (2012)
West Virginia University at Parkersburg
Increase Student EngagementDallas County Community College District–
Brookhaven College
Guilford Technical Community College (2013)
Lurleen B. Wallace Community College
Multimedia University
Nashville State Community College
Northern Virginia Community College
Robeson Community College
Somerset Community College
Improve Success in Subsequent CoursesBaker College System
Central Texas College
Cleveland State Community College
Florence-Darlington Technical Community College
Louisiana State University
Mississippi State University
Nashville State Community College
Northwest-Shoals Community College
Quinsigamond Community College
Palo Alto College
Roosevelt University
Somerset Community College
Stark State College
The University of Alabama–Huntsville
Triton College
Improve Test-taking Skills/Decrease Test AnxietyChattanooga State Community College
Dallas County Community College District– Brookhaven College
Lurleen B. Wallace Community College
Math Efficacy Report

www.pearsonmylabandmastering • 51
Index: Institutions Included in this Report
Index: Institutions Included in this Report
Arizona State University, AZ .......................................................35
Chattanooga State Community College, TN .......................12, 38
Cleveland State Community College, TN ............................33, 38
East Carolina University, NC .........................................................4
East Los Angeles College, CA .....................................................14
Florida State College at Jacksonville, FL ......................................22
Guilford Technical Community College, NC .................16, 41, 42
Liberty University, VA ..................................................................35
Louisiana State University, LA .............................................. 28, 36
Mississippi State University, MS ...................................................31
Northeastern Illinois University, IL .............................................34
Northern Virginia Community College, VA ...............................42
Northwest-Shoals Community College, AL ..................40, 41, 42
Oakton Community College, IL ..................................................41
Pearl River Community College, MS ..........................................42
Quinsigamond Community College, MA ...................................27
Reading Area Community College, PA .................................18, 35
Robeson Community College, NC .............................................40
South Arkansas Community College, AR ..................................20
St. Philip’s College, TX .................................................................24
University of Alabama, AL ...........................................................26
University of Central Florida, FL .................................................29
University of Idaho, ID .................................................................32
University of Louisville, KY ............................................................6
University of South Alabama, AL ..................................................8
University of South Florida, FL ...................................................10
Volunteer State Community College, TN ..................................40
Wayne State University, MI .........................................................35

52 • www.pearsonmylabandmastering.com
Notes
Math Efficacy Report

List of Contributors
Joseph AgbekoSouth Arkansas Community College
Ruben ArenasEast Los Angeles College
Susan BarbittaGuilford Technical Community College
Joe BensenUniversity of Alabama
Tony BowerSt. Philip’s College
April ChurchEast Carolina University
Rahim FaradinehEast Los Angeles College
Andreana GrimaldoQuinsigamond Community College
Jeffrey HiebUniversity of Louisville
Diane HollisterReading Area Community College
Fran HopfUniversity of South Florida
Matthew MaherUniversity of South Florida
Marcus McWatersUniversity of South Florida
Tammy MuhsUniversity of Central Florida
Phoebe RouseLouisiana State University
Ruthmae SearsUniversity of South Florida
John SquiresChattanooga State Community College
Kirk TrigstedUniversity of Idaho
Ana TorresUniversity of South Florida
Rich TurnerFlorida State College at Jacksonville
Kim WaltersMississippi State University
Leslie WhistonUniversity of South Alabama
Cathy WilkersonEast Carolina University
Karen WyrickCleveland State Community College

www.pearsonhighered.com
MathWP_July2014
MyStatLab™
Pearson is committed to providing products and services in support of effective teaching and learning. We do this by fostering partnerships with all industry stakeholders, including you, our customers. This is your community. In a spirit of sharing best practices among peers, we offer instructors informative reports, present online forums and trainings, and sponsor various on-ground events throughout the year. We encourage you to participate, and we welcome your feedback.