Material Model Evaluation of a Composite Honeycomb Energy … · Composite Honeycomb Energy...
22
12 th International LS-DYNA ® Users Conference Constitutive Modeling(4) 1 Material Model Evaluation of a Composite Honeycomb Energy Absorber Karen E. Jackson Edwin L. Fasanella NASA Langley Research Center National Institute of Aerospace Hampton, VA Hampton, VA Martin S. Annett Michael A. Polanco NASA Langley Research Center ATK Space Systems Hampton, VA Hampton, VA Abstract A study was conducted to evaluate four different material models in predicting the dynamic crushing response of solid-element-based models of a composite honeycomb energy absorber, designated the Deployable Energy Absorber (DEA). Dynamic crush tests of three DEA components were simulated using the nonlinear, explicit transient dynamic code, LS-DYNA ® . In addition, a full-scale crash test of an MD-500 helicopter, retrofitted with DEA blocks, was simulated. The four material models used to represent the DEA included: *MAT_CRUSHABLE_FOAM (Mat 63), *MAT_HONEYCOMB (Mat 26), *MAT_SIMPLIFIED_RUBBER/FOAM (Mat 181), and *MAT_TRANSVERSELY_ANISOTROPIC_CRUSHABLE_FOAM (Mat 142). Test-analysis calibration metrics included simple percentage error comparisons of initial peak acceleration, sustained crush stress, and peak compaction acceleration of the DEA components. In addition, the Roadside Safety Verification and Validation Program (RSVVP) was used to assess similarities and differences between the experimental and analytical curves for the full-scale crash test. Introduction Since 2006, NASA has sponsored research to evaluate a composite honeycomb energy-absorbing concept, designated the Deployable Energy Absorber (DEA) [1]. The DEA is an expandable composite honeycomb structure designed to absorb impact energy by crushing, which is achieved through local cell wall bending, plastic hinge formation, minor tearing, and delamination. Unlike other cellular energy absorbers in use today, the DEA utilizes a unique and patented flexible hinge at each junction of its cell walls [2]. This feature allows the energy absorber to be stowed flat until needed for deployment during an emergency. Expansion can be performed in a linear or rotational manner, as shown in Figure 1. Like conventional honeycomb, once expanded the energy absorber is transformed into an efficient orthotropic cellular structure, with greater stiffness and strength along the cell axis as compared to the transverse directions. Experimental evaluation of the DEA utilized a building block approach that included material characterization testing of its constituent, Kevlar ® -129 fabric/epoxy; flexural testing of single hexagonal cells; dynamic crush tests of multi-cell components; and vertical drop tests of a composite fuselage section, retrofitted with DEA blocks, onto concrete, water, and soft soil [3-5]. As a final demonstration, a full-scale crash test of an MD-500 helicopter was conducted in December 2009 to assess the energy absorbing capabilities of the DEA under combined velocity impact conditions, and to generate data for model validation [6-8]. During each stage of the DEA evaluation process, finite element models of the test articles were developed and
Transcript of Material Model Evaluation of a Composite Honeycomb Energy … · Composite Honeycomb Energy...

12th
International LS-DYNA® Users Conference Constitutive Modeling(4)
1
Material Model Evaluation of a
Composite Honeycomb Energy Absorber
Karen E. Jackson Edwin L. Fasanella NASA Langley Research Center National Institute of Aerospace
Hampton, VA Hampton, VA
Martin S. Annett Michael A. Polanco NASA Langley Research Center ATK Space Systems
Hampton, VA Hampton, VA
Abstract A study was conducted to evaluate four different material models in predicting the dynamic crushing response of
solid-element-based models of a composite honeycomb energy absorber, designated the Deployable Energy
Absorber (DEA). Dynamic crush tests of three DEA components were simulated using the nonlinear, explicit
transient dynamic code, LS-DYNA®
. In addition, a full-scale crash test of an MD-500 helicopter, retrofitted with
DEA blocks, was simulated. The four material models used to represent the DEA included:
*MAT_CRUSHABLE_FOAM (Mat 63), *MAT_HONEYCOMB (Mat 26), *MAT_SIMPLIFIED_RUBBER/FOAM
(Mat 181), and *MAT_TRANSVERSELY_ANISOTROPIC_CRUSHABLE_FOAM (Mat 142). Test-analysis
calibration metrics included simple percentage error comparisons of initial peak acceleration, sustained crush
stress, and peak compaction acceleration of the DEA components. In addition, the Roadside Safety Verification and
Validation Program (RSVVP) was used to assess similarities and differences between the experimental and
analytical curves for the full-scale crash test.
Introduction
Since 2006, NASA has sponsored research to evaluate a composite honeycomb energy-absorbing
concept, designated the Deployable Energy Absorber (DEA) [1]. The DEA is an expandable
composite honeycomb structure designed to absorb impact energy by crushing, which is
achieved through local cell wall bending, plastic hinge formation, minor tearing, and
delamination. Unlike other cellular energy absorbers in use today, the DEA utilizes a unique and
patented flexible hinge at each junction of its cell walls [2]. This feature allows the energy
absorber to be stowed flat until needed for deployment during an emergency. Expansion can be
performed in a linear or rotational manner, as shown in Figure 1. Like conventional honeycomb,
once expanded the energy absorber is transformed into an efficient orthotropic cellular structure,
with greater stiffness and strength along the cell axis as compared to the transverse directions.
Experimental evaluation of the DEA utilized a building block approach that included material
characterization testing of its constituent, Kevlar®-129 fabric/epoxy; flexural testing of single
hexagonal cells; dynamic crush tests of multi-cell components; and vertical drop tests of a
composite fuselage section, retrofitted with DEA blocks, onto concrete, water, and soft soil [3-5].
As a final demonstration, a full-scale crash test of an MD-500 helicopter was conducted in
December 2009 to assess the energy absorbing capabilities of the DEA under combined velocity
impact conditions, and to generate data for model validation [6-8]. During each stage of the
DEA evaluation process, finite element models of the test articles were developed and

Constitutive Modeling(4) 12th
International LS-DYNA® Users Conference
2
simulations were performed using the explicit, nonlinear transient dynamic finite element code,
LS-DYNA® [9].
(a) Linear deployment. (b) Radial deployment.
Figure 1. Photographs showing deployment methods of the DEA.
As part of the simulation studies, both shell- and solid-element based models were developed.
Shell element models contained accurate physical representations of the DEA cellular geometry
and these models were able to successfully predict the observed deformation modes and the
crushing responses of the DEA [10-13]. However, in order to capture these responses, a fairly
fine mesh was required, typically with a nominal element edge length of 0.25-in. As a result,
simulations of tests involving large DEA blocks required tens of thousands of shell elements to
adequately represent the DEA. Under dynamic compressive loading, these elements can
experience severe deformations, leading to small time steps and long execution times.
As an alternative, solid-element-based models of the DEA were investigated [14-16]. A major
challenge of this approach was to find an appropriate material model that could accurately
capture the major features of the DEA crushing response, including initial peak acceleration,
uniform sustained crushing, and compaction. In this paper, four different material models (Mat
63, Mat 26, Mat 181, and Mat 142) were evaluated in solid-element models of three DEA
components. In addition, the same material definitions were used in solid-element-based
representations of DEA blocks attached to the MD-500 helicopter, and full-scale crash
simulations were executed. For the DEA components, test-analysis calibration metrics included
simple percentage error comparisons of initial peak acceleration, sustained crush stress, and peak
compaction acceleration. For the MD-500 crash test, the Roadside Safety Verification and
Validation Program (RSVVP) [17] was used to assess similarities and differences between the
experimental and analytical acceleration time histories for the full-scale crash test.
Summary of Experiments
Dynamic Crush Tests of Three DEA Components
Three multi-cell components were fabricated to evaluate the energy absorption capabilities of the
DEA under both normal and off-axis loading conditions. Two of the DEA components,
consisting of 59- and 104-cells, were manufactured such that the longitudinal axes of the cells
were oriented in the same direction as loading (normal). A third DEA component, consisting of
68-cells, was fabricated such that the longitudinal axes of the cells were canted by 27° with
respect to the direction of loading (off-axis). Each component was fabricated of Kevlar®-129
fabric/epoxy with fibers oriented at ±45° with respect to the longitudinal or loading axis.
Individual cells within the honeycomb have a hexagonal cross-section with a flat facet width of
1-in. and a nominal wall thickness of 0.01-in. This particular configuration of the DEA was
designed to provide a 20-psi uniform crushing stress. The top surface of each DEA component

12th
International LS-DYNA® Users Conference Constitutive Modeling(4)
3
was curved slightly to reduce the high peak loads that can occur during initial impact. The
components were impacted in a fully deployed state by a rigid impact mass, or block, that
translated on vertical support rods through low-friction bearings. The drop mass was
instrumented with an accelerometer to record the vertical acceleration response of the impact
block. Details regarding the dimensions of each DEA component and the impact test conditions
are listed in Table 1.
Table 1. Details of DEA Component Crush Testing.
Number
of cells
Cell
orientation*
Length,
in.
Width,
in.
Height,
in.
Weight of
impact block, lb.
Velocity at
impact, in/s
59 0° 16 12.4 6.0 412.5 195.6
104 0° 21 15.8 10.0 477.2 266.4
68 27° 16 14.0 6.7 477.2 183.6
*with respect to the vertical, or loading, direction
Plots of raw and filtered acceleration time histories for each DEA component are shown in
Figure 2. The test data were filtered using either an SAE CFC 60 or 180 low pass filter [18], as
necessary to remove high frequency oscillations from the data. All three DEA components
exhibit a uniform crushing phase; however, only the 59- and 68-cell components exhibit a
compaction phase, which is characterized by a large increase in acceleration near the end of the
pulse due to “bottoming out” of the honeycomb. The 104-cell component did not achieve
compaction, even though a higher impact mass and velocity were used during the impact test.
Obviously, the incident kinetic energy was insufficient to produce compaction due to the greater
cross-sectional area and height of the 104-cell DEA. It should be noted that no repeated tests of
similar components were performed to quantify experimental uncertainty.
(a) 59-cell DEA. (b) 104-cell DEA. (c) 68-cell DEA.
Figure 2. Raw and filtered acceleration responses from three DEA component crush tests.
All of the material definitions that were selected for evaluation in solid-element-based models of
the DEA require input of curves that define the stress versus volumetric strain response of the
material. To generate these curves, the filtered acceleration time histories, shown in Figure 2,
were converted to stress-strain data, using the following procedure. Stress values were
calculated by adding 1 to the acceleration data in g’s to account for the acceleration of gravity,
then multiplying by the weight of the impact block, and dividing by the cross-sectional area of

Constitutive Modeling(4) 12th
International LS-DYNA® Users Conference
4
the DEA. The strain was determined by double integration of the acceleration response to obtain
displacement, which was divided by the initial vertical height of the DEA component. The
average crush stress of the 59-, 104-, and 68-cell DEA components was determined based on a
strain interval of 0- to 0.6-in/in. The average stress values are 15.6-psi for the 68-cell DEA,
17.6-psi for the 59-cell DEA, and 22.0-psi for the 104-cell DEA. If the crush stresses of the two
normal DEA components (59- and 104-cell) are averaged, a value of 19.8-psi is obtained, which
is close to the design goal of 20-psi. Please note that values of average crush stress reported later
are based on converting average accelerations determined over the time interval of 0.0-0.03-s.
These numbers may differ slightly based on the different intervals used in the calculations.
A plot of the 59- and 104-cell DEA stress versus volumetric strain responses is shown in Figure
3, along with a curve that was obtained by averaging the 59- and 104-cell responses. Since the
104-cell DEA did not reach the compaction phase during the test, its stress-strain curve was
approximated to have the same response as the 59-cell DEA after a strain of approximately 0.8-
in/in. In this paper, the average stress-strain response was used as input to the material models.
Stress values up to 30-psi are shown in the plot; however, the actual curve has a high magnitude
“tail” that is not shown in Figure 3 which is used to simulate compaction and to prevent element
inversion and negative volume erros.
Figure 3. Stress-strain responses of the 59- and 104-cell DEA, and the 59- and 104-cell average.
Full-Scale Crash Test of an MD-500 Helicopter
An impact simulation was performed representing a full-scale crash test of an MD-500
helicopter, retrofitted with two blocks of the DEA. The test was conducted onto a flat concrete
surface. Pre- and post-test photographs of the test article are shown in Figure 4. The crash test
was conducted at the NASA Langley Landing and Impact Research (LandIR) Facility in
December 2009 to evaluate the performance of the DEA under realistic crash conditions and to
generate test data for comparison with finite element predictions. The pilot was a 50th
percentile
male Hybrid III Anthropomorphic Test Device (ATD). The co-pilot and one passenger were 50th
percentile male Hybrid II ATDs. The other passenger was a biofidelic torso developed by The
Johns Hopkins University Applied Physics Laboratory [19]. ATDs were seated in standard
military replacement seats that were installed in the helicopter. The total weight of the test
article was 2,930 lb, including four ATDs, two DEA blocks, and ballast mass that was added to
represent the main rotor, engine, tail, and fuel tank. The helicopter was instrumented to collect

12th
International LS-DYNA® Users Conference Constitutive Modeling(4)
5
160 channels of data from strain gages, accelerometers, and load cells at 10,000 samples/second.
In addition, photogrammetric targets were placed on the left side of the vehicle. Motion tracking
of the targets was used to determine impact conditions and gross vehicle motion before, during,
and after impact.
The DEA blocks attached to the MD-500 helicopter had a design configuration similar to the
three DEA components. A prior analytical study [12] showed that the ideal orientation of the
DEA blocks for maximum energy absorption given the combined velocity conditions of the full-
scale crash test was a 20° cant angle with respect to the vertical direction. However, geometric
limitations of the airframe required that the orientation of the rear DEA block remain purely
vertical. Consequently, only the front DEA block was canted by 20°. The DEA blocks were
attached in their fully deployed configuration. Measured impact conditions were 25.6-ft/s
horizontal and 38.8-ft/s vertical velocities with an attitude of 5.7° pitch, 9.3° yaw, and 7.0° roll.
For the present simulation study, test-analysis comparisons are shown for two locations, one at
the pilot seat box and the other at a passenger floor location near the rear bulkhead. Additional
details of the experimental program can be found in References 6-8.
(a) Pre-test photograph. (b) Post-test photograph.
Figure 4. Pre- and post-test photographs of the MD-500 test article.
Descriptions of the Material Models
Solid-element-based finite element models of the dynamic crush tests of the DEA components
were developed for execution in LS-DYNA® Shared Memory Processor (SMP) version 971.
Initially, solid elements were selected for the simulations as a means of lowering execution
times, compared with shell-element-based simulations. However, it was also understood that the
use of solid-element-based models precluded the accurate prediction of deformation modes
observed in the actual DEA specimens. The objective of this simulation study was to evaluate
four different material models assigned to solid-element-based models of the DEA and to
determine if these models could adequately predict both the uniform crush and compaction
responses of the normal and off-axis DEA components. Four different material property
definitions available in LS-DYNA® were evaluated, including: Mat 63
(*MAT_CRUSHABLE_FOAM), Mat 26 (*MAT_HONEYCOMB), Mat 181
(*MAT_SIMPLIFIED_RUBBER/FOAM), and Mat 142 (*MAT_TRANSVERSELY_ANISO-
TROPIC_CRUSHABLE_FOAM). In addition, the finite element model of the MD-500 was
updated with solid element representations of the DEA blocks, and the full-scale crash test was

Constitutive Modeling(4) 12th
International LS-DYNA® Users Conference
6
simulated in which these four material models were assigned to the energy absorbers. In the
following subsections of the paper, each of the material models will be described briefly.
Mat 63 (*MAT_CRUSHABLE_FOAM)
This material model was developed to represent the properties of isotropic crushable foam and
includes optional damping and a tensile cutoff stress. Unloading is fully elastic to the tensile
cutoff stress and reloading follows the loading curve. Tension is represented using an elastic-
perfectly-plastic response at the tension cutoff value [9]. Mat 63 allows input of a user-defined
curve representing the yield stress versus volumetric strain response of the material. It is
important to note that volumetric strain is defined as 1 minus the relative volume, which is the
ratio of the current volume to the initial volume. Thus, as crushing starts, the volumetric strain is
low and increases as crushing progresses. The input values used in the Mat 63 material model
are listed in Table 2. The input stress-strain curve for Mat 63 was the average response shown in
Figure 3. The value of Young’s modulus, shown in Table 2, was determined from the high-
magnitude tail of the average stress-strain curve, not the initial stress-strain response. LS-
DYNA® uses the high value to prevent instabilities in the model.
Table 2. Mat 63 input parameters.
Parameter Description Value
RO Material density 2.182e-6 lb-s2/in
4
E Young’s modulus 6000 psi
PR Poisson’s ratio 0.05
LCID Identification number of user input
stress-strain response
Average response
TSC Tensile stress cutoff -5 psi
DAMP Damping coefficient 0.05
Mat 26 Honeycomb Material Model
The Mat 26 material model is used to represent honeycomb and foam materials with anisotropic
behavior [9]. Nonlinear elastic-plastic material responses are defined separately for normal and
shear stresses, and these input curves are considered to be fully uncoupled. The behavior of the
material before compaction is orthotropic, where the components in the stress tensor are
uncoupled. Unloading is based on the interpolated Young’s modulus, which must provide an
unloading tangent that exceeds the loading tangent. The input values used in the Mat 26 material
model for both the normal and off-axis DEA components are listed in Table 3.
In this study, the input stress-strain curves are based on volumetric strain. The user of this
material model is cautioned in Reference 9 to ensure that each input curve contains the exact
same number of points and this recommendation was followed. The input load curve for Mat 26,
shown in Figure 5, was based on the average stress-strain response. Unlike the input curve for
Mat 63 which begins at zero stress and zero strain, the Mat 26 input curve begins with a point
having negative strain and positive stress and the second point has a corresponding value of
positive strain and the same value of positive stress. This approach for inputting the load curves
for Mat 26 is recommended in Reference 9.
The Mat 26 input curve, shown in Figure 5, corresponds to the load curve for sigma-cc (LCC
listed in Table 3), where cc was arbitrarily selected to represent the local vertical direction.

12th
International LS-DYNA® Users Conference Constitutive Modeling(4)
7
Since no experimental data were available, load curve inputs for the two transverse directions (aa
and bb) and for the shear directions (s, ab, bc, ca) were assumed to be scaled versions of sigma-
cc (LCC), with the scale factors listed in Table 3. Finally, Mat 26 allows the user to define
directions for the local material axis system using the AOPT parameter [9]. For these
simulations, AOPT was set to 2.0 indicating globally orthotropic behavior with material axes
determined by vectors a and d, such that a x d defines the primary material direction. Note that
the local material axes can rotate based on element deformation and nodal angular velocity. For
the 59- and 104-cell DEA components, the vectors were chosen such that the primary material
direction (cc) is oriented vertically, as illustrated in Figure 6(a). For the 68-cell DEA, the vectors
were defined such that the primary material axis for LCC was canted 27° with respect to the
vertical direction, as illustrated in Figure 6(b).
Table 3. Mat 26 input parameters.
Symbol Description Value
Normal
DEA
Off-axis
DEA
RO Material density, lb-s2/in
4 2.182e-6 2.182e-6
E Young’s modulus of fully compacted honeycomb, psi 6,000.0 6,000.0
PR Poisson’s ratio 0.05 0.05
SIGY Yield stress of fully compacted honeycomb, psi 22.0 22.0
VF Relative volume at which honeycomb is fully compacted 0.15 0.15
MU Damping coefficient 0.05 0.05
BULK Bulk viscosity flag, if equal 0.0, bulk viscosity is not used 0.0 0.0
LCA Load curve id for stress sigma-aa versus volumetric strain SF*=0.1 SF*=0.1
LCB Load curve id for stress sigma-bb versus volumetric strain SF=0.1 SF=0.1
LCC Load curve id for stress sigma-cc versus volumetric strain SF=1.0 SF=1.0
LCS Load curve id for shear stress versus volumetric strain No input No input
LCAB Load curve id for stress sigma-ab versus volumetric strain SF=0.45 SF=0.45
LCBC Load curve id for stress sigma-bc versus volumetric strain SF=0.45 SF=0.45
LCCA Load curve id for stress sigma-ca versus volumetric strain SF=0.45 SF=0.45
LCSR Load curve id for strain rate effects (optional) No input No input
EAAU Elastic modulus Eaau in uncompressed configuration, psi 60.0 60.0
EBBU Elastic modulus Ebbu in uncompressed configuration, psi 60.0 60.0
ECCU Elastic modulus Eccu in uncompressed configuration, psi 566.7 566.7
GABU Shear modulus Gabu in uncompressed configuration, psi 135.0 135.0
GBCU Shear modulus Gbcu in uncompressed configuration, psi 270.0 270.0
GCAU Shear modulus Gcau in uncompressed configuration, psi 270.0 270.0
AOPT Material axes option (equal 2.0 – globally orthotropic) 2.0 2.0
MACF Material axis change flag (default=1, no change) 1.0 1.0
XP YP ZP Coordinates of point p for AOPT = 1 No input No input
A1 A2 A3 Coordinates of vector a for AOPT = 2 1, 0, 0 .891, 0, -.454
D1 D2 D3 Coordinates of vector d for AOPT = 2 0, 1, 0 0, 1, 0
TSEF Tensile strain at element failure (element will erode) No input No input
SSEF Shear strain at element failure (element will erode) No input No input
*SF is a Scale Factor applied to the primary input load curve (LCC)
Mat 181 *MAT_SIMPLIFIED_RUBBER/FOAM
As described in Reference 9, Mat 181 was developed for rubber and foam materials whose
assumed isotropic response can be characterized by a single uniaxial load curve. The material
Constitutive Modeling(4) 12th
International LS-DYNA® Users Conference
8
can be used with both shell and solid elements and has strain rate capability. Parameter values
for Mat 181 representing the DEA material response are listed in Table 4. The input load curve,
which is based on the average test data, is shown in Figure 7(a) and a closer view of the plot is
shown in Figure 7(b) for a much narrower ordinate range. These plots show that the data are
input in the negative stress, negative strain quadrant.
Figure 5. Mat 26 input load curve based on the averaged 59- and 104-cell DEA data.
(a) Normal DEA. (b) Off-axis DEA.
Figure 6. Schematics illustrating local material axis definitions for normal and off-axis DEA
components.
Mat 142 *MAT_TRANSVERSELY_ANISOTROPIC_CRUSHABLE_FOAM
Mat 142 was developed for extruded low-density crushable foams that exhibit anisotropic
behavior with zero Poisson’s Ratio. The formulation of this material model is described in
Reference 20, and it was developed to correct some problems seen in Mat 26 in representing off-
axis loading. Specifically, this material model requires input of load curves to represent the
nominal axial stress versus volumetric strain (I11), as well as three additional load curves
representing nominal transverse stress, shear stress in the 1-2 direction, and shear stress in the 2-
3 direction. It is important to note that curve I11 is aligned with the element local material
direction, A. As an option, the user can define a stress versus volumetric strain response for load

12th
International LS-DYNA® Users Conference Constitutive Modeling(4)
9
at a specified off-axis angle. Input values for Mat 142 representing the DEA material response
are listed in Table 5.
Table 4. Mat 181 input parameters.
Symbol Description Value
RO Material density, lb-s2/in
4 2.182e-6
KM Linear bulk modulus 2222.2
MU Damping coefficient 0.2
G Shear modulus for frequency independent damping No input
SIGF Limit stress for frequency independent damping No input
REF Reference geometry flag No input
PRTEN Tensile Poisson’s ratio for shells No input
SGL Specimen gage length 1.0
SW Specimen width 1.0
ST Specimen thickness 1.0
LC/TBID Load curve or table ID Average
TENSION Parameter that controls how rate effects are managed No input
RTYPE Strain rate type 1.0
AVGOPT Averaging option 1.0
PR/BETA If between 0<PR<0.5, Poisson’s ratio 0.05
(a) Load curve input to Mat 181. (b) Load curve input, narrowed ordinate range.
Figure 7. Input load curve (stress versus strain) for Mat 181, based on the average response.
Note that in Table 5 the input load curves in the transverse and shear directions are simply scaled
versions of the nominal axial load curve (I11), and the scale factors are the same as used in Mat
26. Also, during an early evaluation of this material, the optional load curve, IAA, was input
based on the stress versus volumetric strain response of the 68-cell DEA and ANG was set to
27°. However, the simulations developed extremely small time steps and negative volume errors
occurred. Consequently, load curve IAA was removed. Finally, the same input load curve used
for Mat 26 was used for Mat 142, as shown in Figure 5.

Constitutive Modeling(4) 12th
International LS-DYNA® Users Conference
10
Table 5. Mat 142 input parameters.
Symbol Description Value
Normal
DEA
Value
Off-Axis
DEA
RO Material density, lb-s2/in
4 2.182e-6 2.182e-6
E11 Elastic modulus in the axial direction 712.0 712.0
E22 Elastic modulus in the transverse direction 71.2 71.2
E12 Elastic shear modulus 270.0 270.0
E23 Elastic shear modulus in the transverse plane 135.0 135.0
G Shear modulus 339.0 339.0
K Bulk modulus for contact stiffness 10.0e03 10.0e03
I11 Load curve ID for axial stress vs volumetric strain SF=1.0 SF=1.0
I22 Load curve ID for transverse stress vs volumetric strain SF=0.1 SF=0.1
I12 Load curve ID for shear stress 12 vs volumetric strain SF=0.45 SF=0.45
I23 Load curve ID for shear stress 23 vs volumetric strain SF=0.45 SF=0.45
IAA Load curve ID for stress vs. volumetric strain at angle No input No input
NY Set to unity for a symmetric yield surface 1.0 1.0
ANG Angle corresponding to load curve ID, IAA No input No input
MU Damping coefficient 0.05 0.05
AOPT Material axes option (equal 2.0 – globally orthotropic) 2.0 2.0
ISCL Load curve ID for strain rate scale factor No input No input
MACF Material axis change flag 1.0 1.0
A1, A2, A3 Coordinates of vector a for AOPT=2.0 0, 0, 1 0.454, 0,
0.891
D1, D2, D3 Coordinates of vector d for AOPT=2.0 1, 0, 0 0, 1, 0
*SF is a Scale Factor applied to the primary input load curve (I11)
Finite Element Model Descriptions
DEA Component Model Description
The 59-, 104-, and 68-cell DEA component models are shown in Figure 8. Each model consists
of three main parts: the DEA, which is represented using hexagonal solid elements with element
formulation 1 (default constant stress solid element); an impact surface, located just beneath the
bottom surface of the DEA, that is constructed of quadrilateral shell elements; and, a rigid block
that is constructed of solid hexagonal elements that are assigned a *MAT_RIGID material
property. Each DEA model had a nominal element edge length of 0.5-in., which was determined
based on a prior mesh discretization study. The impact surface was included to prevent element
deformation below the bottom surface of the DEA. All edge nodes on the impact surface were
fully constrained. The same *MAT_RIGID material property used for the impact block was
assigned to the impact surface. The density of the rigid material was chosen such that the weight
of each rigid block matched the test conditions, which are listed in Table 1. Likewise, nodal
velocities were assigned to the block to match the test conditions. For all models, a segment-
based contact definition of *CONTACT_AUTOMATIC_SINGLE_SURFACE was used to
represent contact between the impact block and the DEA, the DEA and the impact surface, and
self-contact between elements within the DEA. Finally, the DEA component simulations were
executed to include gravity as a body load. Additional details regarding the DEA component
models may be found in Reference 5.

12th
International LS-DYNA® Users Conference Constitutive Modeling(4)
11
(a) 59-cell model. (b) 104-cell model. (c) 68-cell model.
Figure 8. Solid element models of three DEA components.
MD-500 Helicopter Model
A system-integrated finite element model (FEM) of the MD-500 helicopter, shown in Figure 9,
was initially developed based on a computer aided design (CAD) model of the MD-500 fuselage.
The model is designated “system-integrated” because it contains accurate physical
representations of the impact surface, skid gear, airframe, seats, ballast, and DEA. The total
number of elements in the model was targeted not to exceed 500,000 elements. The majority of
elements (320,000 shell elements) were used to represent the DEA blocks and skid gear. In
general, the fuselage model is primarily composed of shell elements representing airframe skins,
ribs and stiffeners. Ballast representing rotor mass, tail mass, and fuel is incorporated in the
FEM as concentrated mass elements. The lifting and pullback fixtures, that were added to the
airframe for the impact test, were simulated as rigid shells. The platform that supports the data
acquisition system (DAS) was mounted in the tail and was also modeled as a rigid shell.
Material properties for the fuselage are based on the MD-500 Structural Repair Manual [21],
which indicates that the fuselage material is primarily Aluminum 2024-T3, and has elastic-
plastic properties.
Figure 9. Model of the MD-500 Helicopter with DEA blocks.
In prior simulations, occupant models were included and the two DEA blocks were represented
with shell elements [22-24]. To simplify the model, the occupants were removed and replaced
using simple concentrated mass elements. In addition, the DEA shell elements were removed
from the model and the DEA volume was discretized using solid elements. This change was
made to enable evaluation of different material models assigned to solid elements representing
the DEA in the MD-500 finite element model. In addition, it was anticipated that solid element
DEA simulations would require less time to execute as compared with the shell-based DEA
model. For the isotropic material models (Mat 63 and Mat 181), the two DEA blocks were
included in one part definition. However, for the orthotropic material models (Mat 26 and Mat

Constitutive Modeling(4) 12th
International LS-DYNA® Users Conference
12
142), each block was assigned its own part definition to account for different material directions
due to the 20° cant angle of the front block.
Results of Simulating the Dynamic Crushing Response of Three DEA
Components
Comparisons of the simulation predictions with the test data are made for each DEA component
to evaluate the effectiveness of the four material models in predicting the DEA response. In each
case, the predicted responses are filtered using an SAE CFC 180-Hz low-pass filter [18]. In
addition, three correlation metrics were selected to assess the level of agreement between test
and analysis for the DEA components. These metrics are initial peak acceleration; average crush
stress, which is based on average acceleration that is calculated over the time interval of 0.0-0.03
seconds; and, peak acceleration during compaction.
Results for 59-Cell DEA
Test-analysis comparison plots are shown in Figure 10 with predictions from the isotropic
material models (Mat 63 and Mat 181) shown in Figure 10(a) and predictions from the
orthotropic material models (Mat 26 and Mat 142) shown in Figure 10(b). Note that for each
material model, the average DEA response was used as the input load curve. Correlation metrics
are provided in Table 6.
(a) Test with Mat 63 and Mat 181. (b) Test data with Mat 26 and Mat 142.
Figure 10. Test-analysis comparison plots for the 59-cell DEA component.
Table 6. Test-Analysis Correlation Metrics for the 59-Cell DEA Component Models.
Parameter
Test Mat 63 Mat 181 Mat 26 Mat 142
Value Error,
%
Value Error,
%
Value Error,
%
Value Error,
%
Initial peak
accel., g
10.8 10.4 3.7 10.6 1.9 9.7 10.2 10.2 5.6
Avg. crush
stress, psi
16.8 20.8 -23.8 17.1 -1.8 20.7 -23.2 19.2 -14.3
Compaction
peak, g
63.6 15.9 75.0 51.8 18.6 37.9 40.4 20.2 68.2

12th
International LS-DYNA® Users Conference Constitutive Modeling(4)
13
The results indicate that each material model was able to predict the initial peak acceleration
within approximately 10% and the average crush stress within ±25%. However, predicted values
of the peak compaction acceleration are off by as much as 75%. Of the four material models
evaluated for the 59-cell DEA component, Mat 181 performed best among the three metrics
considered, even though the predicted time of the peak compaction acceleration is delayed
compared with the experiment.
Results for 104-Cell DEA
Test-analysis comparison plots are shown in Figure 11 for the 104-cell DEA component with
predictions from the isotropic material models (Mat 63 and Mat 181) shown in Figure 11(a) and
predictions from the orthotropic material models (Mat 26 and Mat 142) shown in Figure 11(b).
Recall that for each material model, the average DEA response was used as the input load curve.
Correlation metrics are provided in Table 7, with the exception of the peak compaction. This
metric was removed since the test and analytic responses did not exhibit compaction.
(a) Test with Mat 63 and Mat 181. (b) Test data with Mat 26 and Mat 142.
Figure 11. Test-analysis comparison plots for the 104-cell DEA component.
For all material models, the level of agreement in predicting the initial acceleration and the
sustained crushing stress is within 11% and 17%, respectively. In general, the analytical curves
increased to an initial value between 15- to 17-g, then the acceleration level stayed fairly
constant throughout the pulse. However, for Mat 181, the predicted response exhibited a sharp
5-g reduction in acceleration to approximately 12-g, following an initial peak of 16.7-g.
Following the reduction, the acceleration level remained constant to the end of the pulse.
Table 7. Test-Analysis Correlation Metrics for the 104-Cell DEA Component Models.
Parameter
Test Mat 63 Mat 181 Mat 26 Mat 142
Value Error,
%
Value Error,
%
Value Error,
%
Value Error,
%
Initial peak
accel., g
16.9 15.8 6.5 16.7 1.2 15.1 10.7 15.2 7.7
Avg crush
stress, psi
22.1 20.6 6.8 18.4 16.7 20.8 5.9 19.7 10.9
Constitutive Modeling(4) 12th
International LS-DYNA® Users Conference
14
Results for 68-Cell DEA
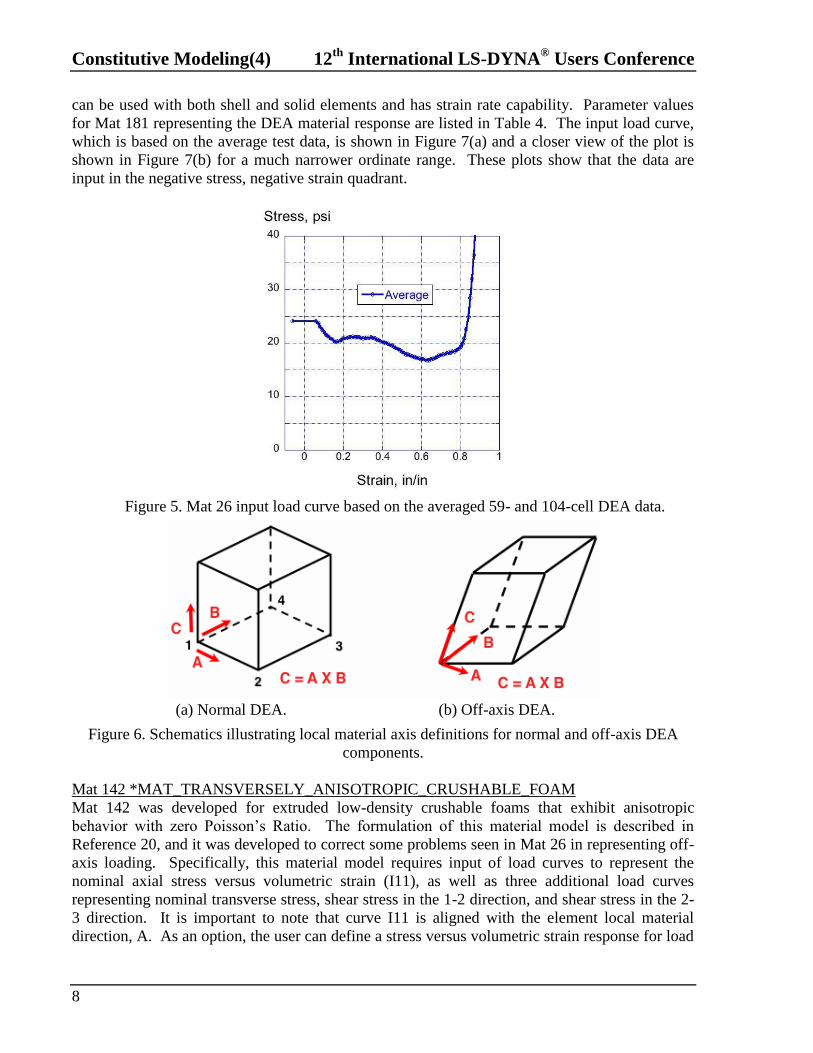
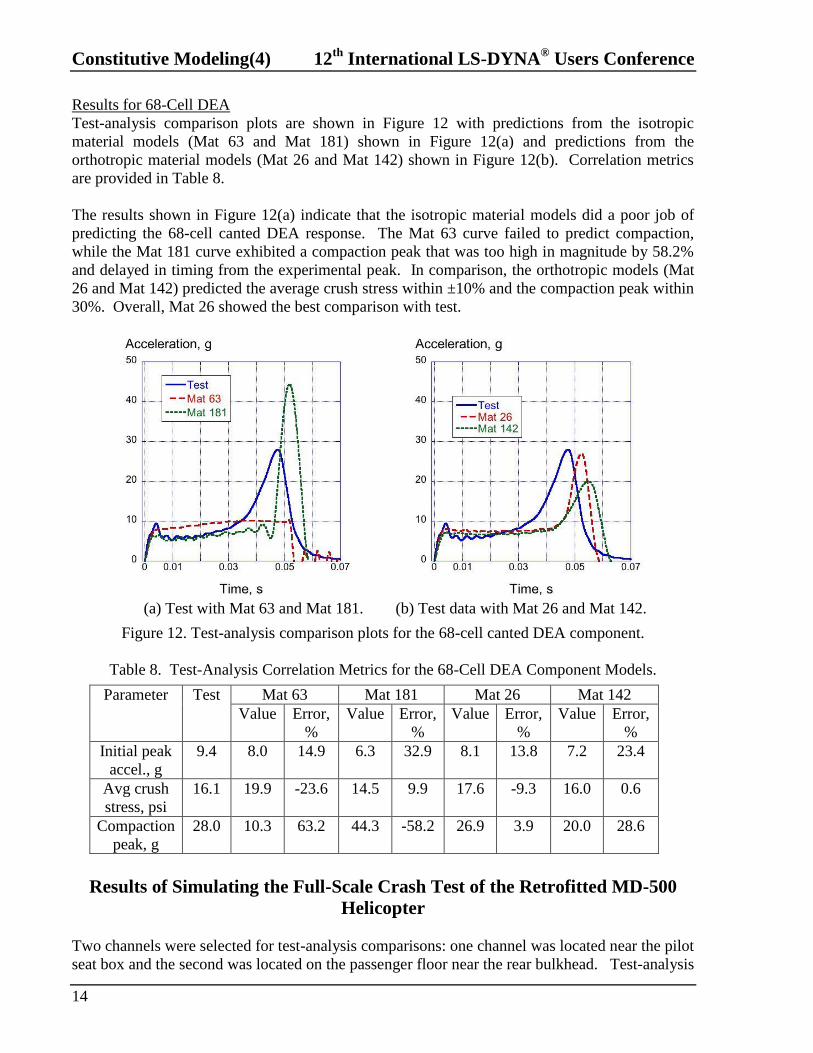
Test-analysis comparison plots are shown in Figure 12 with predictions from the isotropic
material models (Mat 63 and Mat 181) shown in Figure 12(a) and predictions from the
orthotropic material models (Mat 26 and Mat 142) shown in Figure 12(b). Correlation metrics
are provided in Table 8.
The results shown in Figure 12(a) indicate that the isotropic material models did a poor job of
predicting the 68-cell canted DEA response. The Mat 63 curve failed to predict compaction,
while the Mat 181 curve exhibited a compaction peak that was too high in magnitude by 58.2%
and delayed in timing from the experimental peak. In comparison, the orthotropic models (Mat
26 and Mat 142) predicted the average crush stress within ±10% and the compaction peak within
30%. Overall, Mat 26 showed the best comparison with test.
(a) Test with Mat 63 and Mat 181. (b) Test data with Mat 26 and Mat 142.
Figure 12. Test-analysis comparison plots for the 68-cell canted DEA component.
Table 8. Test-Analysis Correlation Metrics for the 68-Cell DEA Component Models.
Parameter
Test Mat 63 Mat 181 Mat 26 Mat 142
Value Error,
%
Value Error,
%
Value Error,
%
Value Error,
%
Initial peak
accel., g
9.4 8.0 14.9 6.3 32.9 8.1 13.8 7.2 23.4
Avg crush
stress, psi
16.1 19.9 -23.6 14.5 9.9 17.6 -9.3 16.0 0.6
Compaction
peak, g
28.0 10.3 63.2 44.3 -58.2 26.9 3.9 20.0 28.6
Results of Simulating the Full-Scale Crash Test of the Retrofitted MD-500
Helicopter
Two channels were selected for test-analysis comparisons: one channel was located near the pilot
seat box and the second was located on the passenger floor near the rear bulkhead. Test-analysis

12th
International LS-DYNA® Users Conference Constitutive Modeling(4)
15
comparisons are shown in Figure 13 for the simulations executed using the two isotropic material
models (Mat 63 and Mat 181). Likewise, test-analysis comparisons are shown in Figure 14 for
the simulations executed with the two orthotropic material models (Mat 26 and Mat 142). For
each material model, the input load curves were based on the average stress-strain response. All
accelerations shown in Figures 13 and 14 are in the local vertical axis direction and were filtered
using a Butterworth 60-Hz digital filter. Predicted and experimental accelerations are generally
low in magnitude, below 20-g, which are well tolerated by human occupants. Also, for most
cases, the test and analysis curves at the pilot seat box location were a better match than for the
passenger floor.
(a) Pilot seat box location. (b) Passenger floor location.
Figure 13. Test-analysis comparison plots for Mat 63 and Mat 181.
(a) Pilot seat box location. (b) Passenger floor location.
Figure 14. Test-analysis comparison plots for Mat 26 and Mat 142.
In addition to visual inspection of the plots, quantitative correlation metrics were evaluated using
the Roadside Safety Verification and Validation Program (RSVVP) [17, 25], which is a software
program that automatically assesses the similarities of two curves as part of the validation
process of a numerical model. The program allows pre-processing of the two curves, including

Constitutive Modeling(4) 12th
International LS-DYNA® Users Conference
16
filtering, phasing, and timing adjustments, etc. Sixteen different metrics are included that are
classified into 3 categories: (1) magnitude-phase-comprehensive (MPC) metrics, (2) single-value
metrics, and (3) analysis of variance (ANOVA) metrics.
For the MD-500 simulations, results are shown for the MPC metric developed by Sprague and
Geers [26, 27], which provides a measure of the “goodness of fit” between two curves. Three
parameters are calculated over a specified time interval: Sprague and Geers Magnitude (SGM),
Sprague and Geers Phase (SGP), and Sprague and Geers Comprehensive (SGC), which is a
combination of magnitude and phase. Generally, a value of less than 40 for SGM, SGP, or SGC
is considered passing the criteria. Regarding the Sprague and Gears approach, it is important to
note that the magnitude and phase metrics are independent of one another. For example, if
changes are made to the magnitude of one curve, but the phase information remains the same,
only the magnitude metric will change, and visa versa. It should also be noted that if two
identical curves are being compared, all three metric values would be zero. Consequently,
metric values close to zero are desired. As documented in References 17 and 27, sinusoidal
pulses were compared using the Sprague and Geers approach within the RSVVP. One curve had
the same phase as the “test” curve, but had a 20% higher magnitude. The resulting SGM value
was 20, SGP was 0, and SGC was 20. Similarly, two sinusoidal curves of the same magnitude
were evaluated in which one curve lagged the other in phase by -20%. The resulting SGM value
was 0.1, SGP was 19.5, and SGC was 19.5. These test cases are highlighted to provide context
for the metric values obtained in the MD-500 test-analysis comparison.
Metric correlations for the MD-500 simulations are provided in Table 9. Pre-processing of the
test and analysis data within the RSVVP included filtering using an SAE CFC 180 filter,
adjusting the time interval such that test and analysis curves matched, and minimizing the
residuals by shifting one curve in time with respect to the other curve. According to the RSVVP,
all models passed the Sprague and Geers criteria.
Table 9. Correlation metrics determined by RSVVP.
Metric Mat 63 Mat 181 Mat 26 Mat 142
Pilot Passenger Pilot Passenger Pilot Passenger Pilot Passenger
SGM 18.8 28.9 19.2 36.5 10.7 20.9 11.5 20.9
SGP 23.6 26.1 18.2 15.0 24.5 20.7 22.6 19.1
SGC 30.1 38.3 26.4 39.5 26.8 29.5 25.4 28.3
Discussion of the Results
As stated previously, a major advantage of using solid elements to represent the DEA was
reduced run time when compared with shell element based simulations. For the DEA multi-cell
components, the execution times for the solid element models described in this paper ranged
from 21- to 40-minutes, regardless of material model. Similar shell-element-based models,
described in Reference 28, required up to 87-minutes, for a common termination time of 0.1-s.
All simulations were executed using LS-DYNA®
SMP version 971 with four processors on a
workstation computer. The MD-500 simulation using solid element representations of the DEA
required 11 hours and 36 minutes to run to completion, whereas a similar model with shell-
element-based representations of the DEA [29] required approximately 192 hours. Even though
the solid element representation of the DEA was not able to predict the deformation modes seen

12th
International LS-DYNA® Users Conference Constitutive Modeling(4)
17
in the tests, this modeling approach provides a quick and efficient method of conducting DEA
design studies.
This paper presents detailed descriptions of four material models that were evaluated in solid
element representations of the DEA. Specific input parameters for each model are provided in
tables. Even though the results are not shown in this paper, multiple studies were performed to
determine the influence of parameter changes on the model response. These studies were
necessary because many of the input values were unknown and estimates had to be input. For
the more complicated material models (Mat 26 and Mat 142), it would be helpful to have
guidelines or sample problems to show how certain parameters are used to control the material
response.
As mentioned previously, each of the four material models selected for evaluation required input
of a stress versus volumetric strain curve to define the material behavior. The average 59- and
104-cell response, depicted in Figure 3, was used in the DEA simulations because this curve had
an average uniform crush stress of 19.8-psi, which is close to the design goal of 20-psi.
However, in some cases, better agreement was achieved when either the 59-cell or the 104-cell
responses were used in place of the average response. For example, the 59-cell DEA component
model was executed in which the 59-cell stress-strain curve was used as input to Mat 26. A
comparison plot of the test data with predicted responses using Mat 26 in which input curves
were based on the 59-cell and average responses is shown in Figure 15. The timing and
magnitude of the compaction peak are best predicted by Mat 26 when the input load curves are
based on the 59-cell stress-strain response.
A full-scale simulation of the MD-500 model was executed with Mat 181 assigned to the DEA in
which the input stress-strain curve was changed to the 104-cell response, shown in Figure 3. The
vertical acceleration results for the pilot seat box and passenger floor locations are shown in
Figure 16. These results show much improved agreement with test data when compared to the
results obtained using the average input curve, as shown in Figure 13. In addition, the RSVVP
program was used and the following metrics were obtained. For the pilot seat box location,
SGM=7, SGP=16.9, and SGC=18.3. For the passenger floor location, SGM=18.9, SGP=13.3,
and SGC=23.1. These metric values are improved when compared to the data shown in Table 9
for Mat 181 using the average input.
Finally, two different approaches were used for quantitative assessment of models. For the DEA
components, simple percentage error calculations were made for three parameters deemed
important in assessing the energy absorption responses of the DEA including initial peak
acceleration, uniform crushing stress, and peak compaction acceleration. These measures, along
with visual inspection of the test-analysis curves, provided a reasonable quantitative approach to
assess the level of agreement between test and simulation. A more complex approach was used
for the MD-500 model assessment using the RSVVP, a verification/validation program, to
compare magnitude, phase, and comprehensive metrics between experimental and analytical
responses for two locations on the airframe. Even though 16 different metrics were available,
the Sprague and Geers [26] approach was used in this paper, based on the recommendations
listed in Reference 25. Unlike the simple percentage error approach used for the DEA
components, the Sprague and Geers method provides an assessment of the contributions of
differences in magnitude and phase to the overall level of agreement.

Constitutive Modeling(4) 12th
International LS-DYNA® Users Conference
18
Figure 15. Test-analysis comparisons for the 59-cell DEA with Mat 26 in which the input load
curves are varied.
(a) Pilot seat box comparison. (b) Passenger floor comparison.
Figure 16. Test-analysis comparisons for the MD-500 model with Mat181 with 104 cell input.
Conclusions
This paper presents an evaluation of four different material models used in solid element
representations of a composite deployable energy absorber (DEA). The models were executed to
represent dynamic crush tests of multi-cell DEA components and a full-scale crash test of an
MD-500 helicopter, retrofitted with two DEA blocks. All simulations were conducted using the
nonlinear explicit transient dynamic code, LS-DYNA®. The four material models were:
*MAT_CRUSHABLE_FOAM (Mat 63), *MAT_HONEYCOMB (Mat 26), *MAT_SIMPLI-
FIED_RUBBER/FOAM (Mat 181), and *MAT_TRANSVERSELY_ANISOTROPIC_CRUSH-

12th
International LS-DYNA® Users Conference Constitutive Modeling(4)
19
ABLE_FOAM (Mat 142). Note that Mat 63 and Mat 181 are isotropic material models and Mat
26 and Mat 142 are transversely anisotropic material models.
Test-analysis correlation metrics were selected to assess the performance of each material model.
For the case of the multi-cell DEA components, simple percentage error comparisons were made
of initial peak acceleration, sustained crush stress, and compaction peak acceleration. For the
59-cell normal DEA component, Mat 181 showed the best comparison with test, predicting the
initial acceleration and the uniform crush stress within 2%, and the compaction peak within 20%.
For the 104-cell normal DEA, all four models were able to predict the initial peak acceleration
within 11%; however, Mat 26 best predicted the uniform crushing response within 6%. The 104-
cell DEA component did not achieve a compaction response, so no results were shown for that
parameter. For the 68-cell off-axis DEA component, the two transversely anisotropic material
models (Mat 26 and Mat 142) did the best job of predicting the test response.
For the full-scale crash of the MD-500 helicopter, test-analysis comparisons are shown at two
locations: the pilot seat box and the passenger floor near the rear bulkhead. Magnitude-Phase-
Comprehensive (MPC) correlation metrics developed by Sprague and Geers were assessed using
the Roadside Safety Verification and Validation Program (RSVVP). All of the material models
passed the correlation metrics with MPC values less than 40. Mat 26 had the lowest value of the
magnitude metric (10.7), whereas Mat 181 had the lowest value of the phase metric (15.0), and
Mat 142 had the lowest comprehensive value (25.4).
A major advantage of using solid elements to represent the DEA was reduced run time when
compared with shell element based simulations. For the DEA component models, solid element
models executed in 40-minutes or less, regardless of material model; whereas similar shell-
element-based models required up to 87-minutes. These simulations were executed using LS-
DYNA® Shared Memory Processor (SMP) version 971 with four processors on a Linux
workstation computer. For the MD-500 finite element model using solid element representations
of the DEA required approximately 12 hours, whereas a similar model with shell-element-based
models of the DEA required 192 hours. Even though the solid element representation of the
DEA was not able to predict the deformation modes seen in the tests, this modeling approach
provides a quick and efficient method of conducting DEA design studies.
References
1. Jackson K.E., Fuchs Y.T., and Kellas S., “Overview of the NASA Subsonic Rotary Wing Aeronautics Research
Program in Rotorcraft Crashworthiness,” Journal of Aerospace Engineering, Special Issue on Ballistic Impact and
Crashworthiness of Aerospace Structures, Volume 22, No. 3, July 2009, pp. 229-239.
2. Kellas S., “Deployable Rigid System for Crash Energy Management,” US Patent Nos. 6,755,453 on June 29,
2004; 6,976,729 on December 20, 2005; and 7,040,658 on May 9, 2006.
3. Kellas S. and Jackson K.E., “Deployable System for Crash-Load Attenuation,” Journal of the American
Helicopter Society, Vol. 55, No. 4, October 2010, pp. 042001-1 through 042001-14.
4. Kellas S. and Jackson K.E., “Multi-Terrain Vertical Drop Tests of a Composite Fuselage Section,” Journal of the
American Helicopter Society, Vol. 55, No. 4, October 2010, pp. 042002-1 through 042002-042002-7.

Constitutive Modeling(4) 12th
International LS-DYNA® Users Conference
20
5. Jackson K.E., Kellas S., Horta L.G., Annett M.S., Polanco M.A., Littell J.D., and Fasanella E.L., “Experimental
and Analytical Evaluation of a Composite Honeycomb Deployable Energy Absorber,” NASA Technical
Memorandum, NASA-TM-2011-217301, November 2011.
6. Kellas S., Jackson K.E., and Littell J.D., “Full Scale Crash Test of a MD-500 Helicopter with Deployable Energy
Absorbers,” Proceedings of the 66th
AHS Forum, Phoenix, AZ, May 11-13, 2010.
7. Littell J.D., Jackson K.E., and Kellas S., “Crash Test of an MD-500 Helicopter with a Deployable Energy
Absorber Concept,” Proceedings of the International Crashworthiness Conference, Leesburg, VA, September 22-24,
2010.
8. Littell J.D., “A Comparative Analysis of Two Full-Scale MD-500 Helicopter Crash Tests,” Proceedings of the
SEM 2011 Annual Conference, Uncasville, Connecticut, June 13 - 16, 2011.
9. Hallquist J.Q., “LS-DYNA Keyword User’s Manual,” Volumes I & II, Version 971, Livermore Software
Technology Company, Livermore, CA, August, 2006.
10. Horta L.G., Jackson K.E., and Kellas S., “A Computational Approach for Model Update of an LS-DYNA
Energy Absorbing Cell,” Journal of the American Helicopter Society, Vol. 55, No. 3, July 2010, pp. 032011-1 –
032011-8.
11. Polanco M.A., Kellas S., and Jackson K.E., “Evaluation of Material Models within LS-DYNA for a
Kevlar®/Epoxy Composite Honeycomb,” Proceedings of the 65
th AHS Forum, Grapevine, TX, May 27-29, 2009.
12. Polanco M.A., “Use of LS-DYNA to Assess Impact Response of a Shell-Based Kevlar/Epoxy Composite
Honeycomb,” Proceedings of the 11th
LS-DYNA Users Conference, Dearborn, MI, June 6-8, 2010.
13. Jackson K.E., Kellas S., Annett M.S., Littell J., and Polanco M.A., “Evaluation of an Externally Deployable
Energy Absorber for Crash Applications,” Proceedings of the International Crashworthiness Conference, Leesburg,
VA, September 22-24, 2010.
14. Fasanella E.L., Lyle K.H., and Jackson K.E., “Developing Soil Models for Dynamic Impact Simulations,”
Proceedings of the 65th
AHS Forum, Grapevine, TX, May 27-29, 2009.
15. Jackson K. E. and Fuchs Y. T., “Comparison of ALE and SPH Simulations of Vertical Drop Tests of a
Composite Fuselage Section into Water,” Proceedings of the 10th
International LS-DYNA Users Conference,
Dearborn, MI, June 8-10, 2008.
16. Jackson K.E., “Predicting the Dynamic Crushing Response of a Composite Honeycomb Energy Absorber using
a Solid-Element-Based Finite Element Model,” Proceedings of the 11th
International LS-DYNA Users Conference,
Dearborn, MI, June 6-8, 2010.
17. Mongiardini M., Ray M.H., Anghileri M., “Development of a Software for the Comparison of Curves During the
Verification and Validation of Numerical Models,” Proceedings of the 7th
European LS-DYNA Conference,
Salzburg, Austria, May 14-15, 2009.
18. Society of Automotive Engineers, “Recommended Practice: Instrumentation for Impact Test - Part 1, Electronic
Instrumentation,” SAE J211/1, March 1995.
19. Roberts J., Merkle A., Biermann P., Ward E., Carkhuff B., Cain R., and O’Connor J., “Computational and
Experimental Models of the Human Torso for Non-Penetrating Ballistic Impact,” J. Biomech., 40 (1), 2007, pp.
125-136.
20. Hirth A., Du Bois P., Weimar K., “A Material Model for Transversely Anisotropic Crushable Foams in LS-
DYNA,” Proceedings of the 7th
International LS-DYNA Users Conference, Dearborn, MI, May 19-21, 2002.
21. Anon, Structural Repair Manual, CSP–SRM–6, MD Helicopters, Inc, Mesa, AZ, May 2006.

12th
International LS-DYNA® Users Conference Constitutive Modeling(4)
21
22. Annett M. S., and Polanco M.A., “System-Integrated Finite Element Analysis of a Full-Scale Helicopter Crash
Test with Deployable Energy Absorbers,” Proceedings of the 66th
AHS Forum, Phoenix, AZ, May 11-13, 2010.
23. Annett M. S., “LS-DYNA Analysis of a Full-Scale Helicopter Crash Test,” Proceedings of the 11th
International
LS-DYNA Users Conference, Dearborn, MI, June 6-8, 2010.
24. Annett M.S. and Horta L. G., "Comparison of Test and Finite Element Analysis for Two Full-Scale Helicopter
Crash Tests." 52nd AIAA/ASME/ASCE/AHS/ASC Structures, Structural Dynamics and Materials Conference, 4 - 7
April 2011, Denver, Colorado.
25. Marzougui D., Kan C-D., and Opiela K. S., “Comparison of the Crash Test and Simulation of an Angle Impact
of a 2007 Chevrolet Silverado Pick-Up Truck into a New Jersey-Shaped Concrete Barrier for MASH Conditions,”
National Crash Analysis Center NACA 2010-W-001 Working Paper, July 2012.
26. Sprague M.A., and Geers T. L., “Spectral Elements and Field Separation for an Acoustic Fluid Subject to
Cavitation,” Journal of Computational Physics, Vol. 184, 2003, pp: 149-162.
27. Schwer L.E., “Validation Metrics for Response Histories: Perspectives and Case Studies.” Engineering with
Computers,” Engineering with Computers (2007), 23:295-309.
28. Jackson K.E., Fasanella E. L., and Polanco M. A., “Simulating the Response of a Composite Honeycomb Energy
Absorber: Part 1. Dynamic Crushing of DEA Components and Multi-Terrain Impacts,” Proceedings of the 2012
ASCE Earth and Space Conference, Special Symposium on Ballistic Impact and Crashworthiness, to be held in
Pasadena, CA on April 15-18, 2012.
29. Fasanella, E. L., Annett, M.S. and Polanco M. A., “Simulating the Response of a Composite Honeycomb Energy
Absorber: Part 2. Full-Scale Impact Testing,” Proceedings of the 2012 ASCE Earth and Space Conference, Special
Symposium on Ballistic Impact and Crashworthiness, to be held in Pasadena, CA on April 15-18, 2012.

Constitutive Modeling(4) 12th
International LS-DYNA® Users Conference
22