Master thesis Karilys Castillo Dec2014 - TDL
124
STRATIGRAPHY, STRUCTURE, AND PETROLEUM POTENTIAL OF THE EASTERNMOST PART OF THE EASTERN VENEZUELAN BASIN A Thesis Presented to the Faculty of the Department of Earth and Atmospheric Sciences University of Houston In Partial Fulfillment of the Requirements for the Degree Master of Science By Karilys Castillo Flores December 2014
Transcript of Master thesis Karilys Castillo Dec2014 - TDL

STRATIGRAPHY, STRUCTURE, AND PETROLEUM POTENTIAL OF THE
EASTERNMOST PART OF THE EASTERN VENEZUELAN BASIN
A Thesis Presented to the
Faculty of the Department of Earth and Atmospheric Sciences
University of Houston
In Partial Fulfillment
of the Requirements for the Degree
Master of Science
By
Karilys Castillo Flores
December 2014

ii
STRATIGRAPHY, STRUCTURE, AND PETROLEUM POTENTIAL OF THE
EASTERNMOST PART OF THE EASTERN VENEZUELAN BASIN
Karilys Castillo Flores
APPROVED:
Dr. Paul Mann
Dr. Julia Wellner
Peter Bartok
Dean, College of Natural Sciences and Mathematics

iii
A mi madre, por su ejemplo, por ser el pilar que me dio apoyo y fuerza, el pañuelo que secó mis lágrimas, la caricia que me dio amor, la mano que me levantó durante mis caídas, en fin, mi inspiración, para ti LA MEJOR MADRE DEL MUNDO

iv
ACKNOWLEDGEMENTS
My special thanks go to Dr. Paul Mann for providing me the opportunity to work on a
master’s thesis at the University of Houston and for his guidance and support over the last
two years. I thank Peter Bartok for his comments, encouragement and many suggestions
for this study and to Dr. Julia Wellner for being part of my committee and for her many
useful recommendations. I am grateful to my previous employer for a period of seven
years, Petróleos de Venezuela, S.A. (PDVSA), where I was able to work on many
interesting data sets and to refine my technical skills as a geoscientist. I also thank
PDVSA for providing me their data to use in this study and the industry sponsors of the
CBTH project at the University of Houston for their continued financial support that
supported me as a research assistant for the past two years.
Thanks to my angel - who is not here physically - but I know is always with me.
Thanks, Mom, for your life example - I love you. Thanks to my brothers and sister, my
nieces and nephews, and my father. Thanks to my aunts and uncles for their
encouragement, especially to Carmen de Berttiz for being such a great role model. Special
thanks to Vitcar for being my cousin, my friend, my sister, and, ultimately, for being my
second mom and my Marri. You - my extended family - is the reason I keep moving
forward.
Thanks to my friends who believed on me when I did not: Javier Miranda, Pedro
Alvarez, Yamal Askoul, Carlos Brett and Franklyn Angel. All of you encouraged me to
pursue my master’s thesis and gave me the support I needed to complete it.
I am grateful to my fellow CBTH students and support staff at the University of
Houston for their support and for sharing their knowledge, victories and defeats - thanks,
guys. Special thanks to Orietta Mata for being an eyewitness and officemate to my tears,

v
joys, obstacles and triumphs. She has seen my worst qualities and yet still remains my
friend thanks, Orietta.
Last, but not least, I thank almighty God and the Virgin for giving me all that I am, my
strengths and weaknesses, for helping me the strength to overcome each new difficulty
placed in my path, and for providing me the opportunity to study, improve myself, complete
my MS degree, be a summer intern, and begin my professional career in this country.

vi
STRATIGRAPHY, STRUCTURE, AND PETROLEUM POTENTIAL OF THE
EASTERNMOST PART OF THE EASTERN VENEZUELAN BASIN
An Abstract of a Thesis
Presented to the
Faculty of the Department of Earth and Atmospheric Sciences
University of Houston
In Partial Fulfillment
Of the Requirements for the Degree
Master of Science
By
Karilys Castillo Flores
December 2014

vii
ABSTRACT
The Eastern Venezuelan foreland basin (EVB) has been filling from the southwest
by the Orinoco River since Late Miocene-Early Pliocene. The easternmost part of the
basin (EEVB) has been overfilled since the Pliocene and has spilled over to form the 12-
km- thick Orinoco delta system (ODS) on the Atlantic margin of northeastern Venezuela.
EVB is the second largest, hydrocarbon-producing basin in Venezuela with proven
reserves of 36 billion barrels. The Orinoco Heavy Oil belt, one of the largest accumulations
of hydrocarbons in the world, is located on the southern flank of the EVB and the ODS,
the third largest delta in the world, is on its eastern flank. To improve our understanding
of the paleogeography and hydrocarbon potential of the EEVB and the adjacent ODS, I
interpret 620 km2 of 3D seismic, 650 km of 2D seismic, and 6 wells with well logs from the
EEVB near the Columbus Channel and maritime border with Trinidad and combine this
with the results of previous workers to the south in the area of the ODS. The following
sequence of Cenozoic events affecting the study area are proposed: 1) passive margin
setting since the Cretaceous to Paleogene, 2) Caribbean plate oblique collision causing a
foreland stage in the EEVB since Late Oligocene, 3) during the Oligocene and Early
Miocene, south-north-flowing fluvial systems and associated deltas prograded northward
from the Guyana shield into the EVB; 4) the Late Miocene Messinian event lowered
eustatic sea level along the passive margin and produced a major erosional event and
submarine canyons that allowed the ODS to suddenly prograde eastward from the EEVB
into the deeper water Atlantic area in the earliest Pliocene; and 5) Early Pliocene to recent
progradation of the ODS into the Atlantic Ocean. The onset of major input of the Orinoco
River in this area is considered by most workers to be Late Miocene in age, which is
supported by my proposed change in the flow direction, from a south to north direction in
the pre-Late Miocene-Early Pliocene section to a southwest to northeast direction in the

viii
Pliocene to recent sequence. Through the Cenozoic time, superposition of Mio-Pliocene
fluvial systems over deltaic and deep water facies documents the eastward progradation
of the ODS and its filling of the easternmost EVB.

ix
TABLE OF CONTENTS
ACKNOWLEDGEMENTS ............................................................................................... IV
ABSTRACT ................................................................................................................... VII
TABLE OF CONTENTS ................................................................................................. IX
LIST OF FIGURES ......................................................................................................... XI
LIST OF TABLES ......................................................................................................... XVI
CHAPTER 1: INTRODUCTION ........................................................................................ 1
1.1. INTRODUCTION TO THE THESIS ...................................................................... 1
1.2. PERSONAL MOTIVATION FOR THIS THESIS ................................................... 2
CHAPTER 2: STRATIGRAPHY, STRUCTURE, AND PETROLEUM POTENTIAL OF
THE EASTERNMOST PART OF THE EASTERN VENEZUELAN BASIN ...................... 4
2.1. INTRODUCTION ................................................................................................. 4
2.1.1. Tectonic setting and objectives of the study ........................................... 4
2.1.2. Petroleum geology of Venezuela and the EEVB .................................. 10
2.1.3. Tectonic and geologic setting of easternmost Eastern Venezuelan Basin
(EEVB) .............................................................................................................. 14
2.1.4. Previous work, data and methods ........................................................ 18
2.1.4.1. Previous works ....................................................................... 18
2.1.4.2. Data and methods .................................................................. 20
2.2. DESCRIPTION OF THE FORELAND BASIN SETTING OF THE EEVB ............ 22
2.2.1. Regional geology of the Eastern Venezuelan foreland basin system ... 26
2.2.2. Description of regional seismic lines from the EEVB ............................ 27
2.3. DESCRIPTION OF THE PASSIVE-MARGIN SECTION UNDERLYING THE
ORINOCO DELTA SYSTEM ........................................................................................... 31
2.3.1. Regional geology of the Orinoco Delta system and underlying passive
margin section .......................................................................................................... 31

x
2.3.2. Description of seismic lines from the Orinoco Delta System ................ 37
2.4. STRATIGRAPHIC AND STRUCTURAL FEATURES OF THE EEVB ................ 46
2.4.1. Deltaic features of Middle and Late Miocene age ................................. 49
2.4.2. Submarine canyons of Late Miocene – Early Pliocene age ................. 52
2.4.3. Gravity faulting of the EEVB ................................................................. 56
2.5. TECTONOSTRATIGRAPHIC STAGES BASED ON STRUCTURAL AND
ISOCHRON MAPS OF THE EEVB AND SURROUNDING AREAS ................................ 59
2.5.1.STAGE ONE: CRETACEOUS TO EARLY PALEOGENE PASSIVE MARGIN
STAGE AND UNDERFILLED PALEOGENE FORELAND STAGE OF THE ................................ 60
2.5.2.STAGE TWO: MIOCENE UNDERFILLED TO FILLED FORELAND STAGE OF THE
EEVB .............................................................................................................. 64
2.5.3.STAGE THREE: PLIO-PLEISTOCENE OVERFILLED-FORELAND-BASIN STAGE
OF THE EEVB ............................................................................................................ 68
2.6. DISCUSSION ..................................................................................................... 72
2.6.1. Paleogeography of the EEVB study area ............................................. 72
2.6.1.1. Eocene paleogeography ........................................................ 73
2.6.1.2. Late-Oligocene paleogeography ............................................ 76
2.6.1.3. Middle-Miocene paleogeography ........................................... 77
2.6.1.4. Early Pliocene paleogeography ............................................. 79
2.6.1.5. Plio-Pleistocene paleogeography .......................................... 80
2.6.2. Foreland Sequences and proposed forebulges of the EEVB ............... 81
2.6.3. Petroleum system elements and basin modelling ................................ 87
2.6.4. Proposed Petroleum Plays of the EEVB based on new information
presented in this thesis ............................................................................................ 92
2.7. CONCLUSIONS ................................................................................................. 96
2.8. REFERENCES .................................................................................................. 98

xi
LIST OF FIGURES
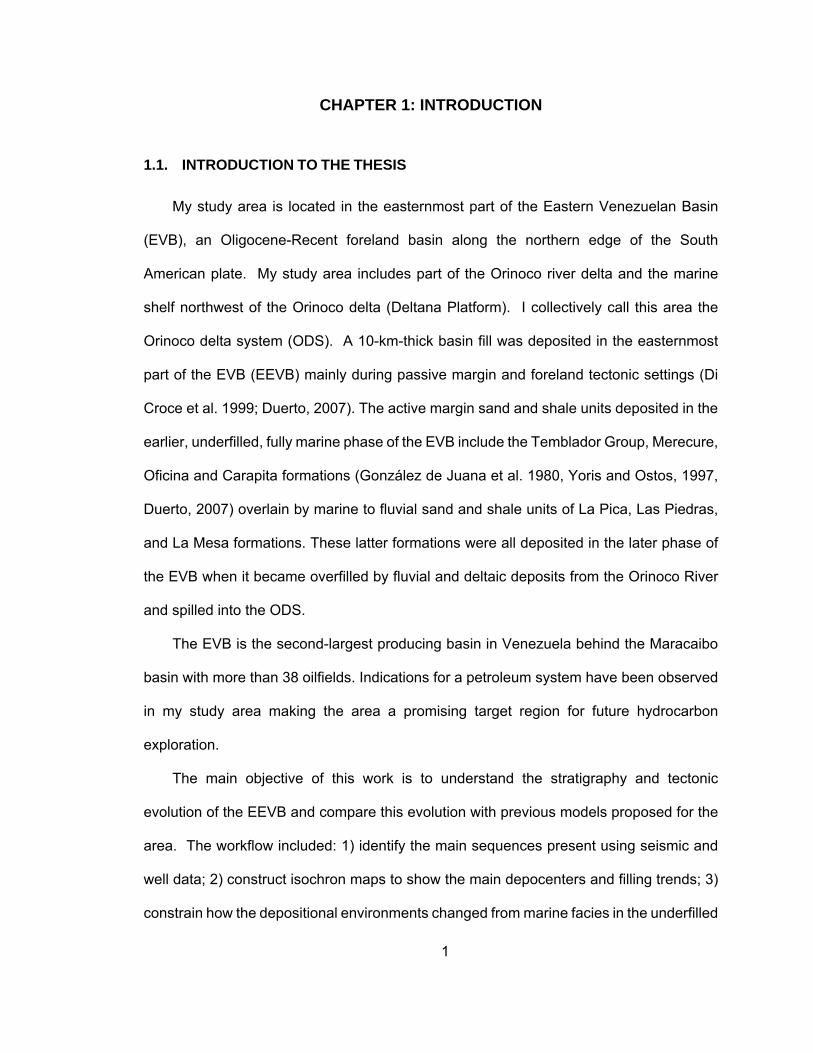
Figure 1. Changing locations of the leading edge of the Caribbean plate from the late Cretaceous to recent modified from Escalona and Mann (2011). Ages for different positions of the leading edge of the Caribbean plate: 1 = Late Cretaceous, 2 = Middle Paleocene, 3 = Middle Eocene, 4 = Middle Oligocene, 5 = Middle Miocene, 6 = Pliocene and 7 = Recent. Dotted blue lines show the inferred changing locations for the Proto-Orinoco River modified from Escalona and Mann (2011). Yellow areas represent the locations of foreland basins location formed by the oblique collision of the Caribbean plate. White box indicates the covered area in Figure 2. ............................................................ 5
Figure 2. Tectonic map and location of the main oil and gas fields and oil and gas seeps along the northern margin of South America and the main onland foreland basins sins in Venezuela (Maracaibo, Eastern Venezuelan and Barinas-Apure basin, and Columbus basin (Offshore Trinidad). The Orinoco heavy oil belt, outlined in blue. The white box indicates the area shown in Figure 3. ............................................................... 6
Figure 3. Geological map of the EVB foreland basin, part of Guayana shield and Trinidad from geological map compilated by Hackley et al. (2005). B. Bouguer gravity anomaly of the EEVB showing one of the lowest values around the world (Sánchez-Rojas 2012, and Jácome et al. 2003), which coincides with the main depocenter of the EEVB foreland basin. ............................................................................................................. 8
Figure 4. Stratigraphic column for the EVB (modified from Duerto 2011 and González de Juana, 1980) and correlative units in Trinidad (modified from Algar, 1998). The main source rock in the EVB is the late Cretaceous Querecual Formation and its equivalent unit in Trinidad, Naparima Hill Formation. The main reservoir rocks are Oligocene, Miocene and Pliocene rocks in age. They include Oficina and Freites formations in Maturin Sub-basin, and La Pica Formation in Pedernales oilfied (which is the closest active Venezuelan oilfield to my study area) and the Cruse, Gross Morne and Mayaro formations in Trinidad. ........................................................................................ 11
Figure 5. A. Subsurface data set used by previous authors in my study area (red box): Prieto (1987) in purple color, Di Croce et al. (1999) in yellow color, Duerto (2007) in green color, Moscardelli (2007) in pink color, Taboada (2009) in blue color and Figueira (2012) in orange color. B. Data set used for this study in the area marked by the red box. 2D seismic surveys in blue color, 3D seismic is in yellow box, and wells are shown as red dots. ........................................................................................................... 19
Figure 6. Logs for Well 1 tied to the 3D seismic data used in my study. To the left are the formations penetrated by the well to a depth of 15,150 ft (4.7 Km). Well log set includes Tracks 1 and 2 show the Gamma Ray log (0-120 API and 120 – 0 API respectively), yellow color is sand and brown is shale. Track 3 shows deep resistivity in red color and shallow resistivity in blue color (0.1 – 100 ohm.m, logarithmic display). Track 4 is the density curve (1.9 to 2.9 gr/cc). Track 5 is the sonic curve (150 – 500 sec-1). Tracks 6 and 8 are surface seismic data (variable density color display, red color corresponds to positive impedance and blue colors to negative impedance). Track 7 is well synthetic, estimated from the convolution of the density and sonic logs with a zero

xii
phase Richter wave. Red dots correspond to the gas shows in the well. Black arrows show succession patterns (upward increasing or upward decreasing). .......................... 23
Figure 7. A. Schematic profile of a foreland basin system (DeCelles and Horton, 2003). The asymmetrical foreland basin includes a fold-thrust belt, a foredeep (main depocenter), a forebulge (flexural high) and a backbulge. B. Three diagrammatic and merged sections showing the geometry and the associated wedge relate to the foreland system in the eastern part of the EVB. The pink section represents the crystalline basement (Guayana Shield), the green units are Cretaceous rocks, the orange unit is the Paleogene section, and the yellow and light yellow units are Neogene and Quaternary sequences. From left to right: 1) Profile A-A’ is modified from Rodríguez (1999) and shows the Cretaceous-recent sequence onlapping against the backbulge. The largest accumulation of oil in Venezuela - the Orinoco Heavy Oil Belt – is found in this section as the result of updip migration from the Cretaceous source rock, the Querecual Formation. 2) Profile B-B’ is from an interpreted seismic section showing the thickest part of the northward-dipping foredeep. C. Profile C-C’ shows the continuation of the foredeep, the wedge top, and inverted structures. ................................................................................ 24
Figure 8. A. Uninterpreted southwest to northeast seismic line from 0 to 6500 ms in TWT that spans the 3D seismic volume (variable density color display with red color corresponding to negative impedance and black colors to positive impedance). Well 1 is shows the seismic well time, the lithology (yellow color is sand and brown color is shale) and the intervals with gas shows (red dots). B. Interpretation for seismic line shown in Figure 8A. Green section is Cretaceous, orange color is Paleogene, yellow color is Miocene section, and light yellow color is Plio-Pleistocene. Black lines in the Cretaceous section are normal faults related to flexure; black lines in the Miocene and Paleogene sections are growth faults. .............................................................................................. 29
Figure 9. A. Uninterpreted southwest to northeast, seismic line from 0 to 6500 ms in TWT across the Deltana Platform (variable density color display with red color corresponding to negative impedance and black colors to positive impedance). B. Interpretation for seismic line shown in Figure 9A. Pink section is crystalline basement (Guayana Shield), green unit is Cretaceous, orange is Paleogene unit; yellow color is Miocene section, and light yellow color is Plio-Pleistocene. Black lines in the Cretaceous section are interpreted as normal faults related to flexure. ............................................. 32
Figure 10. A. Interpreted southwest to northeast profile in time (TWT in ms) south of the study area including from left to right: A-A’ seismic profile W-E from this study and B-B’ Di Croce et al. (1996) interpretation. Green section represents Cretaceous, orange is Paleogene, yellow is Miocene and light yellow is Plio-Pleistocene. Black lines in the Cretaceous section are interpreted as normal faults due to flexure, whereas black lines in the Miocene and Paleogene section are growth faults. B. Interpreted profile in time (TWT in ms) of the study area including from left to right: C-C’ seismic profile W-E from this study and D-D’ Di Croce’s (1996) interpretation. ...................................................................... 34
Figure 11. A. Uninterpreted west to east seismic line in TWT from 0 to 5000 ms crossing the Deltana Platform (variable density color display: red color corresponds to negative impedance and black colors to positive impedance). B. Interpretation of lines in Figure 11A. Green Cretaceous, orange is Paleogene, yellow is Miocene, and light yellow is Plio-Pleistocene. Black lines in the Cretaceous section are normal faults due to the
xiii
flexure, whereas the black lines in the Miocene and Paleogene section are growth faults. Brown, concave-up features are submarine canyons. .................................................... 38
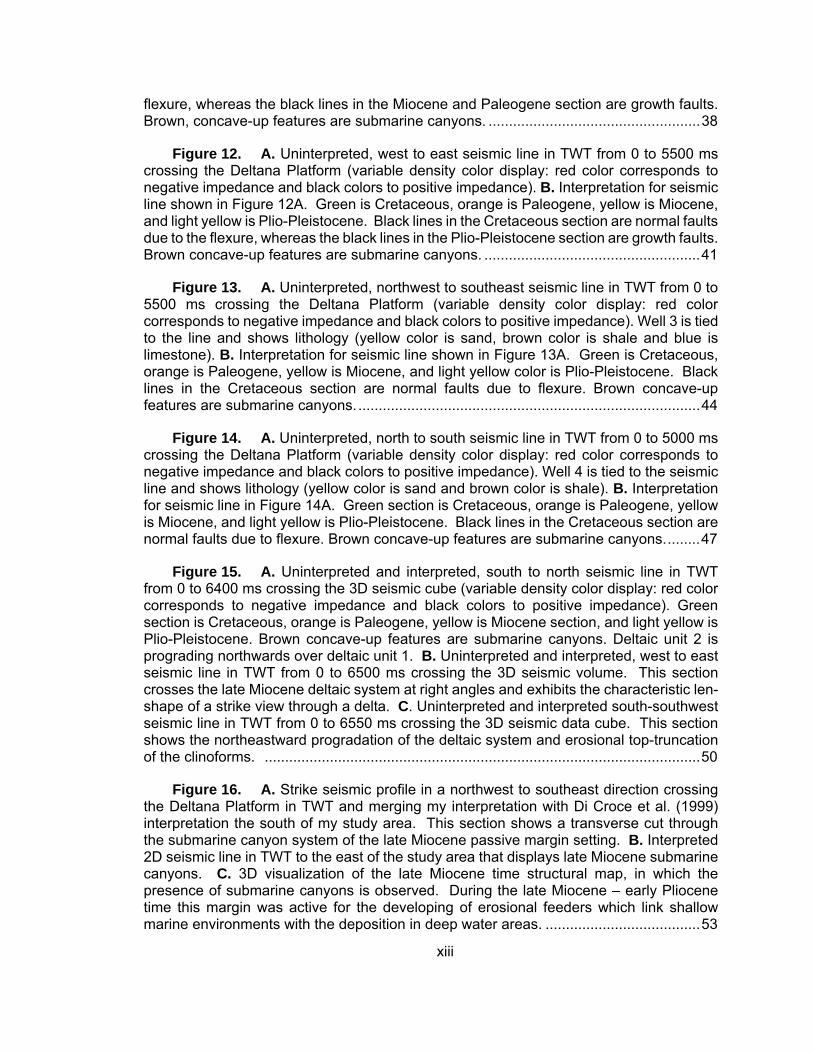
Figure 12. A. Uninterpreted, west to east seismic line in TWT from 0 to 5500 ms crossing the Deltana Platform (variable density color display: red color corresponds to negative impedance and black colors to positive impedance). B. Interpretation for seismic line shown in Figure 12A. Green is Cretaceous, orange is Paleogene, yellow is Miocene, and light yellow is Plio-Pleistocene. Black lines in the Cretaceous section are normal faults due to the flexure, whereas the black lines in the Plio-Pleistocene section are growth faults. Brown concave-up features are submarine canyons. ..................................................... 41
Figure 13. A. Uninterpreted, northwest to southeast seismic line in TWT from 0 to 5500 ms crossing the Deltana Platform (variable density color display: red color corresponds to negative impedance and black colors to positive impedance). Well 3 is tied to the line and shows lithology (yellow color is sand, brown color is shale and blue is limestone). B. Interpretation for seismic line shown in Figure 13A. Green is Cretaceous, orange is Paleogene, yellow is Miocene, and light yellow color is Plio-Pleistocene. Black lines in the Cretaceous section are normal faults due to flexure. Brown concave-up features are submarine canyons. .................................................................................... 44
Figure 14. A. Uninterpreted, north to south seismic line in TWT from 0 to 5000 ms crossing the Deltana Platform (variable density color display: red color corresponds to negative impedance and black colors to positive impedance). Well 4 is tied to the seismic line and shows lithology (yellow color is sand and brown color is shale). B. Interpretation for seismic line in Figure 14A. Green section is Cretaceous, orange is Paleogene, yellow is Miocene, and light yellow is Plio-Pleistocene. Black lines in the Cretaceous section are normal faults due to flexure. Brown concave-up features are submarine canyons. ........ 47
Figure 15. A. Uninterpreted and interpreted, south to north seismic line in TWT from 0 to 6400 ms crossing the 3D seismic cube (variable density color display: red color corresponds to negative impedance and black colors to positive impedance). Green section is Cretaceous, orange is Paleogene, yellow is Miocene section, and light yellow is Plio-Pleistocene. Brown concave-up features are submarine canyons. Deltaic unit 2 is prograding northwards over deltaic unit 1. B. Uninterpreted and interpreted, west to east seismic line in TWT from 0 to 6500 ms crossing the 3D seismic volume. This section crosses the late Miocene deltaic system at right angles and exhibits the characteristic len-shape of a strike view through a delta. C. Uninterpreted and interpreted south-southwest seismic line in TWT from 0 to 6550 ms crossing the 3D seismic data cube. This section shows the northeastward progradation of the deltaic system and erosional top-truncation of the clinoforms. ........................................................................................................... 50
Figure 16. A. Strike seismic profile in a northwest to southeast direction crossing the Deltana Platform in TWT and merging my interpretation with Di Croce et al. (1999) interpretation the south of my study area. This section shows a transverse cut through the submarine canyon system of the late Miocene passive margin setting. B. Interpreted 2D seismic line in TWT to the east of the study area that displays late Miocene submarine canyons. C. 3D visualization of the late Miocene time structural map, in which the presence of submarine canyons is observed. During the late Miocene – early Pliocene time this margin was active for the developing of erosional feeders which link shallow marine environments with the deposition in deep water areas. ...................................... 53
xiv
Figure 17. A. Uninterpreted and interpreted, west to east seismic line in TWT crossing the Deltana Platform (variable density color display: red color corresponds to negative impedance and black colors to positive impedance), showing the presence of growth faults within the Plio – Pleistocene section. B. Uninterpreted and interpreted seismic line SW – NE in TWT crossing the 3D seismic cube showing Miocene growth faulting. C. 3D visualization in time of the Miocene growth faults from the seismic cube, and their detachment surface corresponding to the carbonate rocks of the top Cretaceous. ........................................................................................................... 57
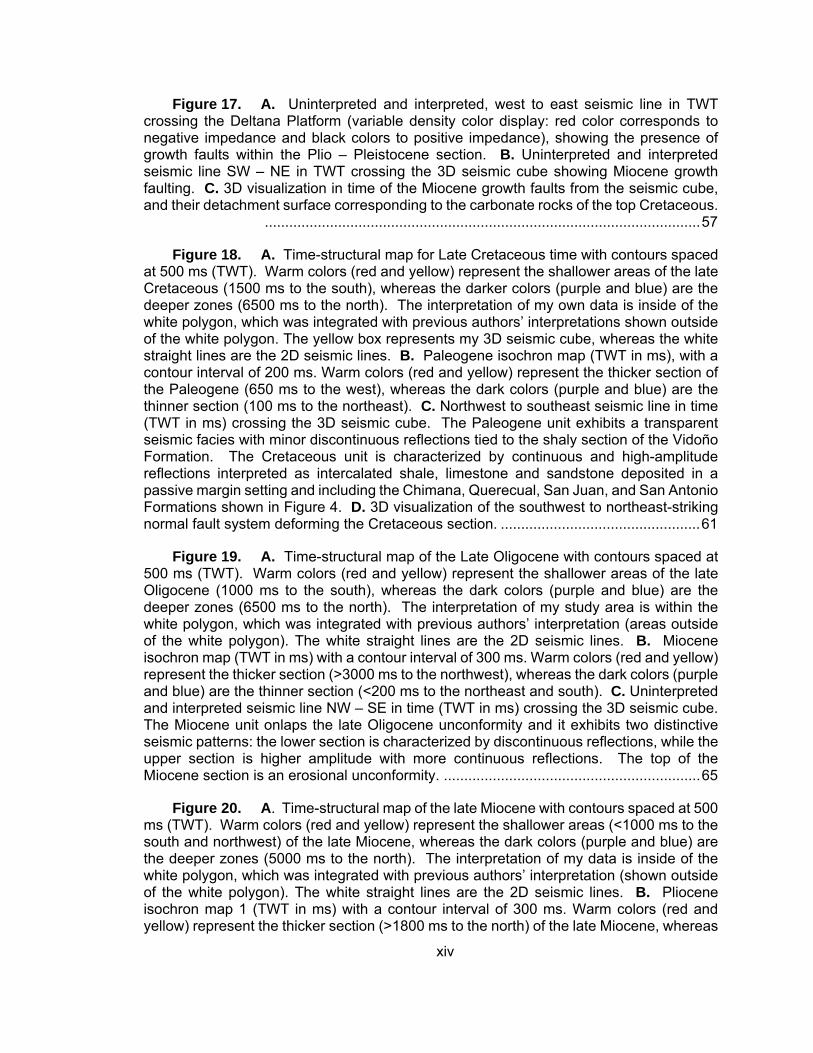
Figure 18. A. Time-structural map for Late Cretaceous time with contours spaced at 500 ms (TWT). Warm colors (red and yellow) represent the shallower areas of the late Cretaceous (1500 ms to the south), whereas the darker colors (purple and blue) are the deeper zones (6500 ms to the north). The interpretation of my own data is inside of the white polygon, which was integrated with previous authors’ interpretations shown outside of the white polygon. The yellow box represents my 3D seismic cube, whereas the white straight lines are the 2D seismic lines. B. Paleogene isochron map (TWT in ms), with a contour interval of 200 ms. Warm colors (red and yellow) represent the thicker section of the Paleogene (650 ms to the west), whereas the dark colors (purple and blue) are the thinner section (100 ms to the northeast). C. Northwest to southeast seismic line in time (TWT in ms) crossing the 3D seismic cube. The Paleogene unit exhibits a transparent seismic facies with minor discontinuous reflections tied to the shaly section of the Vidoño Formation. The Cretaceous unit is characterized by continuous and high-amplitude reflections interpreted as intercalated shale, limestone and sandstone deposited in a passive margin setting and including the Chimana, Querecual, San Juan, and San Antonio Formations shown in Figure 4. D. 3D visualization of the southwest to northeast-striking normal fault system deforming the Cretaceous section. ................................................. 61
Figure 19. A. Time-structural map of the Late Oligocene with contours spaced at 500 ms (TWT). Warm colors (red and yellow) represent the shallower areas of the late Oligocene (1000 ms to the south), whereas the dark colors (purple and blue) are the deeper zones (6500 ms to the north). The interpretation of my study area is within the white polygon, which was integrated with previous authors’ interpretation (areas outside of the white polygon). The white straight lines are the 2D seismic lines. B. Miocene isochron map (TWT in ms) with a contour interval of 300 ms. Warm colors (red and yellow) represent the thicker section (>3000 ms to the northwest), whereas the dark colors (purple and blue) are the thinner section (<200 ms to the northeast and south). C. Uninterpreted and interpreted seismic line NW – SE in time (TWT in ms) crossing the 3D seismic cube. The Miocene unit onlaps the late Oligocene unconformity and it exhibits two distinctive seismic patterns: the lower section is characterized by discontinuous reflections, while the upper section is higher amplitude with more continuous reflections. The top of the Miocene section is an erosional unconformity. ............................................................... 65
Figure 20. A. Time-structural map of the late Miocene with contours spaced at 500 ms (TWT). Warm colors (red and yellow) represent the shallower areas (<1000 ms to the south and northwest) of the late Miocene, whereas the dark colors (purple and blue) are the deeper zones (5000 ms to the north). The interpretation of my data is inside of the white polygon, which was integrated with previous authors’ interpretation (shown outside of the white polygon). The white straight lines are the 2D seismic lines. B. Pliocene isochron map 1 (TWT in ms) with a contour interval of 300 ms. Warm colors (red and yellow) represent the thicker section (>1800 ms to the north) of the late Miocene, whereas
xv
the dark colors (purple and blue) are the thinner section (<300 ms to the northwest and south). C. Time-structural map of Intra - Pliocene with contours spaced at 500 ms (TWT). Warm colors (red and yellow) represent the shallower areas (<1000 ms to the southwest and northwest) of the late Miocene, whereas the dark colors (purple and blue) are the deeper zones (4000 ms to the northeast). D. Pliocene isochron map (TWT in ms) with contour interval of 250 ms. Warm colors (red and yellow) represent the thicker section (>1500 ms to the northeast) of the Pliocene, whereas the dark colors (purple and blue) are the thinner section (<300 ms to the southwest). ....................................................... 69
Figure 21. Paleogeographic maps for the EEVB based on this study interpretation and compilation of previous paleogeographic maps by Ferrel et al. (1974), Kiser (1994), Wynn (1995), Di Croce (1996), Pindell et al. (1998), Bartok (2003), Duerto (2007), Taboada (2009), Escalona and Mann (2011), and Yang and Escalona (2011). The pink areas represent uplifted and eroded areas, the light yellow color corresponds to transitional to shallow marine environments, light green areas are the inner neritic environments, and light blue is outer neritic environments. A. Late Eocene passive margin stage. B. Late Oligocene stage when the foreland basin deformation associated with the Caribbean Plate movement started to affect the study area and a south to north drainage system was active. C. Middle Miocene underfilled foreland basin stage with south-to-north deltaic systems filling the foredeep. D. Early Pliocene filled foreland basin stage with sediment bypass towards the northeast. Since late Miocene the Orinoco River started filling the basin from the southwest and another change in the drainage pattern occurred. E. Plio-Pleistocene overfilled foreland basin stage shallow facies are prograding northeastward to the Columbus basin. ......................................................... 74
Figure 22. A. Schematic vertical juxtaposition of depozones in a foreland basin system (modified from DeCelles and Horton, 2003). B. Depozones and stratigraphic column of proposed for the foreland basin system of the EEVB. C. Lateral migration of the foreland basin system (modified from DeCelles and Horton, 2003). D. Forebulge migration inferred from this interpretation and modified from Bartok (2003) and Pindell (1998). ........................................................................................................... 83
Figure 23. Subsidence plots for three locations in the study area shown in inset map. The source rock is late Cretaceous in age and is highlighted by the white color. From west to east: A. Pseudo-well (depth and stratigraphic interpretation from this study). B. Well 1 based on information from the well report shown in Figure 8 extends to a depth of 4.7 km; from this depth to basement the lithology was inferred from nearby wells). C. Well 3 based on information from the well report shown in Figure 13. D. Critical element chart based on well information and literature. ........................................................................ 89
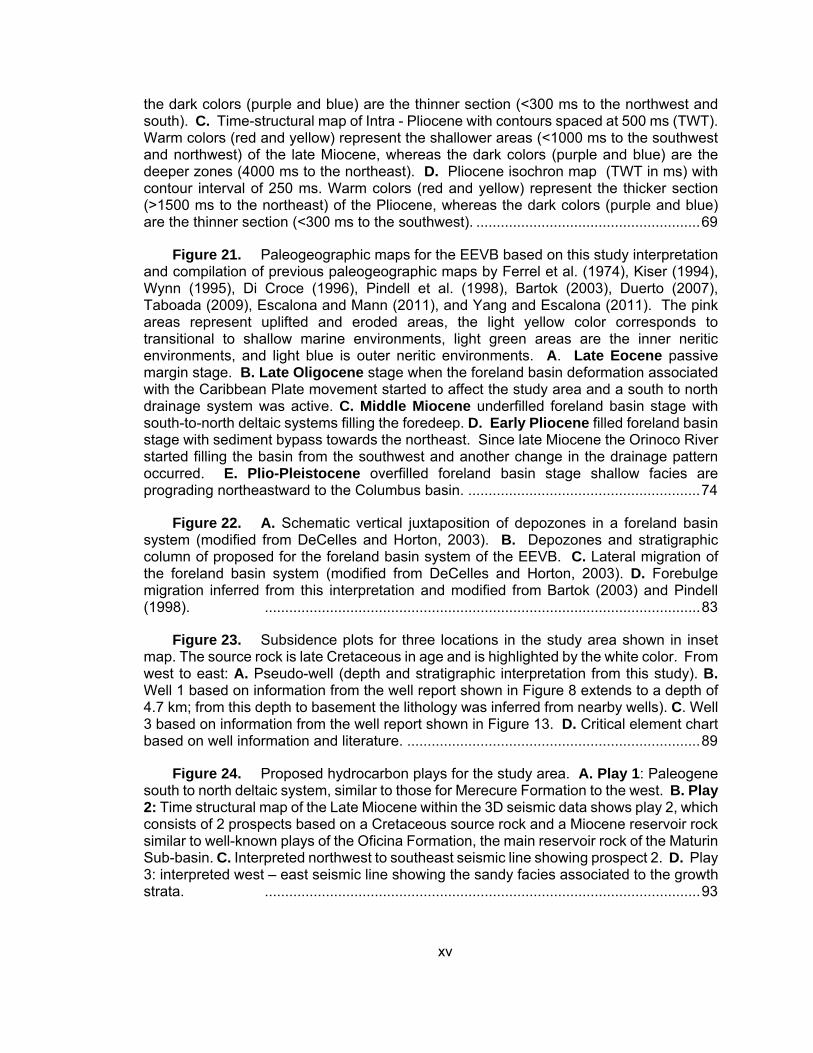
Figure 24. Proposed hydrocarbon plays for the study area. A. Play 1: Paleogene south to north deltaic system, similar to those for Merecure Formation to the west. B. Play 2: Time structural map of the Late Miocene within the 3D seismic data shows play 2, which consists of 2 prospects based on a Cretaceous source rock and a Miocene reservoir rock similar to well-known plays of the Oficina Formation, the main reservoir rock of the Maturin Sub-basin. C. Interpreted northwest to southeast seismic line showing prospect 2. D. Play 3: interpreted west – east seismic line showing the sandy facies associated to the growth strata. ........................................................................................................... 93

xvi
LIST OF TABLES
Table 1. Well log set available for this thesis…………………………………………….… 21
Table 2. Tectonostratigraphic sequences and their controlling tectonic events……….. 60
1
CHAPTER 1: INTRODUCTION
1.1. INTRODUCTION TO THE THESIS
My study area is located in the easternmost part of the Eastern Venezuelan Basin
(EVB), an Oligocene-Recent foreland basin along the northern edge of the South
American plate. My study area includes part of the Orinoco river delta and the marine
shelf northwest of the Orinoco delta (Deltana Platform). I collectively call this area the
Orinoco delta system (ODS). A 10-km-thick basin fill was deposited in the easternmost
part of the EVB (EEVB) mainly during passive margin and foreland tectonic settings (Di
Croce et al. 1999; Duerto, 2007). The active margin sand and shale units deposited in the
earlier, underfilled, fully marine phase of the EVB include the Temblador Group, Merecure,
Oficina and Carapita formations (González de Juana et al. 1980, Yoris and Ostos, 1997,
Duerto, 2007) overlain by marine to fluvial sand and shale units of La Pica, Las Piedras,
and La Mesa formations. These latter formations were all deposited in the later phase of
the EVB when it became overfilled by fluvial and deltaic deposits from the Orinoco River
and spilled into the ODS.
The EVB is the second-largest producing basin in Venezuela behind the Maracaibo
basin with more than 38 oilfields. Indications for a petroleum system have been observed
in my study area making the area a promising target region for future hydrocarbon
exploration.
The main objective of this work is to understand the stratigraphy and tectonic
evolution of the EEVB and compare this evolution with previous models proposed for the
area. The workflow included: 1) identify the main sequences present using seismic and
well data; 2) construct isochron maps to show the main depocenters and filling trends; 3)
constrain how the depositional environments changed from marine facies in the underfilled

2
foreland basin phase of the Paleogene and Early - Middle Miocene to fluvial and deltaic
phases in the overfilled foreland basin phase of the Pliocene to recent; and 4) describe
the main petroleum system elements and illustrate these using two different exploration
plays from the region.
The dataset used for this study area consists of 620 km2 of 3D post-stack seismic
data, 650 km of 2D seismic reflection data, 6 wells with well logs, and 5 time - depth
relationships. Wells are spaced approximately 30 km apart with only one well tied to the
3D seismic data set (Well 1). Well 1 was drilled by BP-Amoco in 1998 and reached a total
depth of 15,150 feet (4.7 km).
1.2. PERSONAL MOTIVATION FOR THIS THESIS
If I had to characterize the main motivation of my personal and academic life I would
have to say: a desire for self-improvement and perseverance. Since early childhood, I
enjoyed mathematics with my path pointing towards engineering. I chose the Universidad
Central de Venezuela in Caracas for its academic excellence in the engineering fields and
for the competitiveness of its students. My admission to the geological engineering
program required two attempts and a preparatory course. Once in the program, I
participated in student research, I completed an internship and a bachelor’s thesis with
the oil-industry, and I was selected as an undergraduate teaching assistant for the
structural geology course. As a result of my efforts, I graduated first in my class of 30
students with the BS degree of Geological Engineer in 2005 and received an award for
being the best undergraduate student of the Geology, Geophysics and Mine School in
2004 and 2005.
Following graduation, I worked for PDVSA (Venezuelan National Oil Company) for
seven years as a seismic interpreter and geologist for the Reservoir Integrated Studies

3
Department. Working at the oilfield-scale, integrated 3D seismic data with well logs and
core information to create 3D geocellular models, which I populated with seismic
attributes.
After seven years, I decided to go to grad school to improve my knowledge in geology
and geophysics. In Venezuela, I heard about the CBTH Project at the University of
Houston with the possibility of working on a thesis topic in Venezuela. I was accepted into
the program in August of 2012 and received a dataset from PDVSA in the area of the
EEVB as my MS research topic.
During the two year MS program at the University of Houston, I took courses related
to the oil and gas exploration in order to prepare myself as a geoscientist with strong skills
in well correlation, seismic-well ties, seismic interpretation, basin analysis, petroleum
system analysis, and Caribbean regional tectonics. My master’s thesis is focused on 2D
and 3D seismic interpretation and basin modeling of an onshore and offshore basin in
eastern Venezuela. I was also the Teaching Assistant for a graduate level Basin Analysis
course for two semesters and organized the lab section using Petrel software.
I completed two summer internships: the first in the summer of 2013 with
ConocoPhillips as a Geoscientist intern for the Global New Venture Exploration team
working on data from West Africa and the second one in the summer of 2014 as
Geophysics intern in Anadarko in their Colombia Offshore Exploration team. Following
the second summer internship, Anadarko offered me a fulltime job with the Colombia team
which I will start in January, 2015.

4
CHAPTER 2: STRATIGRAPHY, STRUCTURE, AND PETROLEUM
POTENTIAL OF THE EASTERNMOST PART OF THE EASTERN
VENEZUELAN BASIN
2.1. INTRODUCTION
My study area is located in the easternmost part of the Eastern Venezuelan Basin
(EVB), a Late Oligocene-Recent foreland basin formed along the northern edge of the
South American plate (Figure 1). The easternmost part of the EVB, or EEVB, is bounded
on the north by the Trinidad fold-thrust belt, on the northwest by the Serrania del Interior
fold-thrust belt, on the south by the Venezuelan Orinoco heavy oil belt and the Guayana
Shield Complex, and on the east by the passive margin of the Atlantic Ocean with the
Orinoco delta system (ODS) (Warne et al. 2002) on the shelf and slope and the Columbus
basin in the deepwater area (Garciacaro et al. 2011) (Figure 2). My study area covers an
area of approximately 2046 km2, straddles both the on- and offshore zones, and includes
part of the Orinoco river delta and shallow marine environments northwest of the Orinoco
delta system (Figure 3). I refer to the entire land and offshore area of the modern and
past Orinoco delta as the “Orinoco delta system”.
2.1.1. TECTONIC SETTING AND OBJECTIVES OF THE STUDY
The interaction between the South American and Caribbean plates is responsible for
the deformation in the EVB region of Venezuela. Since Late Cretaceous to the recent,
the Caribbean plate has obliquely collided from west to east against the passive margin
of South America (Figure 1). This right-lateral and thrusting relative movement produced
an oblique collision and caused an eastward younging of foreland basins along the
northern margin in the South American plate (Escalona and Mann, 2011).
5
Figure 1. Changing locations of the leading edge of the Caribbean plate from the late Cretaceous to recent modified from Escalona and Mann (2011). Ages for different positions of the leading edge of the Caribbean plate: 1 = Late Cretaceous, 2 = Middle Paleocene, 3 = Middle Eocene, 4 = Middle Oligocene, 5 = Middle Miocene, 6 = Pliocene and 7 = Recent. Dotted blue lines show the inferred changing locations for the Proto-Orinoco River modified from Escalona and Mann (2011). Yellow areas represent the locations of foreland basins location formed by the oblique collision of the Caribbean plate. White box indicates the covered area in Figure 2.

6
Figure 2. Tectonic map and location of the main oil and gas fields and oil and gas seeps along the northern margin of South America and the main onland foreland basins sins in Venezuela (Maracaibo, Eastern Venezuelan and Barinas-Apure basin, and Columbus basin (Offshore Trinidad). The Orinoco heavy oil belt, outlined in blue. The white box indicates the area shown in Figure 3.

7
The EVB covers an area of ~165,000 km2 and is bounded in the north by coastal fold-
thrust belts in northern Venezuela and Trinidad, to the west by the Baúl basement and
topographic arch, to the south by the Guayana Shield, and to the east by the Orinoco delta
system and the Atlantic Ocean (Erlich and Barrett, 1992; Summa et al. 2003). EVB is
subdivided into two Oligocene-Miocene sub-basins: Guárico sub-basin to the west and
Maturín to the east, and they are separated by the Urica arch (Duerto, 2007). Both sub-
basins define the foredeep in EVB with the Guárico sub-basin in the west slightly older
(Oligocene) than the Maturín (Miocene) (Parnaud et al. 1995; Escalona and Mann, 2011).
My study area is located in the easternmost part of the Maturín sub-basin and includes
both the EVB foreland basin and part of the Orinoco delta system.
The Orinoco River, the world’s third largest drainage system with a drainage basin of
~ 880,000 km2 (Warne et al. 1999 and 2002; Bowman, 2003) has been the main axial
drainage system for the EVB since at least the Late Miocene based on regional
stratigraphy (Díaz de Gamero, 1996) or late Oligocene based on detrital zircon studies in
Trinidad (Xie et al. 2014) (Figure 2). The primary sources of fluvial sediments include the
Llanos foreland basin, the Colombian Andes, the coastal ranges of Venezuela (Serrania
del Interior) and the Guayana Shield (Figure 2). The large gravity low in the EVB indicates
that the deep EEVB is the likely consequence of oblique thrusting along the Venezuelan
coastal ranges (Jácome et al. 2003) (Figure 3B). Surface geology indicates the EVB
foreland basin has filled to sea level and is now being bypassed by the ODS with most
modern sediments deposited in the Columbus basin in deep water (Callec et al. 2010)
(Figure 3A).

8
Figure 3. Geological map of the EVB foreland basin, part of Guayana shield and Trinidad from geological map compilated by Hackley et al. (2005). B. Bouguer gravity anomaly of the EEVB showing one of the lowest values around the world (Sánchez-Rojas 2012, and Jácome et al. 2003), which coincides with the main depocenter of the EEVB foreland basin.

9
The ODS is prograding eastward into the Atlantic Ocean (Di Croce et al. 1999; Callec
et al. 2010). There is abundant evidence for the delta having occupied a shelf- edge
position during the last glacial sea-level lowstand (Bowman et al. 2003). Hoorn et al.
(1995) and Díaz de Gamero (1996) postulated a change in the paleoflow direction of the
Orinoco River from the northwestward in western Venezuela to the east in the EVB during
the Late Miocene (Figure 1). Hoorn et al. (1995) proposed that Andean tectonics and
uplift of the Venezuelan Coastal range was responsible for the Late Miocene change in
the drainage pattern. Xie et al. (2014) used detrital zircon studies to suggest that smaller
Paleogene deltaic systems along the northern edge of the Guayana shield may have been
significant contributors to the EEVB prior to the arrival of the late Miocene Orinoco delta
system.
The main objective of this thesis project are to define the stratigraphic and tectonic
evolution of EEVB as part of the entire EVB foreland basin system, the links between
sedimentation between the underfilled and overfilled phases of the EEVB, and the
petroleum potential for both the EEVB and the ODS. The specific objectives proposed for
this thesis project are:
1) To identify the main sequences present in the EEVB using 2D and 3D seismic
data obtained from PDVSA ((Venezuelan National Oil Company) for this study.
This interpretation will be tied and integrated with previous published studies
around the study area.
2) To construct isochron maps in order to identify the main depocenters, filling trends
during the deposition history of the basin, and the timing of the underfilled and
overfilled stages of the EVB and how that affected the early development of the
ODS (Figure 3).

10
3) To create paleogeographic maps to understand how depositional environments
changed from marine facies in the underfilled foreland basin phase to fluvial and
deltaic phases in the overfilled foreland basin phase and how the overfilled basin
affected the ODS including the formation of large submarine canyons of late
Miocene age which I identify in my study area for the first time.
4) To analyze subsidence history from Cretaceous to the present-day using well data
and synthetic well based on seismic interpretation of the EEVB and correlation
with surrounding previous studies.
5) To use basin modeling methods to predict oil and gas windows in areas of known
source and reservoir rocks.
2.1.2. PETROLEUM GEOLOGY OF VENEZUELA AND THE EEVB
The northern part of South American Plate is one of the most prolific hydrocarbon
areas overseas with a mean production of more than 4 million barrels of oil per day
(Escalona and Mann, 2011). Venezuela has the largest proven oil reserves in the world
(298 billion barrels according to the US Energy Information Administration, 2014), and is
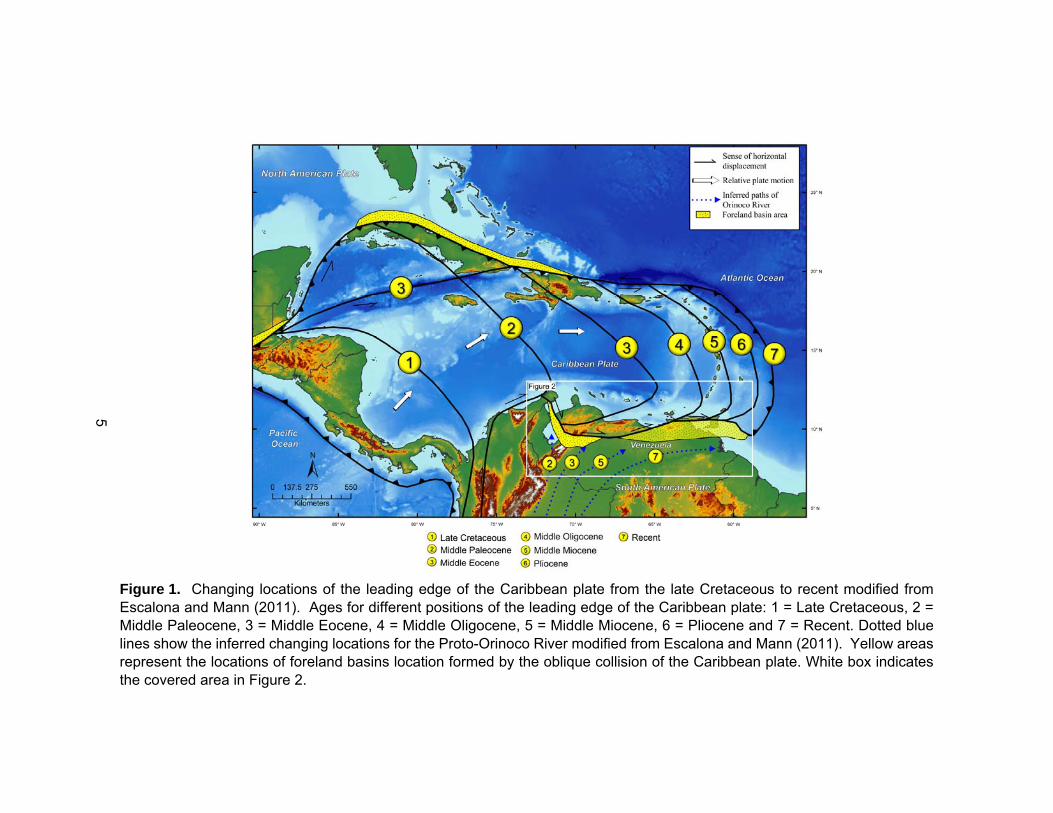
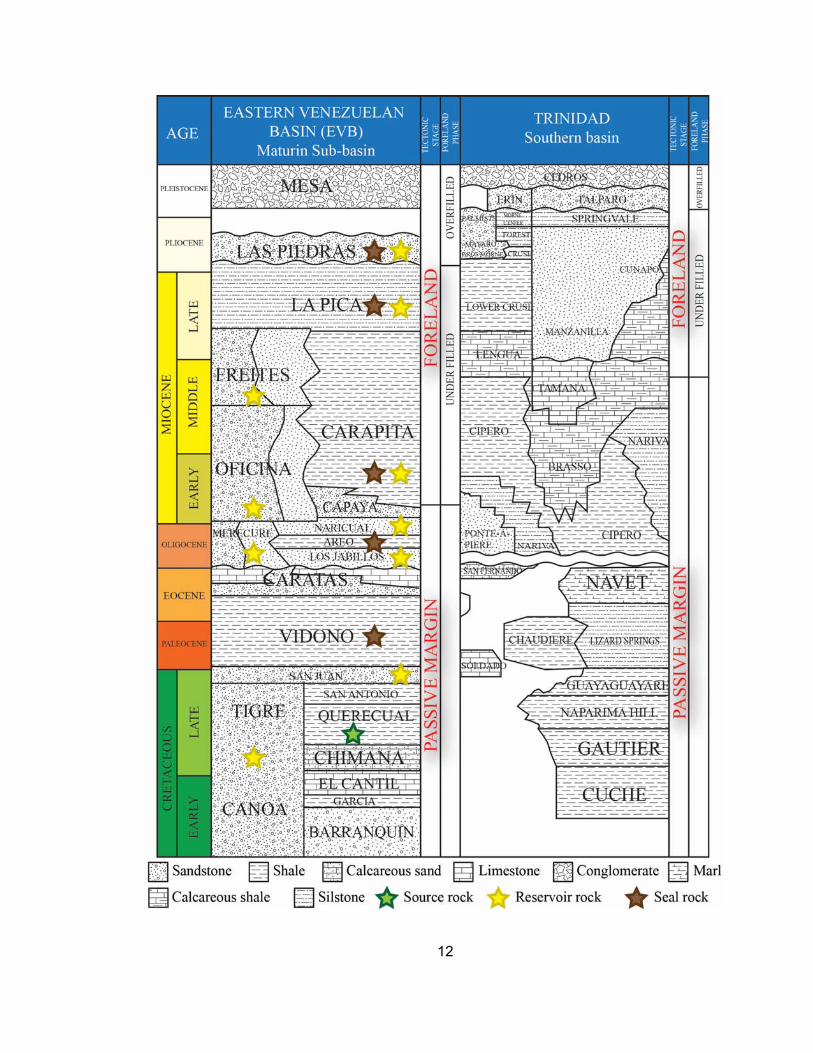
the world’s 12th largest oil producer. The main source rock is the Late Cretaceous La Luna
Formation and its equivalents (Querecual Formation in EVB and Naparima/Gautier
formations in Trinidad) (González de Juana et al. 1980; Pereira et al. 1994; Algar, 1998;
Duerto 2007) (Figure 4).

11
Figure 4. Stratigraphic column for the EVB (modified from Duerto 2011 and González de Juana, 1980) and correlative units in Trinidad (modified from Algar, 1998). The main source rock in the EVB is the late Cretaceous Querecual Formation and its equivalent unit in Trinidad, Naparima Hill Formation. The main reservoir rocks are Oligocene, Miocene and Pliocene rocks in age. They include Oficina and Freites formations in Maturin Sub-basin, and La Pica Formation in Pedernales oilfied (which is the closest active Venezuelan oilfield to my study area) and the Cruse, Gross Morne and Mayaro formations in Trinidad.
12

13
Oil reserves in Venezuela are concentrated in the Maracaibo Basin, a sedimentary
basin in the northwestern part of the country with more than 40 billion barrels of oil proven
reserves (USGS, 2003; Escalona and Mann, 2006). The Orinoco Heavy Oil Belt located
to the south of the EVB (Figure 2), one of the biggest accumulations of heavy oil in the
world, is estimated to contain 513 billion barrels of extra heavy crude oil with an API of 11
degrees (US Energy Information Administration, US EIA 2014).
The EVB includes 38 giant oil fields and forms one of the largest clusters of giant
fields on Earth with proven reserves of 36 billion barrels and is the second major producing
basin after Maracaibo basin (USGS, 2003; Escalona and Mann, 2011). Almost all of the
major oil fields in Venezuela are located in onshore areas (Figure 2). Escalona and Mann
(2011) proposed that either the offshore area remains an underexplored frontier area or
that the petroleum systems offshore are fundamentally different from those found in the
onshore areas.
Figure 2 shows all the hydrocarbon occurrences in the EVB, including the presence
of numerous natural oil and gas seeps in the study area, which support the existence of
working petroleum systems (Summa et al. 2003; Duerto et al. 2011). The presence of
many giant oilfields clustered in the EVB highlights its prospectivity including the
Pedernales field located on the northern margin of the Orinoco Delta approximately 70 km
to the northwest of the study area. This field currently has a production of 4,300 BOPD
(Perenco webpage; http://www.perenco.com/operations/latin-america/venezuela.html)
from stacked Pliocene and Miocene sandstone reservoirs. Its production peak was in the
late 1950s when it reached a total of 12,000 BOPD (Gluyas, 1996).
Exploration in the study area started in 1923 with the drilling of Macareo-1 (TD 491
meters) by British Controlled Oil Fields and abandoned despite gas shows at three
intervals (PDVSA, 2006). The second well drilled in this area was the Morocoto-1X well

14
by BP-Amoco in late 1998, which reached a total depth of 4.7 km and found biogenic gas
at several different levels. Summa et al. (2003) studied seeps and inclusions in the EVB
and Trinidad, and found that their sources are mostly marine Cretaceous rocks, and some
Tertiary mixed terrigenous and marine organic matter. In the EEVB, they reported mixed
shale and carbonate Cretaceous source rock similar to La Luna/Querecual formations.
2.1.3. TECTONIC AND GEOLOGIC SETTING OF EASTERNMOST EASTERN VENEZUELAN
BASIN (EEVB)
EVB is mostly covered by outcrops of Neogene and Quaternary sediments that young
eastward in the study area (Figure 3A). This eastward younging of outcrops is inferred to
be the result of progressive west-to-east filling of the EVB by the Orinoco River. In the
highlands south of the EVB, older rocks include igneous-metamorphic Paleozoic rocks of
the Guayana Shield (Hackley et al. 2005). These rocks dip northward and underlie the
sedimentary rocks of the EVB. In the Serrania del Interior to the north, Cretaceous
sedimentary rocks are exposed in a fold-thrust belt (Jácome et al. 2003; Hackley et al.
2005; Hung, 2005; Duerto et al. 2011), formed as a result of oblique collision between the
South America and Caribbean plate (Parnaud et al. 1995, Clark et al. 2008).
Surface faults of the EVB are related to transpression produced by eastward
movement of the Caribbean Plate combined with flexure of the South American plate
beneath the overthrusting area (Clark et al. 2008) (Figure 3A). The east-west, right-lateral
strike-slip fault system accommodates the eastward motion of the plate. Northwest-
striking normal faults are interpreted as Neogene growth faults formed by gravitational
processes when the shelf edge was located further to the west (Di Croce et al. 1999;
Bowman and Johnson, 2014).

15
According to the Bouguer gravity anomaly map (Figure 3B), the EVB is represented
by a gravity minimum with an elongate SW-NE shape that extends from the EVB for a
distance of 400 km to the Barbados accretionary prism. The anomaly values range
between > -120 mGal and ≈-200 mGal (Sánchez-Rojas 2012; Jácome et al. 2003), making
this area the lowest Bouguer minimum on Earth.
Sánchez-Rojas (2012) states that this gravity low is due to an extreme thickness of
Cenozoic sedimentary rocks. Alternatively, Jácome et al. (2003) proposed that this
Bouguer minimum reflects a combination of: 1) thick sediment accumulation; 2) tectonic
load from thrusting in Trinidad and northeastern Venezuela; and 3) lithospheric flexure
caused by the southwestward prolongation of the Lesser Antilles subduction zone beneath
the Maturín sub-basin.
The geologic history of the EVB has been affected mainly by three tectonic events
(Parnaud et al. 1995; Yoris and Ostos, 1997; Di Croce et al. 1999; and Taboada, 2009).
First, during the Jurassic to Early Cretaceous, a rifting phase was developed as the South
American plate rifted apart from the North American and African plates. During this period,
deposition occurred in northeast-trending graben structures (Di Croce et al. 1996; Duerto,
2007).
Second, a passive-margin phase was established during the Early Cretaceous to
Middle Oligocene (Parnaud et al. 1995; Lugo and Mann, 1995; Jácome et al. 2003).
Deposition occurred on a carbonate platform dipping gently northwards (Erlich and Barrett,
1992; Summa et al. 2003; Jácome et al. 2003). Passive margin sedimentation started with
fluvial to deltaic clastic sediments of Barranquin Formation followed by the Garcia, Cantil,
and Chimana formations which all include shale and limestone deposited as part of a
marine carbonate platform (González de Juana et al. 1980; Yoris and Ostos, 1997;
Jácome et al. 2003) (Figure 4).

16
For the period of Cenomanian to the Turonian, anoxic conditions developed along the
shelf margin and allowed deposition of the main source rock, the Querecual Formation
(González de Juana et al. 1980; Yoris and Ostos, 1997; Summa et al. 2003). This unit is
the lateral equivalent of Naparima Hill and Gautier formations in Trinidad (Pindell, 1998;
Summa 2003) (Figure 4) and La Luna Formation in western Venezuela.
Formation of the EVB foreland basin in the Oligocene and Miocene is the latest
tectonic event responsible for most of the hydrocarbon generation along the northern
border of South America (Escalona and Mann, 2011). Towards the south, this foreland
basin section is marked by clastic facies of Temblador Group (Tigre and Canoa
formations) of Cretaceous age representing deposition in deltaic to transitional
environments (Figure 4).
The passive margin section in the EEVB culminated with an increasing amount of
clastic input from north-south drainages, as response of a eustatic sea level fall (Yoris and
Ostos, 1997; Pindell, 1998; Escalona and Mann, 2011; Xie et al. 2013, 2014). Eustatic
sea level fall led to a marine regression, represented by the deposition of San Antonio
(glauconitic limestone and calcareous sandstone), San Juan (turbiditic sand and shale),
Vidoño (shale) and Caratas (siltstone to sandstone) formations. Towards Trinidad, the
deposition presented a higher content of shale and marls due to its downslope position.
Finally, at the late Oligocene to recent foreland tectonic stage, there was the onset of rapid
subsidence as the result of the Caribbean Plate transpression (Rohr, 1991; Eriksen and
Pindell, 1993; Escalona and Mann, 2011) (Figure 1).
The EVB foreland basin sedimentary units are represented by the Late Oligocene
Merecure Formation along the southern flank of the EVB that includes sandstone with
shale intercalations deposited in a transitional environment (González de Juana et al.
1980). Northwards, in the Serrania del Interior, this unit changes laterally to Los Jabillos,
17
Areo and Naricual formations of Oligocene age which have a higher shale content and
were deposited in transitional to shallow marine environments. Yoris and Ostos (1997)
noted two possible sources of clastic sediments for the upper section. One source due to
the south-north drainages system and the second from the deformation front located to
the northwest at this moment. This view is supported by the detrital zircon studies of Xie
et al. (2010, 2014) and Pindell et al. (2009).
The Neogene in the EVB began with the deposition of the Oficina Formation in
proximal areas, as part of a fluvial-deltaic complex (González de Juana et al. 1980).
Basinward, sedimentation consisted of deepwater shale of the Miocene Carapita
Formation (Duerto, 2007). Yoris and Ostos (1997) noted the presence of turbidities in the
Carapita Formation which makes that formation in the subsurface a possible exploration
target. Deltaic to shallow marine facies of Merecure and Oficina formations are the main
reservoirs rocks for the EVB and for the Orinoco heavy oil belt (Rodríguez, 1999; Bartok,
2003; Summa, 2003; Santiago et al. 2007).
Deltaic, shallow marine to fluvial sediments of La Pica, Las Piedras, and La Mesa
formations Plio-Pleistocene age were deposited in a regressive stage due to the filling of
the basin by the Orinoco river delta and to the lateral movement of the foreland basin
clastic wedge towards the east (Figure 4). In Pedernales field, located 70 km to the
northwest of the study area, the main reservoir is La Pica Formation, and it consists of
three informal members: Amacuro, Pedernales and Cotorra with the last two being sand-
rich intervals (Barnola, 1960).

18
2.1.4. PREVIOUS WORK, DATA AND METHODS
2.1.4.1. Previous works
There are many previous studies carried out around the study area mostly related to
unpublished thesis projects of the Central University of Venezuela and US and English
universities (Figure 5A). As noted, all previous studies included seismic lines and well
information. A regional subsurface study was previously completed by Di Croce (1996)
and Di Croce et al. (1999) as part of his Ph.D. dissertation at Rice University and he
included an extensive set of PDVSA subsurface data including 14,000 km of 2D seismic
lines and 150 wells in onshore and offshore areas. They established regional correlations
between the major structural domains of eastern Venezuela: Serrania del Interior fold-
thrust belt, Espino graben, Venezuelan Orinoco heavy oil belt, and offshore Orinoco delta
and normal fault province. Di Croce et al. (1999) used part of the offshore data from Prieto
(1987) that corroborated the previous interpretation by Prieto (1987) of Late Miocene
submarine canyons and growth faults in the offshore area east of my study area (Figure
5A).
Taboada (2009) worked in the central area or “Delta Centro” area of the Orinoco delta
system, which is to the southwest behind to EEVB area (covered area by 2D seismic
survey in dark blue, Figure 5A). He used 2,800 km of seismic lines and wells, which are
partially included in the PDVSA data set for this project. Taboada (2009) defined and
interpreted the main sequences and also built subsidence plots for the Delta Centro area
in the EVB. In a more recent study of eastern Venezuela, Duerto and McClay (2011)
defined the shale tectonic zones associated with the thrust belt fold of the Serrania del
Interior fold-thrust belt and its implications for the stratigraphy and structures to the
northwestern part of the study area.

19
Figure 5. A. Subsurface data set used by previous authors in my study area (red box): Prieto (1987) in purple color, Di Croce et al. (1999) in yellow color, Duerto (2007) in green color, Moscardelli (2007) in pink color, Taboada (2009) in blue color and Figueira (2012) in orange color. B. Data set used for this study in the area marked by the red box. 2D seismic surveys in blue color, 3D seismic is in yellow box, and wells are shown as red dots.

20
The most recent research of the EVB south of Trinidad was done by Figueira (2012),
who worked to the north and northwest of the study area in the Trinidad area and in the
Gulf of Paria shared by Trinidad and Venezuela (Figure 5A). His data set included some
of the same PDVSA data used by Duerto (2007). In this study, Figueira correlated
subsurface foreland basin units from the EEVB to southern Trinidad and defined different
structural domains. Also, he extrapolated his interpretation of major structural belts from
previous workers into his thesis study area.
Balanced sections and forward modeling studies have been carried out for the
Serrania del Interior fold-thrust belt (Hung, 2005; Jácome et al. 2003). The closest section
to my study area was by Jácome et al. (2003). In this study, the authors postulated that
the total flexure exhibited by the EEVB is due to the tectonic load of the fold-thrust belt
and also by deformation of the South American lithosphere caused by its subduction
beneath the Caribbean plate. In addition, they observed that the amount of north-south
shortening decreases from 50 km in the west to 35 km in the east.
2.1.4.2. Data and methods
The PDVSA data set available for the thesis study area consists of 620 km2 of 3D
post-stack seismic data in time, 4000 km of 2D seismic reflection data in time, 14 wells
from which 6 wells have logs and 5 of them time-depth relationships (Figure 5B). The 3D
survey is an important factor because it will allow defining a more detailed seismic
interpretation and allow the use of seismic attributes to delineate the depositional systems
associated with the filling of the EEVB by the Orinoco delta system.
The seismic data were collected between 1969 and 1997 with dynamite and airgun
sources. These lines show good quality until 6 seconds TWT. The 3D seismic data was
acquired with a bin of 30 X 30 meters. The majority of the 2D seismic data (approximately

21
70%) is offshore areas; whereas, the 3D seismic survey is onshore and offshore. Wells
are spaced approximately 30 km apart with only one well tied to the 3D seismic data set.
The well log set available is summarized in Table 1.
Well 1 Information
Well 1 (Figure 5B) was drilled by BP-Amoco in late 1998 and reached a total depth of
15,150 feet (4.7 km). Due to the biogenic gas found in this well (gas intervals show with
red dots in Figure 6), the area has a high prospectivity for discovering future hydrocarbon
accumulations. The available well logs are shown in Table 1. Well 1 contains a complete
log set, biostratigraphic data, and formation evaluation logs.
Table 1. Well log set available for this thesis
WELL
TOTAL
DEPTH
(KM)
GAMMA RAY
DENSITY SONIC RESISTIVITY TIME –DEPTH
CURVE
Well 1 4.62 X X X X X
Well 2 5.28 X X X
Well 3 4.1 X X X X X
Well 4 4.78 X X X X X
Well 5 4.23 X X X
Well 6 3.81 X X X X X
According to biostratigraphic data, this well was drilled into the Pliocene La Pica
Formation (Figure 4). Using the well logs and biostratigraphy, the sequence in this well
can be subdivided into three lithological units (Figure 6): 1) the deeper section
corresponds to sandstone (La Pica Formation of Late Miocene – Early Pliocene age)
which was deposited in a bathyal environment; 2) the middle section is represented by a

22
shale – sandstone intercalation of the Las Piedras Formation of Pliocene age,
characterized by transitional marine to continental facies; and 3) the shallower section is
characterized by a sandstone unit with interbedded shale of Pleistocene age. The
youngest unit is correlated with the La Mesa Formation deposited in a transitional to
continental environment (Figure 6).
Well 1 was used to perform a seismic-well calibration for the 3D seismic data (Figure
6). For this step, the density log was convoluted with the sonic curve, which was
previously adjusted with the well checkshot data. The stratigraphic section penetrated by
this well exhibits a sequence of continuous and high frequency intercalations of negative
and positive amplitude reflectors. This seismic facies pattern observed correlates with the
intercalation of sandstone and shale (middle and upper units) typical of shallow marine
and deltaic environments. In the deeper section, seismic reflections are longer wave
length and indicatives of the lesser vertical heterogeneity of the sequence.
2.2. DESCRIPTION OF THE FORELAND BASIN SETTING OF THE EEVB
Foreland basin systems are asymmetrical basins created in convergent tectonic
regimes as continental crust flexes in response to a tectonic load usually in the form of an
overthrusting fold-thrust belt. DeCelles and Giles (1996), and DeCelles and Horton (2003)
illustrate the main elements of a foreland basin system (FBS) that includes an orogenic
wedge, foredeep, forebulge, and backbulge (Figure 7A). According to these authors, the
orogenic wedge is composed of the wedge top and the fold-thrust belt. The wedge top
contains coarse, syntectonic sequences derived from the fold-thrust belt as a result of its
continuous deformation and erosion.

23
Figure 6. Logs for Well 1 tied to the 3D seismic data used in my study. To the left are the formations penetrated by the well to a depth of 15,150 ft (4.7 Km). Well log set includes Tracks 1 and 2 show the Gamma Ray log (0-120 API and 120 – 0 API respectively), yellow color is sand and brown is shale. Track 3 shows deep resistivity in red color and shallow resistivity in blue color (0.1 – 100 ohm.m, logarithmic display). Track 4 is the density curve (1.9 to 2.9 gr/cc). Track 5 is the sonic curve (150 – 500 sec-1). Tracks 6 and 8 are surface seismic data (variable density color display, red color corresponds to positive impedance and blue colors to negative impedance). Track 7 is well synthetic, estimated from the convolution of the density and sonic logs with a zero phase Richter wave. Red dots correspond to the gas shows in the well. Black arrows show succession patterns (upward increasing or upward decreasing).

24
Figure 7. A. Schematic profile of a foreland basin system (DeCelles and Horton, 2003). The asymmetrical foreland basin includes a fold-thrust belt, a foredeep (main depocenter), a forebulge (flexural high) and a backbulge. B. Three diagrammatic and merged sections showing the geometry and the associated wedge relate to the foreland system in the eastern part of the EVB. The pink section represents the crystalline basement (Guayana Shield), the green units are Cretaceous rocks, the orange unit is the Paleogene section, and the yellow and light yellow units are Neogene and Quaternary sequences. From left to right: 1) Profile A-A’ is modified from Rodríguez (1999) and shows the Cretaceous-recent sequence onlapping against the backbulge. The largest accumulation of oil in Venezuela - the Orinoco Heavy Oil Belt – is found in this section as the result of updip migration from the Cretaceous source rock, the Querecual Formation. 2) Profile B-B’ is from an interpreted seismic section showing the thickest part of the northward-dipping foredeep. C. Profile C-C’ shows the continuation of the foredeep, the wedge top, and inverted structures.

25
26
Cratonward, the wedge top changes to the foredeep, which is the FBS zone with the
highest subsidence and flexure and largest accommodation space for sediment
accumulation. Therefore, the foredeep is the main depocenter of a typical FBS (Figure
7A). The sediment source area for the foredeep depozone can be either the fold-thrust
belt and/or the craton. The foredeep exhibits a wedge shape and thins in the cratonward
direction and pinches out against the cratonic basement along a flexural high called the
forebulge. Some deposition can occur across the forebulge but this section is commonly
highly condensed. Migration of the forebulge produces a diachronous unconformity at its
crest.
Finally, there is a smaller depocenter behind the forebulge called the backbulge
depozone, but its creation depends on the flexural rigidity of the basement. DeCelles and
Horton (2003) proposed that these depozones are generally equal in width. Horton and
DeCelles (1997) reported widths of 50–100 km for the wedge top and 250–350 km the
foredeep, forebulge, and back-bulge depozones of the FBS of southern Bolivia.
2.2.1. REGIONAL GEOLOGY OF THE EASTERN VENEZUELAN FORELAND BASIN
SYSTEM
The EVB consists of a 10-km-thick, clastic sedimentary fill deposited mainly during
the Oligocene-Miocene foreland tectonic stage in the eastern Venezuela. Towards the
northeast, the orogenic wedge is represented by the Serrania del Interior in Venezuela
and Southern Range in Trinidad, and the syntectonic wedge of sediments deposited on
top (Figure 7C). In the fold-thrust belt, Cretaceous and Paleocene rocks are folded and
imbricated by thrust faults (Hung, 2005). Duerto (2007) defined the Serrania del Interior
as steep, sub-parallel concentric folds with axes trending N60-70. Hung (2005) stated that
this thrust belt is a thick-skinned deformation with inverted grabens and various

27
detachments. Jácome et al. (2003) proposed a north-south shortening which decreases
from west (50 km) to east (35 km).
Cratonwards in Figure 7B, the EEVB study area includes the foredeep of the Maturín
sub-basin. This depozone in the dip direction is more than 200 km in width. According to
the Bouguer gravity data in Figure 3B, the EEVB foredeep has a WSW-ENE orientation
that is sub-parallel to the orientation of the Serrania del Interior thrust-fold belt (Duerto et
al. 2011).
The Cretaceous and the Paleogene sections are normal faulted with most normal
faults dipping north. Normal faults show inversion close to the deformation front (PDVSA,
2006). Miocene and Plio-Pleistocene sequences represent the active deposition during
the foreland stage, consisting of more than 8 km of clastic sediments.
The sediment was derived from the deformation front to the north and from the
Guayana Shield to the south (Yoris and Ostos, 1997; Pindell et al. 2009; Xie et al. 2010;
and Xie and Mann, 2014). The Orinoco River started to fill this depocenter from the Late
Miocene (Díaz de Gamero, 1996), until the foredeep was overfilled during Early Pliocene
and spilled over towards the Columbus basin southeast of Trinidad.
The entire EVB foreland sequence pinches out to the south against the Guayana
shield in the forebulge (Rodríguez, 1999). The southern flank of the EVB is a gentle
monocline dipping approximately 4 degrees to the north. This zone traps the Orinoco
heavy oil belt which has migrated updip from the Cretaceous source rock.
2.2.2. DESCRIPTION OF REGIONAL SEISMIC LINES FROM THE EEVB
Figure 8 shows a 50 km-long seismic profile in TWT oriented southwest to northeast
and crossing the 3D seismic data. The line shows a northward-dipping monocline with a
slope of ≈ 3 degrees to 1 degree from base to top. The deeper section interpreted is the

28
Cretaceous unit shown in the green color and characterized by high amplitude, continuous
reflections, inferred to represent mixed carbonate-clastic deposition within an open marine
depositional environment. The top of the Late Cretaceous is clearly identified due to the
contrasting seismic facies of the Paleogene sequence shown in orange, which is more
transparent and discontinuous and correlated to a shalier and more uniform section
(Vidoño Formation) (Figure 4). This unit is normal faulted (<70 meters of throw) by flexure,
probably due toduring the early development of the EVB foreland basin. The Paleogene
section thins northward.
The Miocene section in dark yellow onlaps the Late Oligocene unconformity and
thickens northwards marking a prominent change in the foredeep with respect to the
previous deposition. The thickness of the Miocene ranges from 600 to 1,900 meters.
Growth faults are observed cutting this Miocene interval with the most prominent fault
offset on this profile around 200 meters. To the south, the detachment plane coincides
with the top of the Paleogene sequence; however, to the north the decollement plane is
near the top Cretaceous due to the northward thinning and condensed character of the
Paleogene section. The seismic facies is characterized by discontinuous-high amplitude
reflections likely associated with rapid deposition on the slope. The top of the Miocene is
marked by an erosional unconformity.
The Plio-Pleistocene in light yellow is represented by a uniform, 5-km-thick section
that onlaps the Miocene unconformity. The seismic facies is a clear intercalation of
positive and negative amplitude reflections, which shows the high vertical variability typical
of fluvial and shallow marine environments. The northward dip of this section is less than
1 degree.

29
Figure 8. A. Uninterpreted southwest to northeast seismic line from 0 to 6500 ms in TWT that spans the 3D seismic volume (variable density color display with red color corresponding to negative impedance and black colors to positive impedance). Well 1 is shows the seismic well time, the lithology (yellow color is sand and brown color is shale) and the intervals with gas shows (red dots). B. Interpretation for seismic line shown in Figure 8A. Green section is Cretaceous, orange color is Paleogene, yellow color is Miocene section, and light yellow color is Plio-Pleistocene. Black lines in the Cretaceous section are normal faults related to flexure; black lines in the Miocene and Paleogene sections are growth faults.

30
31
Figure 9 shows a regional seismic profile oriented SW-NE across the southern region
of the study area and showing a monocline dipping northwards approximately 2 degrees.
Five units are identified: 1) the basement (pink color) is characterized by chaotic
reflections associated with crystalline or metamorphic rock; 2) the Cretaceous section
(green color) thickens northward and is normally faulted due to the flexure of the foreland
basin. 3) The Paleogene section thins towards the northeast and exhibits a transparent
seismic facies.
4) The Miocene section onlaps the Oligocene unconformity, is eroded at its top, and
thickens northwards. Changes in its thickness are not clearly shown on this line. The
Cretaceous, Paleogene and Miocene sections all do not exhibit lateral variations in their
thicknesses. Finally, 5) the Plio-Pleistocene section shows a dramatic change in thickness
with thickening to the north.
2.3. DESCRIPTION OF THE PASSIVE-MARGIN SECTION UNDERLYING THE
ORINOCO DELTA SYSTEM
2.3.1. REGIONAL GEOLOGY OF THE ORINOCO DELTA SYSTEM AND UNDERLYING
PASSIVE MARGIN SECTION
The EEVB study area includes the passive margin of the Atlantic Ocean and is
correlated with the previous interpretations from Di Croce (1996) in his study area to the
southeast. Figure 10 highlights two composite profiles in the dip orientation across the
Atlantic passive margin in which the main sequences and eastward movement of the
depositional systems are observed.

32
Figure 9. A. Uninterpreted southwest to northeast, seismic line from 0 to 6500 ms in TWT across the Deltana Platform (variable density color display with red color corresponding to negative impedance and black colors to positive impedance). B. Interpretation for seismic line shown in Figure 9A. Pink section is crystalline basement (Guayana Shield), green unit is Cretaceous, orange is Paleogene unit; yellow color is Miocene section, and light yellow color is Plio-Pleistocene. Black lines in the Cretaceous section are interpreted as normal faults related to flexure.

33

34
Figure 10. A. Interpreted southwest to northeast profile in time (TWT in ms) south of the study area including from left to right: A-A’ seismic profile W-E from this study and B-B’ Di Croce et al. (1996) interpretation. Green section represents Cretaceous, orange is Paleogene, yellow is Miocene and light yellow is Plio-Pleistocene. Black lines in the Cretaceous section are interpreted as normal faults due to flexure, whereas black lines in the Miocene and Paleogene section are growth faults. B. Interpreted profile in time (TWT in ms) of the study area including from left to right: C-C’ seismic profile W-E from this study and D-D’ Di Croce’s (1996) interpretation.

35

36
Figure 10A shows a composite profile in time for the Orinoco delta system in the
EEVB. The interpretation of this line A-A’ on the shelf is correlated with Di Croce’s et al.
(1999) line (B-B’) closer to the Columbus basin. In Venezuela I observed relatively
unfaulted intervals and that contrast to the polyphase growth faults are present on the over
steepened shelf edge in the northeastern area.
The 6-second TWT length for the seismic reflection data does not image the deeper
boundary between the basal stratigraphic units and the crystalline basement. The
sequence starts with a thick Cretaceous section (> 2.9 km), characterized by high
amplitude, continuous reflectors. The oldest Cretaceous time interpreted by Di Croce et
al. (1999) was Aptian based on well information to the south. This exhibits the same type
of flexure-related normal faulting as observed in the Cretaceous section in the EEVB.
The Paleogene and Miocene sequences thin eastward and exhibit a condensed
interval of deposition (<170 meters for Paleogene and <350 meters for Miocene). The top
of the Oligocene is a correlative conformity in the deeper basin. The Miocene section is
eroded by 10-km-wide submarine canyons of Late Miocene or Early Pliocene age.
The Plio-Pleistocene is an eastward-prograding sequence approximately 4 km thick
that exhibits little wedging. The purple line in Figure 10A represents shelf edge
progradation since Late Neogene. Gravity-driven faults are present in the Plio-Pleistocene
section; these faults do not affect the previous Miocene to Cretaceous section. The
detachment plane is at the top Miocene in this profile; however, basinward the decollement
plane is at the top of the Paleogene or Late Cretaceous section.
Figure 10B is 250-km-long W-E to SW-NE time profile in the dip direction but north of
the line shown in Figure 10A. The interpretation of this line (C-C’) on the shelf is tied with
Di Croce’s (1996) line (D-D’) located more to the east and closer to the Columbus basin.

37
The Cretaceous section is overlain by a condensed Paleogene and Miocene section
that total 0.65 km in thickness. The Plio-Pleistocene sequence is more than 7 km thick
and shows eastward progradation. Growth faults are deforming this unit to the northeast
and create a downdip fold-thrust belt due to accommodation (Di Croce et al. 1999;
Bowman and Johnson, 2014). The decollement is restricted to the top Cretaceous. In the
Columbus basin, shale tectonism appears related to growth-fault movement in the form of
either shale diapirs or as shale ridges.
2.3.2. DESCRIPTION OF SEISMIC LINES FROM THE ORINOCO DELTA SYSTEM
For the purposes of illustrating geometry and stratigraphy within the passive-margin
deposits in the Deltana Platform, four seismic profiles are described here (Figures 11, 12,
13 and 14). Two of the lines are in dip direction, one is an approximately strike view, and
one is an arbitrary/combination seismic line.
The EW seismic profile in time in Figure 11 shows an undeformed sequence
deposited across a gently northward-dipping platform. The deeper unit is identified as the
Cretaceous section which is characterized by high-amplitude, continuous reflections
which tend to be more discontinuous to the west. As in the previous figures, this section
is normally faulted by flexure with small normal faults. The total thickness observed on
this profile is up to 1.5 km.
The overlying Paleogene unit is a condensed section (<150 meters) which thins
eastward. The seismic facies observed is continuous low-amplitude to transparent
reflections. The top corresponds to the correlative surface of the foreland unconformity.
38
Figure 11. A. Uninterpreted west to east seismic line in TWT from 0 to 5000 ms crossing the Deltana Platform (variable density color display: red color corresponds to negative impedance and black colors to positive impedance). B. Interpretation of lines in Figure 11A. Green Cretaceous, orange is Paleogene, yellow is Miocene, and light yellow is Plio-Pleistocene. Black lines in the Cretaceous section are normal faults due to the flexure, whereas the black lines in the Miocene and Paleogene section are growth faults. Brown, concave-up features are submarine canyons.

39
40
The Miocene section is a wedge thickening to the west (<450 meters), characterized
by continuous, high-amplitude reflections which become condensed in the basinward
direction. A 10-km-wide and 300-m-deep submarine canyon is present and can be
observed as an erosional feature within the Miocene section. Due to its position with
respect to this unit, the age of the canyon can be inferred as Late Miocene or Early
Pliocene. The canyon was identified from erosional truncation of the Miocene section and
onlapping of the canyon infill.
The Plio-Pleistocene section shows eastward progradation of the sequence. The
aggradation rate during this time was slower than the progradation rate. The thickness
varies from 3.5 to 4.8 km along this profile. This section exhibits two seismic patterns: 1)
continuous and parallel reflections which can be associated with the deposition on the
shelf; and 2) chaotic to discontinuous reflections produced by rapid deposition on the slope
and deeper basin to the east. Clinoforms are well developed showing the shelf break
(black dots), with an inclination of approximately 3 degrees and a slope high ranging
between 200-400 meters in water depth. Gravity-driven normal faults are affecting the
Plio-Pleistocene section with the presence of an intraformational detachment.
Figure 12 is located downdip to the previous line and shows an EW seismic profile in
time and in the dip direction. As illustrated in Figure 11, the deeper section is the
Cretaceous sequence with a thickness greater than 1 km. The Paleogene unit is
condensed and the Miocene deposition is thinning eastward where it becomes a
condensed section. There are also submarine canyons which are wider (18 km) and
deeper than those described previously and erosion of both the Miocene and Pliocene
sequence.
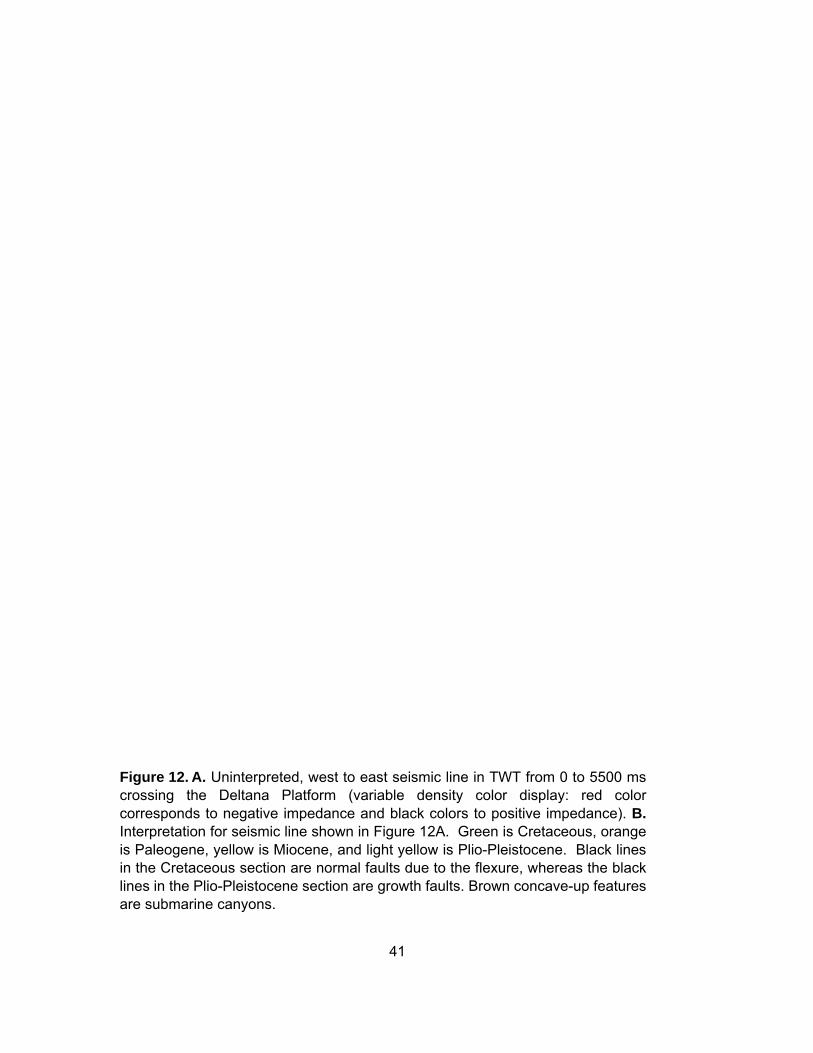
41
Figure 12. A. Uninterpreted, west to east seismic line in TWT from 0 to 5500 ms crossing the Deltana Platform (variable density color display: red color corresponds to negative impedance and black colors to positive impedance). B. Interpretation for seismic line shown in Figure 12A. Green is Cretaceous, orange is Paleogene, yellow is Miocene, and light yellow is Plio-Pleistocene. Black lines in the Cretaceous section are normal faults due to the flexure, whereas the black lines in the Plio-Pleistocene section are growth faults. Brown concave-up features are submarine canyons.

42

43
The Plio-Pleistocene section also exhibits an undeformed section with a clear
eastward progradation of the shelf break. However, aggradational deposition is also
observed in this part of the basin. Clinoforms show inclination of approximately 3 degrees
and slope high between 300 - 400 meters. In this profile no growth faulting is observed.
In a NW-SE profile in time (Figure 13), the sequence is undeformed with the
Cretaceous section present as the deeper unit dipping northward (< 2 degrees) and has
a maximum thickness of 1.5 km (the base of the Cretaceous is not observed). This is
characterized by an intercalation of continuous, high amplitude reflections and continuous,
low amplitude reflections. The brighter reflections correspond to limestone as shown by
Well 3. High-angle normal faults related to flexure are also observed in this area.
The Paleogene unit is a thin section thinning to the northwest. The Miocene sequence
was eroded leaving a thin interval that is not representative of its original thickness. This
profile exhibits two localized highs in the Miocene section which can be interpreted as reef
buildups. In contrast, Well 3 shows a clastic section composed of sandstone and shale
intercalations.
Due to the orientation of this profile (Figure 13) with respect to the passive margin dip
direction, progradation is not observed. Instead, sub-horizontal, continuous and
conformable reflections are presented within the Plio-Pleistocene section. Overlyng the
Miocene sequence, a unit with discontinuous and low amplitude to chaotic reflections was
deposited. This seismic pattern is related to a rapid deposition on the slope. Concave-up
erosional features are observed to be approximately 15 km wide and 350 m deep.
According to the biostratigraphic data reported in the Well 3, this deposition occurred in
bathyal environments. The upper Plio-Pleistocene section is characterized by continuous
and high density reflections, exhibiting erosional patterns.

44
Figure 13. A. Uninterpreted, northwest to southeast seismic line in TWT from 0 to 5500 ms crossing the Deltana Platform (variable density color display: red color corresponds to negative impedance and black colors to positive impedance). Well 3 is tied to the line and shows lithology (yellow color is sand, brown color is shale and blue is limestone). B. Interpretation for seismic line shown in Figure 13A. Green is Cretaceous, orange is Paleogene, yellow is Miocene, and light yellow color is Plio-Pleistocene. Black lines in the Cretaceous section are normal faults due to flexure. Brown concave-up features are submarine canyons.

45

46
Figure 14 shows a seismic profile in time trending NS. This section exhibits an
undeformed sequence to the south and growth faults to the north as described by Di Croce
(1996) from the Columbus basin. In general, the Cretaceous-Miocene sections are similar
to previous descriptions on the other regional lines. Plio-Pleistocene progradation is not
observed due to the orientation of this profile respect to the passive margin dip direction.
Well 4 reported a sandstone-shale intercalated succession that is coarsening upward and
provides evidence of the regressive character of this deposition.
2.4. STRATIGRAPHIC AND STRUCTURAL FEATURES OF THE EEVB
Seismic information in the EEVB study area reveals stratigraphic features related to
deltaic and deepwater depositional environments. In the Miocene section at least two
main sequences are associated with northeastward-prograding deltas with topsets
marking its fluvial and subaerial facies to the south and bottomsets indicating a basin-floor
facies to the north. The orientation of foresets on the shelf shows that the paleo-drainage
direction was from the south-southwest to north-northeast so slightly different from the
modern eastwardly progradation direction of the Orinoco delta (Figure 2). Connectivity
with bottomsets shows that these deposits are being directly fed from the topsets located
updip.
In addition to those features, gravity-driven faults are another important element which
play a role in the deposition in the study area and could represent potential traps for
hydrocarbon accumulations in rollover anticlines or within the newly-created bathymetric
lows.

47
Figure 14. A. Uninterpreted, north to south seismic line in TWT from 0 to 5000 ms crossing the Deltana Platform (variable density color display: red color corresponds to negative impedance and black colors to positive impedance). Well 4 is tied to the seismic line and shows lithology (yellow color is sand and brown color is shale). B. Interpretation for seismic line in Figure 14A. Green section is Cretaceous, orange is Paleogene, yellow is Miocene, and light yellow is Plio-Pleistocene. Black lines in the Cretaceous section are normal faults due to flexure. Brown concave-up features are submarine canyons.

48

49
2.4.1. DELTAIC FEATURES OF MIDDLE AND LATE MIOCENE AGE
Figure 15 shows three differently oriented lines from the seismic cube that illustrate
the morphology of Miocene deltaic systems in the EEVB. In the dip direction (Figure 15A),
the seismic reflectors dip northward at about 4 degrees. At least two deltaic sequences
were identified (marked with and in Figure 15A). The upper delta has bypassed the
lower delta and, therefore, the deltaic depositional sequences are prograding northwards.
The shallower system () has its top truncated to the south, due to erosion which occurred
at the very end of the Miocene or Early Pliocene. This erosional event could be related to
either the worldwide Messinian regression event (Haq, 1988; Di Croce et al. 1999) or a
tectonic event in the EVB foreland setting.
In strike view (Figure 15B), the upper Miocene delta has a lens shape which is
thinning to east and west and has a maximum thickness of 450 meters. On this line,
eastward progradation of the upper Miocene delta is apparent. In general, there is little
wedging but this may reflect the short length of the seismic section (<15 km).
Figure 15C shows the northeastward progradation of the two deltaic systems.
Foresets are dipping northward at about 3 degrees. The lower deltaic interval is thicker
than the upper unit with a maximum thickness for whole Miocene section of 1.9 km. The
younger deltaic feature is top truncated due to erosion at the end of Miocene (the
maximum thickness eroded in this area was approximately 70 meters).
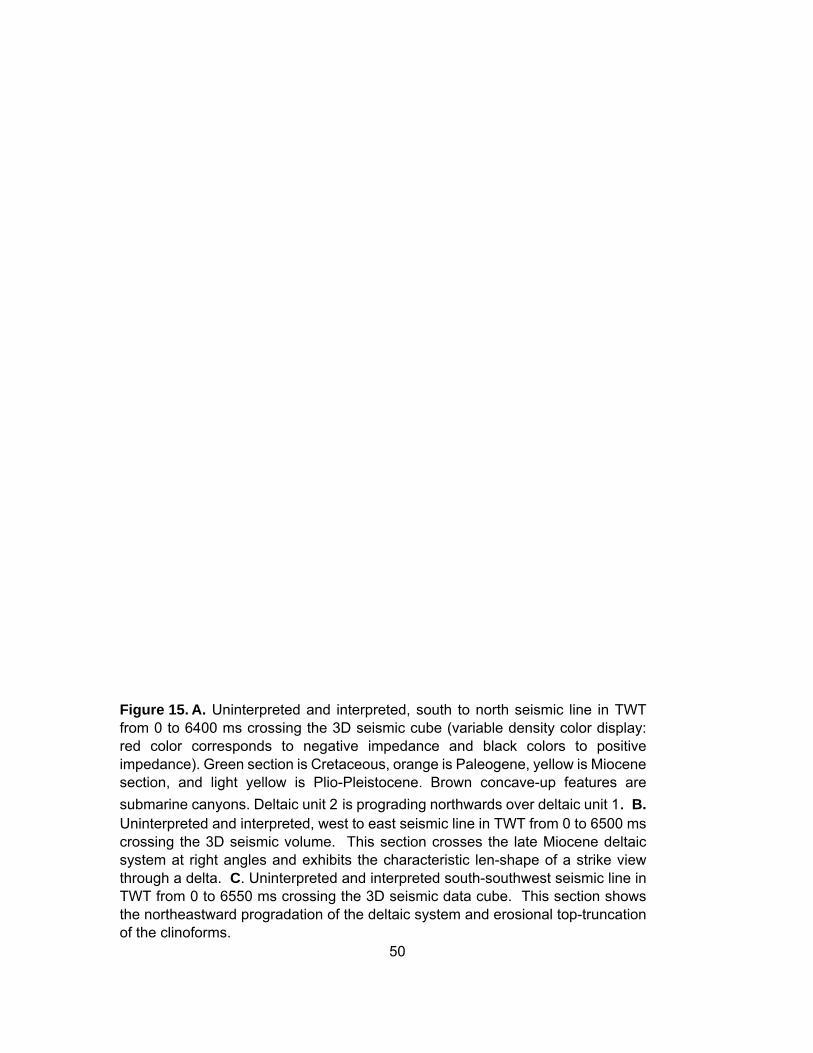
50
Figure 15. A. Uninterpreted and interpreted, south to north seismic line in TWT from 0 to 6400 ms crossing the 3D seismic cube (variable density color display: red color corresponds to negative impedance and black colors to positive impedance). Green section is Cretaceous, orange is Paleogene, yellow is Miocene section, and light yellow is Plio-Pleistocene. Brown concave-up features are
submarine canyons. Deltaic unit 2 is prograding northwards over deltaic unit 1. B. Uninterpreted and interpreted, west to east seismic line in TWT from 0 to 6500 ms crossing the 3D seismic volume. This section crosses the late Miocene deltaic system at right angles and exhibits the characteristic len-shape of a strike view through a delta. C. Uninterpreted and interpreted south-southwest seismic line in TWT from 0 to 6550 ms crossing the 3D seismic data cube. This section shows the northeastward progradation of the deltaic system and erosional top-truncation of the clinoforms.

51

52
2.4.2. SUBMARINE CANYONS OF LATE MIOCENE – EARLY PLIOCENE AGE
Erosion of the Late Miocene slope shown by truncation of previous sequences are
interpreted as large submarine canyons with a southwest-northeast trend (Figure 16). The
overlying stratigraphic succession is onlapping this surface (Figure 16A, B). The chaotic
character of reflectors observed in the lowest infill of the concave-up erosional features
coincides with canyon fill facies as described by Nordfjord et al. (2006).
Figure 16A shows a vertical profile in time (TWT in ms) oriented NW-SE showing the
correlation between my interpretation and that by Di Croce et al. (1999). The prominent
features shown are concave-up erosional elements at the end of Late Miocene surface
which truncate the previous Miocene deposition. Their dimensions are 10 to 15 km wide
and 350 to 500 meters deep.
Prieto (1987), Di Croce (1996) and Henriksen et al. (2011) all reported the presence
of these same types of erosional features southeast of my study area. They observed the
existence of erosional elements, which were penetrated by wells 2 and 3 and proposed
them as submarine canyons. The fill of the submarine canyon was described by Di Croce
et al. (1999) as gray-greenish shale with siltstone and fine-grain sandstone intercalations.
Biostratigraphic data suggests that those sediments were deposited in upper to middle
bathyal environments based on benthic foraminifera including: Cyclammina,
Haplaphragmoides, Alveo-valvulinella suteri, Uvigerina, Lenticulina, Bolivina,
Recurvoides, Buliminella.
To the west in the EVB, the same erosional features are also observed. Figure 16B
shows a section in time on which erosion at the Late Miocene level is again observed (
in Figure 16B). In this area, erosional features are 12 km wide and 200 meters deep. The
Plio-Pleistocene section onlaps within these erosional features.

53
Figure 16. A. Strike seismic profile in a northwest to southeast direction crossing the Deltana Platform in TWT and merging my interpretation with Di Croce et al. (1999) interpretation the south of my study area. This section shows a transverse cut through the submarine canyon system of the late Miocene passive margin setting. B. Interpreted 2D seismic line in TWT to the east of the study area that displays late Miocene submarine canyons. C. 3D visualization of the late Miocene time structural map, in which the presence of submarine canyons is observed. During the late Miocene – early Pliocene time this margin was active for the developing of erosional feeders which link shallow marine environments with the deposition in deep water areas.

54

55
A 3D visualization of the Late-Miocene-time structural map is showed in Figure 16C.
The surfaces behind numbers and represent the structural surface relate to the
concave up erosional features interpreted as elements and in Figures 16A and 16B,
respectively. To the east, feature has a SSW – NNE orientation which is connected
southward with steep feeder channels as shown by the distortion of the contours forming
V-shapes. In this area, the shelf is steeper compared to the shelf to the west. Feature
shows a SW-NE channel trend widening in the basinward direction.
According to the literature regarding incised valleys and submarine canyons, these
erosional features within my dataset can be defined as incised valleys due to their small
dimensions (maximum 10 km wide and a relief of 500 ms) (Nordfjord et al. 2006;
Dalrymple, 2006; Reijenstein, 2011; Sylvester, 2012). Considering the submarine
canyons previously documented by Prieto (1987) and Di Croce (1996) to the south and
east of my study area and the neritic lithology described from well 1, I propose that these
V-shaped erosional features are the westwards prolongation of the deepwater canyon
system proposed by Di Croce et al. (1999) and Prieto (1987).
The SW-NE trend shown by submarine canyons in my study area is important
because this trend documents a change in their flow direction during the Late Miocene
which could reflect the same changing flow direction of the proto-Orinoco river as
proposed by Hoorn et al. (1995), Díaz de Gamero (1996) and Di Croce et al. (1999).
These authors proposed a paleoflow directional change of the Orinoco River from
northwest in western Venezuela to the east in the EVB during the Late Miocene. Hoorn
et al. (1995) and Conti (2012) proposed that Andean tectonics was the mechanism
responsible for this Miocene change in the drainage pattern and specifically during the
Late Miocene when the Orinoco River was already filling the EVB.
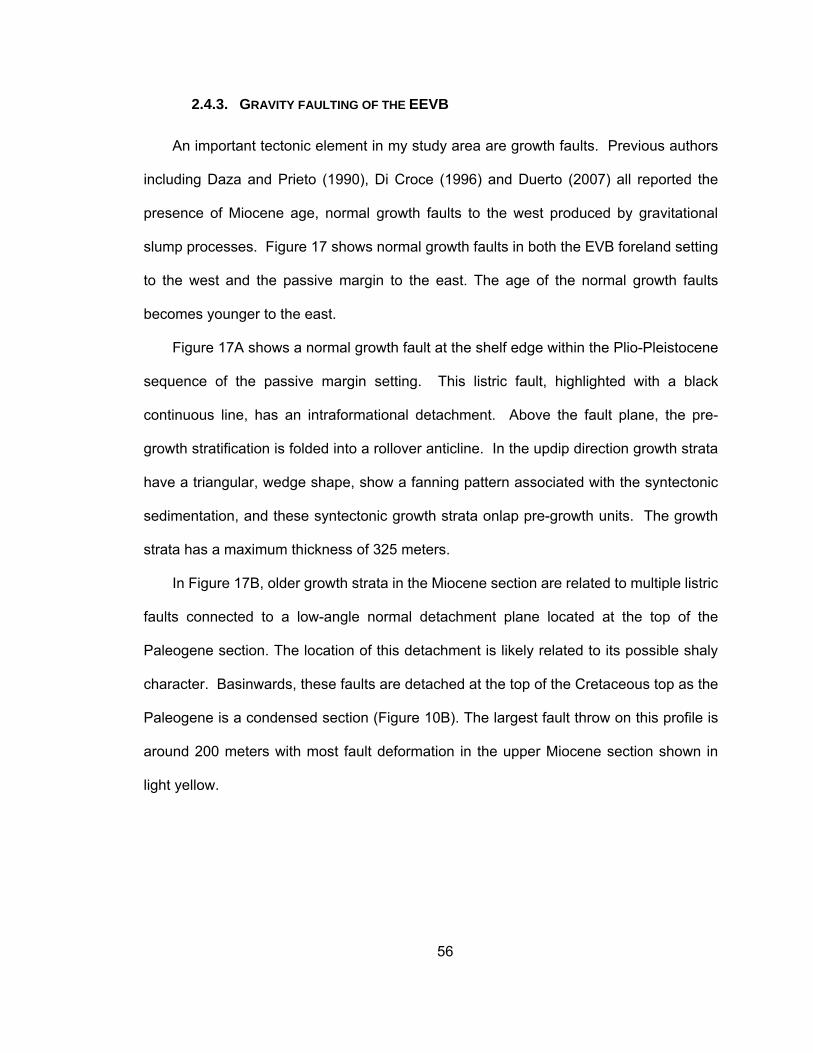
56
2.4.3. GRAVITY FAULTING OF THE EEVB
An important tectonic element in my study area are growth faults. Previous authors
including Daza and Prieto (1990), Di Croce (1996) and Duerto (2007) all reported the
presence of Miocene age, normal growth faults to the west produced by gravitational
slump processes. Figure 17 shows normal growth faults in both the EVB foreland setting
to the west and the passive margin to the east. The age of the normal growth faults
becomes younger to the east.
Figure 17A shows a normal growth fault at the shelf edge within the Plio-Pleistocene
sequence of the passive margin setting. This listric fault, highlighted with a black
continuous line, has an intraformational detachment. Above the fault plane, the pre-
growth stratification is folded into a rollover anticline. In the updip direction growth strata
have a triangular, wedge shape, show a fanning pattern associated with the syntectonic
sedimentation, and these syntectonic growth strata onlap pre-growth units. The growth
strata has a maximum thickness of 325 meters.
In Figure 17B, older growth strata in the Miocene section are related to multiple listric
faults connected to a low-angle normal detachment plane located at the top of the
Paleogene section. The location of this detachment is likely related to its possible shaly
character. Basinwards, these faults are detached at the top of the Cretaceous top as the
Paleogene is a condensed section (Figure 10B). The largest fault throw on this profile is
around 200 meters with most fault deformation in the upper Miocene section shown in
light yellow.

57
Figure 17. A. Uninterpreted and interpreted, west to east seismic line in TWT crossing the Deltana Platform (variable density color display: red color corresponds to negative impedance and black colors to positive impedance), showing the presence of growth faults within the Plio – Pleistocene section. B. Uninterpreted and interpreted seismic line SW – NE in TWT crossing the 3D seismic cube showing Miocene growth faulting. C. 3D visualization in time of the Miocene growth faults from the seismic cube, and their detachment surface corresponding to the carbonate rocks of the top Cretaceous.

58

59
A 3D visualization of the gravity-driven, normal growth fault system sliding along the
top of the Late Cretaceous is shown on Figure 17C and illustrates how all these normal
growth faults ultimately detach at the top of the late Cretaceous as also has been
described along the edges of the Columbus basin by Garciacaro et al. (2011) and Bowman
and Johnson (2014). The Paleogene section thins northeastward until it becomes a
condensed unit, and for that reason the top of the more competent Cretaceous carbonate
units host the detachment zone in the basinward area (Figure 10). The growth fault system
strikes NW-SE and is composed of a system of concave-up, listric fault planes.
2.5. TECTONOSTRATIGRAPHIC STAGES BASED ON STRUCTURAL AND
ISOCHRON MAPS OF THE EEVB AND SURROUNDING AREAS
Four tectonostratigraphic sequences were interpreted in the study area based on 3D
and 2D seismic interpretations, well log information, and previous works (Figure 8). Six
reflectors were correlated with major tectonic events: 1) Late Cretaceous, 2) foredeep
unconformity (Late Oligocene) which forms the base in Maturín sub-basin for the tectonic
active deposition; 3) intra-Miocene horizon; 4) Late Miocene horizon; 5) intra-Pliocene
horizon, 6) intra-Plio-Pleistocene horizon 2.
The Intra-Miocene horizon was only mapped within the 3D seismic survey because
this horizon was not identified on 2D seismic lines. Of these six horizons, the most
distinctive horizon is the Late Miocene horizon because it forms a prominent erosional
surface with a different dip direction than the other four, mapped surfaces.

60
Table 2. Tectonostratigraphic sequences and their controlling tectonic events
SECTION MAXIMUM THICKNESS TECTONIC STAGE
Cretaceous 4 km (Di Croce et al. 1999) Passive margin
Paleogene 0.75 km Passive margin
Late Oligocene – foreland unconformity
Miocene 7 km Foreland basin system
Underfilled to filled
Plio-Pleistocene 8.7 km Foreland basin system
Overfilled
2.5.1. STAGE ONE: CRETACEOUS TO EARLY PALEOGENE PASSIVE MARGIN STAGE
AND UNDERFILLED PALEOGENE FORELAND STAGE OF THE
During the Late-Cretaceous and for most of Paleogene time, a passive margin
developed in the study area. Figure 18 shows a TWT structural map for the Late
Cretaceous unit, the Paleogene isochron map, and the fault systems deforming this
horizon.
For this map and the following structural and isochron maps of younger intervals I
have combined my thesis study area mapping results from within the elongate polygon
outlined in white on all of these maps with the results of previous studies outside of my
thesis area including: 1) Taboada (2009) to the southwest; 2) Duerto (2007) to the west;
3) Figueira (2012) to the northwest and in the Trinidad area; 4) Di Croce et al. (1999) to
the east; and 5) Prieto (1987) also to the east.
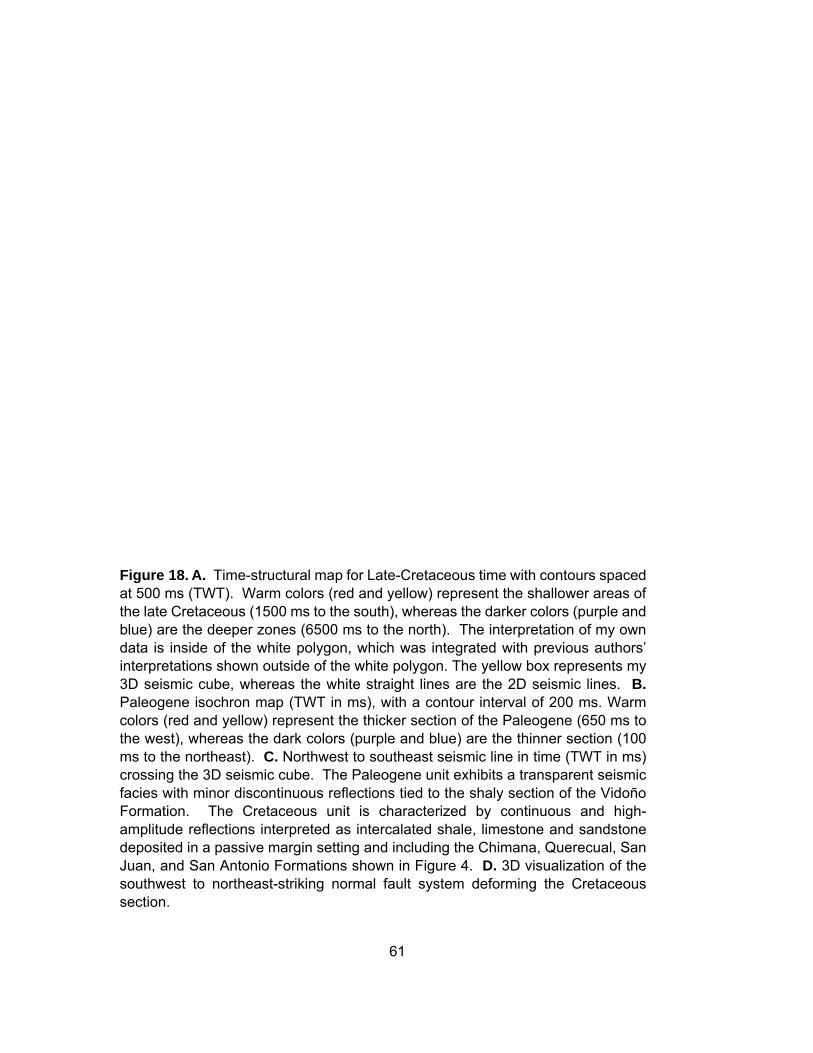
61
Figure 18. A. Time-structural map for Late-Cretaceous time with contours spaced at 500 ms (TWT). Warm colors (red and yellow) represent the shallower areas of the late Cretaceous (1500 ms to the south), whereas the darker colors (purple and blue) are the deeper zones (6500 ms to the north). The interpretation of my own data is inside of the white polygon, which was integrated with previous authors’ interpretations shown outside of the white polygon. The yellow box represents my 3D seismic cube, whereas the white straight lines are the 2D seismic lines. B. Paleogene isochron map (TWT in ms), with a contour interval of 200 ms. Warm colors (red and yellow) represent the thicker section of the Paleogene (650 ms to the west), whereas the dark colors (purple and blue) are the thinner section (100 ms to the northeast). C. Northwest to southeast seismic line in time (TWT in ms) crossing the 3D seismic cube. The Paleogene unit exhibits a transparent seismic facies with minor discontinuous reflections tied to the shaly section of the Vidoño Formation. The Cretaceous unit is characterized by continuous and high-amplitude reflections interpreted as intercalated shale, limestone and sandstone deposited in a passive margin setting and including the Chimana, Querecual, San Juan, and San Antonio Formations shown in Figure 4. D. 3D visualization of the southwest to northeast-striking normal fault system deforming the Cretaceous section.

62

63
The structural map in Figure 18A, corresponds to the top of the mixed clastic–
carbonate sequences of the Late Cretaceous, deposited in a platform setting similar to the
present-day Atlantic passive margin in the area of the Orinoco delta system (Figure 10).
The Late Cretaceous passive margin trends east-west and is characterized by high-
amplitude, continuous reflectors (green section in Figure 18C). This east-west-trending
platform shows a uniformly, northward-dipping monocline with a dip angle of about 3.5
degrees. The maximum observed depth to the top Cretaceous is 13 km south of Trinidad
(approximately 6.5 seconds in TWT), whereas the shallower section is to the south of the
study area reaches 3 km (2 seconds in TWT).
Overlying the top Cretaceous structural horizon, the upper Cretaceous and basal
Tertiary section is represented by low-amplitude to transparent reflectors interpreted as
shaly deposits containing large-scale slump features shown as the orange-colored unit
bounded by dark green and red lines in Figure 18C. The isochron map for this section is
shown in Figure 18B.
As previously described and shown on figures 10 - 14, to the northeast this section
becomes a very condensed section with its total thickness less than 150 meters (200 ms
in TWT). The thicker part of the section is located to the west of the study area where it
reaches a maximum thickness of 750 meters (900 ms in TWT). The red line corresponds
to a diachronous, west-to-east younging basal foreland basin unconformity, which in this
location is Late Oligocene in age.
A conspicuous element on the isochron map (Figure 18B) is a south-north, elongate
depocenter (maximum thickness of 500 meters ≈ 600 ms in TWT) that exhibits a fan-
shaped geometry typical of deltaic environments. During the Oligocene, this drainage
system was oriented south-to-north with its source area and sediment input from the
erosion of cratonic rocks in the Guayana Shield. These north-south drainages and linked

64
deltaic systems are supported by detrital zircon studies by Pindell et al. (2009), Xie et al.
(2010), and Xie and Mann (2014). Deltaic systems of this same age with multiple sandy
lobes host the most prolific reservoirs in the EEVB (Maturin sub-basin) and include the
Merecure Formation (Pereira, 1994; Yoris and Ostos, 1997; Rodríguez, 1999; James,
2000; Jácome, 2003) and the Oficina Formation (Pereira, 1994; Yoris and Ostos, 1997,
Rodríguez, 1999; Warne et al. 1999; Sánchez et al. 2011).
The Cretaceous unit is cut by northeast-striking normal faults with fault throws less
than 70 m. Figure 18D shows a 3D visualization in time of the fault system using the late
Cretaceous time structural top. Some of these faults appear to extend up into the
Paleogene section although they are difficult image at this higher level due to its chaotic
to transparent seismic facies of the Paleogene. I propose that these normal faults were
created as a result of the brittle flexure of the competent, late Cretaceous carbonate unit
during the development of the Late Oligocene foreland stage.
2.5.2. STAGE TWO: MIOCENE UNDERFILLED TO FILLED FORELAND STAGE OF THE
EEVB
An east-west-trending, northward-dipping platform with a dip angle of approximately
5 degrees northward is observed in the study area during the Late Oligocene (Figure 19A)
- a time marking the onset of the foreland tectonic setting in the Maturín sub-basin of the
EVB. The deepest part of the platform is found west of Trinidad probably as the result of
flexural deformation caused by the eastward migration of the EVB foreland basin system.
The maximum depth is observed at 12 km (6.2 seconds TWT) with its shallower, updip
depth in the south at 0.9 km (1 second TWT).

65
Figure 19. A. Time-structural map of the late Oligocene with contours spaced at 500 ms (TWT). Warm colors (red and yellow) represent the shallower areas of the late Oligocene (1000 ms to the south), whereas the dark colors (purple and blue) are the deeper zones (6500 ms to the north). The interpretation of my study area is within the white polygon, which was integrated with previous authors’ interpretation (areas outside of the white polygon). The white straight lines are the 2D seismic lines. B. Miocene isochron map (TWT in ms) with a contour interval of 300 ms. Warm colors (red and yellow) represent the thicker section (>3000 ms to the northwest), whereas the dark colors (purple and blue) are the thinner section (<200 ms to the northeast and south). C. Uninterpreted and interpreted seismic line NW – SE in time (TWT in ms) crossing the 3D seismic cube. The Miocene unit onlaps the late Oligocene unconformity and it exhibits two distinctive seismic patterns: the lower section is characterized by discontinuous reflections, while the upper section is higher amplitude with more continuous reflections. The top of the Miocene section is an erosional unconformity.

66
67
Following this flexural event, the latest Oligocene and Miocene foreland fill sequences
onlapped the basal foreland basin unconformity of Oligocene age (Figure 19D). The TWT
isochron map in Figure 19B shows the SW-NE-trending depocenter located to the
northwest of the study area and reaching a maximum thickness of 7 km. This is the main
depozone of the EEVB during this time and corresponds to the Miocene foredeep.
Southeastward of my study area, there is a second depocenter with a maximum thickness
of 1.5 km, which may indicate the influence of a deltaic sediment input from the south,
similar to the deltaic system described in the Paleogene. This Miocene delta is a likely
extension of the Miocene deltaic system that is well described to the west (Oficina
Formation). (Rodríguez, 1999; Warne et al. 1999)
During this period, a reorientation of the northern passive margin of South America
from east-west to more northeast-southwest occurred as a result of the onset of
convergent foreland deformation produced by the eastward motion of the Caribbean plate.
Within the Miocene unit bounded by red and yellow lines in Figure 19D, there are two
different seismic facies. The lower part between the red line and orange dotted-line in
Figure 19D is characterized by low amplitude and discontinuous seismic facies interpreted
as an unit deposited rapidly. This is thicker than the upper part, and the thickness
increases basinward, contrary to the previous Paleogene section.
The upper part of this unit bounded by orange and yellow dotted lines in Figure 19D
shows high amplitude, continuous reflectors which are truncated against the Late Miocene
unconformity shown by the yellow dotted line). The top of this sequence is characterized
by erosional features demonstrated by the presence of v-shaped contours in the structural
map of the Late Miocene (Figure 20A) and represent the presence of submarine canyons
and feeders for deep water deposition basinward (explained in section 2.4.1).
68
2.5.3. STAGE THREE: PLIO-PLEISTOCENE OVERFILLED-FORELAND-BASIN STAGE OF
THE EEVB
Figure 20A shows a time structure map of the Late Miocene horizon with its deepest
part is to the northeast (maximum depth 8.7 km ≈ 5 seconds) and its shallower part to the
south (< 800 meters). The structural map shows a WSW-trending, elongate synform open
to the Atlantic Ocean, in which the depocenter is migrating eastward relative to the Late
Oligocene depocenter. Additionally, the northwestern zone of the study area is uplifted
as a result of transrpressional deformation associated with west-to-east Caribbean Plate
movement. The southern flank of the synform is dipping 4 degrees northward and the
northern flank of the synform is steeper dipping at 10 degrees due to the proximity of the
fold-thrust belt.
Above this surface, the Plio-Pleistocene section onlaps the Late Miocene
unconformity. The main depocenter, known as the La Pica trough (Di Croce et al. 1999),
trends SW-NE oriented, and is interpreted as the Early to Middle Pliocene foredeep,
although Di Croce et al. (1999) defined this depozone as a “monocline isochron”. The
maximum thickness observed in this depocenter is 2.5 km. The orientation of the axis of
the synform is sub-parallel to the thrust deformation front. Two possible sediment source
areas have been been proposed by Yoris and Ostos (1997), Bowman (2003), Pindell et
al. 2009, Xie and Mann (2014): one is from the thrust-fold belt (northwest) and/or the proto-
Orinoco River from the southwest.
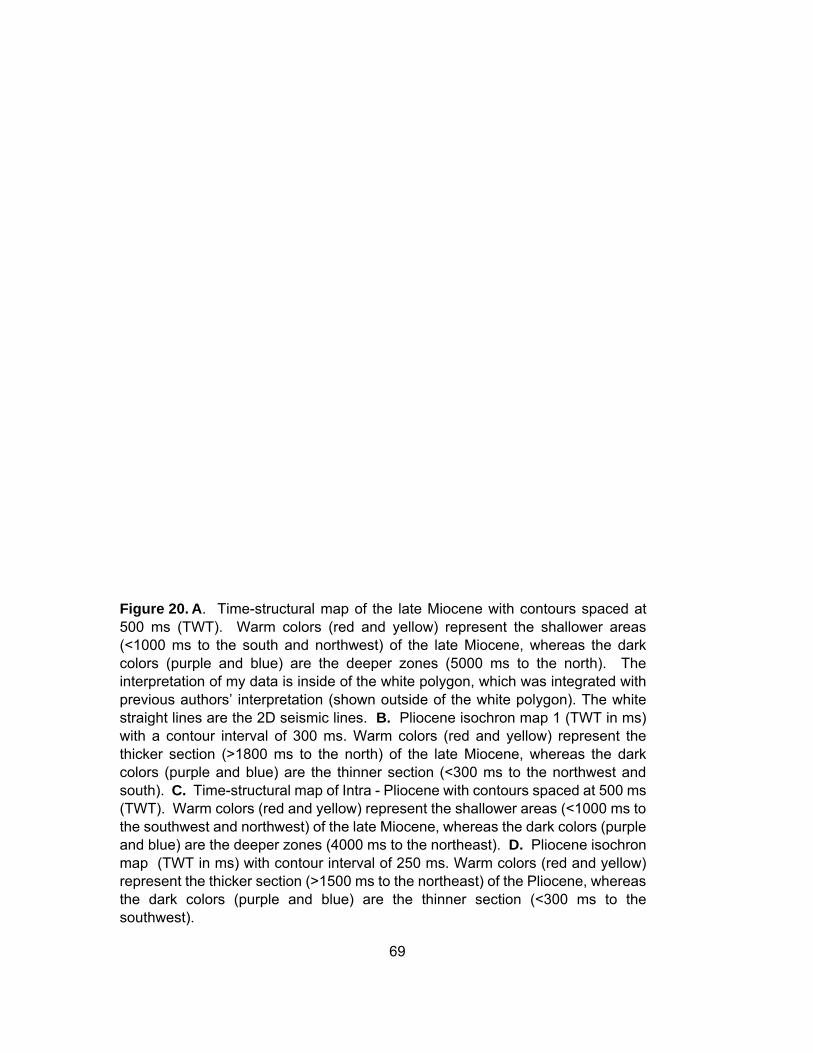
69
Figure 20. A. Time-structural map of the late Miocene with contours spaced at 500 ms (TWT). Warm colors (red and yellow) represent the shallower areas (<1000 ms to the south and northwest) of the late Miocene, whereas the dark colors (purple and blue) are the deeper zones (5000 ms to the north). The interpretation of my data is inside of the white polygon, which was integrated with previous authors’ interpretation (shown outside of the white polygon). The white straight lines are the 2D seismic lines. B. Pliocene isochron map 1 (TWT in ms) with a contour interval of 300 ms. Warm colors (red and yellow) represent the thicker section (>1800 ms to the north) of the late Miocene, whereas the dark colors (purple and blue) are the thinner section (<300 ms to the northwest and south). C. Time-structural map of Intra - Pliocene with contours spaced at 500 ms (TWT). Warm colors (red and yellow) represent the shallower areas (<1000 ms to the southwest and northwest) of the late Miocene, whereas the dark colors (purple and blue) are the deeper zones (4000 ms to the northeast). D. Pliocene isochron map (TWT in ms) with contour interval of 250 ms. Warm colors (red and yellow) represent the thicker section (>1500 ms to the northeast) of the Pliocene, whereas the dark colors (purple and blue) are the thinner section (<300 ms to the southwest).

70

71
Figure 20C corresponds to a TWT structural map for the intra-Pliocene-Pleistocene
horizon. The lack of biostratigraphic data for this section makes age estimates difficult.
Similarly to the previous section, the structural map shows a WSW-trending elongate
synform opening eastward to the Atlantic Ocean and Columbus foreland basin
(Garciacaro et al. 2011), although the deepest depocenter appears to have migrated
eastward relative to its previous location. By this time, the foredeep configuration
coincides precisely with the present-day fault system (Figure 3).
The deepest depocenter in the northeast reaches a maximum depth of 6 km (4
seconds) whereas the shallower, updip zone is less than 800 meters deep. The southern
flank of the synform dips 2 degrees while the northern flank dips steeper at an angel of 9
degrees to the south with the steeper angle likely controlled by the deformation associated
with the Trinidad fold-thrust belt.
Figure 20D shows the isochron map of the section deposited overlying the previous
structural map of Figure 20C; however, the lack of an isochron map of the same section
by previous workers like Di Croce (1996), Duerto (2007), and Figueira (2012) prevented
me from presenting a more regional map of this horizon. In this figure, the main
depocenter can be seen to migrate eastward from Trinidad and closer to the offshore
Columbus basin. The maximum thickness reached is 1.5 km.
The Plio-Pleistocene sequence is characterized by an aggradational and
progradational pattern to the northeast with continuous, high amplitude reflectors
representing the filling of the EEVB foreland basin and the progradation of the sequence
towards to the Atlantic passive margin. In general, this section exhibits a progradational
sigmoidal configuration with well-defined clinoforms, topsets showing a deltaic
environment, and downlaps in the more distal reaches the deepest part of the basin. I
72
interpret this sequence is an overall regressive wedge recording an eastward migration of
the shelf edge.
Growth faults are developed within this section and control local depocenters to the
east of Trinidad (Wood, 2000; Garciacaro et al. 2011). Rollover anticlines are formed
during normal fault offset on curving listric fault planes. Di Croce et al. (1999) and
Henriksen et al. (2011) proposed that the most prominent listric growth faults mark the
location of the Cretaceous shelf edge to the northeast of my study area. In this area, the
Paleogene and Miocene sequences are thinner and probably more shale-dominated,
making this area more unstable and prone for forming large normal detachments along
the top of the Cretaceous carbonate sequence.
Eastward migration of all observed depocenters is clear since Miocene time and
supportive of the west to east control by the migrating Caribbean plate. The Maturín sub-
basin of the EVB overfilled during Late Miocene - Early Pliocene as a result of high
sediment load of the Orinoco River, which resulted in spillover and rapid growth of the
Orinoco delta system in the Plio-Pleistocene (Bowman, 2003; Garciacaro et al. 2011).
2.6. DISCUSSION
2.6.1. PALEOGEOGRAPHY OF THE EEVB STUDY AREA
Paleogeographic maps were created for the EEVB based on the results of this study
and integration of my results with previous paleogeographic maps of the EVB by Ferrel et
al. (1974), Kiser (1994), Wynn (1995), Di Croce (1996), Pindell et al. (1998), Bartok (2003),
Duerto (2007), Taboada (2009), Escalona and Mann (2011), and Yang and Escalona
(2011). The tectonic settings established for the EEVB in all previous studies include: 1)
a passive margin since Jurassic to Early Cretaceous; and 2) a foreland basin since Late
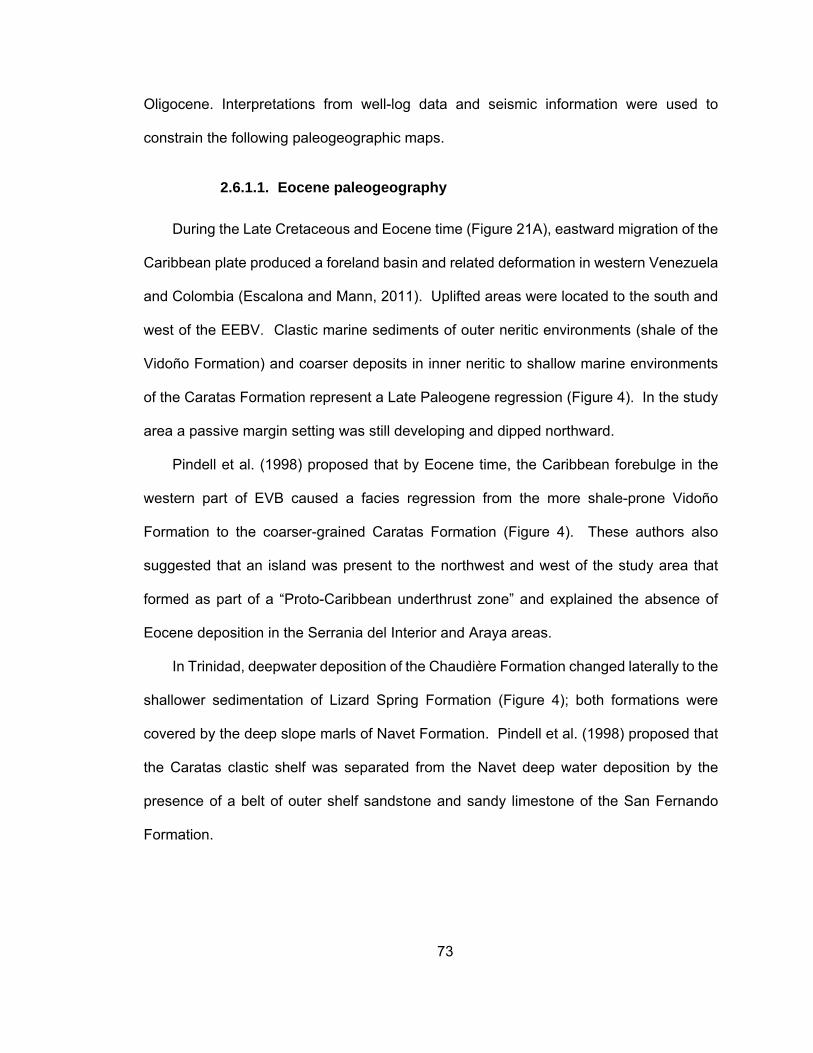
73
Oligocene. Interpretations from well-log data and seismic information were used to
constrain the following paleogeographic maps.
2.6.1.1. Eocene paleogeography
During the Late Cretaceous and Eocene time (Figure 21A), eastward migration of the
Caribbean plate produced a foreland basin and related deformation in western Venezuela
and Colombia (Escalona and Mann, 2011). Uplifted areas were located to the south and
west of the EEBV. Clastic marine sediments of outer neritic environments (shale of the
Vidoño Formation) and coarser deposits in inner neritic to shallow marine environments
of the Caratas Formation represent a Late Paleogene regression (Figure 4). In the study
area a passive margin setting was still developing and dipped northward.
Pindell et al. (1998) proposed that by Eocene time, the Caribbean forebulge in the
western part of EVB caused a facies regression from the more shale-prone Vidoño
Formation to the coarser-grained Caratas Formation (Figure 4). These authors also
suggested that an island was present to the northwest and west of the study area that
formed as part of a “Proto-Caribbean underthrust zone” and explained the absence of
Eocene deposition in the Serrania del Interior and Araya areas.
In Trinidad, deepwater deposition of the Chaudière Formation changed laterally to the
shallower sedimentation of Lizard Spring Formation (Figure 4); both formations were
covered by the deep slope marls of Navet Formation. Pindell et al. (1998) proposed that
the Caratas clastic shelf was separated from the Navet deep water deposition by the
presence of a belt of outer shelf sandstone and sandy limestone of the San Fernando
Formation.

74
Figure 21. Paleogeographic maps for the EEVB based on this study interpretation and compilation of previous paleogeographic maps by Ferrel et al. (1974), Kiser (1994), Wynn (1995), Di Croce (1996), Pindell et al. (1998), Bartok (2003), Duerto (2007), Taboada (2009), Escalona and Mann (2011), and Yang and Escalona (2011). The pink areas represent uplifted and eroded areas, the light yellow color corresponds to transitional to shallow marine environments, light green areas are the inner neritic environments, and light blue is outer neritic environments. A. Late Eocene passive margin stage. B. Late Oligocene stage when the foreland basin deformation associated with the Caribbean Plate movement started to affect the study area and a south to north drainage system was active. C. Middle Miocene underfilled foreland basin stage with south-to-north deltaic systems filling the foredeep. D. Early Pliocene filled foreland basin stage with sediment bypass towards the northeast. Since late Miocene the Orinoco River started filling the basin from the southwest and another change in the drainage pattern occurred. E. Plio-Pleistocene overfilled foreland basin stage shallow facies are prograding northeastward to the Columbus basin.

75

76
2.6.1.2. Late-Oligocene paleogeography
During the Oligocene, the main foredeep of the EVB was located in the Guárico sub-
basin (Figure 21B); however, as the Caribbean plate migrated eastward, the entire EVB
foreland basin system migrated into my study area of the EEVB, or eastern part of Maturín
sub-basin by Miocene. In the study area, the diachronous foreland unconformity is Late
Oligocene in age, but is older in the west. According to Pindell et al. (1998), the
culmination of oblique collision occurred during the Late Oligocene to Early Miocene and
led to the accretion of Caribbean allochthons and the prism above the original shelf, as
observed in Figure 21B. Authors such as Pindell et al. (1998) and Bartok (2003) proposed
the forebulge location was south of the study area in the Oligocene (Figure 21B).
The inner-shelf clastic rocks of the Jabillos Formation onlaps the Oligocene
unconformity and represents the onset of a local transgression due to the flexural
subsidence of the foreland basin (Figure 18C). This coarse sequence was overlain by
outer shelf shale of the Areo Formation of Oligocene age. Overlying this sequence is the
Naricual Formation Late Oligocene age which include clastic, shallow -marine deposits
(Figure 4).
Yoris and Ostos (1997) and Xie and Mann (2014) proposed a dual source of
sediments: one source is from the Guayana craton and the second source comes from
the fold-thrust belt north of the foreland basin. Cratonwards, this unit changes to a deltaic
facies of the Merecure Formation (González de Juana, 1980; Yoris and Ostos, 1997). In
Trinidad, deep water facies were dominant the deposition as it is represented by Cipero
Formation (Pindell et al. 1998) which are turbiditic deposits (Figure 4).
During Oligocene time, the drainage system consisted of a south-to-north flow from
the Guayana Shield as proposed by Warne et al. (1999), Escalona and Mann (2011) and

77
Xie and Mann (2014). This deltaic package represents one of the main reservoir rocks in
the EVB especially in the Guárico sub-basin (Rodríguez, 1999). Part of the hydrocarbon
accumulations in the Orinoco heavy oil belt have accumulated within this formation.
According to the isochron map showed in Figure 18B, there is a hypothetical south to
north Paleogene deltaic system from the Guayana Shield, which could be part of the
Oligocene drainage system and could represent a potential area of reservoir sands which
has not been tested. Xie et al. (2010) and Xie and Mann (2014) found that detrital zircon
samples in Eocene and Oligocene rocks in Trinidad are dominated by Precambrian grains
which correlates with Guayana Shield provenance, supporting the south-to-north paleo-
drainage system. However, Xie et al. (2010) and Xie and Mann (2014) proposed the onset
of the Proto Orinoco River in Trinidad during Late Oligocene based on major diversity of
ages from detrital zircon samples. Noguera et al. (2011) proposed a southwest-northeast
drainage system, encased within the Espino Graben, from western Venezuela and
Colombia to EVB since early Cretaceous according to zircon analysis.
2.6.1.3. Middle-Miocene paleogeography
As a result of the oblique collision between Caribbean and South American plates,
the topography in the northern of Venezuela was transformed during this time (Escalona
and Mann, 2011). To the west, the Andean Orogeny caused re-structuring of the drainage
system for all of northern South America. Díaz de Gamero (1996) proposed that the Proto-
Orinoco River, whose delta was filling the Falcon area of western Venezuela, changed its
course before Middle Miocene. This river was displaced eastward as the Caribbean Plate
also moved to the east. The Proto-Orinoco River was likely established in Central
Venezuela by this time. Wesselingh and Macsotay (2006) based on bivalve genus data,
estimated the presence of the proto-Orinoco River to the west of the EEVB based on its
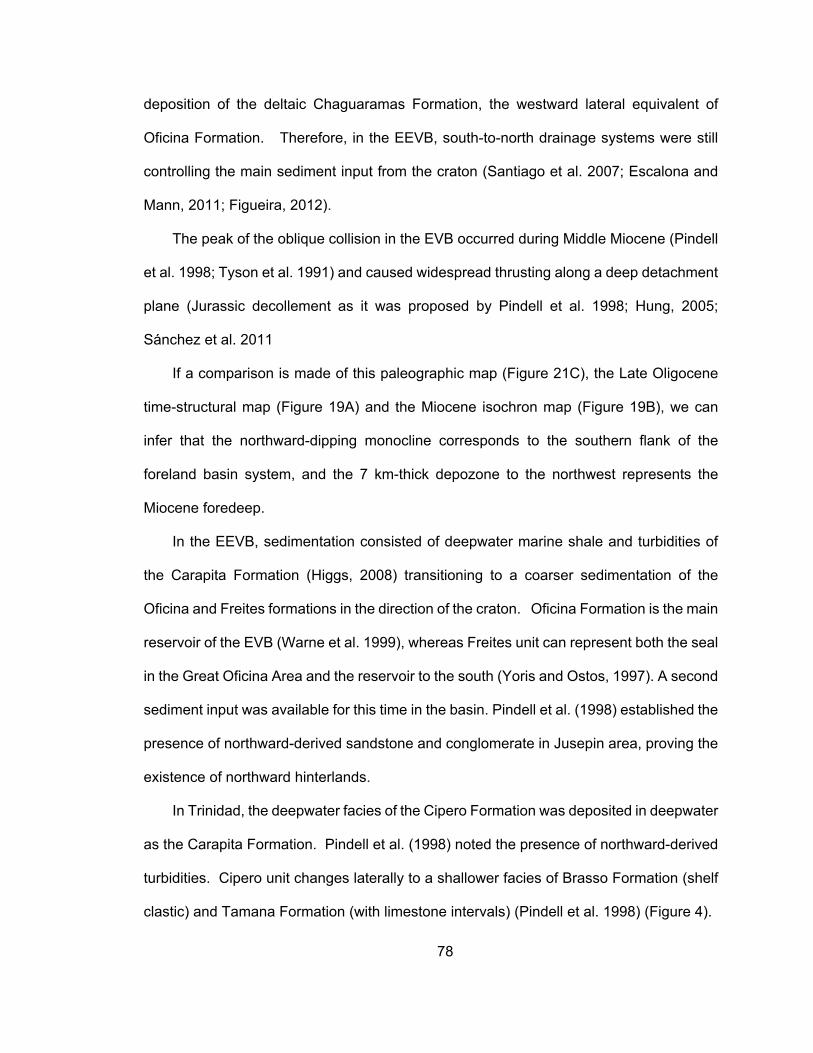
78
deposition of the deltaic Chaguaramas Formation, the westward lateral equivalent of
Oficina Formation. Therefore, in the EEVB, south-to-north drainage systems were still
controlling the main sediment input from the craton (Santiago et al. 2007; Escalona and
Mann, 2011; Figueira, 2012).
The peak of the oblique collision in the EVB occurred during Middle Miocene (Pindell
et al. 1998; Tyson et al. 1991) and caused widespread thrusting along a deep detachment
plane (Jurassic decollement as it was proposed by Pindell et al. 1998; Hung, 2005;
Sánchez et al. 2011
If a comparison is made of this paleographic map (Figure 21C), the Late Oligocene
time-structural map (Figure 19A) and the Miocene isochron map (Figure 19B), we can
infer that the northward-dipping monocline corresponds to the southern flank of the
foreland basin system, and the 7 km-thick depozone to the northwest represents the
Miocene foredeep.
In the EEVB, sedimentation consisted of deepwater marine shale and turbidities of
the Carapita Formation (Higgs, 2008) transitioning to a coarser sedimentation of the
Oficina and Freites formations in the direction of the craton. Oficina Formation is the main
reservoir of the EVB (Warne et al. 1999), whereas Freites unit can represent both the seal
in the Great Oficina Area and the reservoir to the south (Yoris and Ostos, 1997). A second
sediment input was available for this time in the basin. Pindell et al. (1998) established the
presence of northward-derived sandstone and conglomerate in Jusepin area, proving the
existence of northward hinterlands.
In Trinidad, the deepwater facies of the Cipero Formation was deposited in deepwater
as the Carapita Formation. Pindell et al. (1998) noted the presence of northward-derived
turbidities. Cipero unit changes laterally to a shallower facies of Brasso Formation (shelf
clastic) and Tamana Formation (with limestone intervals) (Pindell et al. 1998) (Figure 4).

79
In my study area, evidence for a south-to-north deltaic system is shown in Figure 15.
Strike and dip views illustrate the presence of clinoforms with topsets dipping southwards,
and downsets to the north and northeast onlaping the deepest part of the basin. This
sedimentation could be associated with a southward-derived deltaic system similar to
those known from the Oficina Formation (Rodríguez, 1999; Bartok, 2003; Summa, 2003;
Santiago et al. 2007).
2.6.1.4. Early Pliocene paleogeography
As the Caribbean plate moves eastward, the EVB foreland basin system migrates at
the same rate. During the Early Pliocene (Figure 21D), most of the EVB to the west of the
study area was filled or uplifted as a result of oblique collision leaving the main foredeep
to the southeast of Trinidad. During this time, the EVB acquired its present-day
configuration according to Escalona and Mann (2011). In general, the shape of the basin
was an SW-NE elongate depocenter with transitional and shallow water environments to
the south, west and north, but open marine to the northeast and east (Figure 21D).
Due to the lithospheric flexure associated with the foreland tectonic setting,
subsidence was created in the EEVB. In the southern flank, inner shelf sediments were
deposited overlying the deltaic systems previously described for Middle Miocene time
(Figure 21C); however, in the main Miocene depocenter towards the northwest, shallower
marine deposition of La Pica Formation covers the deep water facies of Carapita
Formation. In Trinidad, according to Jones (1995), bathyal deposition occurred associated
with Late-Miocene Lengua Formation, which is disrupted by the deepwater turbidites of
Karamat Formation.
According to Díaz de Gamero (1996), the proto-Orinoco river filled the EVB by the
late Miocene with a southwest-to-northeast drainage pattern as shown in Figure 21D.

80
Hoorn (1995) and Conti (2012) proposed that the tectonic uplift in Colombia and western
Venezuela caused the eastward migration of the Proto Orinoco River from Colombia
during Late Eocene to present-day configuration by Late Miocene. The amount of
sediment carried by the Proto-Orinoco River allowed to overfill the EEVB and contributes
to the spillover and progradation of fluvial and transitional facies eastward into the Atlantic
passive margin. Xie et al. (2010), Xie and Mann (2014), and Vincent et al. (2014) found
that during Late Miocene most of the sedimentation in Trinidad has Andean provenance
based on the heavy mineral record and ages of detrital zircons.
In my study area, a change in the drainage pattern from south-north to a southwest-
northeast is inferred respect to the previous sedimentation, as it was proposed by Diaz de
Gamero (1996), Uroza (2008), Xie et al. (2010) and Xie and Mann (2014). In my study
area, southwest to northeast submarine canyons are interpreted based on seismic
geomorphology and well information (described in section 2.4.2, Figure 16). Similar
canyons were also identified by Prieto (1987), Di Croce et al. (1999), and Sydow et al.
2003) to the east and southeast of the study area. Their orientation and characteristic
deepwater facies allows a link between them and fluvial-deltaic environments of the Proto-
Orinoco River to the west. The presence of a large and well-developed drainage systems
to the west (Pro-Orinoco River) and a major eustatic sea level fall during Late Miocene
(Messinian global sea level drop, Haq, 1988), perhaps enhanced by all the foreland basin
deformation in the basin, together may be the mechanism for the formation of the
submarine canyons.
2.6.1.5. Plio-Pleistocene paleogeography
The Plio-Pleistocene sequence is represented by a 9 km-thick deposit of fluvio-deltaic
facies that prograde eastwards as the Orinoco delta system into the Atlantic Ocean (Figure

81
21D). This thick deposit is due to tectonic subsidence enhanced by large drainage
systems from the west with high sedimentation rates (Wood, 2000; Henriksen et al. 2011).
Most of the EVB is uplifted or covered by Quaternary fluvial sedimentation and deltaic
facies on the platform (Figure 21D). Deepwater facies are being distributed eastwards
from Trinidad into the Columbus basin (Dasgupta and Buatois, 2012).
Plio-Pleistocene rocks are represented by neritic to transitional deposition of the La
Pica Formation overlain by coarse deposits of Las Piedras Formation and finally the
Quaternary river terraces of Mesa Formation (González de Juana, 1980, and Yoris and
Ostos, 1997) (Figure 4). In Trinidad, the Lower Cruse Formation is characterized by
prodelta sediments (Jones, 1995), changing vertically to more deltaic facies of Upper
Cruse, Forest, Mayaro, and Palmiste formations, all reflecting the eastward progradation
of the Orinoco Delta (Figure 21D). Uroza (2008). Chen et al. (2014), and Bowman and
Johnson (2014) proposed the Proto-Orinoco delta was southwest of Trinidad, during the
Late Pliocene (deposition of Morne L'Enfer and Mayaro formations), and that the delta
was tide-dominated (Dasgupta and Buatois, 2012; and Chen et al. 2014), probably
because the delta was located in the protected, proto-Columbus channel, and therefore
was not subject to erosion by large, ocean waves. Dasgupta and Buatois (2012) reported
the presence of paleo-submarine canyons within the Pliocene Mayaro Formation in the
eastern part of Trinidad, which support Chen (2014) interpretation.
2.6.2. FORELAND SEQUENCES AND PROPOSED FOREBULGES OF THE EEVB
Due to the west-to-east migration of EVB foredeeps, a vertical juxtaposition of the
depozones characterizes the overall foreland basin sequence (Figure 22A). DeCelles and
Horton (2003) state that it is common to find the foredeep deposition overlying the
forebulge as the foreland basin progrades in one direction.
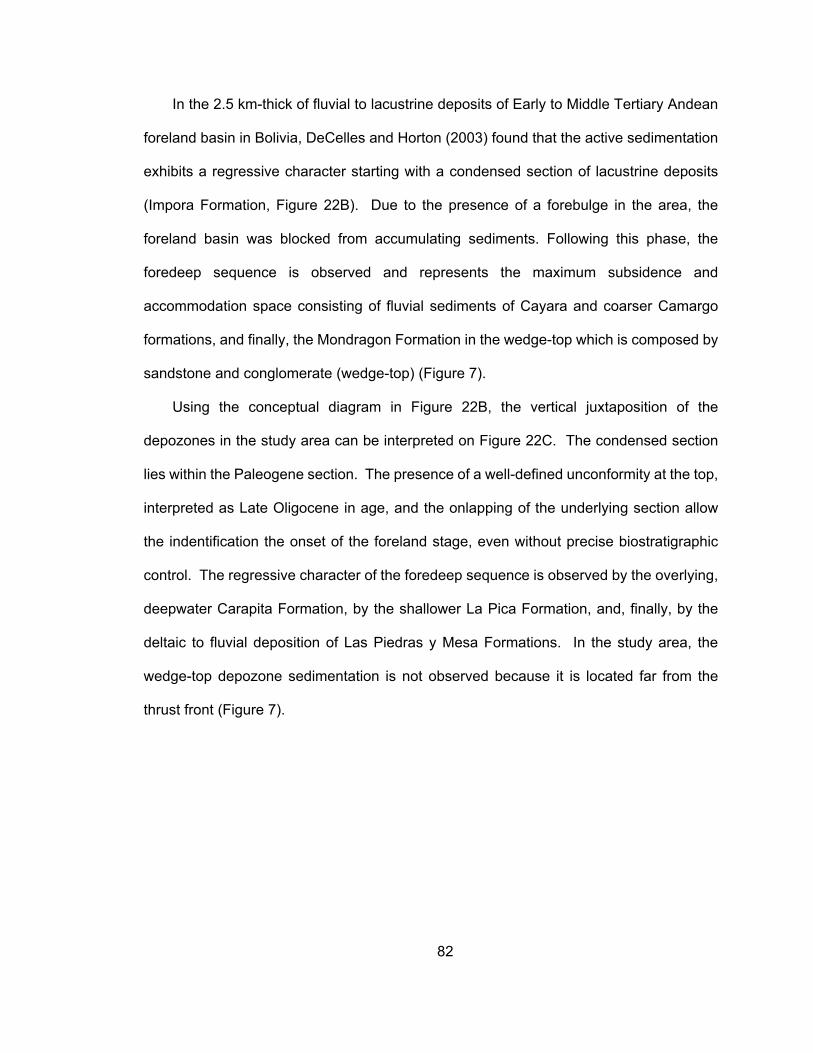
82
In the 2.5 km-thick of fluvial to lacustrine deposits of Early to Middle Tertiary Andean
foreland basin in Bolivia, DeCelles and Horton (2003) found that the active sedimentation
exhibits a regressive character starting with a condensed section of lacustrine deposits
(Impora Formation, Figure 22B). Due to the presence of a forebulge in the area, the
foreland basin was blocked from accumulating sediments. Following this phase, the
foredeep sequence is observed and represents the maximum subsidence and
accommodation space consisting of fluvial sediments of Cayara and coarser Camargo
formations, and finally, the Mondragon Formation in the wedge-top which is composed by
sandstone and conglomerate (wedge-top) (Figure 7).
Using the conceptual diagram in Figure 22B, the vertical juxtaposition of the
depozones in the study area can be interpreted on Figure 22C. The condensed section
lies within the Paleogene section. The presence of a well-defined unconformity at the top,
interpreted as Late Oligocene in age, and the onlapping of the underlying section allow
the indentification the onset of the foreland stage, even without precise biostratigraphic
control. The regressive character of the foredeep sequence is observed by the overlying,
deepwater Carapita Formation, by the shallower La Pica Formation, and, finally, by the
deltaic to fluvial deposition of Las Piedras y Mesa Formations. In the study area, the
wedge-top depozone sedimentation is not observed because it is located far from the
thrust front (Figure 7).

83
Figure 22. A. Schematic vertical juxtaposition of depozones in a foreland basin system (modified from DeCelles and Horton, 2003). B. Depozones and stratigraphic column of proposed for the foreland basin system of the EEVB. C. Lateral migration of the foreland basin system (modified from DeCelles and Horton, 2003). D. Forebulge migration inferred from this interpretation and modified from Bartok (2003) and Pindell (1998).

84

85
At the end of the Miocene, there is the appearance of a second recognizable
unconformity with an onlapping overlying section (Figure 19C). I infer this unconformity
to be the product of subaerial exposure and thus erosion because of the presence of a
large and well-developed drainage systems to the west (Pro-Orinoco River) combined with
a major eustatic sea level fall during Late Miocene (Messinian global sea level drop, Haq,
1988).
Di Croce et al. (1999) pointed out the similarity between this regional unconformity
and the Late Oligocene unconformity at the base of the EEVB foreland referred to it as
“secondary basal foredeep unconformity”. It is possible that this unconformity may record
an increase in subsidence rate and therefore resembles the main basal unconformity.
However, the onset of the filling of the basin by the Orinoco River in the Late Miocene
(Diaz de Gamero, 1996; Di Creoce, 1996; Di Croce et al. 1999; Duerto, 2007; Taboada,
2009) and the Messinian event (Haq, 1988) are both well documented in the literature.
From my observations, the secondary unconformity is the result of the combination of
different factors.
The forebulge is a structural high created due to the flexure of the lithosphere by
tectonic load (Figure 7). As the foreland basin system migrates laterally, the forebulge is
also expected to move in the direction in which the deformation propagates. However,
some elements could exist that prohibit the migration of the forebulge as proposed by
Bartok (2003) for the EVB forebulge. According to Bartok (2003), the actual EVB forebulge
is located between Merey fault and the Orinoco River (Figure 2). He proposed the
forebulge is a 250-300 km long structural high which is buried by Miocene – Pliocene
sediments. This feature plays an important role controlling both drainage systems and
hydrocarbon accumulations. In EVB, the forebulge acts as a giant anticlinal trap which
localizes the updip migration of the Orinoco Heavy Oil Belt (Figure 2).

86
Two hypotheses have been proposed for the EVB forebulge and its location in the
EVB. Pindell and Erikson (1994), Pindell et al. (1998), Santiago (2004), and Pindell et al.
(2009) state the migration of the forebulge is a function of the migrating thrust front from
the Late Paleocene in western Venezuela to its present-day position in the EVB
established by the Middle Miocene. They established that the structural high affected the
western part of the EVB (Figure 22D) since Late Eocene, when the upper Caratas
Formation was eroded. They present evidence for the erosion of the Tinajitas Member
(Caratas Formation) of Early - Middle Eocene age in the Serrania del Interior and
conglomeratic deep water deposits (San Fernando Formation) of Late Eocene - Early
Oligocene age in Trinidad including clasts of Tinajitas-like algal rhodoliths, suggesting the
existence of a paleo-high which was source of sediments for Trinidad (Pindell et al. 1998).
In contrast, Bartok (2003) states that the EVB forebulge did not moves significantly
as it was restricted by older crustal elements including the reactivated, Precambrian age
Merey fault and the Guayana Shield itself (Figure 2). In his view the Pirital thrust acts as
a buttress to block the further, southward migration of the thrust-fold belt, and therefore
the forebulge. Bartok (2003) proposed the formation of the forebulge in three stages:
Early Oligocene, Late Early Miocene, and Early Late Miocene. Taboada (2009)
mentioned that the lack of multiples and obvious unconformities within the active foreland
deposition does not support the idea of a migration of many forebulges. This is also
supported by Sánchez et al. (2011), who based on the eastward thinning of the lower
Miocene deposits, proposed the location of the forebulge in the southern flank of the EVB,
similarly to its present-day location.
In my study area of the EEVB, two unconformities were observed in my data: an older
one of Late Oligocene age is inferred to record the onset of the EVB foreland basin (Figure
18C) and a younger one of Late Miocene age is inferred to be related to a global eustatic

87
sea level drop enhanced by high sedimentation rates and tectonism (Figure 16A). I have
no subsurface evidence for a paleohigh or forebulge existing or migrating through my area
in the EEVB. Based on these observations and the overall regressive character of the
Neogene sequence (Figure 6), I propose that any forebulge in the EEVB was either south
of my study area after Late Oligocene time, or it did not migrate along the path proposed
by Bartok (2003).
2.6.3. PETROLEUM SYSTEM ELEMENTS AND BASIN MODELLING
The EVB is a prolific petroleum basin with more than 36 billion barrels of proven
reserves and ranking as the second major producing basin in Venezuela with 38 giant oil
fields and the Orinoco Heavy oil belt (513 billion barrels of extra heavy crude oil, US
Energy Information Administration, US EIA 2014) (Figure 2). The proven source rock is
the late Cretaceous Querecual Formation and its equivalents in Trinidad (Naparima and
Gautier formations) (Pereira et al. 1994; Summa et al. 2003; Hertig and Ver Hoeve, 2005)
(Figure 4). For the Querecual Formation, total organic carbon (TOC) values have been
reported to occur up to 11% (Pereira et al. 1994) and it consists of predominantly marine
algal kerogen. Figures 23A, 23B, and 23C show the subsidence plots with kerogen
maturation for Cretaceous source rock at three locations within my study area, the white
color outlines the main source rock.
Subsidence was slow during the Cretaceous and Early-Middle Paleogene, as
expected in a passive margin setting (Eriksson and Pindell, 1993). An abrupt increase in
the subsidence rate since Late Oligocene marks the onset of the foreland basin stage and
has a steeper slope in Well 1 (Figure 23B) because of its proximity to the thrust front. By
Middle Miocene, there was a secondary inflection in the subsidence rate and again during
the Late Miocene-Early Pliocene. The last subsidence increase was more pronounced to

88
the east along the Atlantic passive margin (figures 23A, 23B, and 23C). Eastward
progradation of the Orinoco Delta system may have enhanced the subsidence in this area
due to a high sedimentation rate since Pliocene (Bowman, 2003; Garciacaro, 2006; Uroza,
2008; Taboada, 2009; Henriksen et al. 2011)
According to Figures 23A and 23B, the source rock reached the oil window in both
areas of the EEVB during the Early Miocene, whereas the gas window was reached only
in well 1 following the Late Miocene. This difference in maturation is related to the location
in the deepest part of the basin proximal to the thrust front. To the east, the source rock
remains immature because this area lies in a passive margin setting that is lesser affected
by foreland basin-related subsidence. Hertig and Ver Hoeve (2005) found that the source
rock maturation in Trinidad occurred less than 5 ma (Late Miocene – Early Pliocene) due
to the progradation of the Proto Orinoco delta into the Columbus basin.
The main reservoirs for EVB are deltaic systems of Oligocene age (Merecure
Formation - González de Juana, 1980; Rohr, 1991; Pereira et al. 1994; Yoris and Ostos,
1997; Warne et al. 1999) and Miocene age (Oficina Formation and its proximal facies of
the Freites Formation – Pereira et al. 1994; Yoris and Ostos, 1997; Rodríguez, 1999;
Warne et al. 1999; Bartok, 2003; Summa, 2003), and occasionally some deepwater,
Miocene facies of Carapita Formation (Pereira et al. 1994; Yoris and Ostos, 1997; Pindell
et al. 1998; Sánchez et al. 2011). In the EEVB, the reservoirs likely include deltaic facies
of La Pica Formation (as in Pedernales field 70 km to the northwest), and fluvial facies of
Las Piedras Formation as corroborated by gas accumulations in Well 1 (sand/shale ratio
is approximately 90%) (Well 1 folder; Pereira, 1994).

89
Figure 23. Subsidence plots for three locations in the study area shown in inset map. The source rock is late Cretaceous in age and is highlighted by the white color. From west to east: A. Pseudo-well (depth and stratigraphic interpretation from this study). B. Well 1 based on information from the well report shown in Figure 8 extends to a depth of 4.7 km; from this depth to basement the lithology was inferred from nearby wells). C. Well 3 based on information from the well report shown in Figure 13. D. Critical element chart based on well information and literature.

90

91
In my study area, I propose Paleogene and Miocene deltaic systems are potential
deltaic reservoirs as proven in other areas to the west for the Oficina and Merecure
formations (Pereira et al. 1994; Yoris and Ostos, 1997, Pindell et al. 1998; Rodríguez,
1999; Bartok, 2003; Summa, 2003; Santiago et al. 2007). A petrophysical study carried
out in the Deltana Platform (Pereira et al. 1994), found a mean porosity of 15 percent and
thickness average of 55 ft for Quaternary reservoirs. In Pedernales Field, clastic reservoirs
of La Pica Formation exhibit porosities around 27% and permeability of 300 mD (Barnola,
1960; Venezuelan lexico webpage http://www.pdv.com/lexico/camposp/cp055.htm;
Perenco webpage; http://www.perenco.com/operations/latin-america/venezuela.html).
The most important seals in the EVB are represented by shale deposits of the Middle
Miocene Carapita Formation and distal facies of Freites Formation that both form very
effective sealing units (Pereira et al. 1994). Deltaic systems and sedimentation on the
shelf of the EEVB offer many opportunities for well-developed seal-reservoir pairs and
intraformational seal intervals as documented for the Oficina Formation in the Greater
Oficina area (Yoris and Ostos, 1997; Warne et al. 1999).
In the study area, traps are structural, stratigraphic, or mixed. In the Pedernales field,
for example, the trap is represented by a regional anticline formed as a result of shale
tectonics (lexico webpage http://www.pdv.com/lexico/camposp/cp055.htm). Within the
study area, Well 1 found gas accumulation in a stratigraphic trap related to fluvial deposits
as observed in seismic attribute extraction in which SW-NE channels were isolated. To
the northeast, in the Columbus basin, traps are rollover anticlines formed by growth
faulting (Rohr, 1991; Pereira et al. 1994; Wood, 2000; Garciacaro, 2006).
Migration is thought to occur: vertically along faults, as observed in the Columbus
Basin where listric fault planes detach along the top of the Cretaceous unit and connect
the Cretaceous source rock with overlying, Neogene reservoirs (Pereira et al. 1994); or

92
laterally, within the Cretaceous source section into pinchouts along the forebulge as
occurred for the Orinoco heavy oil belt (Pereira et al. 1994; Rodríguez, 1999; Bartok 2003).
Hertig and Ver Hoeve (2005) proposed and stratal-path migration from the Cretaceous
source rock in Trinidad; whereas, Rohr (1991) stated that the main migration paths are
vertical faults.
2.6.4. PROPOSED PETROLEUM PLAYS OF THE EEVB BASED ON NEW INFORMATION
PRESENTED IN THIS THESIS
The foreland tectonic sequence deposited after the Late Oligocene in the EEVB
presents high prospectivity for petroleum accumulations since this area is part of the EVB
which is one of the most prolific hydrocarbon basins in Venezuela. Moreover, the
presence of natural gas and oil seeps around the area (Summa et al. 2003; Escalona and
Mann, 2011) (Figure 2) provide firm evidence of a working petroleum system with a mature
source rock as shown on Figure 23.
According to my study, three type of plays have been identified: 1) Paleogene and
Miocene deltaic features (Figure 24A), described in section 4.1, represent potential
stratigraphic traps for hydrocarbons accumulations; 2) structural high antiform and top
truncations provide structural traps related to the Late Miocene erosional unconformity
(Figure 24B and 24C); and 3) sand facies within the growth strata related to the cinematic
of growth strata. In the first type of play, deltaic deposition could be associated with those
of Oficina and Merecure formations of Oligocene and Miocene age (figures 21B and 21C).
These depositional systems are part of the south to north drainage systems from Guayana
Shield and represent the main deltaic reservoirs in the EVB (Pereira et al. 1994; Yoris and
Ostos, 1997, Pindell et al. 1998; Rodríguez, 1999; Warne et al. 1999; Bartok, 2003;
Summa, 2003).

93
Figure 24. Proposed hydrocarbon plays for the study area. A. Play 1: Paleogene south to north deltaic system, similar to those for Merecure Formation to the west. B. Play 2: Time structural map of the Late Miocene within the 3D seismic data shows play 2, which consists of 2 prospects based on a Cretaceous source rock and a Miocene reservoir rock similar to well-known plays of the Oficina Formation, the main reservoir rock of the Maturin Sub-basin. C. Interpreted northwest to southeast seismic line showing prospect 2. D. Play 3: interpreted west – east seismic line showing the sandy facies associated to the growth strata.

94

95
The second type of play is four way-closure traps as shown in Figure 24B. Two
prospects were proposed. Prospect 1 is a small anticline sealed at the top by the Late
Miocene unconformity. This section was not penetrated during the drilling of Well 1
because of high reservoir pressures in the Plio-Pleistocene units due to gas
accumulations. The maximum column height until the spill point is 180 meters. Faults
within the Miocene section do represent vertical migration pathways from the main
Cretaceous source rock. In this well, the subsidence plot and the 1D basin modelling
(Figure 23B), estimated a mature source rock which reached the gas window during
Pliocene.
The second prospect is a larger four way-closure trap with an area of 20 km2. In
Figure 24C, the trap for this prospect is shown. The maximum column height observed
until the spill point is 250 meters. Vertical lineations interpreted as migration paths from
the mature source rock to the overlying trap are observed on seismic data (as those
vertical migration pathways referred by Pereira et al. 1994 in Columbus basin and Deltana
Platform). Potential reservoir could be sandstone deposits within the deep water facies of
Carapita Formation (Pereira et al. 1994; Yoris and Ostos, 1997, Pindell et al. 1998) (Figure
4). The third play (Figure 24D) corresponds to sandy facies within the growth strata
created due to the movement of normal listric faults. As it is observed, a rollover anticline
is on the hanging wall of the normal fault, which should be the main target for this play.
Additionally, during the Late Miocene – Early Pliocene, SW-NE submarine canyons
were identified in the study area (Figure 16). These canyons could be potentially linked
to basin floor fan deposits downdip in the Columbus basin or in the northeastern Deltana
Platform.
96
2.7. CONCLUSIONS
1) Four sequences were identified in the study area of the EEVB: Pre-Late
Cretaceous and Paleogene passive margin, filled to overfilled Miocene
foreland section and Plio-Pleistocene overfilled foreland section. Miocene to
recent deposition represents the active phase of foreland sedimentation in the
EVB.
2) Late Cretaceous and Paleogene time were characterized by deposition of an
east-west-trending passive margin dipping gently northwards as shown by a
north-to-south Paleogene delta mapped for the first time in this thesis. During
Late Oligocene, the foreland deformation caused the regional, northward dip
of the passive margin to change to a southward dip in the EEVB.
3) The thick Miocene section reflects the filling of the EEVB and a major change
from the passive margin to the foreland basin stage. In the lower section south
to north deltaic systems are observed but in the Late Miocene-Early Pliocene
section, southwest to northeast submarine canyons erode the upper Miocene
sequence and document the south-north to southwest-northeast rotation in
paleoflow direction.
4) The Plio-Pleistocene section of the EEVB represents an overfilled foreland
basin sequence that spills over into the Atlantic passive margin as the Orinoco
delta system. Deltaic and fluvial facies prograde towards the northeast due to
the large sediment influx from the Orinoco River, currently the world’s third
largest river system.
5) An eastward migration of EEVB depocenters observed since Late Oligocene
is related to the eastward migration of the Caribbean plate and its linked
foreland basin system.

97
6) The Late Miocene canyons are interpreted to represent the initial filling of the
offshore Columbus foreland basin to the east as the EVB became overfilled
from deltaic and shallow-marine deposits of the proto-Orinoco River.
7) The proven Late Cretaceous source rock has been mature in the EEVB
foreland tectonic setting since Early Miocene. On the Atlantic passive margin
southeast of the EEVB these source rocks are reaching the oil window and
may feed traps associated with growth faults and stratigraphic channels.
8) The hydrocarbon potential of the study area includes the Paleogene and
Miocene deltaic systems as well as the Plio-Pleistocene fluvial sedimentary
rocks deposited during the later overfilled stage of the EVB. Additionally,
presence of Late Miocene submarine canyons indicates that potential
reservoirs may have been generated by deepwater, basin-floor, sand fairways
fed by these canyons in the offshore Columbus basin.
98
2.8. REFERENCES
Administration, US Energy Information. "Venezuela - Full Report." (2014). 12 p. Aitken, Trevor, Paul Mann, Alejandro Escalona, and Gail L. Christeson. "Evolution of the
Grenada and Tobago basins and implications for arc migration." Marine and Petroleum Geology 28, no. 1 (2011): 235-258.
Algar, S.T., 1998, Tectonostratigraphic development of the Trinidad region. In J. Pindell
and C. Drake, eds., Palaeogeoraphic evolution and non-glacial eustasy, Northern South America. SEPM Special Publication No. 58, p. 87-109.
Arnaiz-Rodríguez, M. and Orihuela, N. "Curie Point Depth in Venezuela and the Eastern
Caribbean." Tectonophysics 590, no. 0 (2013): 38-51. Babonneau, N, et al. "Morphology and Architecture of the Present Canyon and Channel
System of the Zaire Deep-Sea Fan." Marine and Petroleum Geology 19, no. 4 (2002): 445-67.
Barnola, A., 1960. Historia del Campo de Pedernales. III Congreso Geologico
Venezolano, Caracas, Memoria: 2 (1959): 552-573. Bartok, P. "The Peripheral Bulge of the Interior Range of the Eastern Venezuela Basin
and Its Impact on Oil Accumulations." AAPG 79 (2003): 925 - 36. Bezada, M., Magnani, M., Zelt, C., Schmitz, M., and Schmitz, M. "The Caribbean–South
American Plate Boundary at 65° W: Results from Wide‐Angle Seismic Data." Journal of Geophysical Research: Solid Earth (1978–2012) 115, no. B8 (2010): 1-17.
Blum, MD., and Torbjörn, T. "Fluvial Responses to Climate and Sea-Level Change: A
Review and Look Forward." Sedimentology 47 (2000): 2-48. Bowman, A., and Johnson, H. "Storm‐dominated shelf‐edge delta successions in a high
accommodation setting: The palaeo‐Orinoco Delta (Mayaro Formation), Columbus Basin, South‐East Trinidad." Sedimentology 61, no. 3 (2014): 792-835.
Bowman, A. "Sequence Stratigraphy and Reservoir Characterisation in the Columbus
Basin, Trinidad." Thesis Dissertation, Imperial College of Science, Technology, and Medicine, University of London, 2003. 277 p.
Buatois, L., Santiago, N., Herrera, M., Steel, R., Espin, M., and Parra, K.
"Sedimentological and Ichnological Signatures of Changes in Wave, River and Tidal Influence along a Neogene Tropical Deltaic Shoreline." Sedimentology 59, no. 5

99
(2012): 1568-612. Butterworth, P., Cook, P., Dewanto, H., Drummond, M., Kiesow, U., McMahon, I., Ripple,
R., Setoputri, A., and Sidi, F. "Reservoir Architecture of an Incised Valley-Fill from the Nilam Field, Kutai Basin, Indonesia." Indonesian Petroleum Association 1 (2002): 537 - 55.
Callec, Y., Deville, E., Desaubliaux, G., Griboulard, R., Huyghe, P., Mascle, A., Mascle,
G., Noble, M., Padron, C., and Schmitz, J. "The Orinoco turbidite system: Tectonic controls on sea-floor morphology and sedimentation." AAPG bulletin 94, no. 6 (2010): 869-887.
Castillo, M. "Interpretación Sismo-Tectónica y Construcción de un Modelo Tridimensional
Integrado en el norte del Estado Monagas Venezuela." Unpublished BS thesis, Universidad Central de Venezuela, 2012. 170 p.
Chen, S., Steel, R., Dixon, J., and Osman, A. "Facies and Architecture of a Tide-
Dominated Segment of the Late Pliocene Orinoco Delta (Morne L'enfer Formation) SW Trinidad." Marine and Petroleum Geology 57, no. 0 (2014): 208-32.
Clark, S. A., A. Levander, M. B. Magnani, and C. A. Zelt. "Negligible convergence and
lithospheric tearing along the Caribbean–South American plate boundary at 64 W." Tectonics 27, no. 6 (2008): 1-19.
Conti, L. "Paleodrainage Systems." Drainage Systems edited by Salid Muhammad, 2012.
20 p. Dalrymple, R. "Incised Valleys in Time and Space: An Introduction to the Volume and an
Examination of the Controls on Valley Formation and Filling." Society for Sedimentary Geology 85 (2006): 8 p.
Dasgupta, S., and Buatois, L. "Unusual occurrence and stratigraphic significance of the
Glossifungites ichnofacies in a submarine paleo-canyon—Example from a Pliocene shelf-edge delta, Southeast Trinidad."Sedimentary Geology 269 (2012): 69-77.
Daza, J., and Prieto. Fallas de crecimiento en el área de Mapirito-Monagas Central. V.
Congreso Venezolano de Geofísica. Caracas. (1990): 142-149. DeCelles, P., and Giles, K. "Foreland basin systems." Basin Research 8, no. 2 (1996):
105-123. DeCelles, P. and Horton, B. "Early to Middle Tertiary Foreland Basin Development and
the History of Andean Crustal Shortening in Bolivia." Geological Society of America

100
Bulletin 115, no. 1 (2003): 58-77. DeCelles, PG, and Currie, BS. "Long-Term Sediment Accumulation in the Middle
Jurassic–Early Eocene Cordilleran Retroarc Foreland-Basin System." Geology 24, no. 7 (1996): 591-94.
Deptuck, M. et al. "Migration–Aggradation History and 3-D Seismic Geomorphology of
Submarine Channels in the Pleistocene Benin-Major Canyon, Western Niger Delta Slope." Marine and Petroleum Geology 24, no. 6 (2007): 406-33.
Di Croce, J. "Eastern Venezuela Basin: Sequence Stratigraphy and Structural Evolution."
Unpublished PhD Dissertation, Rice University, 1996. 225 p. Di Croce, J., Bally, A., and Vail, P. "Sequence stratigraphy of the eastern Venezuelan
basin." In P. Mann ed., Sedimentary Basins of the World 4 (1999): 419-476. Díaz de Gamero, M. "The Changing Course of the Orinoco River during the Neogene: A
Review." Palaeogeography, Palaeoclimatology, Palaeoecology 123, no. 1–4 (1996): 385-402.
Duerto, L., and McClay, K. "The Role of Syntectonic Sedimentation in the Evolution of
Doubly Vergent Thrust Wedges and Foreland Folds." Marine and Petroleum Geology 26, no. 7 (2009): 1051-69.
Duerto, L. "Shale Tectonics, Eastern Venezuelan Basin." Unpublished PhD Dissertation,
Royal Holloway University of London, 2007. 452 p. Duerto, L., and McClay, K. "3d Geometry and Evolution of Shale Diapirs in the Eastern
Venezuelan Basin." Poster Presentation at: Royal Holloway; PDVSA 2002. Duerto, L., and McClay, K. "Role of the Shale Tectonics on the Evolution of the Eastern
Venezuelan Cenozoic Thrust and Fold Belt." Marine and Petroleum Geology 28, no. 1 (2011): 81-108.
Erikson, J., and Pindell, J. "Analysis of Subsidence in Northeastern Venezuela as a
Discriminator of Tectonic Models for Northern South America." Geology 21, no. 10 (1993): 945-48.
Erlich, R., and Barrett, S. "Petroleum Geology of the Eastern Venezuela Foreland Basin."
Marine and Petroleum Geology 55 (1992): 341 - 62. Erlich, R., and Barrett, S. "Cenozoic Plate Tectonic History of the Northern Venezuela-
Trinidad Area." Tectonics 9, no. 1 (1990): 161-84.

101
Escalona, A., and Mann, P. "Tectonic controls of the right-lateral Burro Negro tear fault on
Paleogene structure and stratigraphy, northeastern Maracaibo Basin." AAPG bulletin 90, no. 4 (2006): 479-504.
Escalona, A., and Mann, P. "Tectonics, Basin Subsidence Mechanisms, and
Paleogeography of the Caribbean-South American Plate Boundary Zone." Marine and Petroleum Geology 28, no. 1 (2011): 8-39.
Escalona, A., Mann, P., and Jaimes, M. "Miocene to Recent Cariaco Basin, Offshore
Venezuela: Structure, Tectonosequences, and Basin-Forming Mechanisms." Marine and Petroleum Geology 28 (2011): 177 - 99.
EXGEO. "3D Punta Pescador Project Survey Department." 1997. 225 p. Ferrel, A., Bartok, P., and White, C. “Paleogeography of the Cretaceous and tertiary
periods for Venezuela and adjacent areas.” Internal Corpoven report. (1974): 35 p. Figueira, B. "An Examination of the Spatial and Temporal Evolution of a Complex
Transition Zone in the Gulf of Paria, Trinidad-Venezuela (Eastern Venezuela Basin/ EVB)." Unpublished Master Thesis. University of Stavanger, 2012. 81 p.
Gallango, O., and Parnaud, F. "Two-Dimensional Computer Modeling of Oil Generation
and Migration in a Transect of the Eastern Venezuela Basin." AAPG Special Volumes 62 (1995): 727 - 40.
Garciacaro, E. “Stratigraphic Architecture and Basin Fill Evolution of a Plate Margin Basin,
Eastern Offshore Trinidad and Venezuela.” Unpublished MS Thesis, University of Texas, 2006. 167 p.
Garciacaro, E., Mann, P. and Escalona, A. "Regional Structure and Tectonic History of
the Obliquely Colliding Columbus Foreland Basin, Offshore Trinidad and Venezuela." Marine and Petroleum Geology 28, no. 1 (2011): 126-48.
Gibson, R., Leon I., and Greeley, D. "Shelf Petroleum System of the Columbus Basin,
Offshore Trinidad, West Indies. I. Source Rock, Thermal History, and Controls on Product Distribution." Marine and Petroleum Geology 21, no. 1 (1// 2004): 97-108.
Gibson, R., and Leon I. "Shelf Petroleum System of the Columbus Basin, Offshore
Trinidad, West Indies. II. Field Geochemistry and Petroleum Migration Model." Marine and Petroleum Geology 21, no. 1 (2004): 109-29.
Gluyas, J., J. Oliver, and W. Wilson. "Pedernales oilfield, eastern Venezuela: The first 100

102
years." AAPG Bulletin 80, no. CONF-9609255 (1996). González de Juana, C., Iturralde, J, and Picard, X. Geología de Venezuela y de sus
Cuencas Petrolíferas. Ediciones Foninves, 1980. Hackley, P., Urbani, F., Karlsen, A. and Garrity, C., 2005, Geologic shaded relief map of
Venezuela. USGS, http://pubs.usgs.gov/of/2005/1038/sheet_1_screen.pdf. Haq, B. “Mesozoic and Cenozoic chronostratigraphy and cycles of sea-level change, in
Sea-Level Changes-An Integrated Approach.” Spec. Publ. Soc. Econ. Petrol. Mineral. v. 42. (1988): 71-108.
Harris, P, and Whiteway, T. "Global Distribution of Large Submarine Canyons:
Geomorphic Differences between Active and Passive Continental Margins." Marine Geology 285, no. 1–4 (7/1/ 2011): 69-86.
Henriksen, S., Ponten, A., Janbu, N., and Paasch, B. "The importance of sediment supply
and sequence-stacking pattern in creating hyperpycnal flows." (2011): 129-152. Henriksen, S., Helland‐Hansen, W., and Bullimore, S. "Relationships between shelf‐edge
trajectories and sediment dispersal along depositional dip and strike: a different approach to sequence stratigraphy." Basin Research 23, no. 1 (2011): 3-21.
Hertig, S., and Ver Hoeve, M. "Hydrocarbon Charge Analysis of the SECC Block,
Columbus Basin, Trinidad and Tobago."Caribbean Journal of Earth Science 39 (2005): 21-27.
Higgs, Roger. "Caribbean Plio-Quaternary (5-0 Ma) Plate Interaction and Basin
Development, Colombia-Venezuela-Trinidad Oil Province." In AAPG Annual Convention, San Antonio, Texas. 2008.
Hoorn, C. "An Environmental Reconstruction of the Palaeo-Amazon River System
(Middle–Late Miocene, NW Amazonia)." Palaeogeography, Palaeoclimatology, Palaeoecology 112, no. 3–4 (1994): 187-238.
Horton, B., Hampton, B., and Waanders, GL. "Paleogene Synorogenic Sedimentation in
the Altiplano Plateau and Implications for Initial Mountain Building in the Central Andes." Geological Society of America Bulletin 113, no. 11 (2001): 1387-400.
Horton, B., and DeCelles, P. "The Modern Foreland Basin System Adjacent to the Central
Andes." Geology 25, no. 10 (1997): 895-98. Hung, E. "Thrust Belt Interpretation of the Serranía del Interior and Maturín Subbasin,
103
Eastern Venezuela." in Avé Lallemant, H.G., and Sisson, V.B., eds., Caribbean–South American plate interactions, Venezuela: Geological Society of America Special Paper 394. (2005): 251–270.
Hung, E. “Foredeep and thrust belt interpretation of the Maturin Sub-Basin, Eastern
Venezuela basin”. Unpublished MA thesis, Rice University. (1997): 125 p. Jácome, M., Rondón, K., Schmitz, M., Izarra, C., and Viera, E. "Integrated Seismic,
Flexural and Gravimetric Modelling of the Coastal Cordillera Thrust Belt and the Guárico Basin, North-Central Region, Venezuela." Tectonophysics 459, no. 2008 (2008): 27 - 37.
Jácome, M., Kusznir, N., Audemard, F., and Flint, S. "Tectono-Stratigraphic Evolution of
the Maturin Foreland Basin: Eastern Venezuela." AAPG 79 (2003): 735 - 49. Jácome, M., Kusznir, N., Audemard, F., and Flint, S. "Formation of the Maturín Foreland
Basin, Eastern Venezuela: Thrust Sheet Loading or Subduction Dynamic Topography." Tectonics 22, no. 5 (2003): 17.
James, K. "The Venezuelan Hydrocarbon Habitat, Part 2: Hydrocarbon Occurrences and
Generated-Accumulated Volumes." Journal of Petroleum Geology 23, no. 2 (2000): 133-64.
Jones, R. "Palaeoenvironmental Interpretation of the Late Miocene and Pliocene of
Trinidad Based on Micropalaeontological Data." (1995). 3rd Geological Conference of the Geological Society of Trinidad and Tobago: 86 – 101.
Kiser, G. “Santa Marta Massif: A major element in the tectonic-sedimentary evolution of
northern South America.” V Simposio Bolivariano, Exploración Petrolera en las Cuencas Subandinas, Puerto La Cruz, Memoria. (1994): 317-364.
Locke, B., and Garver, J. "Thermal Evolution of the Eastern Serranía Del Interior Foreland
Fold and Thrust Belt, Northeastern Venezuela, Based on Apatite fission-Track Analyses." in Avé Lallemant, H.G., and Sisson, V.B., eds., Caribbean–South American plate interactions, Venezuela: Geological Society of America Special Paper 394. (2005): 315–328,
Lugo, J, and Mann, P. "Jurassic-Eocene tectonic evolution of Maracaibo basin,
Venezuela." Petroleum Basins of South America (1995): 699-725. Martin, J., Cantelli, A., Paola, C, Blum, M., and Wolinsky, M. "Quantitative Modeling of the
Evolution and Geometry of Incised Valleys." Journal of Sedimentary Research 81, no. 1 (2011): 64-79.
104
Moscardelli, L. "Mass Transport Processes and Deposits in Offshore Trinidad and
Venezuela, and Their Role in Continental Margin Development." Unpublished PhD Dissertation, University of Texas, 2007. 172 p.
Navas, M. "Evaluación Exploratoria Del Área Punta Pescador, Delta Amacuro."
Unpublished BS Thesis, Universidad Simón Bolívar, 2006. 85 p. Noguera, M. I., J. E. Wright, F. Urbani, and J. Pindell. "U-Pb Geochronology of detrital
zircons from the Venezuelan passive margin: implications for an Early Cretaceous Proto-Orinoco river system and Proto-Caribbean ocean basin paleogeography." Geologica Acta 9, no. 3-4 (2011): 265-272.
Nordfjord, S., Goff, J., Austin, J., and Gulick, S. "Seismic Facies of Incised-Valley Fills,
New Jersey Continental Shelf: Implications for Erosion and Preservation Processes Acting During Latest Pleistocene–Holocene Transgression." Journal of Sedimentary Research 76, no. 12 (2006): 1284-303.
Norville, G., and Dawe, R. "Carbon and Hydrogen Isotopic Variations of Natural Gases in
the Southeast Columbus Basin Offshore Southeastern Trinidad, West Indies – Clues to Origin and Maturity." Applied Geochemistry 22, no. 9 (9// 2007): 2086-94.
Parnaud, F., Gou, Y., Pascual, J., Truskowski, I., Gallango, O. Passalacqua, H. and
Roure, F. "Petroleum Geology of the Central Part of the Eastern Venezuelan Basin." American Association of Petroleum Geologists Memoirs (1995): 741-41.
Parra, M., Sánchez, G., Montilla, L., Guzmán, O., Namson, J., and Jácome, M. "The
Monagas Fold–Thrust Belt of Eastern Venezuela. Part I: Structural and Thermal Modeling." Marine and Petroleum Geology 28, no. 1 (2011): 40-69.
PDVSA, CVP. "Final Report 2d Punta Pescador Project Survey Department." 2000. 69 p. Pérez de Armas, J. "Tectonic and Thermal History of the Western Serranía Del Interior
Foreland Fold and Thrust Belt and Guárico Basin, North-Central Venezuela: Implications of New Apatite Fission-Track Analysis and Seismic Interpretation." Geological Society of America Special Papers 394 (2005): 271-314.
Pereira, J., Porras, L., Daza, J., Kinslow, L., Eggertson, B., and Chapin, R.. “Venezuela
/Trinidad Plataforma Deltana Regional Hydrocarbon study.” Technical report. (1994). 300 p.
Perenco webpage, http://www.perenco.com/operations/latin-america/venezuela.html.

105
Pindell, J., and Kennan, L. "Processes & Events in the Terrane Assembly of Trinidad and E. Venezuela." In GCSSEPM Foundation 21st Annual Research Conference Transactions, Petroleum Systems of Deep-Water Basins, pp. 159-192. 2001.
Pindell, J. "Cenozoic Palinspastic Reconstruction, Paleogeographic Evolution and
Hydrocarbon Setting of the Northern Margin of South America." In J. L. Pindell and C. Drake ed., Paleogeographic Evolution and Non-glacial Eustacy: North America, Tulsa Oklahoma: Society for Sedimentary Geology, v. 58. (1998): 45-85.
Pindell, J., Kennan, L., Wright, D., and Erikson, J. "Clastic Domains of Sandstones in
Central/Eastern Venezuela, Trinidad, and Barbados: Heavy Mineral and Tectonic Constraints on Provenance and Paleogeography." Geological Society, London, Special Publications 328, no. 1 (2009): 743-97.
Prieto, R. "Seismic Stratigraphy and Depositional Systems of the Orinoco Platform Area,
Northeastern Venezuela." Unpublished PhD dissertation, The University of Texas, 1987. 144 p.
Rodríguez, L. “Tectonic analysis, stratigraphy and depositional history of the Miocene
sedimentary section, central Eastern Venezuela basin”. Unpublished PhD dissertation, The University of Texas at Austin. (1999). 118 p.
Reijenstein, H., Posamentier, H., and Bhattacharya, J. "Seismic Geomorphology and
High-Resolution Seismic Stratigraphy of Inner-Shelf Fluvial, Estuarine, Deltaic, and Marine Sequences, Gulf of Thailand." AAPG Bulletin 95, no. 11 (2011): 1959-90.
Rohr, G. "Exploration potential of Trinidad and Tobago." Journal of Petroleum Geology 14,
no. 2 (1991): 343-354. Rohr, G. "Paleogeographic Maps, Maturin Basin of Eastern Venezuela and Trinidad." 3rd
Geological Conference, Geological Society of Trinidad & Tobago, Port-of-Spain, 1990. Roure, F., Carnevali, J., Gou, Y., and Subieta, T. "Geometry and Kinematics of the North
Monagas Thrust Belt (Venezuela)." Marine and Petroleum Geology 11, no. 3 (1994): 347-62.
Sánchez, G., Baptista, N., Parra, M., Montilla, L., Guzmán, O. and Finno, A. "The Monagas
Fold–Thrust Belt of Eastern Venezuela. Part II: Structural and Paleo-Geographic Controls on the Turbidites Reservoir Potential of the Middle Miocene Foreland Sequence." Marine and Petroleum Geology 28, no. 1 (2011): 70-80.
Sánchez, J., Götze, H., and Schmitz, M. "A 3-D Lithospheric Model of the Caribbean-
South American Plate Boundary.” International Journal of Earth Sciences 100, no. 7

106
(2011): 1697-712. Sánchez-Rojas, J. "New Bouguer Gravity Maps of Venezuela: Representation and
Analysis of Free-Air and Bouguer Anomalies with Emphasis on Spectral Analyses and Elastic Thickness." International Journal of Geophysics 2012 (2012). 1-14.
Santiago, N., Parra, K., and Steel, Ron. "Tectonic Generation of Early Miocene
Transgressive Fill of the Eastern Venezuela Basin (Maturin Sub-Basin)." In AAPG, Annual Meeting, Long Beach, California. 2007.
Santiago, N., Duerto, L., Olivares, C., Rojas, S. Eocene - Oligocene forebulge Migration
in Central Venezuela: GAC/MAC, St. Catherines, Poster (2005). Schenk, C., Cook, T., Charpentier, R., Pollastro, R., Klett, T., Tennyson, M., Kirschbaum,
M., Brownfield, M., and Pitman, J. "An estimate of recoverable heavy oil resources of the Orinoco Oil Belt, Venezuela." Assessment (1981): 3.
Stainforth, R. "Was It the Orinoco?: Geologic Notes." AAPG Bulletin 62, no. 2 (1978): 303
- 06. Summa, L., Goodman, E., Richardson, M., Norton, I., and Green, A. "Hydrocarbon
Systems of Northeastern Venezuela: Plate through Molecular Scale-Analysis of the Genesis and Evolution of the Eastern Venezuela Basin." Marine and Petroleum Geology 20, no. 3–4 (2003): 323-49.
Sydow, J., Finneran, J., and Bowman, A. "Stacked shelf-edge delta reservoirs of the
Columbus Basin, Trinidad, West Indies." Shelf-Margin Deltas and Linked Downslope Petroleum Systems (2003): 441-465.
Sylvester, Z., Deptuck, M., Prather, B., Pirmez, C., and O’Byrne, C. "Seismic Stratigraphy
of a Shelf-Edge Delta and Linked Submarine Channels in the Northeastern Gulf of Mexico." Application of the Principles of Seismic Geomorphology to Continental-Slope and Base-of-Slope Systems: Case Studies from Seafloor and Near-Seafloor Analogues (2012): 31-59.
Taboada, G. "Tectonostratigraphic Evolution of the Northeastern Maturin Foreland Basin,
Venezuela." Master thesis, The University of Texas at Austin, 2009. 113 p. Tyson, L., Babb, S., and Dyer, B.. "Middle Miocene Tectonics and Its Effects on Late
Miocene Sedimentation in Trinidad." Geological Conference of the Geological Society of Trinidad and Tobago 2 (1991): 26 - 41.
Uroza, C. Processes and Architectures of Deltas in Shelf-break and Ramp Platforms:
107
Examples from the Eocene of West Spitsbergen (Norway), the Pliocene Paleo-Orinoco Delta (SE Trinidad), and the Cretaceous Western Interior Seaway (S Wyoming & NE Utah).” Thesis Dissertation, University of Texas, 2008. 261 p.
USGS, 2000, U.S. Geological survey world petroleum assesment 2000- description and
results. USGS digital data series DDS-60 muti disc set version 1.1 2000, U.S. Geological Survey world energy assesment team.
USGS, 2003, Earthquake hazards program. http://neic.usgs.gov/neis/epic/epic_rect.html
accessed 07/16/2009. Venezuelan léxico webpage, http://www.pdv.com/lexico/camposp/cp055.htm Vincent, H., Wach, G., and Ketannah, Y. "Heavy mineral record of Andean uplift and
changing sediment sources across the NE margin of South America: a case study from Trinidad and Barbados." Geological Society, London, Special Publications 386, no. 1 (2014): 217-241.
Warne, A., Meade, R., White, W., Guevara, E., Gibeaut, J., Smyth, R., Aslan, A., and
Tremblay, T. "Regional controls on geomorphology, hydrology, and ecosystem integrity in the Orinoco Delta, Venezuela." Geomorphology 44, no. 3 (2002): 273-307.
Warne, A., Guevara, E., and Aslan, A. "Late quaternary evolution of the Orinoco Delta,
Venezuela." Journal of Coastal Research (2002): 225-253. Warne, A., Aslan, A., White, W., Gibeaut, J., Tremblay, T., Smyth, R., Guevara, E.,
Gutierrez, R., Hovorka, S., and Raney, J. "Final Report Year Two: Geoenvironmental characterization of the Delta del Orinoco."Report to Petróleos de Venezuela: The University of Texas at Austin Bureau of Economic Geology (1999).
Wesselingh, F., and Macsotay, O. "Pachydon hettneri as indicator for Caribbean–
Amazonian lowland connections during the Early–Middle Miocene." Journal of South American Earth Sciences 21, no. 1 (2006): 49-53.
Wood, L. "Chronostratigraphy and tectonostratigraphy of the Columbus Basin, eastern
offshore Trinidad." AAPG Bulletin 84, no. 12 (2000): 1905-1928. Xie, X., Mann, P, and Escalona, A. "Regional provenance study of Eocene clastic
sedimentary rocks within the South America–Caribbean plate boundary zone using detrital zircon geochronology." Earth and Planetary Science Letters 291, no. 1 (2010): 159-171.

108
Xie, X., and Mann, P. "U–Pb detrital zircon age patterns of Cenozoic clastic sedimentary rocks in Trinidad and its implications." Sedimentary Geology 307 (2014): 7-16.
Yang, W; and Escalona, A. "Tectonostratigraphic Evolution of the Guyana Basin." AAPG
Bulletin 95, no. 8 (2011-08 2011): 1339 - 68. Yoris, F., and Ostos, M. "Geology of Venezuela: General Geology and Oil Basins." WEC
1997 Well Evaluation Conference 1st Edition (1997): 44. Zapata, V. "Interpretación Sísmica Estructural Y Definición De Oportunidades En El Área
De Punta Pescador, Costa Afuera.". Unpublished BS Thesis. Universidad Simón Bolívar 2012. 133 p.