
Massachusetts Economic Outlook – The Role of Housing Barry Bluestone Dean, School of Social...
29
Massachusetts Economic Outlook – The Role of Housing Barry Bluestone Dean, School of Social Science, Urban Affairs, and Public Policy Director, Center for Urban and Regional Policy Northeastern University Real Share Boston Sheraton Boston Boston, MA May 16, 2007
-
Upload
barry-gray -
Category
Documents
-
view
213 -
download
0
Transcript of Massachusetts Economic Outlook – The Role of Housing Barry Bluestone Dean, School of Social...

Massachusetts Economic Outlook – The Role of Housing
Barry BluestoneDean, School of Social Science, Urban Affairs, and Public PolicyDirector, Center for Urban and Regional PolicyNortheastern University
Real Share Boston Sheraton Boston Boston, MA May 16, 2007

Massachusetts Employment Trends (1995-2007)

U.S. - Employment - 1996-2006
125.7
129.6131.5
133.4
136.9 136.9 136.5 137.7139.3
141.4
144.6
115
120
125
130
135
140
145
150
1996 1997 1998 1999 2000 2001 2002 2003 2004 2005 2006

Massachusetts - Employment - 1996-2006
3105.5
3171.8
3220.5
3254.6
3283.03263.4
3234.4
3201.5 3199.5 3205.13230.6
3000
3050
3100
3150
3200
3250
3300
1996 1997 1998 1999 2000 2001 2002 2003 2004 2005 2006

2007 Massachusetts Statistics January-March 2007: Employment up 8,000
jobs; unemployment down nearly 32,000 Unemployment rate down from 5.3% to
4.4% … But Labor Force down by 24,000 The drop in unemployment of nearly 32,000
may have been due to unemployed leaving the labor force or leaving the state

Massachusetts Total Employment (2005-2006) (Seasonally Adjusted)
2700.0
2800.0
2900.0
3000.0
3100.0
3200.0
3300.0
3400.0
3500.0
February 2001
3,372.9
2,950.4
3,167.1
3,224.7
Jan ’95 – Feb ’01: +422,500
Feb ’01 – Dec ’03: -205,800
Dec ’03 – Dec ’06: +57,600
Jan ’07 – Mar ’07: +8,086

Massachusetts Total Construction Employment (1995-2006) (Seasonally Adjusted)
0.0
20.0
40.0
60.0
80.0
100.0
120.0
140.0
160.0
November 2002
141,600 141,500
89,400
Jan ’95 – Nov ’02: + 52,200 Nov ’02 – Dec ’06: -100
Jan ’07 – Mar ’07: -3,700
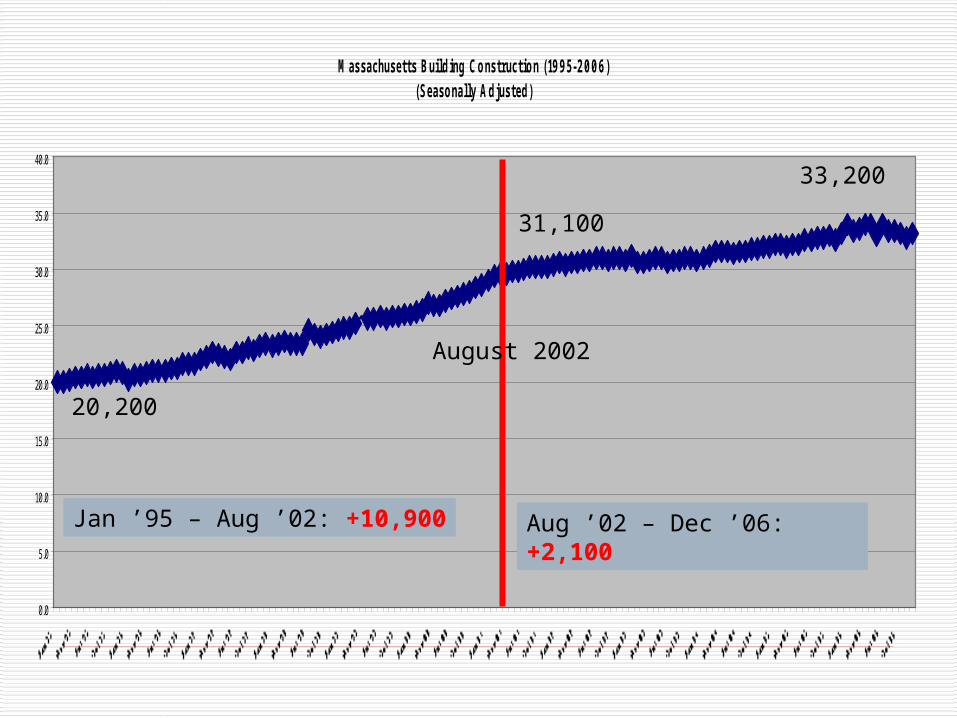
Massachusetts Building Construction (1995-2006) (Seasonally Adjusted)
0.0
5.0
10.0
15.0
20.0
25.0
30.0
35.0
40.0
August 2002
31,100
33,200
20,200
Jan ’95 – Aug ’02: +10,900 Aug ’02 – Dec ’06: +2,100
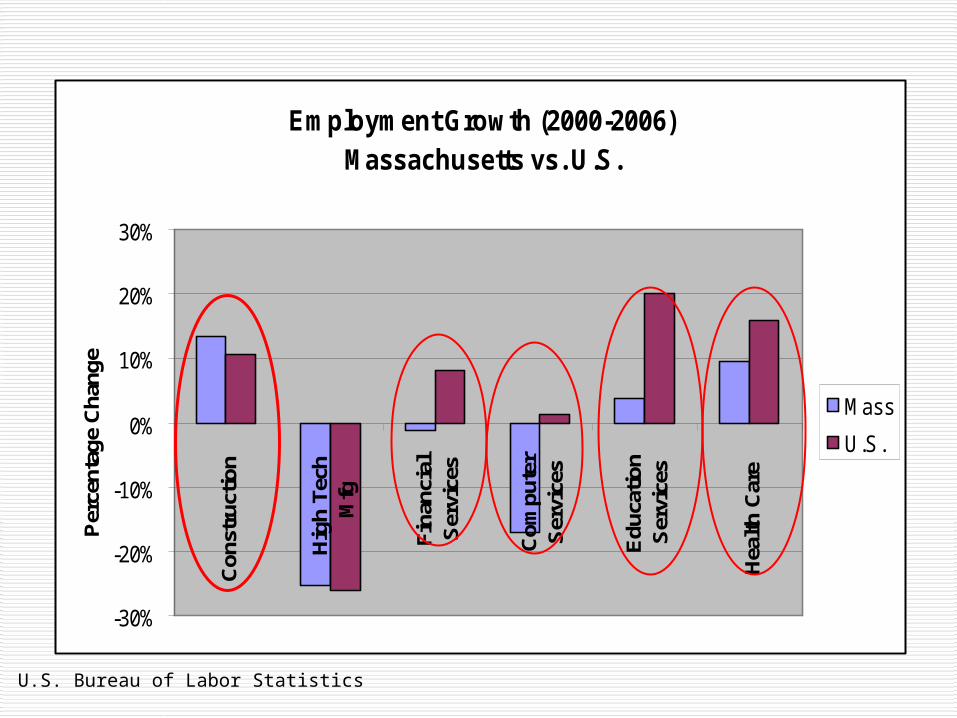
Employment Growth (2000-2006) Massachusetts vs. U.S.
-30%
-20%
-10%
0%
10%
20%
30%C
onst
ruct
ion
Hig
h Te
chM
fg
Fina
ncia
lS
ervi
ces
Com
pute
rS
ervi
ces
Edu
catio
nS
ervi
ces
Hea
lth C
are
Per
cent
age
Cha
nge
Mass
U.S.
U.S. Bureau of Labor Statistics

Massachusetts Population Trends
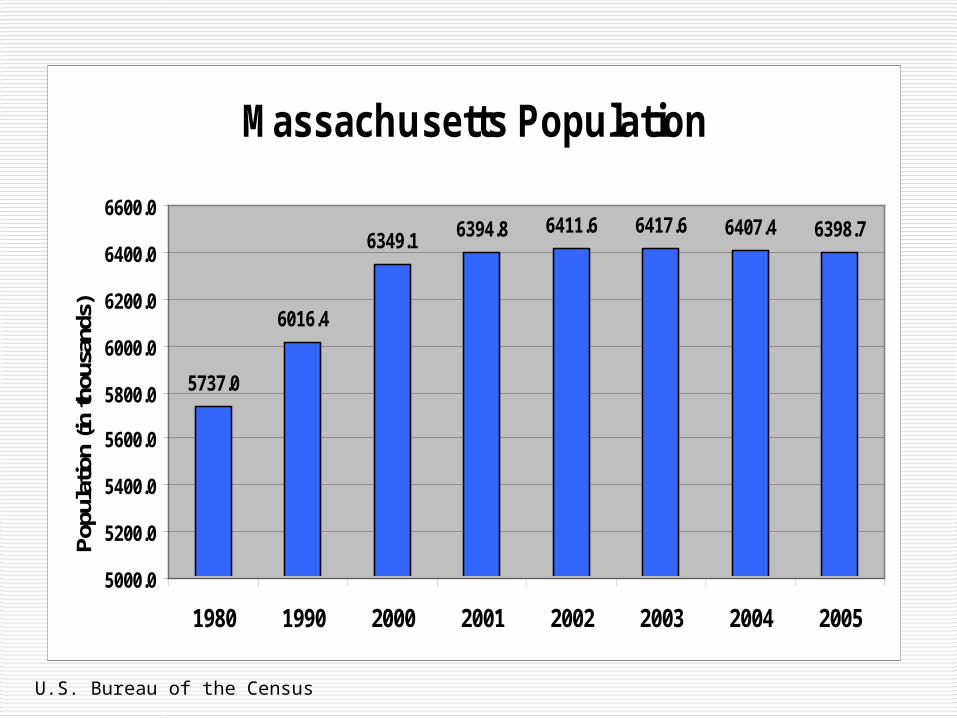
Massachusetts Population
5737.0
6016.4
6349.1 6394.8 6411.6 6417.6 6407.4 6398.7
5000.0
5200.0
5400.0
5600.0
5800.0
6000.0
6200.0
6400.0
6600.0
1980 1990 2000 2001 2002 2003 2004 2005
Popu
latio
n (in
thou
sand
s)
U.S. Bureau of the Census

Massachusetts Net Migration (2000-2005)
33,292 33,347 31,785 29,041 26,515
-22,892
-39,506-48,514
-61,980 -60,053-70,000
-50,000
-30,000
-10,000
10,000
30,000
50,000
2000-2001 2001-2002 2002-2003 2003-2004 2004-2005
Foreign Immigration Internal Migration
U.S. Census Bureau

Population Change by Age Cohort (2000-2004)
-10%
-5%
0%
5%
10%
15%
20%
25%
Under 5 5 to 19 20-24 25-34 35-54 55-64 65+
Age Cohort
Per
cent
age
Cha
nge
Mass
U.S.
U.S. Bureau of the Census

Where did they go?
TX
CA
MT
AZ
ID
NV
NM
CO
IL
OR
UT
KS
WY
IA
SD
NE
MN
ND
FL
OK
WI
MO
AL
WA
GA
AR
LA
MI
IN
NY
PA
NC
MS
TN
KYVA
OH
SC
ME
WV
MI VTNH
MD
NJ
MA
CT
DE
RI
Net Migration* Betweeen Massachusetts and Competitor States1990-2002
*Thicker line represents more migration
State Net Migration from State
Florida -99,082 New Hampshire -78,201 California -23,978 Arizona -11,033 North Carolina -8,983 Washington -4,516

The Cost of Living Challenge
The Cost of Living in Massachusetts is now a barrier to Employment and Labor Force Growth
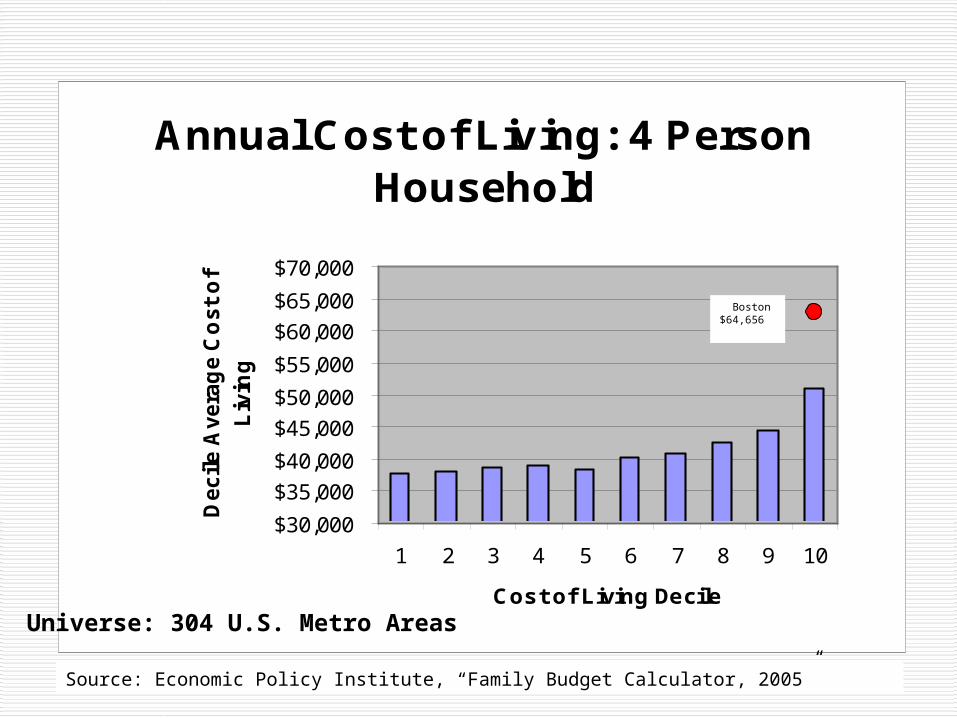
Annual Cost of Living: 4 Person Household
$30,000
$35,000
$40,000
$45,000
$50,000
$55,000
$60,000
$65,000
$70,000
1 2 3 4 5 6 7 8 9 10
Cost of Living Decile
De
cil
e A
ve
rag
e C
os
t o
f
Liv
ing
Boston$64,656
Source: Economic Policy Institute, “Family Budget Calculator, 2005”
Universe: 304 U.S. Metro Areas

Greater Boston Family Budget 4 Person Family with 2 Children
Housing Costs: 7th Highest MSA Child Care: 7th Highest MSA Health Care: 7th Highest MSA Personal Care: 6th Highest MSA Fed/State Tax: 2nd Highest MSA
Total Cost: 1st Highest MSA
Economic Policy Institute, Family Budget Calculator, 2005
Among 304 U.S. Metropolitan Areas

Top Decile: Metro Area Cost of Living
Boston $ 64,656Washington (D.C. portion) $ 61,440Nassau-Suffolk, NY $ 60,780 Stamford-Norwalk, CN $ 60,720 Lawrence (Mass. portion) $ 59,280 New York, NY $ 58,656 Barnstable-Yarmouth, MA $ 58,236 San Francisco, CA $ 57,624 Worcester (Mass. portion) $ 55,704Springfield, MA $ 55,320Minneapolis-St. Paul, MN $ 54,948 Nashua, NH $ 54,852 Santa Cruz-Watsonville, CA $ 53,808Oakland, CA $ 53,412 San Jose, CA $ 52,800 Pittsfield, MA $ 52,632 Rochester, MN $ 51,288
Monmouth-Ocean, NJ $ 50,736San Diego, CA $ 50,088Newark, NJ $ 49,992New Haven-Meriden, CN $ 49,848Honolulu, HI $ 49,824Philadelphia (Pa. portion) $
49,716Boulder-Longmont, CO $ 49,596Bridgeport, CN $ 49,272Manchester, NH $
49,152Santa Rosa, CA $ 48,924Albany-Schenectady-Troy, NY $ 48,900Hartford, CN $ 48,684Trenton, NJ $ 48,576Rochester, NY $ 48,540
Economic Policy Institute: Family Budget Calculator
Universe: 304 U.S. Metro Areas

A Tale of Two CitiesBasic Budget2 Parents, 2 Children
Boston
Monthly Housing $1,266Monthly Food $ 587Monthly Child Care $1,298Monthly Transportation $ 321Monthly Health Care $ 592Monthly Other Necessity $ 500Monthly Taxes $ 824Monthly Total $5,388
Annual Total $64,656
Raleigh-Durham-Chapel Hill
Monthly Housing $ 779Monthly Food $ 587Monthly Child Care $ 866Monthly Transportation $ 358Monthly Health Care $ 368Monthly Other Necessity $ 369Monthly Taxes $ 350Monthly Total $3,677
Annual Total $44,124
A Tale of Two Cities
Source: Economic Policy Institute, “Family Budget Calculator, 2005”

Regional Average Monthly Housing Costs (2004)
$892.60
$708.46 $692.82$617.23 $616.29 $566.14 $583.67
$720.00
$914.63
-$100
$100
$300
$500
$700
$900
$1,100
$1,300
Hou
sing
Cos
ts
Boston ($1,266)
Source: Economic Policy Institute, “Family Budget Calculator, 2005”

Employment Growth (%) (2000-2004)
-6.00%
-5.00%
-4.00%
-3.00%
-2.00%
-1.00%
0.00%
1.00%
2.00%
3.00%
4.00%
1 2 3 4 5 6 7 8 9 10
Housing Price Decile
Per
cent
Cha
nge
Boston MSA (-4.9%)
Economic Policy Institute, “Family Budget Calculator, 2005”; U.S. Bureau of Labor Statistics
Universe: 245 U.S. Metro Areas

Employment Growth (%) (2000-2004)
-1%
0%
1%
2%
3%
1 2 3 4 5 6 7 8 9 10
Cost of Living Decile
Per
cent
Cha
nge
Low Cost High Cost
Economic Policy Institute, “Family Budget Calculator, 2005”; U.S. Bureau of Labor Statistics
-0.21%
0.93%
-0.02%
0.84%1.06%
0.50%
1.09%
1.98%
0.62%
2.53%
Universe: 245 U.S. Metro Areas

Economic Policy Institute, “Family Budget Calculator, 2005”; U.S. Bureau of the Census
Internal Net Migration (%) (2000-2004)
-0.8
1%
-1.0
6%
0.1
8%
0.2
7%
0.9
3%
0.3
6%
2.7
2%
3.0
5%
2.4
5%
-2.2
5%
-6.00%
-4.00%
-2.00%
0.00%
2.00%
4.00%
1 2 3 4 5 6 7 8 9 10
Housing Cost Decile
Decil
e P
erc
en
t
Boston MSA (-5.2%)
Universe: 304 U.S. Metro Areas

Internal Net Migration (2000-2004)
0.3
5%
-0.0
3%
0.5
9%
0.4
8% 1.2
3% 1.9
5%
1.5
2%
1.5
6%
0.1
1%
-2.1
2%
-4.00%
-3.00%
-2.00%
-1.00%
0.00%
1.00%
2.00%
3.00%
1 2 3 4 5 6 7 8 9 10
Cost of Living Decile
Decil
e P
erc
en
t
Economic Policy Institute, “Family Budget Calculator, 2005”; U.S. Bureau of the Census
Universe: 304 U.S. Metro Areas

Massachusetts Economic Forecast

Governor Patrick’s Jobs Goal 100,000 new jobs by 2010 If the ratio of construction jobs to total
remains the same, this will mean 4,400 new construction jobs
Between January and March of this year, 8,086 new jobs
That’s a decent downpayment on 100,000 If we could keep that up, we would get
more than 129,000 new jobs

But we face challenges High cost of living could shortchange
business and employment growth $1.3 billion state deficit makes new projects
hard to justify Need 30,000 new homes over next 10
years … over and above current production levels to reduce housing price appreciation
Need to find a way to reduce health care costs

More Challenges Are cities and towns ready to permit
more housing … especially for younger families?
Are we willing to be aggressive in attracting new business investment to Massachusetts?
Are we willing to challenge the way we supply health care in the Commonwealth?

Housing Progress … A Good Start
Chapter 40R and 40S (Smart Growth Zoning Overlay Districts) have been adopted by 12 Massachusetts municipalities already and …. 30 more considering passage
These new overlay districts could provide 15,000 to 20,000 new housing units
Working on new legislation to provide incentives for rezoning residential areas for small “Starter Homes” for young families.