Mason Master Plan 2007 Update
145
Mason Master Plan 2007 Update Prepared by: Southwest Region Planning Commission and The Town of Mason Master Plan Committee SWRPC Southwest Region Planning Commission 20 Central Square, 2 nd Floor Keene, New Hampshire 03431
Transcript of Mason Master Plan 2007 Update

Mason Master Plan 2007
Update
Prepared by: Southwest Region Planning Commission
and The Town of Mason Master Plan Committee
SWRPC
Southwest Region Planning Commission 20 Central Square, 2nd Floor Keene, New Hampshire 03431

Mason Master Plan, 2007Update
Table of Contents INTRODUCTION ...................................................................................................................................... 1
What is a Master Plan? ............................................................................................................................. 1 What Will the Master Plan Accomplish? ................................................................................................. 2
FUTURE LAND USE PLAN ..................................................................................................................... 4 Vision Statement....................................................................................................................................... 5 Implementation Plan................................................................................................................................. 7
REGIONAL CONTEXT.......................................................................................................................... 13 Introduction ............................................................................................................................................ 13 The Region ............................................................................................................................................. 13 Mason’s Role in the Region ................................................................................................................... 20 Regional and State Organizations........................................................................................................... 21 Regional Publications and Reports......................................................................................................... 24 Summary................................................................................................................................................. 27
EXISTING LAND USE............................................................................................................................ 28 Introduction ............................................................................................................................................ 28 Land Use Categories............................................................................................................................... 28 Factors that Influence Land Use ............................................................................................................. 29 Existing Land Use .................................................................................................................................. 30 Limitations to Development ................................................................................................................... 33
COMMUNITY FACILITIES.................................................................................................................. 35 Introduction ............................................................................................................................................ 35 Community Facilities ............................................................................................................................. 35
ECONOMIC DEVELOPMENT ............................................................................................................. 42 Introduction ............................................................................................................................................ 42 Overview of Economic Indicators .......................................................................................................... 43
HISTORIC, CULTURAL AND CONSERVATION RESOURCES ................................................... 49 Introduction ............................................................................................................................................ 49 History of Mason .................................................................................................................................... 49 Designation of Historic Resources ......................................................................................................... 51 Inventory of Historic Resources ............................................................................................................. 53 Local Preservation Programs.................................................................................................................. 54 Recommendations .................................................................................................................................. 54 Conservation and Open Space Recreation Resources ............................................................................ 56
WATER RESOURCE MANAGEMENT AND PROTECTION PLAN.............................................. 66 Introduction ............................................................................................................................................ 66 Description and Analysis of Conditions and Variables .......................................................................... 70 Potential Threats to Water Resources..................................................................................................... 79 Description of the Community’s Infrastructure...................................................................................... 80 Watershed Land Use............................................................................................................................... 80 Assessment of Growth in Demand for Water......................................................................................... 81 Description of Existing Programs and Policies ...................................................................................... 82 Goals and Recommendations ................................................................................................................. 86 Water Plan Appendicies ......................................................................................................................... 92
POPULATION AND HOUSING ............................................................................................................ 93 Introduction ............................................................................................................................................ 93 Population Analysis................................................................................................................................ 93 Housing Analysis.................................................................................................................................... 97 Conclusion............................................................................................................................................ 103

Mason Master Plan, 2007Update
TRAFFIC AND TRANSPORTATION ................................................................................................ 104 Introduction .......................................................................................................................................... 104 Road Classifications ............................................................................................................................. 104 Traffic Patterns ..................................................................................................................................... 106 Road and Bridge Conditions................................................................................................................. 109 Public/Alternative Transportation Modes............................................................................................. 113 Road Improvement Program ................................................................................................................ 114 Techniques for Addressing Transportation Issues................................................................................ 115
TABLES
Table 2.1: Existing Developed Land Use in Mason, 2006 ......................................................................... 32 Table 2.2: Limits to Development .............................................................................................................. 33 Table 3.1: Fire Department Responses, 2000-2005.................................................................................... 36 Table 3.2: Mason Public Works Department Equipment List .................................................................... 36 Table 3.3: Major Town Highway Department Projects since 1995............................................................ 37 Table 3.4: School District Enrollments, As of October 3, 2005 ................................................................. 39 Table 3.5: Cost Per Pupil, 2004-2005 ......................................................................................................... 39 Table 4.1: Percent of Mason Labor Force (16 and Older) in each Sector 1970-2000 ................................ 43 Table 4.2: Top Employers, 2007................................................................................................................. 44 Table 4.3: Businesses by Sector, 2004........................................................................................................ 44 Table 4.4: Summary of Valuation by Land Use, 2000-2005 ...................................................................... 45 Table 4.5: Regional Property Valuation Statistics, 2005 ............................................................................ 46 Table 4.6: Tax Rates per $1,000 of Assessed Value, 2000-2006 ............................................................... 46 Table 4.7: Equalized Tax Rate Comparison, 2005 ..................................................................................... 46 Table 4.8: Regional Commuter Activity, 2000........................................................................................... 48 Table 5.1- Mason Conservation Lands Inventory....................................................................................... 56 Table 5.2- Inventory of Mason’s Open Space Recreation Areas................................................................ 61 Table 6.1: Watersheds in the Town of Mason ............................................................................................ 71 Table 6.2: Surface Water Resources Inventory .......................................................................................... 72 Table 6.3: Groundwater Resource Inventory .............................................................................................. 75 Table 6.4: Wells .......................................................................................................................................... 77 Table 6.5: 1999 Average Per Person Daily Water Consumption................................................................ 82 Table 6.6: Relationship between Population Growth and Water Usage ..................................................... 82 Table 6.7: Classes of Groundwater ............................................................................................................. 86 Table 6.8: Review of Local Ordinances and Regulations (July, 2007)....................................................... 91 Table 7.1: Comparison of Population, 1970 – 2005 ................................................................................... 94 Table 7.2: Age Distribution, 1970-2000 ..................................................................................................... 95 Table 7.3: Highest Level of Education- Percentage of Residents Aged 25 and Older .............................. 96 Table 7.4: Household Income, 2000 .......................................................................................................... 97 Table 7.6: Housing Supply, 1970-2000 ...................................................................................................... 97 Table 7.7: Issued Building Permits (All Residential), 2000-2005 .............................................................. 98 Table 7.8: Percent of Income Spent on Housing......................................................................................... 99 Table 7.9: Homeowner Affordability, 2000.............................................................................................. 100 Table 7.10: Sub-Regional Housing Comparisons.................................................................................... 101 Table 7.11: Zoning Regulations................................................................................................................ 101 Table 7.12: Population Projections for Mason & Sub-Region 2005-2030 ............................................... 102 Table 7.13: Projected Housing Units Need.............................................................................................. 102 Table 8.1: Road Mileage by State Classification ..................................................................................... 105

Mason Master Plan, 2007Update
Table 8.2: Averaged Annual Daily Traffic Counts, 1998-2006............................................................... 107 Table 8.3: Average Saturday, Sunday, Weekday and Weekly Traffic Counts, 2006 .............................. 107 Table 8.4: Destinations ............................................................................................................................. 108 Table 8.5: Mason Accidents by Intersection 1995-2002 ......................................................................... 110 Table 8.6: Transportation Problem Matrix .............................................................................................. 111 Table 8.7: Recommended Transportation Management Projects ............................................................ 112
FIGURES
Figure 1.1: Household Densities in the Region, 2000 ................................................................................ 14 Figure 1.2: Rural Development Pattern ...................................................................................................... 16 Figure 1.3: Suburban Development Pattern ................................................................................................ 16 Figure 1.4: Urban Areas in New England Designated by the 1990 U.S. Census ....................................... 17 Figure 1.5: Urban Areas in New England Designated by the 2000 U.S. Census ....................................... 17 Figure 1.6: Generalized Regional Zoning Map .......................................................................................... 18 Figure 4.1: Occupation of Mason Labor Force Age 16 and Older, 1970-2000 .......................................... 43 Figure 4.2: Average Annual Unemployment Rate, 1990-2006 .................................................................. 45 Figure 4.3: Equalized Tax Rate Comparison per $1,000 of Assessed Value, 2005.................................... 47 Figure 6.1: Cycle of Water.......................................................................................................................... 68 Figure 6.2: Evapo-Transpiration ................................................................................................................. 69 Figure 6.3: Nashua River Watershed and Sub-basins................................................................................. 70 Figure 6.4: Zone of Contribution/Wellhead Protection Area...................................................................... 78 Figure 7.1: Population Growth, 1790-2005 ................................................................................................ 94 Figure 7.2: Comparison of Population, 1970 – 2005.................................................................................. 95 Figure 7.3: Mason Age Distribution ........................................................................................................... 96 Figure 7.4: Housing Age............................................................................................................................. 98 Figure 7.5: Owners Percent of Income Spent on Housing 1999................................................................. 99 Figure 7.6: Renters Percent of Income Spent on Housing- 1999.............................................................. 100

Do you remember Mason, Uncle Sam?
As you walk the troublesome places of the world Do you sometimes think of the quietness,
The peace, the sweetness in the air, The piney woods, the laurel in bloom,
The sparkling brooks, The gold of the maples in autumn? Do you remember your favorite spot
Where you used to go to think things out? Wondering what there was for you to do,
Deciding that to live a good life Of the highest quality,
Honestly and graciously, In partnership with God,
Is the best anyone can do – Pondering about tolerance, Honesty and uprightness,
Asking a question And hearing the answer:
It isn’t so much what a man does As what he is, how he lives
And what he stands for That matters.
Do you remember Uncle Sam? Things haven’t changed much, in Mason.
Elizabeth Orton Jones

This poem was written by Elizabeth Orton Jones, a children’s book author and illustrator. She is best known for “Twig” and “Big Susan,” just to name a few of her works. Elizabeth Orton Jones lived in Mason for over 50 years. The poem as from Our Uncle Sam, was a pageant written for the children of Mason. This poem best describes what Mason was in yesteryear and also what Mason is today. Some of the surrounding towns have not planned for growth and they are starting to feel the effects. The Land Use Master Plan Citizens Committee feels it is important to plan for the future of Mason in order to preserve our precious resources as they exist in Mason today. On September 29, 2001, people from all corners of Mason gathered at the Mason Town Hall to begin developing a plan to guide the future development and preservation of our town, a very special town, Mason, New Hampshire As available land in surrounding towns becomes scarce, land in Mason becomes more precious. The increase in development also creates pressure to alter Mason’s landscapes. Two of the most critical resources a town can possess are its land and water. It is very important that we consider the appropriate use of land and place safeguards on aquifers when planning for the town’s future. As the community grows in size, profound changes will occur within the environment. The need for public services and facilities will increase as the population expands. Regulations regarding growth and development are imperative to protect and preserve Mason as we know it today. (excerpted from the 2001 report “A Town’s Vision” of the Mason Master Planning Committee)
Mason Master Plan, 2007 Update
Introduction 1
RSA 9-A:1 local planning boards are encouraged to develop plans that are consistent with the policies and priorities established in the state comprehensive plan.
INTRODUCTION New Hampshire state law mandates planning boards to “prepare and amend from time to time a master plan to guide the development of the municipality.”1 The sole purpose of the Master Plan is to aid the planning board in the performance of its duties. The duties of the planning board are varied, but the only duty specifically required is the maintenance of the town’s Master Plan.2 The statute goes on to say that the Master Plan may include consideration of any areas outside of the town which, in the judgment of the planning board, bear a relation to or have an impact on the planning of the town.
WHAT IS A MASTER PLAN?
The Master Plan may be comprised of a collection of reports, statements, land use and development proposals, with accompanying maps, diagrams, charts and other descriptive matter that shows as fully as is possible and practical the planning board’s recommendations for the desirable development of the town. The Master Plan shall include, at a minimum, the following required sections3 :
a) “A vision section that serves to direct the other sections of the plan. This section shall contain a set of statements which articulate the desires of the citizens affected by the Master Plan, not only for their locality but for the region and the whole state. It shall contain a set of guiding principles and priorities to implement that vision.”
b) “A land use section upon which all other sections shall be based. This
section shall translate the vision statements into physical terms. Based on a study of population, economic activity, and natural, historic, and cultural resources, it shall show existing conditions and the proposed location, extent, and intensity of future land use.”
The Master Plan may also include the following sections (RSA 674:2.III):
a) Transportation section; b) Community facilities section; c) Economic development section; d) Natural resources section; e) Natural hazards section; f) Recreation section; g) Utility and public service section; h) Cultural and historic resources section; i) Regional concern section; j) Neighborhood plan section; k) Community design section; l) Housing section; m) Implementation section.
1RSA 674:1. 2Other planning board duties, such as subdivision and site plan review, etc., are actually allowed only if the voters at town meeting authorize the planning board to take on these responsibilities. 3RSA 674:2.

Mason Master Plan, 2007 Update
Introduction 2
RSA 9-B, State Economic Growth, Resource
Protection, and Planning Policy states that it is NH
state policy, that state agencies, and by extension local boards act in ways
that encourage smart growth.
Where appropriate, the plan may contain appendices or separate reports that contain the underlying scientific and statistical data that support the various elements of the plan. The Planning Board may also adopt other community-wide plans such as a Hazard Mitigation Plan, Natural Resources/Open Space Plan, and a Downtown Revitalization Plan.
WHAT WILL THE MASTER PLAN ACCOMPLISH?
The Master Plan provides a framework for the Planning Board in particular and the town as a whole to use in shaping the future over a period of years (5-10 years is recommended for Master Plan updates4). The Planning Board should be able to refer to the town’s Master Plan whenever a development proposal comes before it, to determine whether development that is being proposed is consistent with the Master Plan.
Most importantly, in order for any municipality in the State of New Hampshire to adopt a zoning ordinance, a Planning Board must have adopted, at a minimum, a general statement of goals and objectives and the land use section of a Master Plan. Mason does have a zoning ordinance (called the Planning Ordinance in Mason) and the current Master Plan was completed in 1981. However, over the past 26 years many changes have occurred in town and new growth pressures are developing. Therefore, it is incumbent on the Planning Board to bring the Master Plan up to date with current conditions. This Master Plan represents - to the best ability of the Planning Board
and the Master Plan Committee to determine - the wishes of the residents of Mason regarding the present and future vision of the town for the next 5-10 years. Throughout this process, the Planning Board has informed the public and solicited comment in order to reach the recommendations included in the Master Plan. There are many determinants of development including, but not limited to lifestyle and economic choices of individual homeowners and business owners, physical landscape capabilities, the prevailing economy, access, public services, and land use regulations (Zoning Ordinance, Site Plan & Subdivision Review Regulations, and State and Federal permitting). This Master Plan Update is concerned with those factors which municipalities are uniquely situated to effect, such as the kinds and densities of land uses, site design, layout and maintenance of roads, and provision of public services (emergency services, schools, and sewer & water). The basis for local land use regulation is established in the Constitution. The Constitution gives municipalities the right to protect property owners’ rights while exercising the public’s right and responsibility to manage private land use to protect the greater good. A Master Plan is the municipal policy basis for land use regulations and public spending for services and infrastructure. The future land use plan, a mandatory component of the Master Plan, should be a bridge from documentation of conditions and public opinion to land use regulation and to some degree public spending for services and infrastructure that can directly affect land use patterns. 4RSA 674:3.II.

Mason Master Plan, 2007 Update
Introduction 3
State statute assigns responsibility for developing and maintaining the municipal Master Plan to the Planning Board5. While there is no statutory standard for how often a Master Plan must be updated, as frequently as every five years is recommended. Waiting more than ten years can jeopardize the legal basis for zoning. It also creates disconnect between constantly evolving zoning ordinances and prevailing conditions and public policy. The last Master Plan for the Town of Mason was completed in 1981 by SWRPC through a comprehensive planning assistance grant from the State of New Hampshire and a Housing and Urban Development (HUD) grant. An addendum to the Master Plan was adopted in 1987. This Master Plan update will help the citizens of Mason build a more modern vision of their community and create a public policy guide for future changes. The Planning Ordinances for the Town of Mason were adopted in 1967 with the most recent amendment made in 1997. The Subdivision Regulations were adopted in 1974 and amended most recently in 2007. Site Plan Review Regulations were adopted in 1990 and have not been amended since that time. Excavation Regulations were adopted in 1995 and have not been amended since. A Master Plan will help determine the need for revision of any or all of these regulations. Mason is a small community with a 2005 estimated population of 1,300 people. Mason’s population is actually lower today than it was in the 1850’s during the heyday of the railroad. After the mid-1800’s Mason began a significant population loss. Mason had a population of less than 300 people in the 1930’s. Since that time Mason has almost continually gained population decade after decade. Today, Mason faces a number of development pressures as rising costs of living near urban centers, especially Nashua, force people to develop into the rural fringe. This increase in housing development in Mason presents many challenges to the community. Mason has very few commercial or industrial businesses in town. The majority of the Town’s tax income is from residential development. Typically, an all residential tax base is not sufficient to provide town services, particularly school funding, needed by the residents. The growth pressure being felt by Mason and many surrounding communities encouraged the Mason Planning Board and Board of Selectmen to begin a comprehensive update of the Master Plan The Planning Board convened a Master Plan Steering Committee to carry out the process with consultant services from SWRPC. The Master Plan Committee engaged in a number of public outreach activities which included a community visioning project in 2001, a community survey in 2005 and public meetings of the Master Plan Steering Committee from March 2007 to July 2007. Comprehensive Basic Studies corroborated the powerful regional growth trends that will shape Mason’s future. The studies also document the many resources and attributes in Mason’s demographics, natural landscape and historic heritage.
5 RSA 674:1.I.
Mason Master Plan, 2007 Update
Future Land Use Plan 4
FUTURE LAND USE PLAN The Future Land Use Plan includes a general Vision Statement and a set of Goals and Objectives regarding the matters of community development in which Town government has responsibilities, duties or other authorities – primarily land use regulation, public services and infrastructure, and public spending. The Future Land Use Plan and its Vision Statement were developed by the Master Plan Steering Committee from 2005 to 2007. The Goals and Objectives were developed to address needs and conditions observed at the time of this Update and expected for the near future. The Committee’s deliberations were informed by:
o the collective views, knowledge and opinions of the Steering Committee members; o the 2001 Community Visioning Exercise, 2005 Community Survey, 2007 Basic Studies chapters
were prepared as parts of the Master Plan Update; o Mason’s 2001-2002 Master Planning efforts; and o comments and information provided by other Mason residents throughout the Master Plan Update
process. The Goals and Objectives are organized below by subject: Regional Context, Community Facilities, Historic, Cultural and Conservation Resources, Economic Development, Water Resources, Population and Housing, and Roads and Transportation. The Goals and Objectives are to be interpreted and implemented in concert. It is essential to the effectiveness of this Update that the Planning Board will:
1. ensure the orderly execution of the Implementation Plan of this Update including coordination with other municipal boards, municipal employees and other residents;
2. review Mason’s land use regulations for consistency with the Goals and Objectives of this
Update on an annual basis; and
3. undertake a comprehensive Master Plan Update following the 2010 U.S. Census.

Mason Master Plan, 2007 Update
Future Land Use Plan 5
VISION STATEMENT
Mason is a community, built upon hundreds of years of history and has generally been intact as a pristine rural community. The Town’s past shaped not only the land, but the character of those who reside in Mason. Mason now lies on the edge of sprawling development from both the south and the east. Maintaining the rural character that attracted so many unique individuals over its many years is more of a challenge than ever before. The development pattern of Mason also allowed our water sources to remain a clean and healthy resource for the community. Since the Town is served by private water and sewer systems, it is imperative that our existing water resources such as wetlands, aquifers and watersheds be protected to the maximum extent possible in order to assure the continuous supply of clean water for present and future generations. Dirt roads, vast forested areas, scenic views, historic landmarks, stone walls, pristine streams, and small town character are highly valued by the citizens of Mason. Our vision is one where all of these valuable assets are protected; for once they are lost, they cannot be replaced. We realize as a community that change will come. Therefore, our vision must guide us towards planned and thoughtful growth that will maintain the rural atmosphere so cherished by our community. This Vision is a collection of the thoughts and ideas that were expressed during a number of community activities, which included a community visioning project in 2001, a community survey in 2005 and public meetings of the Master Plan Steering Committee. The following are the “desires articulated by the citizens” as determined during these community activities:
To maintain and nurture our Community Character, Mason …
• Will foster a sense of community and maintain the social fabric that makes Mason a great place to live.
• Will preserve the historic integrity of the Town Center and maintain it as the civic heart of the community.
• Recognizes that the visual character of the community comes from the many scenic views along its country roads. We will preserve and enhance the rural character of the Town as seen from its roads through the creation of clear and consistent policies on town roads and avoid scattered and premature development.
• Will develop and improve the use of planning tools such as a Capital Improvements Plan, accurate mapping, and growth monitoring.
To ensure the opportunity for Economic Development, in character with our rural community, Mason …
• Will identify types of business and industry, potential locations, and desired attributes that are in keeping with the rural character of the Town.
• Will support efforts to bring viable access to DSL, Broadband and/or wireless internet accessibility to home-based and commercial businesses.
• Will create policies that control light, air, noise and water pollution, are in character with the structural and landscaping aesthetic of the community, create incentives for conservation, establish greenbelt requirements, control traffic, and address the potential impact of any permit issued.

Mason Master Plan, 2007 Update
Future Land Use Plan 6
To protect and conserve our Natural Resources, Mason…
• Recognizes the value of natural resources in protecting our health, both physically and mentally, and the health of the environment as a whole. In order to protect those natural resources we will invest in protecting large tracts of land for wildlife habitat and water quality.
• Will create an Open Space Plan to determine sensitive environmental areas and help guide public policy regarding development and conservation.
• Will undertake a comprehensive initiative designed to protect water resources and water supplies.
• Will encourage the use of conservation easements with willing landowners to protect high priority lands.
• Work as a community to educate each other about land and limitations inherent in the land, such as soil types and depth to bedrock, and the impact that development has on land and water quality.
To preserve the history and culture of Mason, Historic Preservation in Mason …
• Will maintain access to all public historic sites and structures.
• Will protect and preserve historic features both in and out of the designated historic district.
• Will improve communications with outside agencies engaged in historic preservation work such as the NH Department of Historic Resources in order to keep up to date on historic preservation techniques.
• Will promote the resources of the Mason Historical Society within the Town and surrounding communities.
• Will be proactive in identifying historic sites and consider places which may be viewed as historic in the future.

Mason Master Plan, 2007 Update
Future Land Use Plan 7
IMPLEMENTATION PLAN
The Implementation Plan is the compilation of recommendations made in the Basic Studies of the Master Plan and the work of the Master Plan Steering Committee groups convened in 2001. Regional Context Environment:
• Continued communication among the respective municipal boards and committees is critical for ensuring thoughtful development is occurring within the town of Mason. Forging strong lines of communication with the Towns of Greenville, New Ipswich, Wilton, Brookline, Milford, and Townsend, MA will assure the scale and types of development are compatible with the overarching zoning intents crafted by each of the Towns. Mason should continue to encourage the incorporation of subdivision design schemes that promote conservation.
Land Use
• Follow State guidelines pertaining to “Development of Regional Impact” to assure adjacent towns are afforded ample opportunities to review and comment on proposals.
• New Land Use Board members should be encouraged to participate in the Land Use Training
workshops sponsored by the Office of Energy and Planning, the Local Government Center and others.
Economy
• Mason should continue to promote home-based business and support a diverse economic development strategy, which may include the creation of a commercial zone. Mason could partner with local and regional leaders, economic development organizations, government, and private sector businesses interested in maintaining a sustainable economy.
Recreation
• Recreational Resources are invaluable to the many interested users. However, given the variety of potential uses and input from prospective users, continued communication is critical to ensure the safety of users and maintenance of the Mason Railroad trail. Mason should communicate with the Nashua River Watershed Association in order to stay current with the efforts to create a Townsend Rail Trail on the Massachusetts Bay Transportation Authority corridor. If completed, it will make the rail trail in Mason part of a 34-mile trail system. The town should also undertake the creation of a usable map for trails located on the Bronson Potter Estate.
Community Facilities
• Develop a Capital Improvements Plan for the maintenance of all community facilities and infrastructure.

Mason Master Plan, 2007 Update
Future Land Use Plan 8
• The Town of Mason should consider enacting zoning which will guide the siting of telecommunications towers or any future developments in communications or energy (such as windmills or solar farms). The town should benefit from any revenues realized and should have in place guidelines that disallowed any such structures that will interfere with scenic views, historic buildings or districts or major view corridors.
• Require public building expansion to fit with the character of the town. Consider the
compatibility of exterior design, arrangement, texture, and material to be used in relationship with other existing building structures or surrounding area.
Town Hall
• The Town Hall located at the heart of the Village was built in 1840, and is used for Town Meeting and other community events. The building, while highly valued by the Townspeople, is in need of repair and should be included in the Capital Improvements Plan.
Fire Department
• Maintain communication with fire chief regarding impacts of new development on fire protection facility. While the current facility and fire protection structures throughout town are sufficient for the current needs of the fire department, growth over the next several years may necessitate expansion of the facility.
Public Works
• Facilities are in need of improvement. Future projects planned include improvements of Hurricane Hill Road and there is recognition that as the town grows there is need for increased and routine road improvements.
Library
• The Library Director has recognized a need for the following improvements: o More space for library collections. o Upgrades to computers to provide online catalog and search capabilities. o More room for library programs and community activities. o Improved access to bathroom area. o Improved handicap access throughout the library.
Historical Society
• Future plans include ongoing discussions with the Selectmen regarding the use of the Mann Store and/or Twig’s schoolhouse, the latter having been recently bequeathed to the Town, to house the Historical Society collection and possibly for meetings.
Historic, Cultural and Conservation Resources
• It is important to safeguard and protect open spaces. If the town wants to preserve a parcel of land, the town should make a realistic effort to acquire it.
• Encourage use of conservation easements to protect land while keeping it in private hands.

Mason Master Plan, 2007 Update
Future Land Use Plan 9
• The town should put conservation easements on tax title lands using land use change tax funds.
• The town should identify contiguous parcels for wildlife corridors through the creation of an
Open Space Plan or Natural Resources Inventory. • Open space protection should be included when planning for any and all potential future
development. The areas to be protected should not only be those that are considered not buildable but also those that include natural resources and scenic vistas.
• Encourage sustainable forestry as a long-term land use for large parcels.
• The town should undertake a community-wide environmental education program to educate
the public on issues such as steep slopes, landscaping with native vegetation, and other environmental concerns for homeowners such as septic systems.
• Preservation of historic structures should be encouraged. Increased awareness of their
existence can be achieved through techniques such as historic markers, brochures, and planned walking or driving tours.
• Selectmen of Mason should be encouraged to maintain and preserve the character of the town
through revitalization of the Historic Commission. The Commission should serve as a resource to the residents of the Historic District and the town in general by providing information on restoration techniques, material and financial resources.
• The Commission should be encouraged to work with the Historic Society to identify, record,
and preserve information about historic structures, and to establish standards and guidelines for the maintenance and preservation of historic structures.
• The town should strengthen communications with historic organizations sponsored by the
State of New Hampshire and in surrounding towns.
• The town should preserve roadways or paths to historic areas. Economic Development
• While high speed internet is not widely available in Mason, the future demand on such service is apparent. Mason should encourage development of high speed internet within the town through a collaborative effort with surrounding communities.
• Mason should set design and performance standards for home-based businesses in order to
assure that home-based businesses do not conflict with the surrounding residential uses.
• Because of economic restructuring over many years, turning from historic commercial operations and the separation from Greenville, and due to the geographic location, new development in Mason is primarily residential. Mason could consider the creation of a modest business/commercial zone to encourage commercial growth and increase the commercial tax base.

Mason Master Plan, 2007 Update
Future Land Use Plan 10
• Determine the percent of land that could be business and light industrial area. Base this percentage on a review of what other towns of similar size have determined to be appropriate.
• Organize an Economic Development Committee. This is an essential tool for the present and
future of Mason. • Mail a survey to all businesses in Mason which will give us current data as to type of business,
growth potential, number of people working in that business, whether it's a home business or not, why they are doing business in Mason, what types of businesses if any they would like to see in Mason, and how they currently dispose of their hazardous waste (hair salons, automotive repair, pesticides) if any.
• Establish esthetic guidelines for commercial growth, whether or not there is a change in the
zoning areas of Mason.
Water Resources
• In general, local officials are strongly encouraged to become familiar with the protection measures described in relevant NH DES Environmental Fact Sheets:
• The Town of Mason should enact the New Hampshire Groundwater Protection Program to
achieve a management program through reclassification of Mason’s wellhead protection areas and other groundwater resources.
• The Town of Mason should consider the establishment of a Health Ordinance pursuant to the guidance document “Model Health Ordinances to Implement a Wellhead of Groundwater Protection Program” published by the NH DES.
• The Town of Mason should establish and maintain the paid position of Health Officer in
Mason town government. This position could be shared with one or more neighboring communities.
• The Town of Mason should develop a town-wide Open Space Protection Plan.
• The Town of Mason should pursue Source Water Protection measures, those which protect
groundwater and public drinking water, in addition to the Groundwater Protection Program, particularly land conservation, for high yield stratified drift aquifers in the Spaulding Brook and Gould Mill Brook watersheds, and along NH 123 in the Mason Brook watershed.
• The Town of Mason should investigate the use of Conservation Subdivision practices to
protect water resources.
• The Town of Mason should consider requiring on-site community water supply and waste water treatment systems for larger subdivisions and in areas of greater density.
• The Town of Mason should determine where the most probable high-yield well locations are
in Town for possible use in the future.

Mason Master Plan, 2007 Update
Future Land Use Plan 11
• The Town of Mason should take steps to protect surface water resources and storm water management including wetlands and wetland buffers through development of a comprehensive wetlands protection ordinance.
• The Town of Mason should work to strengthen protection of water resources through its
ordinances and regulations. Population and Housing
• In order to create an environment that supports diverse housing options for a range of incomes the town should consider allowing accessory apartments, conversion of existing homes into limited multi-family dwelling (two/three family), and the creation of new multi-family dwellings in certain areas of the town. Strict design standards should be implemented to ensure that any new multi-family units keep in context with the rural character of the community.
• Monitor growth in surrounding communities by tracking building permits in order to help
anticipate potential growth in Mason.
• Maintain limitations on development on Class VI Roads.
• To maintain rural character, require a natural buffer between new construction (dwellings) and the road.
• The town should consider additional specific rules and regulations for subdivisions. Design
review should consider the preservation of existing features including trees, scenic ponds, brooks, streams, rock outcroppings, water bodies including vernal pools, natural resources, historic landmarks, and stone walls
• The restriction for back lots should be retained.
• Promote ways to reduce noise and light pollution.
o Use outdoor lighting without glare so stars can be visible at night. o Restrict outdoor lighting sources so they are not visible from the roadside. o Adopt a common sense noise policy that would not place undue restrictions on activities
that create noise. Traffic and Transportation
• Repair and monitor problem locations identified in the Master Plan and include long-term projects in the Capital Improvements Plan.
• Work with neighboring communities to extend the rail-trail network.
• Develop a policy regarding the conversion of Class VI roads to Class V roads that carefully
weighs long-term costs and benefits to the town.
• Change how town roads are accepted

Mason Master Plan, 2007 Update
Future Land Use Plan 12
o Utilize a method of accepting town roads called “Dedication and Acceptance” (RSA 231:22-a) whenever possible. Use the “Layout” (RSA 231:8-30) method only when required.
• Create a working map of town roads for use by town boards
o Indicate whether a road is a state highway, Class V road, or Class VI road. Note known discontinued roads and date of discontinuance. List roads of uncertain status that may or may not be town roads.
• Educate townspeople on road classifications, impacts, processes via handouts, displays and
posters
• Create informative posters to provide information and provoke discussion on roads issues

Mason Master Plan, 2007 Update
Regional Context 13
REGIONAL CONTEXT
INTRODUCTION
While other chapters of this Master Plan address conditions and issues specific to the Town of Mason, or within the Town’s control to some extent, this chapter surveys the region of which Mason is a part. Mason’s Master Plan will be stronger when it accounts for the spatial development patterns and trends within a regional context; the geographic distribution of homes, jobs, shopping and services; the water, soil, forests and wildlife that blanket the hills around Mason without regard for political boundaries; the highway network; regulations and policies of neighboring towns; and the often far-reaching social networks of residents. While Mason is within New Hampshire’s Monadnock Region it is likely to be more strongly affected by the Nashua region (Hillsborough County) within the Merrimack Valley and northern Worcester County in Massachusetts. For the purpose of this chapter, “the Region” will encompass the following Cities and Towns: • Cheshire County
o Jaffrey o Rindge
• Hillsborough County o New Ipswich o Sharon o Peterborough o Greenfield o Lyndeborough o Temple o Wilton
• Hillsborough County o Greenville o Mason o Brookline o Milford o Mont Vernon o Amherst o Hollis o Merrimack o Nashua
• Worcester County (MA) o Winchendon o Ashburnham o Ashby o Gardner o Westminster o Fitchburg o Leominster o Lunenberg o Townsend
This chapter is included in the basic studies of Mason’s 2007 Master Plan update to ensure awareness of the regional conditions that identify the strengths, weaknesses, opportunities, and challenges confronting the region and the Town of Mason. By accurately identifying Mason’s internal and external environments the Town is more informed to seek innovative solutions to recurring problems. In addition, garnering a strong understanding of the issues and trends confronting Mason, and the region as a whole, will enable the Town to prioritize and allocate resources to adapt to the changes.
THE REGION
REGIONAL LANDSCAPE
The landscape of the region is mostly forested with rural and suburban residential development dispersed between village centers and metropolitan areas such as Nashua, NH and Fitchburg, MA. Approximately 320,000 people lived in 121,771 households in the 745-square-mile region of 27 towns in 2000. Town populations ranged from 86,605 in Nashua to 360 in Sharon; other large population centers include Fitchburg (39,102), Leominster (41,303), Merrimack (25,119) and Milford (13,535, closest to Mason). Population density region-wide is approximately 430 persons per square mile as of 2000. In the Region, due to the number of dense urban regions such as Nashua, Fitchburg and Leominster, the Region has one house for every four acres. Figure 1.1 depicts Census Blocks shaded by household densities. While the variations in the size of Census Blocks makes further analysis difficult, the distribution of densities from low to high is informative in and of itself. The trend in housing densities

Mason Master Plan, 2007 Update
Regional Context 14
observed during recent decades is slight but consistent: no increase in density in the existing high-density areas; a slow expansion of the edges of the existing high-density areas; increasing densities in the medium-density areas; and little change in the existing low-density areas. This dynamic may have three basic causes: 1) new residents and residents whose changing economic status allows them to relocate to larger properties choose new homes on exurban lot sizes (more than 1 acre, less than 10 acres); 2) our traditional development centers may be approaching development capacity given existing zoning and infrastructure; and 3) new development in the lower density areas tends to be within 1,000 feet of existing municipal and state roads.
Figure 1.1: Household Densities in the Region, 2000
Source: US Census, 2000
The Region’s natural and historic rural landscape is prized by residents and considered an asset to be guarded and managed. Many land areas in the region are encumbered against development through deed restrictions, conservation easements and public ownership for protection - including Mount Monadnock, Townsend State Forest (MA) and Russell Abbott State Forest. There is a strong ethic in the Region for environmental protection and preservation of the visual community character. In some parts of the Region there have been increased pressures to exercise public or private control over the rates and kinds of growth. This has become increasingly evident by the interim growth management (moratoria) strategies currently being used by several of the Region’s towns. While these interim strategies allow for the temporary enactment of building permit caps or limitations on subdivisions, permanent growth

Mason Master Plan, 2007 Update
Regional Context 15
management controls must be created to manage growth and development beyond the one-year horizon allowed under interim controls. Much of the land area in the Region is zoned for low-density (rural) residential use (78%), with a variety of agricultural and commercial uses allowed by right or special exception, and typically requires minimum lot sizes ranging from two to five acres. A relatively small proportion of the land in the Region towns is zoned for medium- or high-density residential (13%), commercial or mixed uses and these areas are usually existing village centers and downtowns (6%). Proportionally, there are limited areas zoned exclusively for commercial or industrial use outside of the larger cities
REGIONAL ECONOMY
In the Contoocook River Valley area of the Region, commerce and employment are dominated by light manufacturing, business and service industries. Tourism, retail and resource extraction are also important sectors of the economy. Approximately 4,700 people are employed in Peterborough and 2,700 in Jaffrey. There are approximately 43,086 employees in Nashua and important sectors of the economy are retail, health and social services, and professional and technical services. To the south of Mason, in northern Worcester County, employment is dominated by polymer, plastic, and metal fabrication that are supported by business services such as finance, insurance and real estate. The Region has recently experienced two periods of rapid growth: in the early 1970’s and again in the late 1980’s. Both episodes brought substantial increases in population, commerce and demand for housing and public services. While a strong sense of local identity defined by town boundaries prevails, there is great variety in the “personal geography” of residents. That is, the map people carry in their minds determined by where they work and shop, where they have social connections, and where they spend leisure time. The Region’s population is as highly mobile as any in the U.S. Most residents work and shop outside their towns of residence. Many of the Region’s households own two or more cars. Region residents travel for an average of 26 minutes one way for work each day, not much different than national average commute time of 25.5 minutes.
REGIONAL TRANSPORTATION
The Region’s residents and visitors have reasonable access to interstate highways, major airports, and commuter rail and bus depots. Interstates 89, 90, 95 and 93, as well as Route 2 and Route 495 can be reached from most parts of the Region within an hour. Three international airports are also within convenient driving range: Manchester International Airport: 32.2 miles from Mason; Logan International Airport (Boston): 63.6 miles; and Bradley International Airport (Hartford): 110 miles. The nearest commuter rail station is located in Fitchburg, MA. Trains to Boston’s North Station run regularly during peak commuter hours and less regularly throughout the rest of the day. Total travel time to Boston from Fitchburg is approximately 1.5 hours. Bus service from Nashua to Boston is provided daily through Concord Coach Lines. Buses pick up commuters from two locations in Nashua leaving approximately every 1.5 hours. A one-way trip by bus is approximately 1.75 hours.
LAND USE AND ZONING
The Region surrounding Mason has many things: natural beauty, historic villages, Yankee tradition, good jobs, a strong economy, and, perhaps most importantly, a community of capable residents. All of these things that residents enjoy and take pride in are, in part, products of change. While residents have many

Mason Master Plan, 2007 Update
Regional Context 16
different visions and hopes for the future, there seems to be consensus that protecting the good things we have and improving our community are priorities.
Figure 1.2: Rural Development Pattern The development of forests and fields along town and state roads may be the single most common concern among residents and local governments in our region today. There are many opinions about how the ongoing development of new homes and commercial sites affect our community character, services and infrastructure, our social fabric, our economic vitality, and our natural resources. Figure 1.2 is a hypothetical bird’s-eye view of the New England landscape most of us envision and want to preserve.
Figure 1.3: Suburban Development Pattern
Figure 1.3 shows a different version of that same view developed for housing using medium lot sized conventional subdivisions. Whether arising one new house at a time or in large developments, this suburban development pattern is what most of the region’s rural residential zoning is creating. The Region’s lower cost of living, economic vitality, scenic beauty, access to outdoors, and appeal of small town life will continue to attract new residents and drive the development of new homes and commercial sites. Managing development to create opportunities for positive change, while protecting and mitigating against loss is a principal challenge for the entire Region today. To adequately prepare for continued development it is important to understand that the Region is becoming part of the very powerful engine of change to the south and east – powerful in terms of numbers, number of people, dollars, households, commercial floor space, and jobs. Figure 1.4 depicts the urban areas in New England and eastern New York State after the 1990 U.S. Census. Figure 4 shows urban areas designated by the 2000 Census. Figure 1.5 illustrates the frontier effect on the edge of the urbanizing areas to the south and east that is driving much of the change in our Region by mapping the densities of households using 2000 U.S. Census data.

Mason Master Plan, 2007 Update
Regional Context 17
Figure 1.4: Urban Areas in New England Designated by the 1990 U.S. Census
Figure 1.5: Urban Areas in New England Designated by the 2000 U.S. Census
As the regional economy ebbs and flows with national business cycles and regional advancements and downturns, the principal determinants of development patterns are highway access, public infrastructure and services, and municipal zoning. The Region’s municipal zoning and capital spending plans are, in essence, a regional future land use plan. Figure 1.6 is a map of zoning districts in the Region. While there are many unique districts among the towns, they have been generalized as rural residential, residential, commercial, industrial, and institutional. The vast majority of the land in the Region is zoned for medium or low density residential use with a variety of commercial uses allowed by right or special exception. The availability of road frontage and public sewer and water is an important determinant of development density.

Mason Master Plan, 2007 Update
Regional Context 18
Figure 1.6: Generalized Regional Zoning Map
The current distribution and future development of highway access, public infrastructure and services, and municipal zoning will have immediate effects on land values, development patterns, traffic patterns, distribution of jobs versus housing, demand for public services and infrastructure, and the quality of our natural resources ranging from scenic beauty and biodiversity to water supply and clean air. The Southwest Region Planning Commission (SWRPC), Nashua Regional Planning Commission (NRPC), and the Montachusett Regional Planning Commission (MRPC) all publish studies and reports to provide a more developed regional perspective for use by municipal governments. Several of these reports and research, are available on the each respective Commission’s website (www.swrpc.org, www.nashuarpc.org and www.mrpc.org) or by contacting the Commissions. Some of these reports are described at the end of the chapter.

Mason Master Plan, 2007 Update
Regional Context 19
CULTURAL AND RECREATIONAL RESOURCES
Regional Events and Activities Milford Great Pumpkin Festival This annual Columbus Day weekend festival includes musical performances, scarecrow making, pumpkin decorating, face painting, a haunted trail, pumpkin catapult, pumpkin carving competition and much more, during the three-day event. Nashua Country Fair An annual event for the past 18 years, the Fair offers games for kids, entertainment, raffles, crafts, a farmer's market, craft tables, the Cow Maneuver, and other activities for the whole family. The Nashua Symphony and Northern Ballet Theater This theater offers a full season of performances from nationally renowned musicians and performers. In addition to performances, both the Ballet and the Symphony offer a number of workshops and public events throughout the year. Nashua Pride at Holman Stadium The Nashua Pride Professional Baseball Team plays a full season at the Historic Holman Stadium in Nashua. Event Days are very popular at the stadium and include events such as Boston Cannons, Brigham’s Ice Cream Camp Day, Sunday Family Fun Day and Kids Run the Ballpark Day. Keene Pumpkin Festival Tens of thousands of jack-o-lanterns light Keene's downtown every October (the highest count to date is over 28,000). There are many activities planned for all ages, a costume parade, trick or treating, food, musicians, magicians, dancers and many other entertainers, fireworks and of course all of the pumpkins. In 2006, the festival drew approximately 80,000 people to downtown Keene, with many of them staying at lodging facilities in and outside of the City. Regional Recreation Opportunities Wapack Trail Section 1 of the Wapack Trail takes hikers over Mt. Watatic in Ashburnham, MA to Pratt Mountain in Rindge and finally to the New Ipswich Mountains. The southern trailhead is located off of Route 119 in Ashburnham, MA and the northern trailheads are located near the Windblown Ski Center on Route 123 at unmarked turn-offs in New Ipswich. Section 2 of the trail takes hikers on to Temple Mountain and eventually ends near the Temple Mountain Ski Area. The southern trailhead is the same as the Section 1 northern trailhead and the northern trailhead is on Miller Road and there is a $3 fee per person. Windblown Cross Country Skiing and Snowshoeing Windblown is located on Routes 123 and 124 in New Ipswich. Windblown offers 25 miles of cross-country skiing and snowshoeing trails and has one cabin available for overnight rentals. Trails are available for all difficulty levels so it is an excellent outdoor resource for people of all ages and varying abilities.

Mason Master Plan, 2007 Update
Regional Context 20
MASON’S ROLE IN THE REGION
Mason is located in the south-eastern area of New Hampshire’s Monadnock Region and the south-western part of the Nashua Region. There are a number of outside influences that affect Mason, however the town has limited control over them. For many of these issues, Mason can similarly affect other communities with its own actions. This section highlights the primary areas that Mason should be concerned about and offers suggestions on how the town can work toward addressing these issues. The Town’s awareness of these issues will help to ensure that Mason is prepared to deal with issues as they arise and continues to be a good neighbor to its adjacent communities.
ENVIRONMENT
Mason has several environmental assets that provide outdoor recreational activities to many people. Russell-Abbott State Forest and Pratt Pond provide recreation opportunities to people from both the town and the Region. A commitment to conservation is evident in preserved land such as the Coyne Wildlife Sanctuary and Spaulding Brook Conservation Land. The 2007 Town Meeting voted to acquire the 283 acre Moheban Parcel. The natural and scenic environment is one of the hallmark traits associated with the Town of Mason and the Monadnock Region. The Town should prioritize and strategically plan ways to assure such prized environmental features are preserved. Recommendation: Continued communication among the respective municipal boards and committees is critical for ensuring thoughtful development is occurring within the town of Mason. Forging strong lines of communication with the towns of Greenville, New Ipswich, Wilton, Brookline, Milford, and Townsend, MA will assure the scale and types of development are compatible with the overarching zoning intents crafted by each of the towns. Mason should continue to encourage the subdivision design schemes that promote conservation.
LAND USE
RSA 36:55 defines development which may potentially produce adverse impacts on a regional scale. It is important for the Town of Mason to forge collaborative partnerships with neighboring towns to establish a regional perspective with concern that local land use decisions can impose impacts on other towns within the region. This collaborative relationship can address ways to appropriately mitigate impacts created by land use decisions. Recommendation: Follow State guidelines pertaining to “Development of Regional Impact” to assure adjacent towns are afforded ample opportunities to review and comment on proposals. Recommendation: New Land Use Board members should be encouraged to participate in the Land Use Training workshops sponsored by the Office of Energy and Planning, the Local Government Center and others
ECONOMY
Employers As this study notes, a large number of residents in the Region commute a sizable distance for employment. Mason has a local job base to retain a portion of residents and many home-based

Mason Master Plan, 2007 Update
Regional Context 21
businesses. Employers like Parker’s Maple Barn, Pickity Place, and The Driving Range create living wage jobs, make a positive contribution to the local job base, and attract visitors from outside of Mason. Recommendation: Mason should continue to promote home-based business and support a diverse economic development strategy, which may include the creation of a commercial zone. Mason could partner with local and regional leaders, economic development organizations, government, and private sector businesses interested in maintaining a sustainable economy.
RECREATION
Regional Trail Network The former Boston and Maine railroad line extends 10 miles from the Massachusetts line across the center of Mason to its end in Greenville. In 1985, the Town of Mason acquired the 6.7 miles of the line in Mason with a Land and Water Conservation Fund grant, to create the Mason Railroad Trail, a multi-use recreational trail. About a decade later, the State of New Hampshire acquired the remainder of the line, and coordinates management of its part of the Railroad Trail with Mason. When Mason banned ATVs from using the Railroad Trail in 2004, the state subsequently adopted this policy also. Recommendation: Recreational Resources are invaluable to the many interested users. However, given the variety of potential uses and input from prospective users, continued communication is critical to ensure the safety of users and maintenance of the trail. Mason should communicate with the Nashua River Watershed Association in order to stay current with the efforts to create a Townsend Rail Trail on the Massachusetts Bay Transportation Authority corridor. If completed, it will make the rail trail in Mason part of a 34-mile trail system. The town should also undertake the creation of a usable map for trails located on the Bronson Potter Estate.
REGIONAL AND STATE ORGANIZATIONS
SOUTHWEST REGION PLANNING COMMISSION 20 Central Square, 2nd Floor, Keene, NH 03431, (603)357-0557 The Southwest Region Planning Commission (SWRPC) currently serves 36 member-municipalities in Cheshire, western Hillsborough, and Sullivan Counties. SWRPC provides local assistance on a wide range of planning issues to member municipalities through activities including community master planning, site plan review, capital improvement planning, subdivision reviews, ordinance preparation, interpretation of state and local planning requirements, grant administration, cartographic support, and geographic information system (GIS) applications. The agency has a diverse work program made up of six major program areas: Local Planning Assistance, Natural Resources Planning, Community and Economic Development, Transportation Planning, Hazard Mitigation Planning, and Regional and Geographic Information Systems. (http://www.swrpc.org)
MONADNOCK CONSERVANCY P.O Box 337, Keene, NH, 03431, (603) 357-0600 The Monadnock Conservancy is a regional non-profit land trust that assists land owners and municipalities with protecting land through easement, donation or purchase of land. Preservation efforts may include farmland; productive forest; open space; recreational trails; water supply; wildlife corridors; scenic ridgelines above the City of Keene and the Ashuelot River Valley; floodplain, aquifer and wetlands

Mason Master Plan, 2007 Update
Regional Context 22
along the Contoocook River; and, scenic forests along the Wapack Trail and the Monadnock-Sunapee Greenway. (http://www.monadnockconservancy.org/)
THE NATURE CONSERVANCY New Hampshire Chapter, 22 Bridge Street, 4th Floor, Concord, NH 03301, (603) 224-5853 On statewide level, the Nature Conservancy preserves plant, animal and natural communities by protecting the lands and waters they need to survive. To date the Nature Conservancy has protected more than 265,000 acres in New Hampshire. They also provide an extensive learning program and field trips for residents of New Hampshire. (http://www.nature.org/wherewework/northamerica/states/newhampshire/)
NICHOLS-SMITH CONSERVATION LAND TRUST PO Box 266, Hollis, NH 03049 The Nichols-Smith Conservation Land Trust (NSCLT) exists to help conserve the natural resources and open spaces of the region. They place special emphasis on conserving farms and forests, waterways and wetlands, scenic ways and wildlife habitats. NSCLT is directed by an elected Board of Trustees. NSCLT currently monitors three conservation easements with the Town of Hollis at Woodmont Orchards, the Beaver Brook Organization in Hollis, and the Town of Milford. Although active in nearby towns, the NSCLT is not currently involved with any conservation easements in Mason. (http://www.nsclt.org/)
UNIVERSITY OF NEW HAMPSHIRE COOPERATIVE EXTENSION 329 Mast Road, Goffstown, NH 03045, (603) 641-6060 The University of New Hampshire Cooperative Extension provides New Hampshire citizens with research-based education and information, enhancing their ability to make informed decisions that strengthen youth, families and communities, sustain natural resources, and improve the economy. The Hillsborough County UNH Cooperative Extension services include 4-H Youth Services, Nutrition Services, Family and Consumer Resources, Agriculture Resources, and Forestry and Wildlife Services. (http://extension.unh.edu/Counties/Hillsboro/Hillsboro.htm)
SOUHEGAN VALLEY LAND TRUST PO Box 417, Milford, NH 03055 Founded in 1970, the mission of the Souhegan Valley Land Trust, a non-profit organization, is to ensure good stewardship and appreciation of the natural and historic resources in the Souhegan Region. The Land Trust promotes activities for the protection and enjoyment of the lands through education, cooperation, and best management practices. (http://www.svlt.org/)
SOUHEGAN VALLEY CHAMBER OF COMMERCE 69 Route 101A, Amherst, NH, 03031, (603) 673-4360 The Souhegan Valley Chamber of Commerce is an economically vital organization recognized as a leading force in improving the economic health, business environment and overall vitality of the areas towns encompassing the Souhegan Valley. It serves as an essential Information Resource Center, and represents a diverse business membership. The Chamber supports and is developing educational enrichment opportunities for the youth of our communities and is instrumental in the development of a diverse and capable work force that will fill future employment needs in the area. Seeking to afford growth for the future while sustaining the valued quality of life within the Souhegan Valley, the Souhegan Valley Chamber of Commerce is an asset to both local businesses and residents.

Mason Master Plan, 2007 Update
Regional Context 23
(http://www.souhegan.net)
SOUTHWESTERN COMMUNITY SERVICES 69-Z Island Street Keene, NH 03431 (603) 352-7512 Southwestern Community Services, Inc. (SCS) is one of six community action agencies throughout New Hampshire, and part of the larger network of 70 agencies in New England and nearly 900 agencies nationwide. SCS advocates for and assists citizens in need through a variety of program areas including Head Start, fuel assistance, developmental services, economic development, elderly services, weatherization, homeless services, housing rehabilitation, affordable housing, health and nutrition, and workforce development. (http://www.scshelps.org/)
ECONOMIC DEVELOPMENT CORPORATIONS Monadnock Economic Development Corp., 39 Central Sq., Ste. 201 Keene, NH 03431 (603)352-4939 Gateway Industrial Development Corp., PO Box 2019, Nashua, NH 03061-2019, (603) 883-7030 15 Non-Profit Regional Economic Development Corporations are active throughout New Hampshire. Mason lies on the boundary of two regions and would likely be served by Monadnock Economic Development Corporation in Keene or the Gateway Industrial Development Corporation in Nashua. Both are private, not-for-profit regional development organizations committed to the creation of jobs and the broadening of the tax base. Both organizations concentrate their efforts on business retention, relocation, expansion, and recruitment projects, as well as downtown revitalization and rehabilitation projects.
NASHUA RIVER WATERSHED ASSOCIATION 592 Main Street, Groton, MA 01450, (978) 448-0299 Founded in 1969, the Nashua River Watershed Association's mission is to work for a healthy ecosystem with clean water and open spaces for human and wildlife communities, where people work together to sustain mutual economic and environmental well-being in the Nashua River watershed. They serve as an educator, advocate, and steward for the 31 watershed communities in north central Massachusetts and southern New Hampshire. (http://www.nashuariverwatershed.org/)
MERRIMACK RIVER WATERSHED COUNCIL 600 Suffolk Street, Fifth Floor, Lowell, MA 01854, (978) 275-0120 The Merrimack River Watershed Council’s mission is to protect and promote the wise use of the Merrimack River Watershed through environmental monitoring, watershed education, advocacy, recreation and community organizing. The four main objectives of the mission are to monitor the Merrimack River main stem, increase watershed knowledge through advocacy, education, and outreach, provide recreational opportunities for the public and to advocate for the health of the watershed by providing assistance to communities who are interested in starting their own watershed monitoring program. (http://www.merrimack.org/)
NH OFFICE OF ENERGY AND PLANNING 57 Regional Drive, Suite 3, Concord, NH 03301, (603) 271-2155 The NH Office of Energy and Planning (NH OEP), formerly known as the Office of State Planning, is based in Concord and is legislatively required to plan for the orderly development of the State and the wise management of the State’s resources. NH OEP compiles, analyzes, and disseminates data, information, and research services to advance the welfare of the State; encourages and assists with planning, growth management, and development activities of cities and towns; administers select Federal and State grant-in-aid programs; and participates and advises in matters of land use planning regarding

Mason Master Plan, 2007 Update
Regional Context 24
lake and river management programs. NH OEP typically does most of its work with communities through the regional planning commissions. (http://www.nh.gov/oep/)
NH DEPARTMENT OF RESOURCES AND ECONOMIC DEVELOPMENT 172 Pembroke Road, P.O. Box 1856, Concord, NH 03302, (603)271-2411 The Department of Resources and Economic Development (NH DRED) consists of four divisions: Forest and Lands, Parks and Recreation, Travel and Tourism Development, and Economic Development. The Division of Forests and Lands protects and promotes the values provided by trees, forests and natural resources (and includes the Natural Heritage Bureau) while the division of Parks and Recreation aims to protect historic and natural resources. Promoting New Hampshire as a travel destination is the mission of Travel and Tourism Development Division. Similarly, the Economic Development Division promotes businesses and the expansion of existing businesses. (http://www.dred.state.nh.us/)
NH DEPARTMENT OF ENVIRONMENTAL SERVICES 29 Hazen Drive, P.O. Box 95, Concord, NH 03302, (603) 271-3503 The goals of the NH Department of Environmental Services (NH DES) are to protect and promote wise management of the State’s environment. The Department’s responsibilities include ensuring high levels of water quality for water supplies, regulating the emissions of air pollutants, fostering the proper management of municipal and industrial waste, and managing water resources for future generations. (http://www.des.state.nh.us/)
U.S. ENVIRONMENTAL PROTECTION AGENCY, REGION I 1 Congress Street, Suite 1100, Boston MA 02114, 888-372-7341 The goal of the Environmental Protection Agency Region I (New England) is to protect human health and safeguard the natural environment where people live, learn, and work in the six New England states: Connecticut, Massachusetts, Maine, New Hampshire, Rhode Island, and Vermont. One way to help accomplish this goal is to ensure that communities have access to accurate information sufficient to effectively participate in managing human health and environmental risks. This federal agency is a resource for information on environmental regulation, resource protection, and human health protection. (http://www.epa.gov/Region1/)
NH MUNICIPAL ASSOCIATION OF THE NH LOCAL GOVERNMENT CENTER 25 Triangle Park Drive, PO Box 617, Concord, NH 03302, (603) 224.7447 The New Hampshire Municipal Association was established in 1941 to serve member cities and towns. NHMA has evolved into a service and action arm for New Hampshire local governments. The Association prides itself on its ability to meet the ever-changing educational and training needs of municipal officials and employees, as well as the flexibility to develop new programs designed to meet the needs of local governments. Today, NHMA represents 233 of the 234 Granite State Communities and offers legal and technical assistance, legislative representation, training, workshops, and personnel services. (http://www.nhmunicipal.org)
REGIONAL PUBLICATIONS AND REPORTS
Southwest Region Planning Commission Reports: Guiding Change, The Southwest Region at the Beginning of the 21st Century (2002)

Mason Master Plan, 2007 Update
Regional Context 25
Guiding Change, The Southwest Region at the Beginning of the 21st Century, is the Region’s Master Plan. RSA 36:45 requires regional planning commissions to prepare plans for their respective regions ... "taking into account present and future needs with a view toward encouraging the most appropriate use of land, such as agriculture, forestry, industry, commerce, and housing; the facilitation of transportation and communication, the proper and economic location of public utilities and services; the development of adequate recreational areas; the promotion of good civic design; and the wise and efficient expenditure of public funds.” This Plan, prepared by Commission staff and the SWRPC Board of Directors with input from municipal officials and citizens, considers those qualities and attributes which residents thought defined the Southwest Region, and were considered important to preserve. This list includes the physical environment, the historical and cultural richness, a strong economy, and the public spirit of citizens who have worked together for years to preserve these qualities in the Monadnock Region. The Regional Plan will be updated every five years. Southwest Region Trends and Conditions (June 2003) The Southwest Region Housing Trends and Conditions report presents 1) a brief discussion of housing as a community development issue, including an overview of housing related information at the national, state, regional and municipal levels, and 2) an array of data and statistics relevant to housing and prevailing socioeconomic conditions in the Southwest Region. Southwest Region Housing Needs Study (September 2004) The Southwest Region Housing Needs Study 1) provides a detailed analysis of housing trends and housing cost burdens by income level based on US Census data for the Southwest Region, and 2) develops an approach to estimating future housing production needs for the Southwest Region. The report highlights housing needs and trends in the Southwest Region and its counties, as well as statewide totals. The report uses Census data to analyze changes in population, households by tenure, vacancy rates, and housing cost burden for renters and single family homeowners, and estimates the range of and demand for housing production for the 2000-2010 period. Southwest Region Natural Resources Inventory (October 2003) The Southwest Region Natural Resources Inventory provides a basic analysis of natural resources and landscape fragmentation on a regional scale that can be used “as is” by municipalities as their first edition NRI, or used as a template to be enhanced with original local research and local knowledge. While a set of topographic maps annotated with information by residents about the character of the forests and ponds, movement of wildlife and viewscapes that define their town is a perfectly acceptable starting point for conservation planning, the Planning Commission offers this analysis of available GIS information. It is hoped that this project can provide a common point of departure for the development of municipal NRI’s in the Southwest Region. Southwest Region Transportation Plan (2006 update) The Regional Transportation Plan presents policy and technical information relevant to local, regional, and state activity of the planning and management of the transportation system. The Plan facilitates a regional approach among local and state decision makers to planning and decisions regarding transportation, land use, and community development. Comprehensive Economic Development Strategy for Southwest New Hampshire (2005) The purposes of the Comprehensive Economic Development Strategy (CEDS) for Southwest New Hampshire are to promote greater coordination among communities and economic development interests and to establish eligibility for federal assistance through the U.S. Economic Development Administration. The current CEDS was developed through a year-long effort by the CEDS Advisory Committee, with

Mason Master Plan, 2007 Update
Regional Context 26
input from interested stakeholders at a series of public meetings and support from experts in such fields as workforce development, vocational training and housing. The Committee reviewed and analyzed existing trends and developed goals and objectives to help the Region control its destiny and protect its competitive advantage in New England and the global economy in the coming years. The CEDS will be updated annually and revised every five years. Nashua Regional Planning Commission Reports: Region-wide Buildout Impact Analysis (2005) The primary goal of the buildout analysis is to provide policy makers and the public with the information needed to make informed choices regarding the future growth of the region. Understanding what the region will look like at buildout is critical to the evaluation of current land use policies, including zoning and growth management ordinances and open space acquisition. A better understanding of the growth potential for a municipality can be a valuable resource for planners and elected officials struggling with land use decisions. A further purpose of this analysis is to explore how current regulations set the blueprint for future growth. Zoning regulations pertaining to allowable uses and allowable densities are an indication of the desired type and amount of growth that will occur in currently undeveloped areas.6 2004 Regional Housing Needs Assessment The need for housing in general and affordable housing in particular, has been classified by housing advocates as an “acute shortage” in New Hampshire. The growing imbalance between housing costs and wages and the resulting impacts on the regional economy, environment, and transportation system have been the focus of this discussion. While low and moderate-income households are impacted the most, nearly all segments of the population are affected by the issue. As defined in state law, the purpose of a housing needs assessment is to determine the existing and future need in the region for housing of all levels of income. This document contains a compilation of relevant demographic and housing data for each of the region’s twelve municipalities Nashua Metropolitan Area Long Range Transportation Plan (2004) This plan not only presents project specific improvements to promote inter-modal connectivity and efficiency in the movement of people and goods, but also promotes a vision of the region that will enhance and maintain the quality of life in the NRPC communities. The plan is reflective of the goals and objectives outlined by the member communities in their own master plans and policies. This plan was developed as a result of a continuing, cooperative, and comprehensive planning process, which considers all transportation modes and supports metropolitan community development and social goals.
Montachusett Regional Planning Commission Reports: Montachusett Region Comprehensive Economic Development Strategy Five Year Plan (2005) A Comprehensive Economic Development Strategy or CEDS promotes economic development and opportunity, fosters effective transportation access, enhances and protects the environment, and balances resources through sound management of development. Montachusett Regional Transportation Plan - 2003 (RTP) The primary purpose of the Regional Transportation Plan for the Montachusett Region is to provide a beneficial guide and a decision-making framework for local, regional and state officials by identifying both the short and long range transportation and air quality improvements that should be implemented in the region, and to comply with the Transportation Equity Act for the 21st Century (TEA-21). It presents
6 Nashua Regional Planning Commission, Region-wide Buildout Impact Analysis, (2005), p. 10

Mason Master Plan, 2007 Update
Regional Context 27
alternatives and makes recommendations that are designed to reinforce the region's stated goals and objectives for regional development.
SUMMARY
The information presented in this chapter offers Mason the opportunity to work closely with adjacent communities and communities of the wider Region to accomplish together what they could not accomplish alone due to funding, resources or the sheer size of the goal. The regional concerns identified in this chapter could have a greater impact on the Town of Mason if the Town takes an isolated approach to addressing the issues. The larger regional context provides a basis for Mason to garner a broader understanding of the situation at hand, in order to better plan for the changes to come. In addition, the resources identified throughout the chapter can assist the community, and its neighbors, with addressing forthcoming pressures or problems. Establishing a relationship with abutting communities and regional groups will ensure that the Town is in the best possible position to handle each demand that comes its way.

Mason Master Plan, 2007 Update
Land Use 28
EXISTING LAND USE
INTRODUCTION
This chapter describes the pattern of existing land uses in Mason and analyzes the changes that have taken place in the land use pattern since 1987, the date of the last land use analysis for Mason. Maps are used to identify the areas of town that have been developed, the kind of development that has occurred, and the relationship of one land use to another. This information provides the baseline necessary to evaluate the appropriateness of future development and the availability of suitable land for such development.
LAND USE CATEGORIES
Land uses are described based on the physical characteristics (altered terrain, buildings, pavement, other infrastructure, etc.) and/or human uses and activities. The two major classes of land use are "developed" and "undeveloped" uses. These classes are further subdivided into specific land uses. The following is a list and description of the standard “developed” land use categories used to prepare a land use plan: ♦ RESIDENTIAL: All land and/or structures used to provide housing for one or more households. These include site-built single family homes, manufactured homes (previously known as mobile homes), factory-built modular homes, duplexes, apartment buildings, condominiums, and seasonal residences. ♦ PUBLIC/SEMI-PUBLIC: Establishments and facilities supported by and/or used exclusively by the public or non-profit organizations, such as fraternal, religious, charitable, educational and governmental facilities. ♦ AGRICULTURAL: Land that is utilized for the cultivation of crops, the raising of livestock and poultry, and nurseries for horticultural purposes. ♦ FORESTRY: Land used for the study and management of forests. These lands provide timber as raw material for wood products, wildlife habitat, natural water quality regulation, recreation, landscape and community protection, employment, and maintenance of atmospheric carbon dioxide levels. ♦ COMMERCIAL: All lands and structures that supply goods and/or services to the general public. This includes such facilities as restaurants, motels, hotels, service stations, grocery stores, furniture and appliance sales, as well as establishments which are primarily oriented to providing a professional and/or personal service to the public, such as medical offices, banks and financial institutions, personal care establishments, etc.
♦ INDUSTRIAL: Land and/or facilities used for mining, construction, manufacturing, treatment, packaging, incidental storage, distribution, transportation, communication, electric, gas and sanitary services, and wholesale trade.
♦ HOME-BASED BUSINESS: A residential property that houses a home occupation or home-based business. The residence continues to be the principle use of the land, and the occupation is by definition secondary and incidental.

Mason Master Plan, 2007 Update
Land Use 29
♦ ROAD NETWORK: All public and private rights-of-way that are designated for carrying vehicular traffic. This includes Class VI roads that are no longer maintained by the town and do not carry public traffic.
♦ PROTECTED LANDS: Included in this category are all federally-owned lands, all State parks and forests, land protected under New Hampshire’s Land and Community Heritage Investment Program (LCHIP), land protected and/or owned by the town, sensitive land and wildlife habitats protected by the NH Audubon Society, land held by the Society for the Protection of NH Forests and the Monadnock Conservancy.
♦ UNDEVELOPED: All lands that are not developed for any of the above uses, regardless of the reason - whether it be because the land is not usable due to environmental constraints, or there has been no demand to develop.
FACTORS THAT INFLUENCE LAND USE
The distribution and kinds of land use are determined by the interaction of many factors ranging from the physical landscape conditions and individual land owners choices to regional economic conditions to municipal land use regulations and availability of public services and infrastructure.
WATER
Mason is a highland town where the headwaters of two high-quality rivers arise. The wetlands and streams of northern and eastern Mason feed into the Nissitissit River in Brookline and those of western and southern Mason feed into the Squannacook River in Townsend Mass. Spaulding and Gould Mill Brooks are Mason’s largest Nissitissit headwater streams, and Mason and Walker Brooks are the largest Squannacook headwater streams. Both these rivers are major tributaries of the Nashua River. The water quality of Mason’s streams has a direct impact on many communities within the Nashua River watershed. The town of Mason has an important stewardship role in protecting this larger watershed as it preserves the quality of its own water resources. For most of Mason’s area, the precipitation that falls upon the land is the only source of water. Only two streams feed into Mason from surrounding towns: Mitchell Brook in Mason’s northeast corner rises in Wilton, and Walker Brook in Mason’s southwest corner rises in southern Greenville and southeast New Ipswich. For the rest of Mason, the rain and snow that fall and filter into the ground and run off into the wetlands and brooks are the town’s only water supply sources. As development pressure grows, it is increasingly vital to guide land uses so that the quality and quantity of Mason’s water resources are protected. What happens on Mason’s land directly impacts the water upon which Mason’s residents and businesses depend.
TRANSPORTATION SYSTEMS
Settlement in Mason has been influenced by three roads; NH Route 124 (runs northwest to southeast through the southwest corner of town), NH Route 31(runs north to south through the southwest corner of town) and most profoundly by NH Route 123 (runs north south from the center of the southern border of Mason to the Town Center then turns west towards Greenville). All three routes are classified as minor arterial highways. Minor Arterials link cities and larger towns and form an integrated network providing interstate and inter-county service. They provide service to corridors with trip lengths and travel density

Mason Master Plan, 2007 Update
Land Use 30
greater than those served by rural collectors and local roads and with relatively high travel speeds and minimum interference to through movement. Minor arterials distribute traffic to smaller geographic areas, and place more emphasis on providing land access than the major arterials. From a regional standpoint, Route 123 should be classified as the Town’s major arterial highway due to the road’s importance to local access. Brookline Road should be considered influential for continued development and access to economic centers south of Town. There is no access to public transportation in Mason. There are three private airstrips located in Mason and Brookline for emergency transportation.
TOPOGRAPHY & SOILS
To some extent, topography and soils also play a role in any town's development. Historically, people built houses and roads on land that was most easily accessed; and soil type and characteristics influence what kind of development will occur - farming, for example, and where that development will take place. The average elevation in Mason is 591 feet, with elevations increasing from the southern region of the Town, where elevations range from 100’ to 300’, to the northern region of the town with elevations just over 1130’. The two most distinguishing features in Mason are Pole Hill and Mitchell Hill both with elevations of just over 850 feet. Topography in Mason is varied. In the southern portion of the town the topography is hilly with elevations varying from 100’ to 300’ with the lowest elevations in the southeast corner. Elevations continue to rise to the north where both Pole Hill and Mitchell Hill are located, with a hilly terrain along the eastern boundary of the Town. There are steep elevation increases in the northwest section of the town within the Russell Abbott State Forest. The soils of Mason are characteristic of the Monadnock Region with an almost equal division among developable and non-developable soil types. Approximately 50% of the soils in Town are suitable for development while some 50% have restrictive features such as wetness, steepness of slope, hardpan or floodplain conditions. Soils on steep slopes are usually thin with exposed bedrock or a shallow depth to bedrock. Floodplain soils tend to be fine and sandy with wetland conditions. Floodplain areas often have a well-developed topsoil making them desirable for certain agricultural uses. Wetland soils in Mason are those that the soil survey categorizes as being poorly drained or very poorly drained (including muck and peat). Mason has a very scattered pattern of wetland soils, accounting for 1,277 acres.
EXISTING LAND USE
An analysis of the present land use pattern in a town is one of the first steps in the formulation of a land use plan. Since the type and intensity of existing land uses have a strong influence on future development patterns, it is important to understand how land and other resources are used within a given area before recommendations can be developed relative to future land uses. The development of Mason’s land has gone through several changes as economic emphasis has shifted from one period to another. The early agrarian society of the Town dominated the land use pattern of Mason in its formative years. Small cottage industries developed throughout the town and when the railroad provided access to the area in the 1850’s many products from Mason were shipped to Boston. The lack of water sources sufficient to support major power needs and the topography throughout the town led to very little industrial development. The community services including the town hall, churches, and library gave the village center the visual impact of an early New England town and little has changed in the Town Center since that time.

Mason Master Plan, 2007 Update
Land Use 31
This is the image of Mason which persists to this day, and one which the residents of town are so desirous of maintaining in the face of anticipated growth. See Map 2.1, Existing Land Use. Many New Hampshire towns have developed in a similar manner to Mason. Our towns and cities were established when living patterns were less complex than they are today. Travel was difficult, and people lived close to their work, and to the services they required. The village center of Mason is typical of this clustering of homes and services. The automobile changed the traditional patterns of development, bringing strip development and mini-malls to many towns. Mason has avoided this type of development to a great extent. Mason has a total area of 24 square miles or 15,465 acres. Of this, 64 acres consists of surface water. Of the total land area, 15 percent is presently developed for one of the uses described earlier in this text. Attempting to calculate exact acreages for land uses - particularly residential usage, is difficult. Therefore, a commonly-used methodology is to simply assume two acres per each residential, commercial, institutional, or exempt parcel. For mixed-use properties with both residential uses and commercial uses, this methodology assumes 2 acre for residential usage and 1 acre for commercial usage (3-acres total). Mixed-use properties containing residential and agricultural uses assumed 2 acres for residential and the remainder of the property in agricultural use. An agricultural land use assumes the entire parcel acreage is in this use. The land area taken up by roads and highways is calculated by assuming a 40-foot right-of-way, multiplied by the number of miles of road. The analysis of existing land use in Mason in 2006 was performed using Geographic Information System (GIS) technology with 2006 tax assessing data. The 2006 tax assessing data from the Town of Mason breaks land uses into the categories shown in Table 2.1. The predominant land use in Mason is single family residential. Most of this development is in year-round single family homes. Residential use is located throughout the town, but is concentrated in the southern portion. There are lesser concentrations occurring in the north. As noted earlier, there are several parcels where more than one land use occurs. Mixed-use properties were determined by the Building Inspector and the Administrative Assistant to the Selectmen along with a staff member of the Southwest Region Planning Commission. In total there are 31 parcels, a majority of which combine residential and commercial use in the form of retail, professional offices, home-made goods, and educational services; there are four parcels in town that combine residential and agricultural uses. Commercial land use has increased by a significant amount since 1979; however, a central location of commercial activity has yet to be established. It is important to note that these commercial land uses occur mainly as home-based businesses throughout the community. The majority of commercial activity that is independent from residential usage occurs mainly in the southwest corner of the Town, near the intersections of Route 124 and Route 31. Public and semi-public uses are clustered in the village center and consist of the Town Offices, Town Hall, Police Department, Mason Elementary School, and the Mason Public Library. The only Industrial activity is the granite quarry located on Starch Mill Road, Fletcher’s Quarry. Public recreation is provided in many areas of the Town. Most Town owned lands are open for passive recreational use and some active recreation. An extensive trail network is open to the public on the land of Charles W. Fifield, III, located in the northeast section of the town. The Town has also created a Rail-Trail from the former Boston and Maine Railroad line that bisects the Town from north to south.

Mason Master Plan, 2007 Update
Land Use 32
Roads and highways, while not typically thought of as a "use" per se, do take up nearly 272 acres of land. “Other Undeveloped” at the bottom of the table is the remaining acreage for parcels where only 2 acres of the parcel was considered part of the use. The rest of the land is not likely impacted by the use on the property, but it is not conserved or put into current use.
Table 2.1: Existing Developed Land Use in Mason, 2006
Land Use Number
of Parcels
Calculated Acres
% of Developed
Land
% of Total Land Area
Method
Developed Areas Residential 613 1,226 53.2% 7.9% (2ac/parcel) Commercial 16 32 1.4% 0.2% (2ac/parcel) Agricultural 5 240 10.3% 1.6% (actual) Industrial 1 218 9.4% 1.4% (actual) Exempt Municipal/State 35 70 3.0% 0.5% (2ac/parcel) Institutional 3 6 0.3% 0.0% (2ac/parcel) Mixed-use Res/Comm 31 93 4.0% 0.6% 3ac/parcel) Mixed-use Res/Agric 4 117 5.0% 0.8% (actual) Transportation Infrastructure -- 272 11.7% 1.8% (40 ft ROW x road miles)
Total Developed 708 2,274 98% 14.7%
Undeveloped Areas % of Undeveloped
Land Conservation 31 2,250 17.1% 14.5% (actual) Current Use 122 5,221 39.7% 33.8% (actual) Surface Waters 64 < 1% < 1% (actual)
Other Undeveloped 5,714 43.4% 36.9% (Total land area minus all other
uses)
Total Undeveloped 153 13,249 100.2% 85.3%
Total 861 15,523 The Current Use Taxation program was enacted in 1973 to promote the preservation of open land in the state by allowing qualifying land to be taxed at a reduced rate based on its current use value as opposed to a more extensive use. The minimum land area currently needed to qualify is ten acres. The price of this favorable treatment is a 10 percent penalty tax (10% of the sale price) when the property is later changed to a non-qualifying use. See Map 2.2, Current Use. The current use designation, authorized by RSA 70-A, provides the town other benefits as well: it encourages landowners to maintain traditional land-based occupations such as farming and forestry; promotes open space, preserving natural plant and animal communities, healthy surface and groundwater; and provides opportunities for skiers, hikers, sightseers, and hunters.

Mason Master Plan, 2007 Update
Land Use 33
In comparing conservation easements to Current Use taxation, easements are permanent, while Current Use may be reversed by change to a non-qualifying use and payment of the use change tax. Thus, Current Use may satisfy the goals of a landowner who chooses not to participate in alternative land protection strategies such as sale of development rights or conservation easements. Currently, 5221 acres, or 33.8% of Mason is in Current Use.
LIMITATIONS TO DEVELOPMENT
The data concerning the existing land use pattern reveals that roughly 15 percent of Mason's total land area is currently developed, leaving some 13,141 acres undeveloped. Not all of this land, however, is suitable for development. Limiting factors to development include steep slopes, certain soil types, wetlands, aquifers, floodplain areas, and other sensitive lands or features. In addition to these physical constraints, development is limited by the public's desire to protect the quality of life and property values of existing residents. This public will is ideally expressed in the town's land use regulations, and is the central purpose of this planning document. A Development Constraints Map (Map 2.3) has been created using Geographic Information System technology showing limitations to development in Mason. This map identifies the seven constraints to development that are related to the ability of the soil to accommodate septic systems, road or building construction.
Table 2.2: Limits to Development
Constraint Acres % of Undeveloped Area
Total undeveloped land area 12,492 100% Slopes greater than 25% 1,195 10% Poorly and very poorly drained soils (hydric soils)
1,277 10%
Wetlands* 506 4% Floodplain 165 1% Aquifer 2,249 15% Shallow to bedrock soils (Less than 40 inches)
3,606 29%
Shallow to water table (Less than 1.5 feet)
1,298 10%
Source: SWRPC Geographic Information System and *National Wetlands Inventory (NWI)
Reference to the maps illustrates that one or more of these development constraints exists virtually all over town. There are in fact, only a few areas on the map that appear to have no limitations at all. It is interesting to note that the southern area of the town has fewer limitations to development which was probably a primary reason why the area has been the site of more development. The northern portion of the Town has many steep slopes including the Mitchell Hill area. In comparing limitations to development to the Existing Land Use Map, it can be seen that, while the development does follow almost every road in town, the areas shown as having the greatest constraints have not been developed. How much of this pattern is due to the natural constraints of the land or to other factors such as road access is not known. Future land use is also dependent upon local zoning. There are three zoning districts in the Town of Mason, Village Residential (VR), General Residential, Agricultural, and Forestry District (GRAF) and

Mason Master Plan, 2007 Update
Land Use 34
the Historic Preservation District (HP). Future land use is often determined by permitted or non-permitted uses in each district. Currently, residential uses are permitted by right in all the districts and all commercial and industrial businesses are permitted only by special exception in the GRAF and VR districts. See Map 2.4, Zoning.

Mason Master Plan, 2007 Update
Community Facilities 35
COMMUNITY FACILITIES
INTRODUCTION
This section of the Master Plan identifies public and semi-public facilities that serve the residents and property owners of Mason. RSA 674:2:III.c recommends including a community facilities section which “identifies facilities to support the future land use pattern…, meets the projected needs of the community, and coordinates with other local governments’ special districts and school districts, as well as with state and federal agencies that have multi-jurisdictional impacts.” An important function of town government is to provide residents and property owners with a level of service commensurate with taxes and fees paid that meet the current needs of the populace. In Mason's case, these include public safety (police, fire, and ambulance), public works (water, sewer, roads, solid waste disposal, and cemetery maintenance), schools, recreation, cultural facilities, health and welfare services, and the town government operations (selectmen, property maintenance, and assessment). The degree to which these facilities are developed has a significant impact on the quality of life and general character of a community. This section of the Master Plan presents an inventory of such facilities and services, an assessment of the adequacy of the current level of service, and any plans or recommendations to expand, improve, or add to an existing facility or service.
COMMUNITY FACILITIES
TOWN HALL/TOWN GOVERNMENT
The Town Offices are located at 16 Darling Hill Road in the village center. The two-story wood frame structure, known as the Mann House, was built in 1774 and was given to the Town in 1984 by Jim and Anna Rowse who owned New England Apple Products. It houses the offices of the Selectmen, Town Clerk/Tax Collector, and the Building Inspector. The common room is used for all town board meetings, as a waiting room, and for researching maps. The Town Offices share this location with the Library and the Town’s Historical Room. The Town Offices are wheelchair accessible and are open daily during regular business hours, excluding weekends and holidays, and certain evenings for meetings. Currently the office is equipped with a Dell computer system for use by the Selectmen, Town Clerk/Tax Collector and the Building Inspector. There is a lack of space for adequate file storage, some equipment is outdated and needs to be replaced and there is a need for additional office staff. The Town Hall located at the heart of the Village was built in 1840, and is used for Town Meeting and other community events. The building, while highly valued by the townspeople, is in need of repair and should be included in the Capital Improvements Plan.
POLICE PROTECTION
The Police Station is located at 38 Darling Hill Road and is a 1.5 story, framed modular building built in 2006 and it is handicapped accessible. Equipment consists of a 2004 Nissan, purchased new, in good condition and a 2006 Nissan, purchased new, in excellent condition. There is one full-time police chief, two full-time officers, four part-time officers and one part-time administrative staff. Dispatch services are provided by the Hillsborough County Sheriff’s Department, Base 300. Over the past five years Mason has responded to 150 mutual aid calls in other towns and has received mutual aid for 60 incidents from other towns.

Mason Master Plan, 2007 Update
Community Facilities 36
Traffic safety concerns, particularly at intersections, are town-wide with the exception of certain locations. Local safety activities are typically addressed as they arise. Future Needs and Plans At this time there are no future needs or plans. Current facilities are in excellent conditions with room for the department to grow.
FIRE AND RESCUE SERVICES
The fire station is located at 101 Depot Road and was built in 1965. It is a 1.5 story, 3,486 square foot wood frame structure and it is not handicapped accessible. The building is used only for the Fire Department and Fire Department Association. The Fire Department is equipped with 2 pumper trucks and one tanker truck. The first pumper truck is a 1991, 1,250 gallon per minute (gpm) truck in good condition. The second pumper truck is a 2000, 1,250 gpm truck in excellent condition. The tanker truck is a 2005, 1,800 gallon truck in excellent condition. Current equipment and location is in satisfactory condition although there is some concern that the department is rapidly outgrowing the current facility. There is one part-time fire chief, 2 part-time assistant chiefs and volunteers that receive stipends for work performed. Dispatch service is performed through the Hillsborough County Sheriff’s Office and mutual aid is provided by the Souhegan Mutual Aid Association as well as fire departments from Townsend and Ashby, Massachusetts. There has been no mutual aid received or given over the last five years.
Table 3.1: Fire Department Responses, 2000-2005
2000 47 2001 58 2002 68 2003 56 2004 57 2005 59
Future Needs and Plans There are currently no plans for future needs, although some concern has been expressed that the fire department is outgrowing its current facilities. There are no new dry hydrants or fire ponds being proposed, although the Planning Board in consultation with the Fire Chief requires fire protection for new subdivisions as needed.
PUBLIC WORKS DEPARTMENT
The Mason Public Works Department is located at 83 Depot Road and is a one-story wood frame with a partial trailer and it is not handicapped accessible. The staff of the Highway Department consists of 4 full-time, 4 part-time and 4 seasonal employees.
Table 3.2: Mason Public Works Department Equipment List Year Make & Model Type Year
Purchased Condition Capacity
1987 672B John Deere Grader Good 13’ blade 1994 520C Dresser Loader 1994 Fair 2.75 cu.yd. 2000 416C Cat Backhoe 2000 Good 1.75 cu.yd.
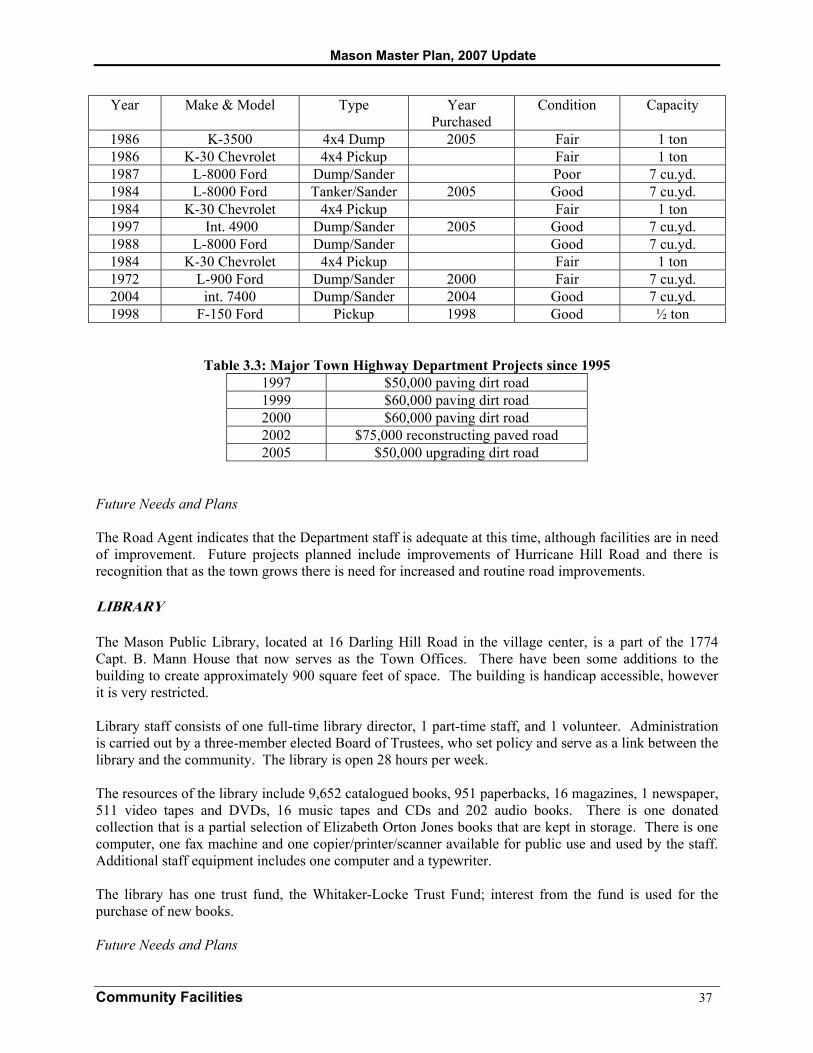
Mason Master Plan, 2007 Update
Community Facilities 37
Year Make & Model Type Year Purchased
Condition Capacity
1986 K-3500 4x4 Dump 2005 Fair 1 ton 1986 K-30 Chevrolet 4x4 Pickup Fair 1 ton 1987 L-8000 Ford Dump/Sander Poor 7 cu.yd. 1984 L-8000 Ford Tanker/Sander 2005 Good 7 cu.yd. 1984 K-30 Chevrolet 4x4 Pickup Fair 1 ton 1997 Int. 4900 Dump/Sander 2005 Good 7 cu.yd. 1988 L-8000 Ford Dump/Sander Good 7 cu.yd. 1984 K-30 Chevrolet 4x4 Pickup Fair 1 ton 1972 L-900 Ford Dump/Sander 2000 Fair 7 cu.yd. 2004 int. 7400 Dump/Sander 2004 Good 7 cu.yd. 1998 F-150 Ford Pickup 1998 Good ½ ton
Table 3.3: Major Town Highway Department Projects since 1995 1997 $50,000 paving dirt road 1999 $60,000 paving dirt road 2000 $60,000 paving dirt road 2002 $75,000 reconstructing paved road 2005 $50,000 upgrading dirt road
Future Needs and Plans The Road Agent indicates that the Department staff is adequate at this time, although facilities are in need of improvement. Future projects planned include improvements of Hurricane Hill Road and there is recognition that as the town grows there is need for increased and routine road improvements.
LIBRARY
The Mason Public Library, located at 16 Darling Hill Road in the village center, is a part of the 1774 Capt. B. Mann House that now serves as the Town Offices. There have been some additions to the building to create approximately 900 square feet of space. The building is handicap accessible, however it is very restricted. Library staff consists of one full-time library director, 1 part-time staff, and 1 volunteer. Administration is carried out by a three-member elected Board of Trustees, who set policy and serve as a link between the library and the community. The library is open 28 hours per week. The resources of the library include 9,652 catalogued books, 951 paperbacks, 16 magazines, 1 newspaper, 511 video tapes and DVDs, 16 music tapes and CDs and 202 audio books. There is one donated collection that is a partial selection of Elizabeth Orton Jones books that are kept in storage. There is one computer, one fax machine and one copier/printer/scanner available for public use and used by the staff. Additional staff equipment includes one computer and a typewriter. The library has one trust fund, the Whitaker-Locke Trust Fund; interest from the fund is used for the purchase of new books. Future Needs and Plans

Mason Master Plan, 2007 Update
Community Facilities 38
The Library Director has recognized a need for the following improvements:
• More space for library collections. • Upgrades to computers to provide online catalog and search capabilities. • More room for library programs and community activities. • Improved access to bathroom area. • Improved handicap access throughout the library.
There are currently no plans for any improvements.
RECREATION
There are a number of recreation facilities in the Town of Mason. The ball fields on Sand Pit Road were added to a few years ago and now a softball league in addition to active ball players use these facilities regularly. Recently, playground equipment and a basketball court were added at this same location. The major community playground is located at the Mason School in the center of town and the School Club is fund-raising to build new equipment there since the existing facilities are a couple of decades old. Trails are important recreational facilities in Mason, besides the Railroad Trail, Mason’s Class VI roads serve as open space recreation facilities for motorized and non-motorized uses. There are trails on conservation lands, particularly ones suited for horseback riding on the town’s Bronson Potter lands and on the Fifield Tree Farm Conservation Easement, which is private land where the public is allowed to use trails on foot and horseback. No ATVs are allowed on these trails, nor on town conservation lands. Mason area horseback riders have organized an club called MANE (Mason Area Neighborhood Equestrians) which holds trail events. The Town of Mason provides recreation facilities and activities through a volunteer Recreation Committee, consisting of four members. The Committee organizes several programs including an Easter Egg Hunt, Memorial Day Festivities, a Halloween Party, and a wreath-making event. There are no full-time recreation employees. Respondents to the community survey were split on the development of new recreational resources for the Town although most people agreed that new playgrounds would be a benefit to the town. Respondents were split on whether or not the Town should develop further recreational resources surrounding ATVs, snowmobiles, ball fields, horseback riding trails, public swimming areas, and tennis and basketball courts.
EDUCATION
Mason is a member of the Mascenic Regional School District administered by School Administrative Unit (SAU) #63. The Mascenic Regional School District includes, in addition to Mason, the towns of New Ipswich and Greenville. SAU #63 includes, in addition to the Mascenic Regional School Districts, the Districts of Lyndeborough and Wilton. The Mascenic Regional School District hosts a comprehensive program for Kindergarten through Grade 12. The facilities consist of six school houses, four of which are in New Ipswich (two elementary schools, the middle school and the high school), and one elementary school each in Mason and Greenville. The Mascenic Regional High School (MRHS) located at 175 Turnpike Road in New Ipswich, serves pupils from Grades 9-12 from all three member towns. As 2005/2006 school year, the MRHS had 391

Mason Master Plan, 2007 Update
Community Facilities 39
students enrolled, 44 of which were residents of Mason. Staff for MRHS includes 36 full-time teachers, 4 teacher’s aides, 2 full-time and 2 part-time administrative staff, and 2 guidance staff. The school has 29 classrooms as well as a library, auditorium, gymnasium, cafeteria, maintenance area and athletic fields. The school is also equipped with televisions, VCRs, DVDs, multi-media projectors, laptop computers, overhead projectors, computers for student use, camcorders, a digital camera, a speaker system, and a laminator.
The elementary school in Mason is located at 13 Darling Hill Road, across from the Town Offices. Full-time staff consists of the principal, one teacher for each grade (1-4), a pre-kindergarten special education teacher, a special education teacher, a school nurse. Part-time staff includes an art teacher, music teacher, physical education teacher, and a guidance counselor.
As of October 1, 2004, the Mason Elementary School had 81 pupils enrolled, including Kindergarten. Information on school enrollments and costs per pupil for Mascenic Regional School District and its neighboring school districts is presented below:
Table 3.4: School District Enrollments, As of October 3, 2005 School Districts
GRADE LEVEL: Mascenic Jaffrey-Rindge Contoocook Valley
Pre-Kindergarten 24 17 11 Head Start 0 135 179 Elementary 411 676 840 Middle School 470 412 932 High School 409 484 1,179 TOTAL 1,314 1,724 3,141
Source: NH Department of Education∗ Within its immediate region, Contoocook Valley is the largest school district, with more than 3,100 students. In the Contoocook Valley District, the largest group of students is in the High School, followed by the Middle School and then the Elementary Schools. This is not the case for all of the other districts examined here, but one characteristic shared by all is that pre-kindergarten and kindergarten have much lower enrollments than either the elementary, middle/junior or high schools.
Table 3.5: Cost Per Pupil, 2004-2005
School Districts
GRADE LEVEL
Mascenic Regional
Jaffrey-Rindge
ConVal
State (avg.)
Elementary $8,448 $8,831 $11,613 $9,406 Middle School $6,468 $8,897 $9,759 $8,557 High School $8,497 $9,432 $8,849 $8,982 Total $7,755 $9,018 $9,982 $9,099
Source: NH Department of Education∗ ∗
∗ Last updated April 24, 2006 accessed at http://www.ed.state.nh.us/education/data/ReportsandStatistics/Enrollment/Enrollment%20by%20District/Enrollment%20by%20District%202005-2006/Enrollment%20by%20District%202005-2006%20Frameset.htm

Mason Master Plan, 2007 Update
Community Facilities 40
Future Needs and Plans Mascenic Regional School District is in need of a new high school. Some consideration is being given to constructing a new high school and making the current high school an elementary school.
CEMETERIES Town cemeteries include Prospect Hill Cemetery on Old Ashby Road (est. 1888), Pleasant View Cemetery on Valley Road (est. 1770), Pole Hill Cemetery on Brookline Road (est. 1773), Pratt Annex Cemetery on Russell Road (est. 1828), and Pratt Cemetery on Starch Mill Road (est. 1817). The cemeteries are maintained by Wallace Brown. Prospect Hill Cemetery is 4 acres, with 304 burial plots and 180 plots remaining. Pleasant View Cemetery is 2 acres, with 220 burial plots and no sites remaining. Pole Hill Cemetery is 0.5 acres, with 80 burial plots and no sites remaining. Pratt Annex Cemetery is 0.25 acres, with 33 burial plots and no sites remaining. Pratt Cemetery is 0.25 acres, with 33 burial plots and no sites remaining.
POSTAL SERVICE
Most Mason residents are served by the Greenville Post Office, located at 15 Main Street in Greenville, NH. Staff consists of two full-time carriers, one part-time carrier, one clerk and the Postmaster. The Post Office hours of operation are 8:00am to 5:00pm, Monday through Friday (closed from 1:00-2:00 for lunch) and 8:00am to 12:00pm on Saturdays. The facility has approximately 428 post boxes. The rural route serves 1,142 households in Greenville and Mason. A small portion of the town in the Mitchell Hill area is served by the Wilton Post Office. Future Needs and Plans The Postmaster indicated that there were no future needs under consideration for the Post Office.
COMMUNITY ORGANIZATIONS
Historical Society The Mason Historical Society meets weekly on Wednesday afternoons at the Capt. B. Mann House. The Historical Society maintains a collection of Town Reports, Church records, School Reports, Cemetery records, and the Fruitdale Grange records. They also maintain extensive Genealogy records of Mason residents. Although they do not lend out materials, they are equipped with a copy machine. Meetings with the Historical Society are available by appointment. It is a completely volunteer organization and membership fluctuates between 10 to 15 people. So far, the facility has been adequate to meet the needs of the organization.
∗∗ Last updated April 19, 2006, accessed at http://www.ed.state.nh.us/education/data/ReportsandStatistics/FinancialReports/CostPerPupil/CostPerPupil2004-2005/CostPerPupil2004-2005Frameset.htm

Mason Master Plan, 2007 Update
Community Facilities 41
Future Needs and Plans Future plans include ongoing discussions with the Selectmen regarding the use of the Mann Store and/or Twig’s schoolhouse, the latter having been recently bequeathed to the Town, to house the Historical Society collection and possibly for meetings.

Mason Master Plan, 2007 Update
Economic Development 42
ECONOMIC DEVELOPMENT
INTRODUCTION
Mason has transformed from an agricultural town to primarily a bedroom community since the turn of the century. Like many small towns in New Hampshire, Mason has a limited amount of commercial and industrial development. Most goods and services including medical and professional services are provided elsewhere in towns such as Milford, Wilton, and Nashua. In 2006, these towns also served as major employment centers. Economic issues facing the town include increasing local school tax burden and the limited commercial and industrial tax base from which to draw. Because of economic restructuring over many years, turning from historic commercial operations and the separation from Greenville, and due to the geographic location, new development in Mason is primarily residential. Following are highlights of Mason’s economic environment: • From 1970-2000, the number of Mason residents classified as managerial/professional sector employees
increased by 678%. This increase is drastic in comparison with the corresponding rate for Hillsborough County of 283% and New Hampshire’s rate of 264%.
• Between 1990 and 2004, the number of employed Mason residents increased by 15.3% according to NH
Economic and Labor Market Information Bureau estimates. In 2004 there were 745 employed residents. • Mason’s largest employers are Parker’s Maple Barn, Pickity Place, and The Driving Range. • Mason’s 2000 per capita income of $28,503 exceeded the average incomes in Hillsborough County
($25,198) and New Hampshire ($23,844). • In 2006, the unemployment rate in Mason was 3.9 %, higher than both Hillsborough County and the
State of New Hampshire (3.5 and 3.4, respectively). • In 2004, 98% of Mason’s total valuation came from residential land and buildings. The remaining 2%
came from commercial properties (.2%), and other properties including utilities (1.8%). • Mason's 2005 equalized tax rate of $14.57 ranked relatively low at 91 out of 216 communities in the
State (communities with the same equalized rate are given the same rank). From 2000-2005, the equalized tax rate decreased from $18.13 to $14.57 ($3.56 or 19.6%).
• Mason is located in the Nashua PSMA Labor Market area. In 2000, 84.3% of employed Mason
residents (540) commuted to another town for work. The most common destination was Nashua (77 trips), followed by Milford (55 trips) and Wilton (28 trips). 226 jobs in Mason are held by employees who live in another town. The most common residence for Mason employees is Greenville with 32, followed by New Ipswich with 31 and Milford with 22.

Mason Master Plan, 2007 Update
Economic Development 43
OVERVIEW OF ECONOMIC INDICATORS
EMPLOYMENT
Between 1970 and 2000, the growth rate for total employed Mason residents outpaced the growth in total population. In this period, population grew by 121.4% (see Housing and Population Chapter), while the number of employed residents over age 16 increased by 174%. In 1970, about 51.5% of Mason’s population was in the workforce; by 2000 this rate had increased to 77% workforce participation. Occupational Trends: Table 4.1 shows the occupation sectors of Mason residents. The largest occupational sector increases since 1970 have occurred in the managerial/professional and sales/administrative service fields. In 1970, 13% of workers were employed in the managerial and professional fields; by 2000 this rate grew to 40%. This growth in "white collar" employment and the decline in manufacturing employment witnessed in Mason are typical throughout the region and across the country, though this increase far surpassed the increases in both Hillsborough County and the State. Regional labor market projections forecast these trends to continue into the foreseeable future. The increase in the precision/production/rep sector grew more slowly. The operators/laborers sector decreased in Mason, while it increased in Hillsborough County and the State. Finally, the transition from farming/forestry decreased more in Mason than in Hillsborough County and the State.
Table 4.1: Percent of Mason Labor Force (16 and Older) in each Sector 1970-2000
Mason % Change 1970-2000
1970 1980 1990 2000 Mason Hillsborough
County New
Hampshire Managerial / Professional 13% 22% 37% 40% 208% 283.1% 264% Technical Sales / Admin 12% 21% 28% 26% 117% 138.8% 158% Service 10% 13% 5% 11% 10% 151.0% 139% Farming / Forestry 4% 4% 2% 1% -75% -46.9% -20% Precision / Production / Rep 24% 18% 14% 10% -58% 23.4% 31% Operators / Laborers 37% 21% 13% 12% -68% 21.9% 24% Total Workforce 252 424 669 690 174% 71% 121%
Source: US Census
Figure 4.1: Occupation of Mason Labor Force Age 16 and Older, 1970-2000
Source: US Census
0
50
100
150
200
250
300
Managerial /Professional
TechnicalSales /Admin
Service Farming /Forestry
Precision /Production /
Rep
Operators /Laborers
Num
ber o
f Em
ploy
ees 1970
198019902000

Mason Master Plan, 2007 Update
Economic Development 44
Another trend projected to grow with the spread of high-speed telecommunications availability is home-based employment. In 2000, 21 Mason residents reported working at home. In a review of Assessors’ Data, 33 home-based businesses were identified. While high speed internet is not widely available in Mason, the future demand on such service is apparent. NHDES estimates that in 2004, 6% of the workforce worked in goods producing industries and 14% of the workforce worked in service providing industries. 19% of the workforce was in private industry while 6% of the workforce was in Federal, State or Local Government.
Major Employers: Mason’s top employers are Parker’s Maple Barn and Restaurant, Pickity Place, and The Driving Range. Based on the employer data, it is apparent that the vast majority of Mason businesses are small businesses that employ less than five employees.
Table 4.2: Top Employers, 2007 Product/ Service Employees Parker’s Maple Barn and Restaurant Food, gifts 51-56
(depending on season)
Pickity Place Food, gifts, herb plants 14-25 (depending on season)
The Driving Range Golf, food, Batting Cages
~ 4
Dream Barns Pole frame construction (no response to inquiry) Source: NH Economic and Labor Market Information Data System and Personal Comms., 2007
Businesses: As illustrated in Table 6, Construction & General contractors comprise the greatest percentage of businesses in Mason (22%), followed by Retail stores (20%) and Agriculture and Wholesale trade both at (15%).
Table 4.3: Businesses by Sector, 2004 Number Percentage Agriculture 6 15% Construction & General contractors 9 22% Health care & Social assistance 3 7% Repair Services 2 5% Educational Services 2 5% Personal services 1 2% Professional and Technical Services 1 2% Restaurants, Bars & Pubs 3 7% Retail stores 8 20% Wholesale trade 6 15%
TOTAL 41 100% Source: NH Economic and Labor Market Information Data System
Educational Attainment: A well-educated workforce is an important resource for both existing and new businesses. As shown in the Housing and Population Chapter (Table 7.3), Mason residents aged 25 and older became more educated from 1990-2000. The percentage of residents with a High School diploma or higher increased from 85.4% to 89.5%. The percentage of residents with a Bachelor’s degree or higher increased from 28.3% to 30.9%.
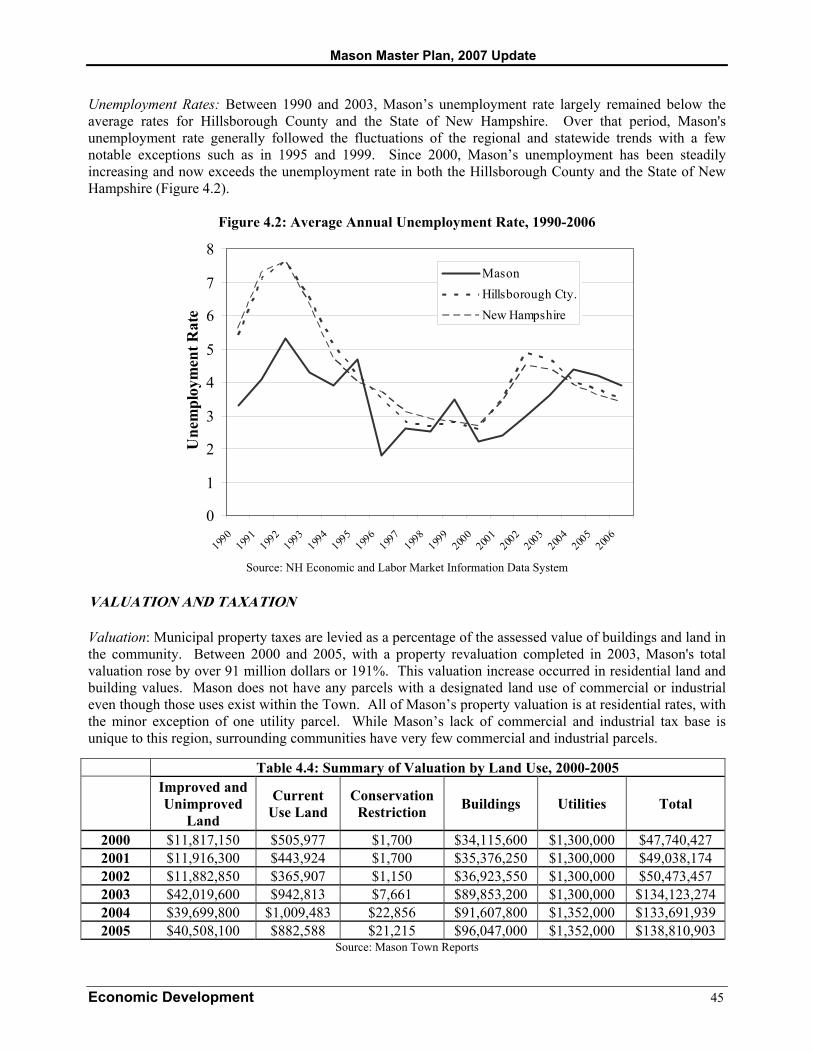
Mason Master Plan, 2007 Update
Economic Development 45
Unemployment Rates: Between 1990 and 2003, Mason’s unemployment rate largely remained below the average rates for Hillsborough County and the State of New Hampshire. Over that period, Mason's unemployment rate generally followed the fluctuations of the regional and statewide trends with a few notable exceptions such as in 1995 and 1999. Since 2000, Mason’s unemployment has been steadily increasing and now exceeds the unemployment rate in both the Hillsborough County and the State of New Hampshire (Figure 4.2).
Figure 4.2: Average Annual Unemployment Rate, 1990-2006
0
1
2
3
4
5
6
7
8
1990
1991
1992
1993
1994
1995
1996
1997
1998
1999
2000
2001
2002
2003
2004
2005
2006
Une
mpl
oym
ent R
ate
MasonHillsborough Cty.New Hampshire
Source: NH Economic and Labor Market Information Data System
VALUATION AND TAXATION
Valuation: Municipal property taxes are levied as a percentage of the assessed value of buildings and land in the community. Between 2000 and 2005, with a property revaluation completed in 2003, Mason's total valuation rose by over 91 million dollars or 191%. This valuation increase occurred in residential land and building values. Mason does not have any parcels with a designated land use of commercial or industrial even though those uses exist within the Town. All of Mason’s property valuation is at residential rates, with the minor exception of one utility parcel. While Mason’s lack of commercial and industrial tax base is unique to this region, surrounding communities have very few commercial and industrial parcels. Table 4.4: Summary of Valuation by Land Use, 2000-2005
Improved and Unimproved
Land
Current Use Land
Conservation Restriction Buildings Utilities Total
2000 $11,817,150 $505,977 $1,700 $34,115,600 $1,300,000 $47,740,427 2001 $11,916,300 $443,924 $1,700 $35,376,250 $1,300,000 $49,038,174 2002 $11,882,850 $365,907 $1,150 $36,923,550 $1,300,000 $50,473,457 2003 $42,019,600 $942,813 $7,661 $89,853,200 $1,300,000 $134,123,274 2004 $39,699,800 $1,009,483 $22,856 $91,607,800 $1,352,000 $133,691,939 2005 $40,508,100 $882,588 $21,215 $96,047,000 $1,352,000 $138,810,903
Source: Mason Town Reports
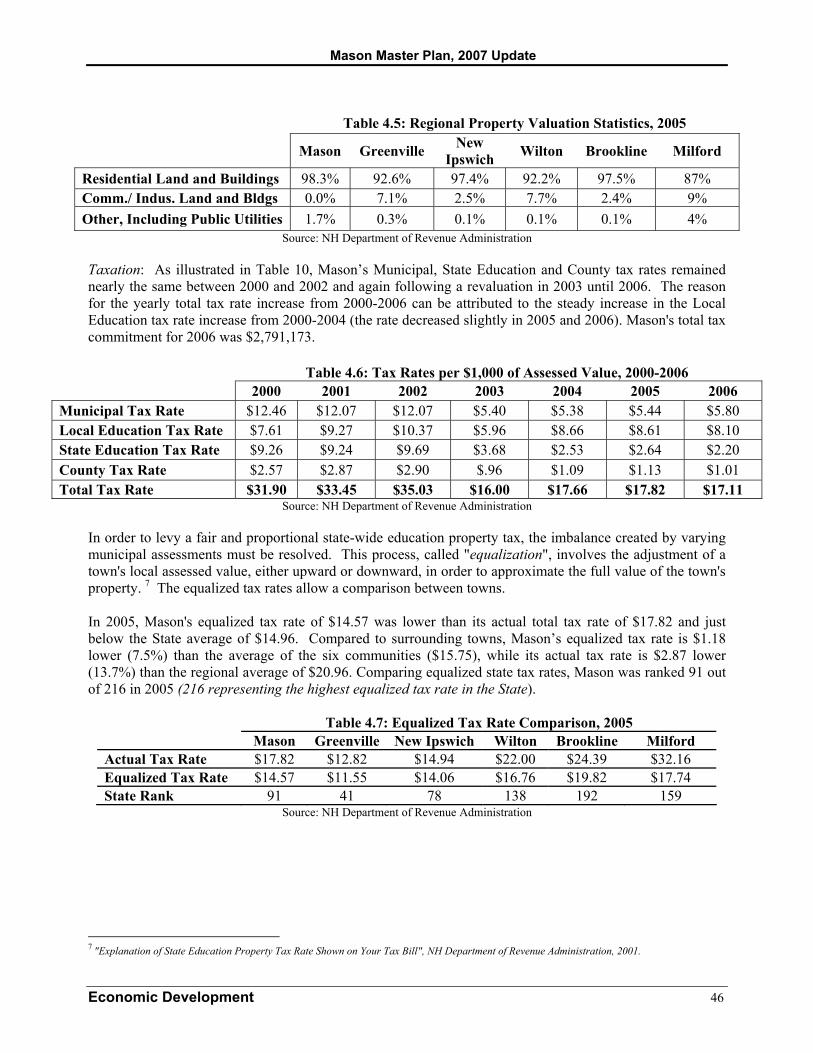
Mason Master Plan, 2007 Update
Economic Development 46
Table 4.5: Regional Property Valuation Statistics, 2005 Mason Greenville New
Ipswich Wilton Brookline Milford
Residential Land and Buildings 98.3% 92.6% 97.4% 92.2% 97.5% 87% Comm./ Indus. Land and Bldgs 0.0% 7.1% 2.5% 7.7% 2.4% 9% Other, Including Public Utilities 1.7% 0.3% 0.1% 0.1% 0.1% 4%
Source: NH Department of Revenue Administration
Taxation: As illustrated in Table 10, Mason’s Municipal, State Education and County tax rates remained nearly the same between 2000 and 2002 and again following a revaluation in 2003 until 2006. The reason for the yearly total tax rate increase from 2000-2006 can be attributed to the steady increase in the Local Education tax rate increase from 2000-2004 (the rate decreased slightly in 2005 and 2006). Mason's total tax commitment for 2006 was $2,791,173.
Table 4.6: Tax Rates per $1,000 of Assessed Value, 2000-2006 2000 2001 2002 2003 2004 2005 2006
Municipal Tax Rate $12.46 $12.07 $12.07 $5.40 $5.38 $5.44 $5.80 Local Education Tax Rate $7.61 $9.27 $10.37 $5.96 $8.66 $8.61 $8.10 State Education Tax Rate $9.26 $9.24 $9.69 $3.68 $2.53 $2.64 $2.20 County Tax Rate $2.57 $2.87 $2.90 $.96 $1.09 $1.13 $1.01 Total Tax Rate $31.90 $33.45 $35.03 $16.00 $17.66 $17.82 $17.11
Source: NH Department of Revenue Administration
In order to levy a fair and proportional state-wide education property tax, the imbalance created by varying municipal assessments must be resolved. This process, called "equalization", involves the adjustment of a town's local assessed value, either upward or downward, in order to approximate the full value of the town's property. 7 The equalized tax rates allow a comparison between towns. In 2005, Mason's equalized tax rate of $14.57 was lower than its actual total tax rate of $17.82 and just below the State average of $14.96. Compared to surrounding towns, Mason’s equalized tax rate is $1.18 lower (7.5%) than the average of the six communities ($15.75), while its actual tax rate is $2.87 lower (13.7%) than the regional average of $20.96. Comparing equalized state tax rates, Mason was ranked 91 out of 216 in 2005 (216 representing the highest equalized tax rate in the State).
Table 4.7: Equalized Tax Rate Comparison, 2005 Mason Greenville New Ipswich Wilton Brookline Milford
Actual Tax Rate $17.82 $12.82 $14.94 $22.00 $24.39 $32.16 Equalized Tax Rate $14.57 $11.55 $14.06 $16.76 $19.82 $17.74 State Rank 91 41 78 138 192 159
Source: NH Department of Revenue Administration
7 "Explanation of State Education Property Tax Rate Shown on Your Tax Bill", NH Department of Revenue Administration, 2001.

Mason Master Plan, 2007 Update
Economic Development 47
Figure 4.3: Equalized Tax Rate Comparison per $1,000 of Assessed Value, 2005
$0.00
$5.00
$10.00
$15.00
$20.00
$25.00
$30.00
$35.00
Mason Greenville NewIpswich
Wilton Brookline Milford
Tax
Rat
eEqualized Tax Rate
Actual Tax Rate
Source: NH Dept. Of Revenue Administration

Mason Master Plan, 2007 Update
Economic Development 48
COMMUTING PATTERNS
According to Table 12, of the 640 residents of Mason who were employed in 2000, 50.3% (332) commuted into another town for work. Almost a quarter of those (77) headed to Nashua for work everyday, 55 employees commuted into Milford for work, and 28 to Wilton. The average commute time for Mason’s workers in 2000 was 36.1 minutes. Commute times in surrounding towns are lower, but not by a significant amount
Table 4.8: Regional Commuter Activity, 2000
Commuting Out
Mason Greenville New Ipswich Wilton Brookline Milford Townsend Residents working 640 1,081 2,076 2,037 2,114 7,547 5,076
Residents commuting out 540 957 1,483 1,614 1,280 4,951 3,986 Commuting rate - out 84.3% 88.5% 71.4% 79.2% 60.5% 65.6% 78.5%
Most common commute to: Nashua Milford Nashua Nashua Nashua Nashua Fitchburg No. of Commuters 77 137 132 357 451 1,524 315
2nd most common commute to: Milford Nashua Peterborough Milford Milford Amherst Groton, MA No. of Commuters 55 116 131 331 190 532 236
3rd most common Commute to: Wilton Manchester Jaffrey Manchester Hollis Manchester Leominster No. of Commuters 28 54 106 132 125 427 205
Commuting In
Mason Greenville New Ipswich Wilton Brookline Milford Townsend Total Working in Town 326 346 1,101 1,658 761 7,321 2,888
Residents Working in home Town 100 124 593 423 316 2,596 800 Non-residents commuting - in 226 222 508 1,235 445 4,725 2,088
Commuting rate- in 69.3% 64.2% 46.1% 74.5% 58.4% 64.5% 72.2% Most common commute from: Greenville New Ipswich Manchester Milford Manchester Nashua Pepperell
No. of Commuters 32 36 50 226 56 570 289 2nd most common commute from: New Ipswich Nashua Milford Lyndeborough Nashua Manchester Fitchburg
No. of Commuters 31 34 47 90 50 475 235 3rd most common commute from: Milford Mason Greenville Amherst New Ipswich Wilton Ashby
No. of Commuters 22 16 42 101 25 331 129
Avg. Commute Time (min.)
36.1
33.9
34.1
29.4
32.9
24.2
36.4 Source: US Census

Mason Master Plan, 2007 Update
Historic, Cultural and Conservation Resources 49
HISTORIC, CULTURAL AND CONSERVATION RESOURCES
INTRODUCTION
The historic, cultural and recreational resources located within the Town of Mason contribute significantly to the Town’s quality of life and rural character. This chapter is an important addition to the Master Plan in that the information contained within will assist the Town with both the inventory of existing resources and the identification of those features and resources worthy of preserving, maintaining or developing in the coming years. Historic and Cultural Resources were not included in the 1981 Mason Master Plan. The Mason Historical Society, was incorporated in 1968, has contributed significantly to the preservation of the Town’s heritage. The Historical Society maintains a collection of Town Reports, Church records, School Reports, Cemetery records, and the Fruitdale Grange records. They also maintain extensive Genealogy records of Mason residents. Mason voters adopted a Historic Preservation District and established a Historic District Commission in 1976 to preserve and protect the historical heritage of buildings and lands in the district. The ordinance requires that the existing architectural style of the district be maintained in new structures or additions to old structures within the district. This chapter illustrates the Town’s history, summarizes the historic data gathered to date, provides recommendations for next steps and identifies resources to assist the Town in achieving its historic preservation goals. Existing recreational opportunities including trails for hiking, scenic views and picnic areas that enable residents and visitors to enjoy the Town’s natural areas are also described here, as are recommendations for next steps and identified resources to assist the Town in achieving its goals.
HISTORY OF MASON
The Town of Mason is characterized by its narrow valleys and rocky hills, a terrain that made the initial settlement of Mason a daunting task. The land area of Mason was originally known as Township Number One and had been given to New Hampshire upon its partition from the colony of Massachusetts under King George II in 1741. Land proprietors were granted title to the land by Colonel Joseph Blanchard in 1749, and they in turn gave the grant to a group of 33 men along with plans for the creation of a town. Very few of these men ever settled on those lands, either selling off their lots or giving them to sons or relatives. Enosh Lawrence is recognized as being the first settler in 1749 and by 1753 twenty three settlers were listed in Township Number One. The first meeting house was built in 1753 in the first town center located just to the north and east of Mason’s current town center. The initial site chosen for the town center proved to be a poor location due to its topography; and so the center slowly shifted to its current location. In 1768, the settlers of the Township petitioned Governor John Wentworth for a charter. Governor Wentworth chose the name Mason, likely in honor of Captain John Mason the founder of New Hampshire. The first Town Meeting was held in September of the same year. The first Mills were built in Mason in 1767, one year prior to the charter. They were built on the banks of the Souhegan River and Black Brook. The mills built on the river flourished as what eventually became a seemingly separate settlement from Mason Center. However, it was not until 1872, that this section of the town was partitioned and was incorporated as the Town of Greenville. The connection between Mason and the church was very strong in the early years of settlement. Services took place in the first and second meeting house and eventually in the present day Mason Congregational Church. The Greenville Federated Church was built in 1827 by the Baptists after a smaller church in Mason

Mason Master Plan, 2007 Update
Historic, Cultural and Conservation Resources 50
Center was never completed. A Christian ministry was invited to the town in 1834 and built the church that is presently used by Mason Public Schools. Education in Mason was very informal, usually occurring in the kitchens of Town residents. The first record of public schooling dates back to 1771. As the school system evolved Mason was divided into nine school districts. After Greenville’s partition, this number was reduced to six. After the consolidation of school districts into one larger regional school district in 1937, the school districts were disbanded and today, four of the original schools still stand. The traditional industry in Mason was agriculture. Eventually, small home industries developed that included carving of wooden buttons, hat making, soap making and shaving hoops for barrels. A starch factory operated in Town for several years leading to the growth of potatoes by local farmers for sale to the factory. For a short time, grapes became a flourishing crop until blight put an end to their continued production. With the development of the railroad in 1850, the market for Mason farmers grew to the Boston region as well as other large cities and towns, with shipments of milk, eggs and other products. Women also began to earn money shipping goods such as blueberries and Mayflowers. Mason is also known for granite outcroppings that in the early years were used to build foundations for homes, barns and public structures. It was not until 1867 that granite quarrying began on a large scale with the purchase of the Mason, or Glen, Quarry by Alexander McDonald. The Fletcher Quarry became a settlement of nearly 200 people that worked in the quarry, producing granite for various buildings and monuments throughout the country. Although Mr. McDonald’s enterprise went bankrupt in 1893, granite production continued in a different location in Town. Mason has had many nationally recognized residents over the years, the most famous of which consists of Samuel Wilton, the inspiration of Uncle Sam character. While Samuel Wilson lived in various places throughout his lifetime, his home in Mason is claimed to be the only one still in existence. Mason was also home to John Boynton, who provided the financial support to establish Worcester Polytechnic Institute. He also began a trust fund for the Mason School and donated a sizable sum of money to the Templeton, Massachusetts Library. The famous piano maker Jonas Chickering was born in Mason Village in 1798. George Germer, a well-known silversmith (jewelry, crosses and many other works) came to Mason before World War I and remained until his death in 1936. C.W. Anderson, a famous lithographer, author, and children’s book illustrator, also made his home in Mason for many years. Elizabeth Orton Jones, a children’s book illustrator who won the Caldecott Medal for her illustration of Prayer for a Child in 1945, lived in Mason. She is also known for her illustration of Little Red Riding Hood, Golden Book edition printed from 1948 to 1979. She used her neighbor’s farmhouse as inspiration for her illustrations and that building still stands today and is in use as a restaurant and retail shop. Mason has many 18th and 19th century homes that remain in use today. The town offices are presently located in the Captain Benjamin Mann house on Darling Hill Road, built in 1773. Captain Mann was a commanding officer at the Battle of Bunker Hill. The Uncle Sam house, the boyhood home of Samuel Wilson, on Valley Road, was built in 1780. Several of Mason’s one room school houses remain standing, and there is a very well preserved Town Pound on Meetinghouse Hill Road. The 1840 Town Hall is still used for Town Meeting. Mason is fortunate to have two very well written town histories: History of the Town of Mason, NH From the First Grant in 1749, to the Year 1858, by John B. Hill, published by Lucius A. Elliot & Co., Boston, 1858, and Mason, New Hampshire 1768-1968, edited by Elizabeth Orton Jones, c. 1968 by the Mason Historical Society. Both books may be found in the Mason Public Library.

Mason Master Plan, 2007 Update
Historic, Cultural and Conservation Resources 51
Technological innovation in the field of transportation had a lasting impact on Mason. Agriculture diminished over time and Mason residents began to commute to neighboring towns for work. This has turned Mason into a bedroom community for those who work in nearby towns. Mason’s community grew significantly in the 1980’s and has also seen significant growth since 2000. The continued growth of the community makes it even more important to identify important historical sites and make recommendations for their continued preservation. Despite the characterization of Mason as a bedroom community there is still a strong connection with their agricultural past that is important to the culture of the Mason community. It is important that this past be recognized and used to enhance the current cultural identity of the community.
DESIGNATION OF HISTORIC RESOURCES
Having a property listed in the National or State Registers of Historic Places can contribute to the preservation of historic properties in a number of ways, which include:
• Public recognition that a property is significant to a community; • Consideration and advocacy in the planning of local and state funded or otherwise assisted
projects; • Qualification for state financial assistance for preservation projects, when funds are
available; and, • Special consideration or relief in the application of some access, building and safety code
regulations.
NATIONAL REGISTER OF HISTORIC PLACES
Under the terms of the National Historic Preservation Act of 1966, the U.S. Department of Interior’s National Park Service maintains the National Register, which lists the Nation’s cultural resources worthy of preservation. The National Register is the Nation’s roster of properties that are important in history, architecture, archeology, engineering, or culture. Properties may be nominated individually, in groups or by Districts. The nomination process requires careful documentation as to a site’s historical significance. In addition to buildings and bridges, other categories – such as Main Streets and roads, villages, parks, and monuments – can be listed. There are a number of benefits for properties listed on the National Register. These include the provision for special review and mitigation if a road widening, or other project using Federal funds is undertaken in the vicinity, and the possible eligibility for Federal benefits. These include charitable deductions for donations and easement, grants for preservation and investment tax credits for the rehabilitation of income-producing buildings. No additional restrictions are placed upon those properties that are listed on the National Register; but instead, a listing in the National Register recognizes the property’s significance, encourages the stewardship of the property or resource, and stimulates local pride, appreciation and commitment to preservation. Criteria for consideration include the quality of significance in American history, architecture, archeology, engineering and culture is present in districts, sites, buildings, structures, and objects that possess integrity of location, design, setting, materials, workmanship, feeling, and association, and;
• That are associated with events that have made a significant contribution to the broad patterns of our history; or
• That are associated with the lives of persons significant in our past; or

Mason Master Plan, 2007 Update
Historic, Cultural and Conservation Resources 52
• That embody the distinctive characteristics of a type, period, or method of construction, or that represent the work of a master, or that possess high artistic values, or that represent a significant and distinguishable entity whose components may lack individual distinction; or
• That has yielded, or may be likely to yield, information important in prehistory and history. Criteria considerations: ordinarily, cemeteries, birthplaces, or graves of historical figures, properties owned by religious institutions or used for religious purposes, structures that have been moved from their original locations, reconstructed historic buildings, properties primarily commemorative in nature, and properties that have achieved significance within the past 50 years shall not be considered eligible for the National register. However, such properties will qualify if they are integral parts of the districts that do meet the criteria or if they fall within the following categories:
• A religious property deriving primary significance from architectural or artistic distinction or historical importance; or
• A building or structure removed from its original location but which is significant primarily for architectural value, or which is the surviving structure most importantly associated with a historic person or event; or
• A birthplace or grave of a historical figure of outstanding importance if there is not other appropriate site or building directly associated with his productive life; or
• A cemetery that derives its primary significance from graves of persons of transcendent importance, from age, from distinctive design features, or from association with historic events; or
• A reconstructed building when accurately executed in a suitable environment and presented in a dignified manner as part of a restoration master plan, and when no other building or structure with the same association has survived; or
• A property primarily commemorative in intent if design, age, tradition, or symbolic value has invested it with its own historical significance; or
• A property achieving significance with the past 50 years if it is of exceptional importance.
NEW HAMPSHIRE STATE REGISTER OF HISTORIC PLACES
The New Hampshire State Register of Historic Places is one part of the State’s efforts to recognize and encourage the identification and protection of historical, architectural, archeological, and cultural resources. These resources may be buildings, districts, sites, landscapes, structures, or objects that are meaningful in the history, architecture, archeology, engineering, or traditions of New Hampshire residents and communities. The New Hampshire Division of Historical Resources (NHDHR) administers the State Register, which is the State’s Historic Preservation Office. Owners of private property listed on the State Register are free to maintain, manage, or dispose of their property as they choose, without oversight or comment from NHDHR, provided that no state monies or permits are involved. All properties listed on the State Register are documented and evaluated against the following criteria. These broad criteria are designed to guide individuals, local governments and others in evaluating potential entries in the State Register. Properties not specifically described in the text below may still be eligible.
• Properties may be listed on the State Register for the story they tell; • Properties may also be meaningful for their associations with people who made important
contributions to a community, profession or local tradition;

Mason Master Plan, 2007 Update
Historic, Cultural and Conservation Resources 53
• Properties may be listed on the State Register for their tangible merit, either as a well-preserved example of local architecture, design, construction, or engineering, or as a long-standing focal point in a neighborhood or community. These types of resources need not be extraordinary or the best example in town; they often can be a common, although irreplaceable, feature on the New Hampshire landscape;
• Identified, but unexcavated and unevaluated archaeological sites may also be listed. Generally, properties eligible for listing on the State Register should be at least 50 years old. Properties approaching the 50-year mark can be listed, if their historical values are already clear.
STATE AND LOCAL HISTORIC MARKERS
The State’s Historical Marker Program is one way that New Hampshire remembers its past. The marker program uses markers to help people think about New Hampshire's history while visiting the actual locations where historical events unfolded. Today, 158 historical markers identify places of historic significance in New Hampshire's past. Some of these places contain tangible reminders of the past like a covered bridge or an old house. Others simply mark the spot where such a structure once stood, or they mark the location of a historical event that left no trace at all. The historical marker program, initiated by the New Hampshire legislature in 1955, gives the Commissioner of Transportation the authority to erect up to ten markers per year in accordance with RSA 236:40. According to this statute, the only way a marker can be placed in a Town is in response to a proposal and petition of 20 signatures from concerned New Hampshire citizens. The Commissioner is authorized to erect markers within the right-of-way of any State highway, to be paid for by the State. The Division of Historical Resources is authorized to enter into contracts with cities, towns or historical societies for the placement of historical markers along locally maintained Class IV or V highways. The initial costs of these cooperative markers, and their maintenance, are local responsibilities. The New Hampshire Division of Historical Resources is responsible for approving the subject, location, wording, and accuracy of State Markers. Guidelines applied by the NH Division of Historical Resources when responding to requests for markers are intended to help the marker program create a balanced picture of the State’s past. The guidelines include a balanced distribution of markers throughout the State, representation of all the time periods in New Hampshire's history and equal recognition of historic people, places, and events. More information on the State Historical Marker Program is available by contacting the NH Division of Historical Resources. The Mason Historical Society currently has no criteria for historic designation.
INVENTORY OF HISTORIC RESOURCES
NATIONAL REGISTER
Mason has no sites listed on the National Register of Historic Places
STATE HISTORIC REGISTER
Mason has no sites listed on the New Hampshire State Register of Historic Places

Mason Master Plan, 2007 Update
Historic, Cultural and Conservation Resources 54
STATE AND LOCAL MARKERS
There is on state marker located on NH 123 about .5 miles south of the Town Center in front of the boyhood home of Uncle Sam. The marker was placed in 1966.
LOCAL INVENTORY
No official inventory of historical resources is kept by the Mason Historical Society, although there are structures with historical significance located within the Town including the Capt. B. Mann House, the boyhood home of Sam Wilson (Uncle Sam), and Pickity Place.
LOCAL PRESERVATION PROGRAMS
MASON HISTORICAL SOCIETY
The Mason Historical Society meets weekly on Wednesday afternoons at the Capt. B. Mann House. Although they do not lend out materials, they are equipped with a copy machine. Meetings with the Historical Society are available by appointment. It is a completely volunteer organization and membership fluctuates between 10 to 15 people. A website sponsored by Rhett Owings, dedicated to the history and genealogy of families from Mason, is available at http://home.earthlink.net/~georgeo/mason_nh.htm.
RECOMMENDATIONS
The following is a list of programs, activities, and regulatory guidelines that Mason may wish to consider using to help preserve their rich historical and cultural history in:
NATIONAL AND STATE REGISTER OF HISTORIC PLACES
• Support individuals and organizations that are proposing sites in Town to be placed on the National Register or the New Hampshire State Register of Historic Places by providing applicable information and resources
• Apply for National Register and/or New Hampshire State Register designation for the following sites:
STATE AND LOCAL HISTORIC MARKERS
• Investigate the designation and placement of State and Local Historic Markers at appropriate sites within the Town.
• Educate the public regarding the location and significance of State and Local Historic Markers, if any sites are located in the Town.
• Establish a permanent source of funding the establishment and maintenance of new State and Local Historic Markers, as well as the printing and distribution of materials about the Markers.
• Create additional maps of local historic sites, with information for self-guided tours. • Create a standard format for Local Historic Markers so they are easily identifiable.

Mason Master Plan, 2007 Update
Historic, Cultural and Conservation Resources 55
HISTORIC SITES INVENTORY
A historic sites inventory would assist the town in identifying specific structures or locations that would benefit from local, state or national historic designations.
HISTORIC DISTRICT REGULATIONS
Local efforts have been made to preserve Mason’s historic character. Through local zoning the Town has created a Historic Preservation Zone intended to ensure that the existing colonial or other architectural treatment of the district be maintained in any alterations or improvements to existing buildings or in the construction of new buildings. In keeping with these efforts, one next step the Town could consider is the adoption of a Local Historic District. A local historic district ordinance would create stricter regulation of architectural detail, height, color, roof style, building and construction materials, fencing and screening, placement of trash receptacles, lighting, landscaping, and other site features to ensure that new development, construction and renovations are harmonious with existing features found within the historic district. While the Town survey found that approximately 50% of residents do not support expansion of the district, no consideration was given to creating more stringent regulation within the existing Historic Preservation Zone. RSA 674:46 grants the authority for the local legislative body to establish, change, layout and define historic districts, by ordinance, within the respective municipality. The purpose of granting such authority, as outlined in RSA 674:45, is for the preservation of cultural resources, including in particular those structures and places of historic, architectural and community value. A historic district commission must be established in accordance with RSA 673:1, to perform the duties described in RSA674:46-a, which include establishing a legal basis for the historic district. The NH Office of Energy and Planning maintains a list of those communities in New Hampshire with Historic District regulations. These examples, as well as input from the staff at NH OEP, the NH Division of Historical Resources and the Southwest Region Planning Commission, can assist the Town with establishing local regulations.
CERTIFIED LOCAL GOVERNMENT PROGRAM
The Certified Local Government (CLG) program is designed to provide an opportunity for local governments to become more directly involved in identifying, evaluating, protecting, promoting, and enhancing the educational and economic value of local properties of historic, architectural and archeological significance. Created by the 1980 amendments to the National Historic Preservation Act, the CLG program requires that the NH Division of Historical Resources (NHDHR) designate at least 10 percent of its annual Historic Preservation Fund allocation from the U.S. Department of the Interior to local governments that have become Certified Local Governments. A local government wishing to become a CLG must fulfill certain requirements indicating its commitment to preservation, including the establishment of a historic preservation review commission, which may be either a historic district commission or a heritage commission. In addition to its other responsibilities, the review commission serves as an advisory body to the municipal government and to local land use boards, becoming the coordinating body for municipal preservation activities. CLG designation applies to the entire municipality. CLGs receive technical assistance and training from the NH DHR, and are eligible to apply for certain matching funds for preservation activities. Additional information on becoming a Certified Local Government is available from the NHDHR.

Mason Master Plan, 2007 Update
Historic, Cultural and Conservation Resources 56
HISTORIC INFORMATION AND RESOURCES
• Create a database of all information available on the Town’s history that is held by various organizations and departments, both within the Town and at other State locations, and make the database available to the public.
• Ensure that historical information located in town – books, papers, artifacts, etc. – are stored using the best preservation and conservation practices, are properly catalogued and accounted for and are accessible to the public, where feasible.
• Create a permanent source of funding for the Historic Society to preserve, protect, display, and educate residents about Mason’s history.
• Create specific roles for the Historic Society and Heritage Commission that relates to the education, maintenance, and preservation of historical resources within town.
CONSERVATION AND OPEN SPACE RECREATION RESOURCES
Responses to the Master Plan survey provide valuable information regarding the future of Mason’s conservation and cultural opportunities. For example, 60% of respondents agreed that Mason needs to do more to preserve and conserve open space and protect existing wetlands and 49% believed that Mason does not have enough conservation/town-owned land. Many respondents expressed a desire to learn more about the conservation land already owned by Mason. See Map 5.1, Conservation Land and Table 5.1 below.
MASON CONSERVATION LANDS INVENTORY
Table 5.1- Mason Conservation Lands Inventory
Town-owned Conservation Land (1,022.7 acres total)
Conservation Area Location Tax Map Number Acreage
Bronson Potter Lands Greenville Road C-1, 1-4, 1-5,
Bronson Potter Lands Greenville Road C-5, 5-1, 24,
Bronson Potter Lands Greenville Road C-25, 26, 28 424.7 (Greenville Rd)
Bronson Potter Lands Merriam Hill Road E-61, 61-1, 61-2,
Bronson Potter Lands Merriam Hill Road E-61-3, G-83 123.5 (Merriam Hill)
Bronson Potter Lands Old Ashby Road E-54, G-2, 2-1 19.6
Total Potter lands (6 acres G-82 not included) 567.8 acres
Beck Lot RR Trail near Scripps E-28 30
Coyne Lot Coyne Lane E-22 25.4
Mason Brook Marsh (Cliff Hastings Nature Trail)
Merriam Hill Road E-67, E-76 13
Mason Railroad Trail 6.7 miles Greenville to Townsend
96
Mitchell Hill Land Mitchell Hill Road D-9 100
Spaulding Brook Land Starch Mill & Mitchell Hill B-17-1 163

Mason Master Plan, 2007 Update
Historic, Cultural and Conservation Resources 57
Conservation Area Location Tax Map Number Acreage
Scripps Lot Scripps Lane E-38 20
Scott Hastings Memorial Land
Fitchburg Road J-35 2.3
Walker Brook Gorge Land
Fitchburg Road J-36-2 5.2
Public Conservation Land (448 acres total)
Conservation Area Location Tax Map Number Acreage
Russell-Abbott State Forest
Pratt Pond Road A-6 418
Society for Protection of NH Forests
off Pratt Pond Rd A-2 & 29 30
Private Conservation Easements (703.7 acres total)
Conservation Area Location Tax Map Number Acreage
Doonan Starch Mill Road B-18 12.5
d’Arbeloff E-1 Darling Hill Road E-1 35.4
d’Arbeloff E-2 Darling Hill Road E-2 66.5
d’Arbeloff E-80 Darling Hill Road E-80 9.4
Fifield Tree Farm (still being finalized)
Black Brook, Mitchell Hill, Old County Roads
D-8, D-10, D-37, D-38 508.1
Stewart Jackson Road G-52, G-53 71.8
Subdivision Private Conserved Open Space (75.55 acres total)
Conservation Area Location Tax Map Number Acreage
Jones Crossing Mitchell Hill Road B-15-1 60
TyMar Nutting Hill & Greenville A-22 &22-1 11.7
Hodson Starch Mill & Old County F-11 &11-4 3.85
Total Conserved Acreage in Mason, 2007
Total Mason Acreage Percent of Mason Conserved (public and private)
2,250 15,533 14.5% At the time of Mason’s last Master Plan (1981), all the town had in conservation were the Beck, Coyne, and Scripps lots. In 1985 the town acquired the 96-acre railroad land from Guilford Transportation, using a 50% matching grant from the Land and Water Conservation Fund to create the Mason Railroad Trail. In 1986,
Mason Master Plan, 2007 Update
Historic, Cultural and Conservation Resources 58
Bronson Potter gave the town 13 acres in the Mason Brook Marsh, where the Conservation Commission built the Cliff Hastings Nature Trail and Boardwalk. In 1991, the town acquired the 163-acre Spaulding Brook Conservation Land with a grant from the NH Land Conservation Investment Program (LCIP). This grant was enabled thanks to the generosity of 2 landowners who donated conservation easements: Ted Stewart who gave the town a conservation easement on 71.8 acres of his land along both sides of Jackson Road, which is now designated a Scenic Road in honor of his contribution. At the same time, Frank Doonan gave a 12.5-acre conservation easement to form a buffer along the Spaulding Brook Pond, which includes a lovely waterfall. Throughout the 1990s conservation land increased with gifts of 2 parcels in spectacular Walker Brook Gorge (Scott Hastings Memorial Land and Walker Brook Gorge Land), and the acquisition of the 100-acre Mitchell Hill Land through a bargain sale partial gift from the landowner, Lyons Timber, along with funds the Conservation Commission raised through timber-cutting on the Beck and Scripps Lots. In 2003 and 2004, the town received gifts of conservation easements from the d'Arbeloff family, in the form of 3 parcels with 111.3 acres under easement protecting more than half a mile on both sides of rural Darling Hill Road, now designated a Scenic Road. At this time, Woodie Fifield worked with the town and NH Land and Community Heritage Investment Program (LCHIP) to conserve his award-winning Tree Farm. Unfortunately, Woodie died in 2004 before the conservation easement survey was completed, but his family is carrying on with completing it in honor of his wishes. The Fifield Tree Farm will protect more than 500 acres of forest with more than a mile of Spaulding Brook, and over 6 miles of trails open to the public for non-motorized trail use. All this is largely a gift, the LCHIP grant represents only a fraction of the value of this beautiful Tree Farm. All these conservation easement gifts' legal and survey costs were covered through Land Use Change Tax funds (from land removed from Current Use), which Mason Town Meetings in 2000, 2001, and 2007 voted to dedicate 100% for land conservation. In early 2007 the town received a major conservation gift from long-time Mason resident, inventor and author Bronson Potter. Potter willed all his lands to conservation, including 574 acres with 3 buildings in Mason. After his death in 2004, his will was contested and finally resolved in the town's favor by the NH Supreme Court in January 2007. Potter’s gift more than doubled Mason's conservation land holdings. One of the parcels includes a large colonial farmhouse, the Whitaker homestead, which the town is seeking court permission to sell with 6 abutting acres since it cannot be used for conservation. If this sale is permitted, 2007 Town Meeting voted to use the money toward acquiring 283 acres for conservation in Mason's wild northeast corner. Mason Conservation Commission is very grateful for the gifts from our town’s generous landowners and the continuing support of town voters. Mason is fortunate to be beloved by so many who take action to protect its rural character. When Planning Board efforts for updating the Master Plan were renewed in 2001, a Master Planning Conservation Committee was convened, with Conservation Commission members and other interested citizens. Over several meetings in 2002, this Committee developed conservation goals for the Master Plan. Their recommendations on protecting water supplies have been incorporated in the Water Resources Management and Protection Plan of this Master Plan. Here are the Committee’s recommendations for conservation:
CONSERVATION GOALS FOR MASON
Recognizing that Mason’s quiet nature, special places and large blocks of open space are very important parts of the town’s rural character, the town should aim to:
Mason Master Plan, 2007 Update
Historic, Cultural and Conservation Resources 59
* Protect large tracts of land wherever possible for wildlife habitat and water quality - Encourage use of conservation easements to protect land while keeping it in private hands.
- Encourage town to put conservation easements on tax title lands using land use change tax funds.
- Identify contiguous parcels for wildlife corridors. - Encourage sustainable forestry as a long term land use for large parcels. * Preserve special places for conservation in co-operation with landowners. For example-- The Cascades and Mason Brook Walker Brook Gorge Mason Quarry old cemeteries Town Pound the view from Greenville Road (part of Bronson Potter gift) Wolf Rock area, Scripps Lane Open valley with wetlands on Old Ashby Road near Cascade Road, good bird habitat Old mill on Spaulding Brook at Woodie Fifield’s Network of wetlands along Spaulding Brook upstream of town conservation land * Educate people about land and limitations inherent in the land. - Wetlands and steep slopes affect building sites - Wildflowers and landscaping with native plants (avoid exotic invasives) - “Welcome to Mason” brochure covering environmental concerns for homeowners. A good reference: Merrimack River Watershed Council's “Environmentally Friendly Home Ownership”
- Integrate schools in conservation activities * Develop a policy on conversion of Class VI roads to Class V that carefully weighs long-term costs and benefits to the town.
- Many Class VI roads cut through large blocks of open space integral to Mason’s rural character. - Mason has enough frontage on Class V roads to accommodate nearly a doubling in development.
In addition to the above goals, the Mason Conservation Commission has a long-standing goal to protect open space lands abutting existing conservation lands, especially along the Mason Railroad Trail and in the northern part of town, which has the largest blocks of contiguous open space.
WILDLIFE HABITAT
Mason contains wildlife habitat that the 2006 New Hampshire Wildlife Action Plan has mapped as significant on a state-wide level. This is all the Nissitissit River watershed. In Mason this includes Spaulding, Black, Mitchell, Gould Mill, Lancy, and Wallace Brooks and all their tributaries and the lands that feed them. For more information on this comprehensive plan designed to keep species from becoming endangered, see www.nhfg.net/Wildlife/wildlife_plan/html. The Nissitissit sustains populations of brook trout and a rare mussel. Another recent wildlife habitat study that refers to Mason is Focus Areas for Wildlife Habitat Protection in the Nashua River Watershed, done by the Ecological Extension Service of Mass. Audubon Society in 2000. Two large focus areas of core wildlife habitat lie partially in Mason: Badger Hill/Spaulding Brook (12,200

Mason Master Plan, 2007 Update
Historic, Cultural and Conservation Resources 60
acres) and Townsend State Forest area (8,700 acres). The Spaulding Brook focus area extends across northern Mason and includes parts of Brookline, Milford, and Wilton. The Townsend State Forest focus area includes southern Mason and abuts the Spaulding Brook focus area, making “two well-connected core areas allowing wildlife movement into the Nashua River watershed from less developed areas further north” (page 15). Focus Areas for Wildlife Habitat also highlights riparian corridors as critical areas for wildlife, including both the Squannacook and Nissitissit Rivers. In Massachusetts, both rivers are cited as habitat for state listed rare species of dragonflies, mussels, reptiles and amphibians. The Squannacook River’s headwaters in Townsend are mapped as priority habitat for rare species, right up to the state line with Mason. Surely the species cross the state line. Habitats along Mason’s stretch of Mason Brook do not differ greatly from those in Townsend, but research has not been done on Mason’s side of the line. Perhaps this is why only the Nissitissit watershed is mapped in the NH Wildlife Action Plan as being significant on a state-wide level while the Squannacook watershed is not shown as such. Although Mason does not contain either of these rivers, our town is a significant contributor to both the Squannacook and Nissitissit. The quality of these rivers’ tributaries is vital to both rivers’ over-all health. Protecting both watersheds should be a priority, through land conservation and water resource protection measures like wetland buffers, limiting stream crossings, and using limited impact development techniques to reduce development effects on these high-quality watersheds. The quality of Mason’s wildlife habitat is recognized as significant both at the New Hampshire state level, and at the inter-state Nashua River watershed level. Land use planners need to factor in wildlife habitat needs and connectivity among habitats whenever land use changes are proposed.
OPEN SPACE RECREATION
Our town’s trails are Mason’s chief open space recreation facilities. The spine of Mason’s trail system is the Railroad Trail, whose 6.7 miles cross the entire town from north to south. The town’s old Class 6 roads and trails on public lands and private conservation lands that are open to the public make an extensive network for exploring Mason’s countryside. User groups such as the local horseback riding club MANE (Mason Area Neighborhood Equestrians) and the local snowmobile club, the Wilton-Lyndeborough Winter Wanderers, have been helpful in maintaining trails. Many types of recreational users frequent the Mason Railroad Trail: hikers, joggers, mountain bikers, cross-country skiers, snowmobilers, horseback riders, and dogsled trainers. ATVs are not permitted on the Railroad Trail or on town conservation lands, due to the erosion and noise problems they create. Hunting and fishing are popular forms of recreation in Mason’s open spaces. Mason’ perennial streams support brook trout. Retaining large blocks of open space is essential for stream quality. Large blocks of open space are vital to allow for safe hunting, an important means to prevent deer from over-populating and spreading Lyme disease. Land conservation and open space recreation can work together to protect Mason’s rural character while enabling people to get out and enjoy our town’s natural beauty.

Mason Master Plan, 2007 Update
Historic, Cultural and Conservation Resources 61
INVENTORY OF MASON’S MAJOR PUBLIC OPEN SPACE RECREATION AREAS
Table 5.2- Inventory of Mason’s Open Space Recreation Areas Area Access Uses Russell Abbott State Forest (includes Pratt Pond and old Starch Mill Ruins)
Pratt Pond Rd, Starch Mill Rd hunting, fishing, hiking, canoeing. ATVs are prohibited due to trail and wetland damage
Mason Railroad Trail (surface is gravel or coal dust- not paved)
Pratt Pond Rd, Wilton Rd, Russell Rd, Sandpit Rd, Depot Rd, Jackson Rd, Morse Rd
hiking, jogging, horseback, riding, snowmobiling, x-c skiing, dog-sledding, mountain biking. ATVs Prohibited
Bronson Potter Conservation Lands
Greenville Rd, Old Ashby Rd, Merriam Hill Rd.
non-motorized open space uses. ATVs Prohibited. Land management study needed to determine other uses
Spaulding Brook Conservation Land
Starch Mill Rd, Mitchell Hill Rd
Hunting, fishing, hiking. Footpath may be difficult for horses. ATVs Prohibited.
LOCAL EVENTS AND ACTIVITIES
The Recreation Committee of Mason organizes several programs including an Easter Egg Hunt, Memorial Day Festivities, a Halloween Party, and a wreath making event.
LOCAL RECREATION
Mason Rail Trail The Peterborough and Shirley Railroad was incorporated in 1845 and opened as a branch from the Fitchburg Rail in Ayer, MA to West Townsend, MA in 1848. The line was extended in 1849 to Mason and, not long after, to Greenville. The now abandoned line has been transformed into a local rail-trail for recreational use.
LOCAL RESTAURANTS
Parker’s Maple Barn and Sugar House 1316 Brookline Road Mason, NH (603) 878-2308 Parker’s Maple Barn, a breakfast and lunch café, known throughout New England and beyond for their famous hearty breakfast menu served all the time. Pickity Place 248 Nutting Hill Road Mason, NH (603) 878-1151 Pickity Place, the inspiration for Elizabeth Orton Jones’ illustration of Little Red Riding Hood, offers a 5-course luncheon at three private sittings everyday. The menu changes every month and reservations are suggested in order to assure seating.

Mason Master Plan, 2007 Update
Historic, Cultural and Conservation Resources 62
RESOURCES
Municipal Records and Historical Society The Town Hall stores birth, death and marriage records, town reports, Town Meeting and Board of Selectmen minutes, and property transaction records. Microfilm copies of certain records are stored in a vault off-site. NH Division of Historic Resources The Division of Historical Resources was established in 1974 as the “State Historic Preservation Office.” The resources and materials available at the NHDHR include National Register of Historic Places criteria; New Hampshire Historical Marker Program; the offices of the State Architectural Historian, and State Curator, State Archaeologist; preservation tax incentive programs; historical survey programs; and grant programs. NH DHR is located at: 19 Pillsbury Street, 2nd floor Concord, NH 03301-2043 Telephone: (603) 271-3483 or 271-3558 www.nh.gov/nhdhr/ New Hampshire Historical Society The New Hampshire Historical Society is an independent, non-profit organization and is accredited by the American Association of Museums. The services and resources that the New Hampshire Historic Society provides include the Museum of New Hampshire History, the Tuck Library, a museum store, a newsletter and quarterly calendar, and technical assistance to local libraries, historical organizations and citizens. The New Hampshire Historical Society is located at: The Tuck Library 30 Park Street Concord, NH 03301-6384 Telephone: (603) 228-6688 www.nhhistory.org New Hampshire State Library The New Hampshire State Library houses approximately 2,400 titles of published family histories for New Hampshire and New England. This collection is enhanced by the unique name index to early town records on microfilm. The town records, ranging in years for each town, but falling roughly between the years 1640-1830/1840, can provide birth, death, and marriage dates, as well as a listing of such items as tax inventories. Other major resources available include town and county histories, annual town reports, federal census records for New Hampshire (1790-1920), local newspapers on microfilm, the genealogical column of the “Boston Transcript,” legislative biographies (1890+), city and county directories, and military records. The New Hampshire State Library is located at: 20 Park Street Concord, NH 03301 Telephone: (603) 271-2392 www.nh.gov/nhsl/ National Register of Historic Places Under the terms of the National Historic Preservation Act of 1966, the U.S. Department of the Interior’s National Park Service maintains the National Register, which lists the Nation’s cultural resources worthy of

Mason Master Plan, 2007 Update
Historic, Cultural and Conservation Resources 63
preservation. The National Register is the Nation’s roster of properties that are important in history, architecture, archaeology, engineering, or culture. The National Register can be contacted at: National Register of Historic Places National Park Service 1201 Eye Street, NW 8th Floor (MS 2280) Washington, DC 20005 Telephone: (202) 354-2213 http://www.cr.nps.gov/nr/ Funding and Technical Assistance Grant-In-Aid Program of the NH Division of Parks and Recreation, Bureau of Trails A grant program that provides assistance to organized, non-profit off highway recreational vehicle (OHRV) clubs and political subdivisions (such as towns and municipalities) to encourage development, maintenance, construction, grooming and safety of OHRV trails in the State of New Hampshire. NH Division of Parks and Recreation, Bureau of Trails PO Box 1865, Concord, NH 03301 Telephone: (603) 271-3254 www.nhtrails.org NH Heritage Trail of the NH Division of Parks and Recreation, Bureau of Trails The primary goal of the Heritage Trail is to provide and protect recreational and educational opportunities throughout the State by linking diverse communities and associated stories and histories. It is anticipated that the trail will create employment opportunities for youth, foster volunteer stewardship, and instill a sense of caring for valued natural and cultural resources. NH Heritage Trail Advisory through the Division of Parks and Recreation, Bureau of Trails PO Box 1865 Concord, NH 03301 Telephone: (603) 271-3254 www.nhtrails.org Land and Water Conservation Fund of the NH Division of Parks and Rec., Office of Recreation Services A grant program targeted at enhancing New Hampshire’s recreational opportunities through the development of facilities or acquisition of land for public outdoor recreation areas. There is an annual grant application cycle for outdoor recreation facilities and protection of open space. Requires a 50% match. New Hampshire public agencies, cities and school districts are eligible to apply. NH Division of Parks and Recreation, Office of Recreation Services PO Box 1856, 172 Pembroke Road Concord, NH 03302 Telephone: (603) 271-3556 www.nhstateparks.org Recreational Trails Program of the NH Division of Parks and Recreation, Bureau of Trails Federally funded grants are available to non-profit, municipal and private organizations to be used for maintenance and reconstruction of existing trails, purchase or lease of trail construction and maintenance

Mason Master Plan, 2007 Update
Historic, Cultural and Conservation Resources 64
equipment, construction of new trails, acquisition of easements or property for trails, and development and rehabilitation of trailhead and trailside facilities and trail linkages. Maximum 80% federal match. NH Division of Parks and Recreation, Bureau of Trails PO Box 1865 Concord, NH 03301 Telephone: (603) 271-3254 www.nhtrails.org Rivers, Trails, and Conservation Assistance Program (RTCA) of the National Park Service RTCA provides technical assistance to non-profit community and municipal groups working on trails, river conservation and land conservation for parks, wildlife and greenways. Margaret Watkins 18 Low Avenue Concord, NH 03301 Telephone: (603) 226-3240 www.nps.gov/ncrc/programs/rtca Transportation Enhancement funds through the NH Department of Transportation Federally funded program supporting maintenance or expansion of alternative modes of transportation. Projects funded at 80% federal-20% local match. Applications submitted through the regional planning commissions to the NH Dept. of Transportation. NH Department of Transportation 1 Hazen Drive Concord, NH 03301 Telephone: (603) 271-2701 www.nhdot.com/business center/programs Livable Walkable Communities, a Program of NH Celebrates Wellness The LWC program works directly with communities to engage community members in a process to assess needs, establish priorities, and develop a workable action plan for increasing opportunities for people of all ages and abilities to safely enjoy walking, bicycling and other forms of recreation. Livable, Walkable Communities Coordinator NH Celebrates Wellness 25 Triangle Park Drive, P.O. Box 617 Concord, NH 03302-0617 Telephone: (603) 224-0184, www.nhcw.org Rails-to-Trails Conservancy A national organization focused on converting abandoned rail corridors to trails. A useful source of information for a variety of trail projects. Rails-to-Trails Conservancy 1100 Seventeenth Street, NW Washington, DC 20036 www.railtrails.org
Mason Master Plan, 2007 Update
Historic, Cultural and Conservation Resources 65
Trailwrights, Inc. A nonprofit volunteer organization whose members help teach local trail groups/municipalities how to maintain their trails through hands-on sessions and may provide assistance with trail design and construction. Trailwrights, Inc. P.O. Box 1945 Hillsborough, NH 03244 www.trailwrights.org Private Foundations There are a number of foundation directories, including one for NH charities available online at www.state.nh.us/nhdoj/CHARITABLE; see also http://fdncenter.org, which publishes The Foundation Directory. The NH Charitable Foundation in Concord and its various regional divisions manage a number of funds, some of which might be appropriate for trail projects. NH Charitable Foundation 37 Pleasant Street Concord, NH 03301 Telephone: (603) 225-6641 www.nhcf.org

Mason Master Plan, 2007 Update
Water Resources Management Plan 66
WATER RESOURCE MANAGEMENT AND PROTECTION PLAN
INTRODUCTION
“It cannot be overstated: water is essential to life. Water moves ceaselessly through the natural and manmade environment. The supply and quality of water are directly affected by all that water encounters - the land it flows over and through, pavement and rooftops, through homes and industries. The water cycle is continuous and links all living and inanimate things.” New England is water rich. The landscape is green. Rain and snow are part of everyday life. But the need for clean water has always been and will be an ever more important limiting factor for the kinds and intensity of development a town, Region, or the landscape can support. New England rivers have rebounded dramatically from the polluted conditions prevalent prior to the 1970’s. Scientific and political actions built safeguards against that sort of pollution occurring again in our streams, ponds and groundwater. Today most people have a good understanding about the relationship between use of chemicals and protecting clean water. As our management of threats to water quality become more sophisticated, we are recognizing that water quantity, that is supply of enough water, is fast becoming a management issue as well. We are discovering that even the water-rich northeast has a finite amount of water available each year. About 44 inches of water falls here as rain and snow each year, 40% of which ultimately drains away to the ocean or evaporates back to the atmosphere. We are capable of using our annual water supply faster than it is replaced. “Historically, the Southwest Region’s abundant streams and ponds enabled the development of water-powered industry, the seeds of villages and connecting road networks. River valleys for our larger rivers – the Ashuelot, Connecticut, and Contoocook – provided fertile agricultural land. Rivers and ponds still drive hydroelectric plants, but much of the river valley land now hosts residential and small urban development, and our surface waters are valued mostly as recreation areas and scenery. The vast majority of Southwest Region residents are supplied with drinking water by wells drilled into bedrock. We have distanced our everyday lives from thoughts of water resources: for most of us water comes from the tap not the landscape outside our door.” 8 The purpose of the document is to provide the Planning Board and the Conservation Commission with the best possible tools for managing and protecting water resources for the Town of Mason. The goals of this document are to:
• Identify and evaluate the adequacy of existing and potential water supply sources to meet the current and future needs of the community:
• Identify existing and potential threats to surface and groundwater resources: • Evaluate existing local programs, policies, and regulations as they relate to water resources: • Identify regulatory and non-regulatory programs that would benefit the Town in its water resource
management and protection efforts.
The variables examined here to support Mason’s decisions about water resource management are:
8 Southwest Region Planning Commission. 1998. “Introduction to Southwest Region Towns: Southwest Region Natural Resources”

Mason Master Plan, 2007 Update
Water Resources Management Plan 67
• Hydrography: the characteristics of surface and groundwater, including stream miles, area of surface
water, and the nature of geological formations that may contain ground water; • Land cover and land use: landscape characteristics including area of land covered by natural
vegetation and land area altered by development and inventory of land use by type, including potential contamination sources; and
• Future land use: zoning.
Water resource management uses the geography of watersheds as management units - land areas for managing land use and monitoring environmental quality. A watershed is any contiguous land area from which all surface water drains at a single point. Watersheds can be any size, from the Connecticut River watershed which includes most of central New England to a parking lot at a local store. Watersheds are the basic management unit because, simply put, we know where the water that flows through streams, ponds and aquifers within a watershed comes from. Watersheds are delineated or defined by connecting high ground between stream drainage networks. The network formed by rivers, streams, lakes, and ponds is known as the drainage system of the watershed. Water resource management must account for human effects on the movement and quality of water. Human activity can jeopardize the availability of clean water for human and ecological needs by disrupting the natural processes of water movement. The water cycle is a network of pathways and processes by which water circulates through the environment. Figure 6.1 on the following page depicts the basic pathways, i.e. precipitation, runoff, infiltration, evaporation, etc that comprise the water cycle. One important aspect of the movement of water is that ground water (water below the water table) tends to flow in the same directions as surface water. The significance of this fact is that idea of using the geography of watersheds to manage surface water is equally useful for ground water.
Altering the terrain and vegetation, dispersing chemicals on purpose or by accident, even drawing water from one place and releasing it elsewhere do effect water quality and quantity locally. The cumulative effect of small changes with each new home and business, each day’s car exhaust, and most routine activities do affect water quality and quantity. Increased development has meant an increase in both impervious surface (compacted earth, pavement and rooftops) and site design that drains water away from development into streams. Both divert water from infiltrating into the soil and aquifer, which in turn increases flooding during storms, decreases ground water, decreases stream flow between storms, and can impair water well productivity. Development has also increased the likelihood of the release of pollutants into the soil or onto the surface which are then spread by water. Figure 6.2 (following Figure 6.1) depicts how urbanization can change percentage of precipitation that runs off to streams and ponds or infiltrates into the ground. Water resources management strives to minimize disruption of the hydrologic cycle and water quality. Clean water requires clean air and clean soil.

Mason Master Plan, 2007 Update
Water Resources Management Plan 68
Figure 6.1: Cycle of Water
Evaporation: As water is heated by the sun, its surface molecules become sufficiently energized to break free of the
attractive force binding them together, and then evaporate and rise as invisible vapor in the atmosphere.
Transpiration: Water vapor is also emitted from plant leaves by a process called transpiration. Every day an actively
growing plant transpires 5 to 10 times as much water as it can hold at once.
Condensation: As water vapor rises, it cools and eventually condenses, usually on tiny particles of dust in the air.
When it condenses it becomes a liquid again or turns directly into a solid (ice, hail or snow). These water particles then
collect and form clouds.
Precipitation: Precipitation in the form of rain, snow and hail comes from clouds. Clouds move around the world,
propelled by air currents. For instance, when they rise over mountain ranges, they cool, becoming so saturated with
water that water begins to fall as rain, snow or hail, depending on the temperature of the surrounding air.
Runoff: Excessive rain or snowmelt can produce overland flow to creeks and ditches. Runoff is visible flow of water
in rivers, creeks and lakes as the water stored in the basin drains out.
Percolation: Some of the precipitation and snow melt moves downwards, percolates or infiltrates through cracks,
joints and pores in soil and rocks until it reaches the water table where it becomes groundwater.
Groundwater: Subterranean water is held in cracks and pore spaces. Depending on the geology, the groundwater can
flow to support streams. It can also be tapped by wells. Some groundwater is very old and may have been there for
thousands of years.
Water table: The water table is the level at which water stands in a shallow well.
http://www.ec.gc.ca/WATER/en/nature/grdwtr/e_cycle.htm

Mason Master Plan, 2007 Update
Water Resources Management Plan 69
Figure 6.2: Evapo-Transpiration
With natural groundcover, 25% of rain infiltrates into the aquifer and only 10% ends up as runoff. As imperviousness increases, less water infiltrates and more and more runs off. In highly urbanized areas, over one-half of all rain becomes surface runoff, and deep infiltration is only a fraction of what is was naturally. The increased surface runoff requires more infrastructure to minimize flooding. Natural waterways end up being used as drainage channels, and are frequently lined with rocks or concrete to move water more quickly and prevent erosion. In addition, as deep infiltration decreases, the water table drops, reducing groundwater for wetlands, riparian vegetation, wells, and other uses.

Mason Master Plan, 2007 Update
Water Resources Management Plan 70
DESCRIPTION AND ANALYSIS OF CONDITIONS AND VARIABLES
WATERSHEDS
While a small portion of Mason (less than 1%) lies within the Souhegan River Watershed, the rest of Mason lies within the Nissitissit and Squannacook River sub-basins of the Nashua River Watershed. The Nashua River Watershed is a sub-watershed of the Merrimack River Watershed and consists of 538 square miles in the Central New England uplands; 31 towns in Massachusetts and New Hampshire with a total population (including areas in town that are outside of the watershed) of approximately 423,602 (2000 Census). In New Hampshire, the Nashua River Watershed encompasses almost all of the land area in Mason and Brookline as well as parts of New Ipswich, Greenville, Wilton, Milford, Hollis and Nashua and reaches almost as far south as Worcester, MA. The unique geography of the Nashua River Watershed has important implications for water quality within its sub-watersheds. Figure 6.3 shows the Nashua River and its tributaries. As seen from the figure, the Nashua River flows in a northerly direction, while many of its major tributaries flow southerly. The highest parts of the watershed are located in the north and west regions; the lowest part is also located in the north where the Nashua River meets the Merrimack River in Nashua, NH. The northerly flow of the Nashua
River to its tributaries means that the Nashua River moves slower than its tributaries. This makes it more vulnerable to oxygen depletion from pollution in comparison to other rivers of similar size. The health of the tributaries within this watershed is therefore very important to the overall health of the Nashua River and the watershed as a whole. Historically, the tributaries of the Nashua River have maintained higher water quality levels compared to the Nashua River; however, increasing population and development threatens the high water quality of the tributaries and the watershed as a whole.9 Mason is important to the Nissitissit River due to the location of headwater tributary streams being located there, namely the Spaulding Brook system of waterways. The high water quality of the Nissitissit is dependent on the high degree of forestation and little development that characterizes this area. In its current condition the Nissitissit is a cold, clean, well-oxygenated stream that is frequently cited as prime habitat for native brook trout and five listed rare species.10
Figure 6.3: Nashua River Watershed and Sub-basins
9 1995 to 2020 Vision for the Nashua River Watershed, prepared by the Nashua River Watershed Association 10 Nashua River Watershed Five Year Action Plan, 2003-2007, developed by the Nashua River Watershed Association and the Massachusetts Watershed Nashua Team

Mason Master Plan, 2007 Update
Water Resources Management Plan 71
Mason is also important to the Squannacook River, which begins at the confluence of Mason Brook and Willard Brook in West Townsend, MA. The Squannacook River is a high value riverine ecosystem with high aesthetic quality and great wildlife habitat. Similar to the Nissitissit River, the Squannacook exhibits similar characteristics- a cold clean main stem river frequently sited as prime habitat for rare species and brook trout. 11 Lying at the headwaters of this watershed is a beneficial situation for water resources protection – the vast majority of water running over and through the land of Mason falls on Mason as rain or snow. Most of the streams in Mason begin in Mason. The exception is Walker Brook, which begins at Hoar Pond in New Ipswich and Greenville. This means that Mason has a high degree of control over the aspects of land use management that affect surface water quality in Mason. The watersheds delineated in this Plan were selected to encompass land areas that are simultaneously 1) of homogeneous development conditions, 2) large enough to support a community water supply, and 3) small enough to support special management programs or activities if desired. Also, watershed areas outside the town boundaries were included only if they are upstream of Mason, i.e., only if the surface and ground water moving through them are known to or potentially may also pass through Mason, thereby directly affecting Mason’s water resources. Map 6.1 shows the watersheds delineated in Mason.
Table 6.1: Watersheds in the Town of Mason
Watershed Watershed Towns Watershed Acres
Acres in Mason
Spaulding Brook Mason, Wilton 4,514 4,115 Lancy Brook Mason, Brookline 1,219 1,119 Gould Mill Brook Mason, Brookline 2,059 1,946 Mason Brook Mason, Greenville, Townsend (MA) 5,734 5,209 Wallace Brook Mason, Townsend (MA) 564 349 Walker Brook Mason, Greenville, New Ipswich, Ashby (MA) 3,446 1,220
SURFACE WATER
Surface water systems are any type of water resource located above the ground on the earth’s surface, such as streams, rivers, ponds, lakes, and wetlands. Surface water is typically a result of ground water breaking out. The elevation of the surface of water in streams, lakes, ponds and wetlands is often the elevation of the groundwater at that point – that is, the bottom of the waterbody is below the elevation of the water table. Surface water systems may be more dynamic than groundwater systems, in that they are directly affected by wind, rain, radiation from the sun, daily and seasonal temperature change, and changes on or above the earth’s surface created by human activity. Surface water systems can be flowing or standing. Surface water systems are also important plant and animal habitat. Mason receives about 44 inches of water from snow and rain each year, of which an average of 40%, or 18 inches, is released back into the atmosphere by evapotranspiration- the processes of evaporation and transpiration. Evaporation is the loss of water from open bodies of water. Transpiration is the loss of water from living plant surfaces. Runoff is also a source of surface water loss.
11 Nashua River Watershed Five Year Action Plan, 2003-2007, developed by the Nashua River Watershed Association and the Massachusetts Watershed Nashua Team

Mason Master Plan, 2007 Update
Water Resources Management Plan 72
An inventory of surface water resources is shown below. Lakes and ponds, streams, wetlands and floodplain areas are all important resources. Map 6.1 also shows surface water resources in Mason.
*Other includes all in town areas not delineated in watersheds Note: Forested excludes areas covered by roads, structure impacts, and water bodies Note: Developed includes road area and structure impact The watersheds delineated in Mason are mostly forested. Estimated percentages of forest cover range from 92% for the Gould and Mason Brook watersheds to 100% for the Wallace Brook watershed12. Stream densities (miles of stream per acre) are fairly uniform throughout the area. Surface Water Quality Each of New Hampshire’s lakes, ponds and rivers is assigned a legislative water quality classification as follows: • Class A – The highest quality and potentially acceptable as public water supply sources after
disaffection. No sewage or wastes shall be discharged into these waters. • Class B – The second highest quality and no objectionable physical characteristics. No sewage or waste
shall be discharged in to these waters unless it has been treated. Acceptable for bathing and other recreational purposes and, after adequate treatment, for use as public water sources.
• Class C – Acceptable for boating, fishing, or for industrial water supply. These waters cannot be used
as a public water supply source.
Currently, Pratt Pond, the only water body monitored by the NH DES in Mason, is classified as Class B Waters.
12 Forested land is all land excluding roads, structures and structure impacts, and waterbodies, as analyzed using GIS.
Table 6.2: Surface Water Resources Inventory Nissitissit River Squannacook River Other*
Total 1
Spaulding 2
Lancy 3
Gould 4
Wallace 6
Mason 7
Walker Total Area in Watershed- (acres) 18,917 4,514 1,219 2,059 564 5,734 3,447 1,380 Total Area in Watershed- In town (acres) 15,341 4,115 1,119 1,946 349 5,210 1,221 1,381 Total Area in Watershed- Out of town (acres) 3,576 399 99 113 214 524 2,226 0 Lakes and Ponds (Count) 48 14 3 5 0 17 9 0 Lakes and ponds- Area (acres) 105 59 5 5 0 24 12 0 Streams (miles) 66 6 3 8 0 26 20 1 Wetlands (USGS, NWI) (acres) 876 234 77 112 41 271 102 38 Flood Zone (A) (acres) 240 0 32 65 18 67 59 0 Developed Area- Impervious Surface (acres) 993 192 32 157 1 453 113 45.3 Forested (acres) 17,850 4,294 1,158 1,902 563 5,269 3,328 1,343.0 % Forest Cover 94% 95% 95% 92% 100% 92% 96% 97%

Mason Master Plan, 2007 Update
Water Resources Management Plan 73
The NH Department of Environmental Services has carried out a field research program: “New Hampshire Lakes and Ponds Inventory,” since 1976. “The purpose of the survey is to provide information on current baseline conditions, long-term trends, water quality compliance, trophic state, acid rain impacts, and exotic weed distribution” in New Hampshire’s great ponds (waterbodies ten acres or larger). NH DES accomplishes inventory surveys for 50 or so of the State’s 780 great ponds each year. Pratt Pond is the only water body in Mason monitored by the NH DES. The last monitoring took place in summer of 1992 and winter of 1993. The reports include a bathymetric map for each pond that also shows the general distribution of aquatic plant species, the results of standard chemical and physical water quality tests, and comments about dams, wildlife, or other incidental observations. Water quality information for Pratt Pond is available at http://nhwatersheds.unh.edu/quality.asp?id=691. The full reports for these ponds are available for review from the NH DES Lakes Program. Today, NH DES conducts a Volunteer Lakes Monitoring Program (VLAP) which provides training, lends equipment, and provides laboratory testing for standard water quality parameters of water samples collected by volunteer groups – often private lake associations or Conservation Commissions. There is currently no individual or organization in Mason that monitors Pratt Pond for the VLAP. The Nashua River Watershed Association has been conducting water quality monitoring at 5 sites on Walker Brook and Mason Brook as part of their water quality monitoring program. The sites were monitored last between 1997 and 2001. The data can be found in Appendix A at the end of this chapter. Surface Water Users Water users who discharge or withdraw more than 20,000 gallons of water per day must register with NH DES and are termed “registered water users.” The inventory in Appendix B at the end of this chapter, supplied by the DES Water Supply Engineering Bureau, indicates that Fletcher Quarry is characterized as inactive for both surface water withdrawal and discharge to Old Quarry Pond.
WETLANDS
Wetlands, for regulatory purposes in Mason, are “those areas that are inundated or saturated by surface or ground water at a frequency and duration sufficient to support, and that under normal circumstances do support, a prevalence of vegetation typically adapted for life in saturated soil conditions. Wetlands generally include swamps, marshes, bogs, and similar areas.” The Town of Mason delineates wetlands “in accordance with NH RSA 482-A and the criteria referenced under Article XVI.B.1 (Town of Mason Planning Ordinance) through site specific delineation conducted by a soil or wetland scientist certified by the State of New Hampshire.13” Wetlands provide value in the hydrologic cycle for water storage, including floodwater, and eliminating sediments from runoff (including pollutants), as well as contributing to biological diversity. Regarding water supply concerns, wetlands tend to be a source of water loss from the watershed through evaporation of standing water and evapotranspiration of water taken up by plants and released into the air as water vapor through normal plant metabolism. Evaportranspiration rates for forested wetlands, especially hemlock, can be very high during the growing season. But the flood mitigation, water quality and biodiversity benefits of wetlands are essential to healthy communities.
13 Town of Mason Planning Ordinance, March 2005

Mason Master Plan, 2007 Update
Water Resources Management Plan 74
Environmental Services of wetlands: - water storage - groundwater recharge and discharge - flood control and river regulation - water purification - sediment retention
Products of wetlands: - water supply- domestic and animals - agricultural resources - fisheries - forage resource
FLOODPLAINS
Floodplains are unique ecological communities: terrestrial systems adjacent to streams and rivers that develop under the dominating effect of periodic flooding. Some species of plants and animals are found only in floodplain habitats. Floodplains provide flood water storage and elimination of sediments from streams – as flood water moves through forested flat land, the water slows and sediment falls out. Recharge to groundwater may also take place on floodplains. Because the landscape of floodplains is flat and often with sandy soils, floodplains are often desirable locations for development due to the ease with which building can occur. However, using floodplains for development jeopardizes both the sustainability of that development and the natural hydrology and ecology of the floodplains. Mason participates in the National Flood Insurance Program administered by the Federal Emergency Management Agency (FEMA). The Flood Insurance Rate Map (FIRM) is available for review at the Mason Town Hall. FEMA is in the process of updating FIRMs for all of Hillsborough County. Completion of this project, anticipated in the spring of 2007, will require the Town of Mason to adopt the new maps in order to continue participation in the National Flood Insurance Program. Surface water resources function as holding areas for floodwaters and seasonal high waters. Surface waters are also usually hydrologically connected with groundwater, most commonly, a discharge from groundwater. Groundwater discharge supplies stream flow between rain storms and snow melt periods and during the dryer summer months. The next section describes groundwater resources.
GROUNDWATER RESOURCES
Groundwater is a concentration of water in soils and rock formations. It is re-supplied through precipitation. Rain water and melting snow infiltrates into the ground. Water that is not taken up by plant roots or trapped as soil moisture will continue downward. As water passes through soil, “normal background” impurities (such as, naturally occurring plant nutrients or microbes) are usually removed through chemical reactions with soil particles and soil microbes. Conversely, if the soil is contaminated with chemicals or high concentrations of pathogens, infiltrating water can become contaminated as well. Infiltrating water eventually accumulates on top of an impervious layer below ground, e.g. clay or bedrock, and fills the spaces between grains of sand, gravel or soil particles above that barrier. The top of this saturated zone is the water table. Groundwater flows in the same general direction as surface water unless confined by bedrock or clay. Most surface water is the result of groundwater “breaking out” and flowing or accumulating on the surface –
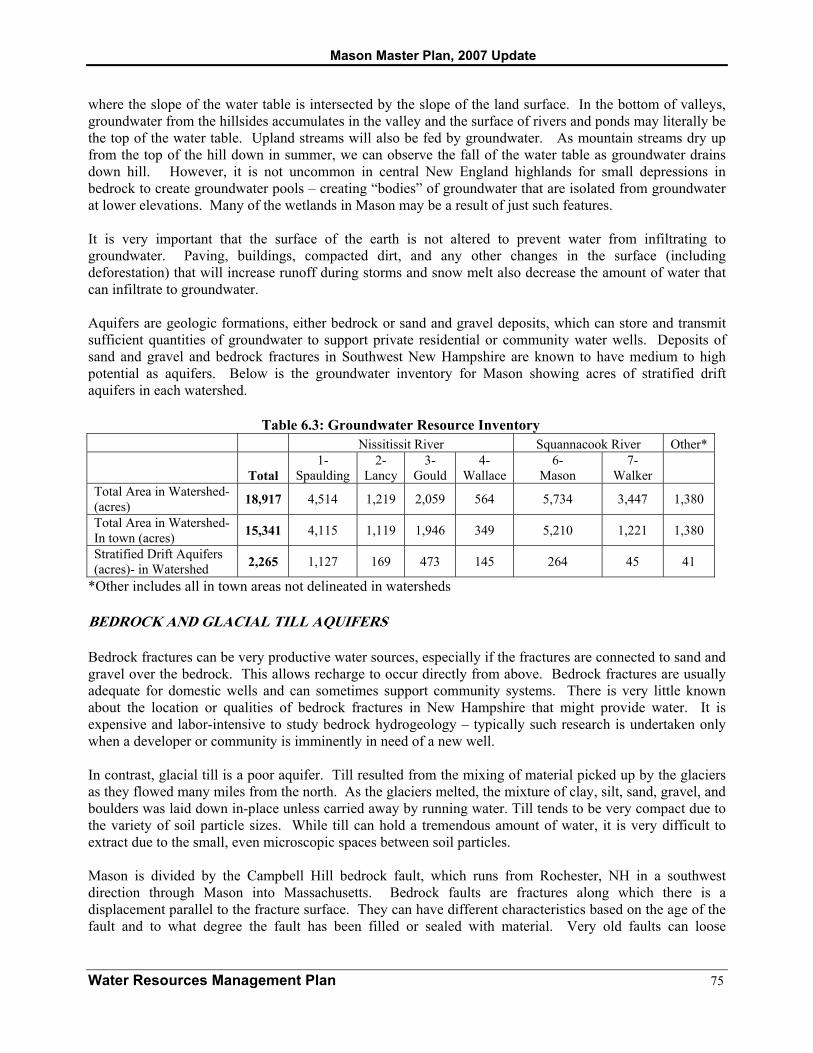
Mason Master Plan, 2007 Update
Water Resources Management Plan 75
where the slope of the water table is intersected by the slope of the land surface. In the bottom of valleys, groundwater from the hillsides accumulates in the valley and the surface of rivers and ponds may literally be the top of the water table. Upland streams will also be fed by groundwater. As mountain streams dry up from the top of the hill down in summer, we can observe the fall of the water table as groundwater drains down hill. However, it is not uncommon in central New England highlands for small depressions in bedrock to create groundwater pools – creating “bodies” of groundwater that are isolated from groundwater at lower elevations. Many of the wetlands in Mason may be a result of just such features. It is very important that the surface of the earth is not altered to prevent water from infiltrating to groundwater. Paving, buildings, compacted dirt, and any other changes in the surface (including deforestation) that will increase runoff during storms and snow melt also decrease the amount of water that can infiltrate to groundwater. Aquifers are geologic formations, either bedrock or sand and gravel deposits, which can store and transmit sufficient quantities of groundwater to support private residential or community water wells. Deposits of sand and gravel and bedrock fractures in Southwest New Hampshire are known to have medium to high potential as aquifers. Below is the groundwater inventory for Mason showing acres of stratified drift aquifers in each watershed.
Table 6.3: Groundwater Resource Inventory Nissitissit River Squannacook River Other*
Total 1-
Spaulding 2-
Lancy 3-
Gould 4-
Wallace 6-
Mason 7-
Walker Total Area in Watershed- (acres) 18,917 4,514 1,219 2,059 564 5,734 3,447 1,380
Total Area in Watershed- In town (acres) 15,341 4,115 1,119 1,946 349 5,210 1,221 1,380
Stratified Drift Aquifers (acres)- in Watershed 2,265 1,127 169 473 145 264 45 41
*Other includes all in town areas not delineated in watersheds
BEDROCK AND GLACIAL TILL AQUIFERS
Bedrock fractures can be very productive water sources, especially if the fractures are connected to sand and gravel over the bedrock. This allows recharge to occur directly from above. Bedrock fractures are usually adequate for domestic wells and can sometimes support community systems. There is very little known about the location or qualities of bedrock fractures in New Hampshire that might provide water. It is expensive and labor-intensive to study bedrock hydrogeology – typically such research is undertaken only when a developer or community is imminently in need of a new well. In contrast, glacial till is a poor aquifer. Till resulted from the mixing of material picked up by the glaciers as they flowed many miles from the north. As the glaciers melted, the mixture of clay, silt, sand, gravel, and boulders was laid down in-place unless carried away by running water. Till tends to be very compact due to the variety of soil particle sizes. While till can hold a tremendous amount of water, it is very difficult to extract due to the small, even microscopic spaces between soil particles. Mason is divided by the Campbell Hill bedrock fault, which runs from Rochester, NH in a southwest direction through Mason into Massachusetts. Bedrock faults are fractures along which there is a displacement parallel to the fracture surface. They can have different characteristics based on the age of the fault and to what degree the fault has been filled or sealed with material. Very old faults can loose

Mason Master Plan, 2007 Update
Water Resources Management Plan 76
transmissivity when filled with debris. Other faults, younger in age, retain transmissivity. Faults provide a direct connection of groundwater moving along the fault line. Water quality within bedrock faults depends on how weathered the fault is. That is, minerals which dissolve into the water, such as Iron, may contaminant the water. However, as flow rates may be higher in faults, contaminants could move away more quickly. Wells drilled into bedrock faults typically are more immune to local pollution because the recharge occurs along the fault line over a longer distance and at a higher flow rate. Without further study, the characteristics of the Campbell Hill bedrock fault found in Mason are uncertain. Three types of bedrock are found in Mason- igneous, metamorphic, and an undifferentiated mixture of igneous and metamorphic. West of the Campbell Hill bedrock fault, and east of the fault in central Mason, is igneous rock from the Devonian Period (approximately 410-360 million years ago). Further to the west is a band of metamorphic schist, quartite, and minor carbonate rocks from the Silurian period (approximately 430 million years ago). East of the fault there are three other bedrock types: 1) two-mica granite, an igneous rock from the Carboniferous-Permian period (approximately 360-245 million years ago), 2) Gneiss of the Massabesic, an undifferentiated mixture from the Precambrian-Ordovician (approximately >450 years ago), and 3) Impure and calcareous quartzite and slate, a metamorphic rock from the Cambrian-Silurian period (approximately 520-430 million years ago). Map 6.2 shows bedrock types and fracture and fault locations.
STRATIFIED DRIFT AQUIFERS
Sand and gravel deposits, also called stratified drift deposits, are typically layers of gravel, sand, silt and/or clay that were sorted and deposited by running water from the melting glaciers 40,000 years ago. They are found primarily along valley bottoms. Stratified drift can have abundant space between same-sized gravel or sand where water can accumulate and flow freely (much like the space in a jar filled with marbles). The space can be more than 30% of the deposit’s total volume. Consequently, stratified deposits of sand and gravel are often very good aquifers. The U.S. Geologic Survey (USGS) completed descriptive studies of the stratified drift aquifers in the Connecticut and Merrimack River basins in the mid 1990’s. Data from those studies are used to depict the extent and some characteristics of the stratified drift aquifers in and around Mason shown in Map 6.3. The greatest occurrences of stratified drift aquifers, measured by area, are found in the Spaulding Brook, Gould Mill Brook and Wallace Brook watersheds. However, the characteristics of these formations relevant to water supply vary particularly in regard to three characteristics: material, saturated thickness and transmissivity. All of the stratified drift deposits in Mason are thought to consist of material ranging from medium-sized sand grains to gravel, possibly with interspersed deposits of fine sand. There is a small inclusion of till on the Spaulding Brook-Mason Brook watersheds boundary. Till is an unsorted mixture of clay, silt, sand, gravel and rock fragments deposited directly by glacial ice. The Spaulding Brook watershed is bisected by the Campbell Hill bedrock fault. The Gould Mill Brook aquifer, largely in the eastern part of the town of Mason and partly in Brookline is composed of sand, gravel, and glacial lake bottom deposits (silt and clay). This aquifer has been measured to be as much as 70 ft thick14. The Wallace Brook watershed contains an aquifer composed of stratified drift deposits and an of glacial lake bottom deposits. 14 Geohydrology and Water Quality of Stratified-Drift Aquifers in the Middle Merrimack River Basin, South-Central New Hampshire. USGS Water Resources Investigations Report 92-4192. Bow, New Hampshire: 1995.

Mason Master Plan, 2007 Update
Water Resources Management Plan 77
The saturated thickness of a stratified drift deposit is the vertical distance from the water table in the aquifer to the bottom of the aquifer, typically bedrock. The saturated thickness of the deposits in Mason, measured in 10-foot intervals, range from less than 40 feet to 40 feet. Most of the deposits are less than 40 feet. The greatest saturated thickness is found in the Gould Mill Brook watershed. Test drilling of a well revealed 40 feet of saturated sand. Transmissivity, measured in “feet squared per day,” is the rate at which water can move through a material. Transmissivity takes into account the size of the spaces between sand grains or gravel and the saturated thickness and is reported by the USGS in 1,000 ft2/d intervals. A rate of less than 1,000 is generally considered inconsequential for large water supply wells, but indicates an excellent aquifer for individual wells serving homes or businesses. Transmissivity of aquifers in Mason range from 0 to 2,000. Again, the Gould Mill Brook watershed has the greatest potential for high yield wells due to high saturated thickness and high transmissivity (greater than 1,000 ft2/d).
WELLS
All water supplies, private and public, in Mason are groundwater wells. A public water supply is any source that provides water to 15 permanent connections or 25 people 60 or more days a year. Public water supplies are regulated by the State, as required by the US EPA. Public water supplies are further delineated into community systems that serve residential uses, transient systems that serve different people everyday and non-transient, non-community sources that serve the same people everyday but not in a residential setting. This definition captures municipal and private wells, such as schools, campgrounds, restaurants, large employers, and village systems.
Table 6.4: Wells Nissitissit River Squannacook River Other
Total 1-
Spaulding 2-
Lancy 3-
Gould 4-
Wallace 6-
Mason 7-
Walker Private Wells (count) 108 28 6 19 0 29 17 8 Private Wells (In town) 76 16 6 13 0 27 6 8 Public Wells (count) 16 1 0 2 0 2 9 2 Public Wells (In town) 7 0 0 2 0 2 1 2 Wellhead Protection Area-total (acres) 2,956 0 0 0 0 379 2,578 0
There are four public water supply sources within the Town of Mason; two are non-transient, non-community systems located at the Mason Public School and Imagine That Learning Center, while the other two are transient systems, Pickity Place and Parker’s Maple Barn. Also, since 1984, water well drillers are required to report the location and basic information (depth to water table, pump test results, etc.) for new or re-drilled wells of any kind in New Hampshire (Map 6-3). While there remain hundreds of private residential and commercial wells in Mason that are not identified in any data base, it is safe to assume that every house, apartment building and business has a water well. Another level of regulation is involved when water withdrawals by a single user exceed 20,000 gallons per day. Such users are required to be registered with the NH DES Water Supply Engineering Bureau. There are no active registered users in Mason that exceed 20,000 gallons per day, however Fletcher Quarry on Starch Mill Road is an inactive water return and withdrawal registered user. Pumping water from wells can change the direction of groundwater flow in the vicinity of the well. Three variables affect the magnitude of this effect: the gradient of the water table, the transmissivity of the aquifer and the pumping rate of the well. In general, the lower the gradient, or flatter and slower moving, the water

Mason Master Plan, 2007 Update
Water Resources Management Plan 78
in the aquifer; the higher the transmissivity of the aquifer; and the higher the pumping rate of the well; the greater the area influenced by well pumping. This area, shown in Figure 6.4 on the following page, is known as the Zone of Contribution, or the Wellhead Protection Area (WHPA). The shape of WHPA’s in stratified drift aquifers varies a great deal, but generally extends farther from the well uphill or upstream from the well. The WHPA for bedrock wells is often simply assumed to be circular with the well at the center; the size of the circle determined by the pumping rate of the well. There are two WHPA’s for bedrock wells in Mason recognized by NH DES. They are centered on the well located at the Mason Public School, and around the well located at Imagine That Learning Center. The wells at the Greenville Estates in Greenville have wellhead protection areas that extend across the town boundary into Mason. These wellhead protection areas constitute a large portion of the Walker Brook watershed. Map 6.3 includes WHPA’s calculated or estimated by NH DES for the public water supplies in Mason.
Figure 6.4: Zone of Contribution/Wellhead Protection Area
Understanding the size and shape of WHPA’s is important because these are areas where public health is most directly threatened by pollution of the soil or groundwater. Groundwater use, regulation of potential pollutants, and design of septic systems are in part based on assumptions about the fate of potential pollutants (chemical or biological) once released onto or into the air, soil or water. Much of the conventional risk management is based on pollutants being diluted in water or otherwise attenuated by adhesion to soil particles or biodegradation. These assumptions may not apply to WHPA since the groundwater moves very quickly to the well therein. Any substances released into the soil or water within WHPA's can move directly to the well undiluted or otherwise attenuated.

Mason Master Plan, 2007 Update
Water Resources Management Plan 79
Groundwater Users As previously discussed, water users who discharge or withdraw more than 20,000 gallons of water per day must register with NH DES and are termed “registered water users.” The Inventory in Appendix B indicates that Greenville Estates, in the Walker Brook watershed is an active water user as a water supplier. Greenville Estates withdrawals water from a bedrock well field.
POTENTIAL THREATS TO WATER RESOURCES
Point and Non-Point Pollution Sources As surface water systems flow over the land, they are subject to pollution caused either by hazardous materials located in close proximity to the system, or by pollutants discharged into the water. There are two types of pollution source categories; non-point sources and point sources. Non-point pollution sources are small dispersed sources that collectively release contaminants over large areas, such as exhaust from automobiles and lawn mowers; pesticides spread on lawns and farm fields; junkyards; and oil, other chemicals and metal particles left on pavement by motor vehicles. Point sources are contaminants or discharges which are transported by confined or discrete conveyance structures such as pipes, ditches, channels, wells, etc. Appendix A contains an inventory of potential pollution sites.
CLIMATE CHANGE AND WATER RESOURCES- NEW HAMPSHIRE LOCAL IMPACT ASSESSMENT PROJECT (LIAP)
The purpose of the New Hampshire Climate Change Local Impact Assessment Project was to bring greater understanding of the complex issue of climate change and its potential impacts to NH stakeholders. Participating scientists identified the following water resource issues as having likely impacts in New Hampshire from Climate Change: High Consensus
• Flooding • Snow depth/pack/duration • Erosion, sedimentation, pollution loads • Harmful algal blooms in freshwater systems • Coldwater fisheries • Warm water fisheries • Shellfish resources • Drinking water supplies • Saltwater incursions • Waterborne diseases • Surface water quality • Non-native species
Moderate Consensus
• Droughts • Algal productivity

Mason Master Plan, 2007 Update
Water Resources Management Plan 80
Low Consensus • Wetlands
Consensus papers on each issue identifying the likelihood, supporting research, and expected direction of potential changes are provided in an appendix of the report. The following website provides more information about this project: http://www.des.state.nh.us/ard/climatechange/impacts.htm.
DESCRIPTION OF THE COMMUNITY’S INFRASTRUCTURE
Septic Systems Since there is no public sewer system in Mason, all housing units are served by septic systems. According to NH Office of Energy and Planning, there were 535 housing single family units in Mason in 2005 which translates to approximately the same number of septic systems (535).
WATERSHED LAND USE
Watersheds were assessed for the number of properties as a measure of the number of individual land owners which in turn may represent the complexity of management programs. The size of properties was also queried to determine the imminence of development or opportunity for land protection or the effectiveness of new protective zoning standards on future development. Mason Brook and Spaulding Brook have by far the highest count of properties but they also have the largest land areas. To get a better sense of the density of development in each watershed it is necessary to look at the lot to acreage ratio. This is calculated by dividing the number of parcels in each watershed by the acreage of that watershed. This calculation shows that higher levels of development (evidenced by a higher density of lots per watershed) occurred in the Mason Brook Watershed and the Walker Brook Watershed. Spaulding Brook Watershed does have areas of dense development although the denser development is predominantly located away from the majority of streams and ponds in the watershed. Mason Brook Watershed has areas of dense development, much of it located along Mason Brook. Commercial and industrial development accounts for very little land area in Mason. Most commercial land uses occur mainly as home-based businesses throughout the community. There are 32 properties that have commercial/residential uses and 15 properties with commercial only uses. Most of the commercial uses are located in the Walker Brook watershed (8), with the remainder located in the Mason Brook (4), Spaulding (2), and Wallace (1) watersheds. Map 6.4 shows land uses by watershed. Individual septic systems are of concern regarding surface water and groundwater protection. Failing or substandard systems can release pathogens, nutrients and chemicals from households to groundwater and surface water. Areas with higher density and older housing are especially susceptible to septic system failures due to aged or under-designed systems. Review of land use densities combined with local knowledge of the age and history of neighborhoods can provide Town officials with good indication of the level of threat throughout town. Land along main roadways may be most vulnerable to system failure or cumulative effects of decades of high density on-site septic disposal. NH DES has prepared “Assessments of Public Water Supply Sources” for many supplies in New Hampshire, including 4 in Mason (Appendix C, at the end of this chapter). These reports rank the level of risk imposed by fifteen variables, such as proximity of the well and the WHPA to septic systems, development and known potential contamination sources. Overall, the level of risk to the wells investigated by NH DES to-date in Mason is low. Further information can be had from the NH DES Water Supply

Mason Master Plan, 2007 Update
Water Resources Management Plan 81
Engineering Bureau or on the NH DES website. Reports for Mason water supplies are available for review at the Town Offices. NH DES Water Supply Engineering Bureau prepared a report entitled “Inventory of Public Water Supply Sources and Potential and Existing Sources of Groundwater Contamination in Mason, NH” which provides information about water supply and contamination sources in Mason. A corresponding map, entitled “Drinking Water Resources and Potential Contamination Sources: Mason NH” reflects the inventory information.
ASSESSMENT OF GROWTH IN DEMAND FOR WATER
Regarding water consumption in Mason, estimates can be applied to better understand the amount of water used in Mason. As stated above, water used in Mason is processed through homes, gardens and businesses and returned to the ground or surface waters nearby. USGS recommends an estimate of 65 gallons per day per person in New England. The principal variable in rates of water use appears to be household income. Northeast Rural Water Association provides the following use rates: National Average for Residences 170 gallons per connection
National Average for Businesses 250 gallons per connection Central New England Residences Low-Moderate Income 55 gallons per day per person Middle Income 65 gallons per day per person High Income 500 (up to 1,000) gallons per day per person A very rough estimate of residential water demand can be calculated using information about household size and income from the 2000 U.S. Census. The 2000 population of Mason was 1,147 living in 433 households. The average household size was 2.65 persons. If income groups of less than $35,000 for low-moderate income households, $35,000 - $150,000 for medium income and greater than $150,000 for high income are used, the first step is to multiply the number of households reported in these income intervals by the Census by the average household size of 2.65; the second step is to multiply the number of people in the household income intervals by the water use rates provided by Northeast Rural Water; fourth, add the daily water use estimates for the three income intervals; and last multiply that daily total by 365 days. The resulting estimates for residential water demand in Mason are 109,486 gallons per day. Each year, 39,962,390 gallons of water are drawn from wells, processed through the daily routine of Mason residents and returned to the ground through septic systems or other waste water treatment. In 1999, the American Water Works Association published the following national average water consumption rates in gallons per person per day by type of indoor domestic use. The average per person daily water consumption was 69.3 gallons. Two years prior, in 1997, the Association estimated the average per person daily water consumption was 48 gallons.

Mason Master Plan, 2007 Update
Water Resources Management Plan 82
Table 6.5: 1999 Average Per Person Daily Water Consumption
USE National Average (gal / person / day)
Percent of Total
Showers 11.6 16.8 Baths 1.2 1.7 Clothes Washers 15 21.7 Dishwashers 1 1.4 Toilets 18.5 26.7 Leaks 9.5 13.7 Faucets 10.9 15.7 Other 1.6 2.2 TOTAL 69.3 100%
NH Office of Energy and Planning produces population estimates and projections and household and housing unit estimates for all towns in New Hampshire. As shown below, the population of Mason is projected to increase steadily over the next 25 years, increasing also the population density. As population increase, water usage increases:
Table 6.6: Relationship between Population Growth and Water Usage
2000 (Census)
2005 (OEP Estimate)
2025 (OEP Projection)
Population 1,147 1,307 1,540 Households 433 500 n/a Household Size 2.65 2.61 n/a Population Density (ppl/sq mi) 48 55 64
Housing Units 455 535 n/a With an increase in population, water conservation should be considered to minimize the impact of the additional water demand on Mason’s water resources. Updating outdated toilets, for example, can save substantial amounts of water: most toilets installed before 1980 use 5-7 gallons of water per flush. Toilets installed between 1980 and 1993 use 3.5 gallons per flush. Toilets installed since 1994 use 1.6 gallons.
DESCRIPTION OF EXISTING PROGRAMS AND POLICIES
Watershed Zoning There are three zoning districts in Mason: 1) Village Residential (VR) District, 2) General Residential, Agricultural, and Forestry (GRAF) District, and 3) Historic Preservation (HP) District. Most of Mason (91%) is zoned GRAF. 8.3% of Mason is zoned VR and a small portion, 1%, of Mason is zoned HP. GRAF District lots must be a minimum of 3.03 acres with 250 feet of frontage, while VR and HP Districts must be a minimum of 2.02 acres with 200 feet of frontage. Approximately 982 acres of Mason is protected land. This land ranges from parcels with conservation easements (on which no development is allowed) to deed restrictions (some restrictions on the land) to Town-owned land.
Mason Master Plan, 2007 Update
Water Resources Management Plan 83
Mason has no commercial or industrial zoning, therefore all commercial or industrial uses must be approved on a case-by-case basis. Mason is expected to continue to experience steady residential development, with a high demand for low density, detached single-family housing within commuting distance to Nashua, Manchester and cities in Massachusetts. Population projections anticipate an 18% increase in residents from 1,307 in 2005 to about 1,540 in 2025 – which could translate to as many as 90 new homes if the household size remains constant. Lower density development can be less detrimental to water quality and quantity and support on-site water supply and waste water treatment, but the cumulative effects of impervious surface and the purposeful or accidental release of pollutants in suburban areas can be every bit as damaging to water quality and supply as urban development. Zoning and subdivision/site plan regulations are important aspects of water resource management. Mason has land use standards found in several zoning provisions and subdivision and site plan review regulations, which specifically or indirectly protect water resources as follow: Wetland Conservation District Ordinance (Overlay District) (Adopted 1986; Amended 2004) • The Wetlands Conservation District is determined to be all surface waters and wetlands. “Wetlands”
means an area that is inundated or saturated by surface water or groundwater at a frequency and duration sufficient to support, and that under normal conditions does support, a prevalence of vegetation typically adapted for life in saturated soil conditions.
• Delineation of wetlands shall be in accordance with NH RSA 482-A and the criteria established and defined by the Corps of Engineers Wetlands Delineation Manual, 1987 through site specific delineation conducted by a soil or wetland scientist certified by the State of NH. A certified soil or wetlands scientist determination is not required for minimum impact projects unless they are part of a subdivision.
• Septic System Setback: No septic tank or leach field may be constructed or enlarged closer than 75 feet to any wetland
• Permitted Uses: Any use that does not result in the erection of any structure or alter the surface configuration by the addition of fill or by dredging and that which is otherwise permitted by the Ordinance. Uses include Forestry, cultivation and harvesting of crops, water wells, maintenance of existing drainage ways, wildlife habitat management, recreational uses, conservation areas, open space.
• An application must be made to the Zoning Board of Adjustment for a special exception for any change in the use of wetlands.
Floodplain Development Ordinance (Overlay District) (Adopted June 9, 1998, amended (TOWN MEETING 2007))
• Mason has adopted the New Hampshire Model Floodplain Development Ordinance for Communities
with Special Flood Hazard Area (SPFA). • Regulations apply to all lands designated as special flood hazard areas by the Federal Emergency
Management Agency (FEMA) in its FIA Flood Hazard Boundary Maps (FHBM) of Mason dated Feb 21, 1975, as reissued on Dec 1, 1992, and any revisions thereafter.
• The Building Inspector shall review all building permit applications for new construction or substantial improvements to determine whether proposed building sites will be reasonably safe from flooding.
• Where new or replacement water and sewer systems area proposed in an SPFA the applicant shall provide the Building Inspector with assurance that these systems will be designed to minimize or eliminate infiltration of flood waters into the systems and discharges from the systems into flood waters,

Mason Master Plan, 2007 Update
Water Resources Management Plan 84
and on-site waste disposal systems will be located to avoid impairment to them or contamination from them during periods of flooding.
• An applicant shall notify the NH DES Wetlands Bureau and the Building Inspector prior to alteration or relocation of a watercourse. All development in Zone A shall meet the following requirements: No encroachments, including fill, new construction, substantial improvements, and other development are allowed within the floodway that would result in any increase in flood levels within the community during the base flood discharge.
• Variances and Appeals: Any order, requirement, decision, or determination of the Building Inspector made under this ordinance may be appealed to the ZBA as set forth in RSA 676:5. If the applicant, upon appeal, requests a variance as authorized by RSA 674:33, I(b), the applicant shall have the burden of showing in addition to the usual variance standards under state law: A.) that the variance will not result in increased flood heights, additional threats to public safety, or extraordinary public expense; B.) that the requested variance is for activity within a designated regulatory floodway, no increase in flood levels during the base flood discharge will result; and C.) that the variance is the minimum necessary, considering the flood hazard, to afford relief.
The Planning (Zoning) Ordinance of 1967 (incorporating amendments through March 2005) Article IV: General Provisions
G- No privy, septic tank, or any portion of a sewage disposal area shall be constructed or maintained less than 75 feet from the edge of a public water body, from a well…
H- No waste waters or sewage shall be permitted to run free into a public water body or be discharged in any way that may be offensive or detrimental to the health of others. I- All buildings and sanitary systems shall be constructed and maintained in accordance with the standards set and enforced by the NH State Dept of Health and by the NH Water Pollution Commission. J- A private well or other private water system shall be constructed and maintained in accordance with the requirements of the Public Health Service Drinking Water Standards.
Subdivision Regulations October 19, 1974, incorporating amendments through April 26, 2006, repaginated June 2006 Section 5- Subdivision Design and Standards 5.02- Character of Land for Subdivision: Land of such character that it cannot, in the judgment of the Board, be safely used for building development purposes because of exceptional danger to health or peril from fire, flood, poor drainage, excessive slope, or other hazardous conditions, shall not be platted for residential, commercial or industrial subdivision, nor for such other uses as may increase danger to life or property, or aggravate the flood hazard. Land with inadequate characteristics or capacity for sanitary sewage disposal shall not be subdivided for residential, commercial or industrial subdivision purposes unless connected to a municipal sewage system. 5.05- Preservation of Existing Features: The subdivider shall give due regard to the preservation and protection of existing features, trees, scenic points, brooks, streams, rock outcroppings, water bodies, other natural resources, and historic landmarks 5.07, C:6 – The bottom of the proposed leaching bed or trench and the flood of a leaching cesspool or leaching pit shall be a minimum of four feet above any seasonal high water table.

Mason Master Plan, 2007 Update
Water Resources Management Plan 85
5.07, D:5. The designated leach field area for the proposed subdivision shall be set back as required in sub-section 6 (below) from: a. poorly and very poorly drained soils. b. naturally deposited soils which have a seasonal high water table less than six (6) inches from the surface. c. naturally deposited soils which have an impermeable layer closer than two (2) feet to the surface. d. naturally deposited soils which have bedrock less than three (3) feet below the surface. e. drainageways, natural or man made, perennial or intermittent. f. open drainage structures intended to convey water, intermittently or perennially, including but not limited to roadside ditches, culvert openings, diversions, and swales. g. existing leach fields. 5.07, D:6. The designated leach field area is required to be set back from all of the areas specified in sub-section 5 (above) as follows: a. Seventy five (75) feet if the designated leach field area is entirely located in well-drained soil without a restrictive layer, or well-drained soil with a restrictive layer and slopes of less than eight percent (8%). b. One hundred (100) feet if the designated leach field area is entirely or partially located in somewhat poorly drained or moderately well drained soil, or well drained soils with a restrictive layer and slope of eight percent or greater (>8%). c. One hundred twenty five (125) feet if the designated leach field area is entirely or partially located in excessively drained soils. 5.07, D:7. In addition, the designated leach field area shall be set back one hundred (100) feet from open water bodies and perennial streams and shall meet all State requirements for setbacks from existing or proposed wells. 5.07, D:8. In areas where the HIS survey indicates bedrock at less than three feet from the surface, sufficient test pits shall be made to ensure that the setback requirements in sub-sections 5 and 6 can be met. 5.07, D:9. The designated leach field area shall not be placed on areas with finished slopes of over twenty-five percent (25%). 5.07, D:10. If the designated leach field area is located on an area with finished slopes from fifteen to twenty-five percent (15-25%), the septic system shall be designed by a registered Professional Engineer. 5.07, D:11. The Plat shall show an existing well or other water supply, or a proposed well site if no water supply exists. The proposed water supply shall be set back a minimum of seventy-five (75) feet from the property boundary, thus preserving the state-required seventy-five (75) feet protection radius. 5.19, B:4. Erosion and Sediment Control: Standards. During construction, the disturbed area shall not be closer than 25 feet to wetland area boundaries. 5.19, C:2. Erosion and Sediment Control: Activities requiring a certified Erosion and Sediment Control Plan. An erosion and sediment control plan shall be provided for all subdivisions, except those defined as "minor subdivisions" per RSA 676:4, III. 5.21. Other Open Space. If no such open space, park or playground is shown on the Town of Mason Master Plan within the boundaries of a proposed subdivision, the Board may, where it deems essential, require that the Plat show one or more sites of character, size, shape and location suitable to be used as community open space or park, in area not to exceed fifteen percent (15%) of the total area of the subdivision. The subdivider may of his own volition exceed the above area requirements. In the case of cluster subdivision or planned unit development, open space shall be not less in area than as provided in the zoning regulations.

Mason Master Plan, 2007 Update
Water Resources Management Plan 86
GOALS AND RECOMMENDATIONS
The recommendations below are meant to support the following goals for this plan: Goal 1: Preserve or enhance the quality of water resources within the Town of Mason to ensure the provision of the social and ecological values they support. Goal 2: Ensure a safe and sufficient supply of water to support existing and future development within the Town of Mason. Recommendations 1. In general, local officials are strongly encouraged to become familiar with the protection measures described in relevant NH DES Environmental Fact Sheets: A link to Drinking Water Source Protection Program Fact Sheets can be found at http://www.des.state.nh.us/factsheets/ws/ws-12-1.htm. 2. The Town of Mason should enact the New Hampshire Groundwater Protection Program to achieve a management program through reclassification of Mason’s wellhead protection areas and other groundwater resources.
New Hampshire Groundwater Protection Act (RSA 485-C), passed in 1991, enables local entities (water supplies, local boards) to implement a groundwater protection program for wellhead protection areas or other groundwater resources. Initially, all groundwater was classified as GB or GA2. Under the act, wellhead protection areas or other valuable groundwater may be reclassified as GAA or GA1. The town is granted authority to enter properties in a designated area to inspect and enforce the implementation of Best Management Practices for the use, storage or handling of potential contaminants sources (PCSs). The Town of Stratham, as part of a comprehensive groundwater protection program, had NH DES reclassify the entire town’s groundwater as locally important. This has led to a successful program that keeps groundwater clean for both private and public water supplies. The classes of groundwater are as follows:
Table 6.7: Classes of Groundwater
Class Local Inspection Of PCSs Description/Comments
GAA Yes
- Most protected class - Includes groundwater flowing to public water supply wells (wellhead protection areas). - Prohibits six high risk land uses
GA1 Yes - Local entities identify valuable groundwater resources they want to protect via management of potential contamination sources.
GA2 No - Includes high-yield stratified drift aquifers mapped by the USGS that are potentially valuable sources of drinking water.
GB No - Includes all groundwater not in a higher classification. As in all classes, groundwater must meet drinking water quality standards.
To obtain a GAA or GA1 classification, the local entity or the state must:
1. Identify the area to be reclassified.

Mason Master Plan, 2007 Update
Water Resources Management Plan 87
2. Inventory activities that could threaten groundwater within the area(s) to be reclassified. (A list of the potential contamination sources to be included in the inventory is found in RSA 485-C:7.)
3. Hold an informational meeting (optional) to inform the public of the intention of implementing a protection program
4. Formulate a management plan that includes: a. Notification to potential contamination sources; b. Performance of periodic inspections to ensure compliance with best management practices.
5. Submit an application for reclassification to DES. DES will notify all landowners of the reclassification request and hold a public hearing to solicit comments.
6. Maintain the management program. If active management is not occurring, DES may downgrade a GAA or GA1 classification to GB or GA2. Active management includes the following:
a. Every three years the local entity must update the potential contamination source inventory, notify source owners, and conduct source inspections.
Reclassification of Wellhead Protection Areas to GAA Results In …
• Active management of potential contamination sources to ensure compliance with best management practices as described in Env-Ws 421.
• Prohibition of a few new uses that pose a high pollution risk to groundwater, i.e., landfills, hazardous waste disposal facilities, etc.
• Release detection permits for existing high-risk facilities that would be prohibited, and for new solid waste composting or resource recovery facilities.
• Investigation, inspection, and cease and desist authority to local entity who obtains reclassification. • Prior notice to municipalities on state environmental permits. • Technical and enforcement support provided by the state to the local entity who obtains
reclassification. Reclassification of Valuable Groundwater to GA1 Results In …
• Active management of potential contamination sources to ensure compliance with Best Management Practices.
• No prohibitions of land uses. • Investigation, inspection, and cease and desist authority to the local entity who obtains
reclassification. • Prior notice to municipalities on state environmental permits. • Technical and enforcement support provided by the state to the local entity who obtains
reclassification. For more information refer to the NH DES Environmental Fact Sheets :
• “Local Reclassification of Groundwater to Implement Protection Programs: A Ten Step Process”, WD-WSEB-22-2;
• “Groundwater Reclassification and How it Affects the Property Owner”, WD-WSEB-22-3; • “Delineating Wellhead Protection Areas”, WD-WSEB-12-2; and • “Performing an Inventory for Drinking Water Protection”, WD-WSEB-12-3.
For an example of reclassification in New Hampshire, the town of Stratham has reclassified all its groundwater. More information about reclassification and other protection measures for groundwater can be found in the publication “The DES Guide to Groundwater Protection” which can be found online at http://www.des.state.nh.us/dwspp/pdf/des_guide_to_ground_water.pdf
Mason Master Plan, 2007 Update
Water Resources Management Plan 88
An additional document, “Protecting Groundwater Resources” is found in Appendix D at the end of this chapter.
3. The Town of Mason should consider the establishment of a Health Ordinance pursuant to the guidance document “Model Health Ordinances to Implement a Wellhead of Groundwater Protection Program” published by the NH DES. A possible alternative to the Groundwater Reclassification program described in (2) is the use of a Health Ordinance for the enforcement of the same standards for Best Management Practices. The Health Ordinance alone might not institutionalize public education and routine inspection as the Groundwater Reclassification program would. However, the Health Ordinance would enable to Town to collect fees and fines to offset the cost of enforcement. 4. The Town of Mason should establish and maintain the paid position of Health Officer in Mason town government. This position could be shared with one or more neighboring communities. The maintenance of a Health Officer can provide dedicated municipal attention to a variety of issues, including water quality monitoring and protection. The Health Officers duties could include:
• Primary agent for carrying out Groundwater Reclassification and implementation of the resulting Management Plan;
• Maintain a data base of water use and existing or potential contamination sources; • Design and implement a voluntary Septic System Monitoring program; • Design and implement public education activities regarding water resource protection, including
water conservation measures; • Respond to complaints of water quality threats, such as substandard septic systems or misuse of
potential contaminants. 5. The Town of Mason should develop a town-wide Open Space Protection Plan. This Plan can be included in the Town’s Master Plan. It identifies areas of Town, types of landscape conditions, or specific properties that are important for a variety of ecological and social values – including plant and animal habitat, scenic views, recreation, and water resource protection. An up-to-date Open Space Plan is the foundation for regulatory measures, municipal land acquisition and any other public policy issues involving conservation. This is lately becoming a standard element of modern Master Plans and would be a fitting companion to the Water Resources Management and Protection Plan. 6. The Town of Mason should pursue Source Water Protection measures, those which protect groundwater and public drinking water, in addition to the Groundwater Protection Program, particularly land conservation, for high yield stratified drift aquifers in the Spaulding Brook and Gould Mill Brook watersheds, and along NH 123 in the Mason Brook watershed. Source water protection can be accomplished through restrictive zoning (through a groundwater protection ordinance), land conservation through easement, land acquisition by the Town, a municipal management program such as affected by Groundwater Reclassification, or public education. Areas for protection include the Wellhead Protection Areas for existing public water supplies as well as watershed and aquifer areas deemed suitable for future public water supplies. The Spaulding Brook and Gould Mill Brook stratified drift aquifers may hold the most promise due to low density development, large watershed areas, and high yield stratified drift deposits. Further development municipal support for source water protection

Mason Master Plan, 2007 Update
Water Resources Management Plan 89
and definition of areas for action would benefit from the process of developing a municipal Open Space Plan. Matching funds for purchase of easements or land for source water protection are available on a competitive basis through New Hampshire’s land and Community Heritage Program (LCHIP) and NH DES Source Water Protection program. Model easements developed by the Society for the Protection of New Hampshire Forests are available through NH DES. Assistance with land conservation is available locally through the Monadnock Conservancy and the Nichols-Smith Conservation Land Trust. For more information refer to the NH DES Environmental Fact Sheets :
• “Proposing to Create a New Public Water System”, WD-WSEB-6-6 and • “Protection Programs Required for New Production Wells”, WD-WSEB-12-5
The Town should also work closely with the Nashua River Watershed Association to achieve protection measures. 7. The Town of Mason should investigate the use of Conservation Subdivision practices to protect water resources. Conservation Subdivision, a.k.a. Conservation Zoning, like Cluster Development, sets aside part(s) of the property being subdivided for permanent protection from development. The uses of the set-aside may vary according to municipal policy. Unlike clustering, this practice is based in a town-wide plan for identifying the land to be set aside. The municipal Open Space Plan should be the basis for establishing standards or criteria for designating the conservation set-aside – a benefit over the case-by-case negotiation typical of implementation of Cluster Subdivision. The article “Growing Greener: Conservation Subdivision Design” by Randall Arendt which was published in the Winter 1999 Planning Journal, provides and excellent explanation of the Conservation Subdivision concept. The New Hampshire Office of Energy and Planning’s website contains a number of links to model ordinances and other relevant information regarding conservation subdivisions. The website can be accessed at: http://www.nh.gov/oep/resourcelibrary/referencelibrary/o/openspace/
8. The Town of Mason should consider requiring on-site community water supply and waste water treatment systems for larger subdivisions and in areas of greater density.
The likelihood of Mason requiring a centralized public water supply system due to development density is low, and the cost of serving widespread, sparsely populated areas with centralized water is very high. Large-scale residential or commercial developments should be encouraged to develop self-contained, on-site community water supply and waste water treatment systems. This can allow for locally greater densities and support smart growth objectives such as open space development, which in turn can ultimately retain a larger percentage of the town’s land area in natural vegetation and terrain – protecting the natural hydrology. Centralized water supply systems for higher density areas or other types of development clusters may rely on one medium-yield, or even several low-yield wells, which could exploit smaller stratified drift deposits or even be located in bedrock by trial-and-error drilling. Protecting groundwater resources while setting up community systems should be a concern.

Mason Master Plan, 2007 Update
Water Resources Management Plan 90
9. The Town of Mason should determine where the most probable high-yield well locations are in Town for possible use in the future. The possibility of the need arising to supply small or large areas of town following contamination of ground water by accidental release of contaminants (in a catastrophic spill or the cumulative effect of small or systematic release) is always present, particularly in highway corridors and areas with manufacturing land uses. The possibility of developing one or more high-yield bedrock wells is uncertain. Information on the favorability for well development is not readily available today. The NH Department of Environmental Services and US Geologic Survey have developed a coarse resolution analytical method for assessing bedrock formations’ probability of supporting high-yield wells. That methodology could be applied to Mason to support preliminary discussion of the feasibility of further prospecting. The Town can consult with NH DES Hydrologists and NH Geologic Survey to explore the bedrock aquifer favorability analysis. 10. The Town of Mason should take steps to protect surface water resources and storm water management including wetlands and wetland buffers through development of a comprehensive wetlands protection ordinance. The dispersed development patterns of Mason, and the current zoning which will likely perpetuate low density residential development, might best be served by measures that safeguard the quality and availability of water town-wide. The use of programs and standards that can assure “good environmental hygiene” – clean air, clean soil and clean water – can avoid the need for centralized water supply by avoiding the contamination of surface and groundwater. The town can initiate or otherwise promote a related set of measures to address surface water protection. Surface water quality is a function of both surface and subsurface conditions, since base stream flow, (between rain storms and snow melt periods) is supplied by ground water. Protection for storm water storage in wetlands and within wetlands buffers should also be stressed. The town should consider Best management Practices (BMPs) for those land uses and activities that pose a potential threat to surface and groundwater resources. A source for information on BMPS can be found here: http://www.des.nh.gov/dwspp/bmps.htm The Town is currently working to update its Wetlands Ordinance. Once this updated ordinance is adopted, there will be far greater protection of surface water and wetlands town-wide. The town should work to include protections for storm water storage into the ordinance, and site plan and subdivision review regulations. 11. The Town of Mason should work to strengthen protection of water resources through its ordinances and regulations. Table 6.8 below rates the protection of eight aspects of water resources through the existing zoning ordinance, subdivision review regulations, site plan review regulations and building codes.
• The Town should examine regulations in the context of the eight aspects of water resource protection in Table 6.8 on a regular basis.
• The Town should seek to incorporate language into regulations that lack protection.

Mason Master Plan, 2007 Update
Water Resources Management Plan 91
• The Town should update Table 6.8 following each regulation update and seek to provide adequate protection to all parameters.
Table 6.8: Review of Local Ordinances and Regulations (July, 2007)
Eros
ion
and
Sedi
men
tatio
n
Surf
ace
Wat
er F
low
s G
roun
dwat
er
Rec
harg
e M
gmt o
f Exi
stin
g &
Po
tent
ial
Con
tam
inan
t So
urce
s
Floo
d St
orag
e
Encr
oach
men
t on
Wet
land
s
Nut
rient
Lev
els
Wild
life
& F
ishe
ries
Hab
itat
Planning (Zoning) Ordinance 2 1 1 1 3 2 1 1 Subdivision Regulations 2 2 2 1 2 2 2 1 Site Plan Review Regulations 2 2 1 2 1 1 2 1 Building Codes 1 1 1 1 1 1 1 1 Rating: 1 – Not addressed in Local Regulation 2 – Included in Local Regulations – Revisions advisable 3 – Included in Local Regulations – Adequate provisions provided

Mason Master Plan, 2007 Update
Water Resources Management Plan 92
WATER PLAN APPENDICIES

Appendix A

Water quality monitoring point: MB0401
Town: Mason, NH
Waterbody: Mason Brook
Years site has been monitored: 2000 - 2001
Location: 100 ft DS of Jed's Lane bridge

Water quality monitoring point: MB0420
Town: Townsend, MA
Waterbody: Squannacook River
Years site has been monitored: 1999 - 2001
Location: 0.1 mile US of Jed's Lane bridge off Rt. 123

Water quality monitoring point: WK0360
Town: Mason, NH
Waterbody: Walker Brook
Years site has been monitored: 1997 - 2001
Location: South end of Old Walker Brook Rd (dirt), near 124

Water quality monitoring point: WK0554
Town: Mason, NH
Waterbody: Walker Brook (west branch)
Years site has been monitored: 1997 - 1999
Location: Below Walker Brook Rd, west branch, W of Rt 31
Water quality monitoring point: WK0545
Town: Mason, NH
Waterbody: Walker Brook
Years site has been monitored: 1998
Location: DS of confluence of W branch and main branch, E of Rt 31

Appendix B

Inventory of Public Water Supply Sources and Potential and Existing Sources of Groundwater Contamination in MASON, NH
Notes: 1. Report prepared December 7, 2006 by the NHDES Water Supply
Engineering Bureau. 2. The map-cell column in the report indicates which 1000-foot grid cell
the site or facility is located on the accompanying map. For example, a map-cell value of "G-11" indicates column "G" and row "11".
3. Only those sites or facilities that are within a 4000-foot buffer of the map's named city or town are listed in this report.
Source Water Hazard Inventory Sites This includes all Groundwater Hazard Inventory, Remediation Sites, and Initial Response Spill Sites regulated by NHDES to ensure water resource protection. For a description of particular project types, please see the attached key.
MAP CELL FACILITY SITE# FACILITY NAME AND ADDRESS PROJECT TYPE
X-15 199612016 FLETCHER QUARRY STARCH MILL ROAD MASON TAX MAP: B, LOT: 17
LAST (INACTIVE) Risk: 8
X-15 199612016 FLETCHER QUARRY STARCH MILL ROAD MASON TAX MAP: B, LOT: 17
UIC Risk: 8 Staff: REGISTRATION
I-17 200406128 CONCRETE PRODUCTS INC. 87 ADAMS HILL RD GREENVILLE
SPILL/RLS (INACTIVE) Risk: 8
I-19/ I-20
199103026 GREENVILLE ABANDONED DUMP OFF OLD MASON ROAD GREENVILLE TAX MAP: 2, LOT: 44
OLD DUMP Risk: NDY Staff: UNASSIGNED
I-23 200302057 PATRICA PIPER 602 FITCHBURG ROAD, LOT 26 GREENVILLE
OPUF (INACTIVE) Risk: 8
I-23 199706037 STEVEN DONALDSON 602 FITCHBURG ROAD LOT 20 GREENVILLE TAX MAP: 00F, LOT: 20
OPUF (INACTIVE) Risk: 8
Y-23 200102011 KEN ENGLISH 773 BROOKLINE RD MASON
OPUF (INACTIVE) Risk: 8
K-29 199306002 ROBERT BELANGER 51 GREENVILLE ESTATES PARK GREENVILLE
SPILL/RLS (INACTIVE) Risk: 8
K-32 200108003 TWEEDY TRANSPORT- INACTIVE 49 FITCHBURG ROAD MASON
UIC Risk: 1 Staff: REGISTRATION
K-34 200203054 WEE DREAMS LEARNING CENTER 712 TURNPIKE RD NEW IPSWICH
ETHER (INACTIVE) Risk: 8
K-35 200204044 WILLIAM FALGARES 93 TURNPIKE RD MASON
OPUF (INACTIVE) Risk: 8

2
MAP CELL FACILITY SITE#
FACILITY NAME AND ADDRESS PROJECT TYPE
K-35 198906043 STATELINE VARIETY 403 FITCHBURG RD MASON TAX MAP: J, LOT: 20
LUST Risk: 5 Staff: WHIPPLE
J-36 198903002 RUGGIERO PIG FARM CHURCHILL ROAD MASON TAX MAP: J, LOT: 69
HAZWASTE (INACTIVE) Risk: 8
Aboveground Storage Tank Facilities These are facilities where there are, or where in the case of inactive sites, aboveground storage tanks. If there is a documented release from a tank, it becomes a LAST project type and is listed in the Source Water Hazard Inventory.
MAP CELL FACILITY SITE# FACILITY NAME AND ADDRESS # TANKS
<< NO FACILITIES PRESENT >>
Underground Storage Tank Facilities These are facilities where there are, or where in the case of inactive sites, underground storage tanks. If there is a documented release from a tank, it becomes a LUST project type and is listed in the Source Water Hazard Inventory.
MAP CELL FACILITY
SITE# FACILITY NAME AND ADDRESS # TANKS
X-15 0111086 FLETCHER QUARRY STARCH MILL ROAD MASON TAX MAP: B, LOT: 17
TANKS: 0 (INACTIVE)
R-29 0112150 TOWN OF MASON 101 DEPOT RD MASON TAX MAP: G, LOT: 73
TANKS: 0 (INACTIVE)
R-29 0114049 MASON HIGHWAY DEPT 83 DEPOT RD MASON
TANKS: 1
K-35 0113717 STATELINE VARIETY ROUTE 31 & 124 MASON TAX MAP: J, LOT: 20
TANKS: 0 (INACTIVE)
Automobile Salvage Yards
MAP CELL FACILITY SITE#
FACILITY NAME AND ADDRESS STATUS
<< NO FACILITIES PRESENT >>

3
Local Potential Contamination Source Inventory Sites
Includes potential contamination sources within a source water protection area. The sites were located by Public Water Systems applying for a sampling waiver, or by NHDES-WSEB staff during “windshield surveys”.
MAP CELL SITE# SITE NAME AND ADDRESS PROJECT TYPE
M-32 15150301A <UNNAMED SITE> MASON
WSPS
K-35 15150301B JT's Power Equipment Route 124 MASON
GSR
National Pollutant Discharge Elimination System (NPDES) Outfalls All facilities which discharge any pollutant from point sources to surface waters (directly or indirectly) are required to obtain a federal permit from the US Environmental Protection Agency and a State Water Discharge Permit from NHDES.
MAP CELL OUTFALL ID# FACILITY NAME AND ADDRESS
STATUS TYPE
CATEGORY WATER BODY
Y-13 0020524 FLETCHER QUARRYSTARCH MILL ROAD MASON
INACTIVE MINOR WW SPAULDING BROOK VIA TRIB.
Point/Non-point Potential Pollution Sources These include local land-use inventories performed by the Regional Planning Commission in 1995. For a description of the Project Types, see the attached key.
MAP CELL SITE# SITE NAME AND ADDRESS PROJECT TYPE AI-15 195-07 BURBEE GRAVEL PIT
MILE SLIP ROAD MILFORD
MS

4
Resource Conservation & Recovery Act (RCRA) Sites These are facilities that generate hazardous waste. If a release is documented, it listed under the Source Water Hazard Inventory Sites.
MAP CELL FACILITY SITE# FACILITY NAME AND ADDRESS
STATUS REGULATED GEN. TYPE
AG-04 NHD500014436 CONSOLIDATED RECYCLING INC 164 MILE SLIP RD MILFORD
DECLASSIFIED RCRA REGULATED NONE
G-07 NHD066750480 KIMBALL PHYSICS 311 KIMBALL HILL RD WILTON
ACTIVE RCRA REGULATED SQG(CESQG)
X-15 NHD510101272 FLETCHER QUARRY 589 STARCH MILL RD MASON
ACTIVE STATE REGULATED NONE
I-22 NHD048725816 FROST FARM SERVICE INC 53 MASON RD GREENVILLE
ACTIVE STATE REGULATED NONE
Registered Water Users “Use of water” includes the withdrawal of water from the ground or surface water body, the delivery of water from another supplier to the user indicated, the release of water from the user indicated to another facility, and/or the return of water to the environment.
MAP CELL SDID FACILITY NAME AND ADDRESS ACTION TYPE
WATER BODY Y-13 20405-D01 FLETCHER QUARRY
STARCH MILL ROAD MASON
RETURN (INACTIVE) INDUSTRIAL OLD QUARRY POND
Z-13 20405-S01 FLETCHER QUARRY STARCH MILL ROAD MASON
WITHDRAWAL (INACTIVE) INDUSTRIAL OLD QUARRY POND
K-29 20700-S01 GREENVILLE ESTATES 41 OLD ASHBY ROAD GREENVILLE
WITHDRAWAL WATER SUPPLIER BEDROCK WELLFIELD

PUBLIC DRINKING WATER SUPPLIES - MASON, NH Notes: 1. Report prepared December 7, 2006 by the NHDES Water Supply Engineering Bureau.
2. Public Water Supply Sources are labeled on the map with their respective PWS ID numbers. The map-cell values (shown in parenthesis beneath the PWSID in the report) indicates which 1000-foot grid cell the source is located on the accompanying map. For example, a map-cell value of "G-11" indicates column "G" and row "11".
3. Only those sources that are within a 4000-foot buffer of the map's named city or town are listed in this report.
PWSID SYSTEM NAME AND ADDRESS SYS.
TYPE SYS. ACTIVE
SRC. TYPE
SRC. ACTIVE
SRC. REC.
WELL TYPE
WELL DEPTH
POP. SERVED
2522010-001 (U-05)
ORCHARD VIEW ORCHARD VIEW DR WILTON
C I G A SG BRW 345 15
1518010-001 (L-12)
PICKITY PLACE NUTTING HILL RD, PO BOX 544 MASON
N A G A SG BRW 100 60
1518010-501 (L-12)
PICKITY PLACE NUTTING HILL RD, PO BOX 544 MASON
N A E A PT 0 60
1518010-002 (L-12)
PICKITY PLACE NUTTING HILL RD, PO BOX 544 MASON
N A G A SG BRW 0 60
0993030-001 (I-23)
FROST TRAILER PARK RTE 31 GREENVILLE
C A G A SG BRW 181 73
0993030-002 (I-23)
FROST TRAILER PARK RTE 31 GREENVILLE
C A G A SG BRW 275 73
0993030-501 (I-23)
FROST TRAILER PARK RTE 31 GREENVILLE
C A E A PT 0 73
0999010-001 (K-25)
MERRIAM HILL CENTER 148 MERRIAM HILL RD, RTE 123 GREENVILLE
N I G A SG BRW 180 25
1515010-001 (P-25)
MASON PUBLIC SCHOOL RTE 123 MASON
P A G A SG BRW 290 111
1515010-501 (P-25)
MASON PUBLIC SCHOOL RTE 123 MASON
P A E A PT 0 111
1519010-001 (P-26)
MASON CONGREGATIONAL CHURCH VALLEY ROAD MASON
N I G A SG 0 15

2
PWSID SYSTEM NAME AND ADDRESS SYS. TYPE
SYS. ACTIVE
SRC. TYPE
SRC. ACTIVE
SRC. REC.
WELL TYPE
WELL DEPTH
POP. SERVED
1518020-001 (AC-26)
PARKERS MAPLE BARN/SUGAR HOUSE 1349 BROOKLINE RD MASON
N A G A SG BRW 1230 300
1518020-002 (AC-26)
PARKERS MAPLE BARN/SUGAR HOUSE 1349 BROOKLINE RD MASON
N A G A SG BRW 1250 300
1518020-501 (AC-26)
PARKERS MAPLE BARN/SUGAR HOUSE 1349 BROOKLINE RD MASON
N A E A PT 0 300
0993020-001 (J-29)
GREENVILLE EST TENANTS COOP RTE 31 GREENVILLE
C A G I SG BRW 380 480
0993020-002 (J-29)
GREENVILLE EST TENANTS COOP RTE 31 GREENVILLE
C A G I SG BRW 126 480
0993020-003 (J-29)
GREENVILLE EST TENANTS COOP RTE 31 GREENVILLE
C A G A SG BRW 150 480
0993020-004 (J-29)
GREENVILLE EST TENANTS COOP RTE 31 GREENVILLE
C A G I SG BRW 430 480
0993020-005 (J-29)
GREENVILLE EST TENANTS COOP RTE 31 GREENVILLE
C A E A PT 0 480
0993020-503 (J-29)
GREENVILLE EST TENANTS COOP RTE 31 GREENVILLE
C A E A PT 0 480
0993020-006 (K-29)
GREENVILLE EST TENANTS COOP RTE 31 GREENVILLE
C A G A SG BRW 600 480
1712020-001 (B-34)
THE COLONIAL APARTMENTS MASON RD NEW IPSWICH
C I G A SG BRW 365 25
1515030-001 (K-34)
IMAGINE THAT EARLY LRNING CTR 339 FITCHBURG RD, RTE 31 MASON
P A G A SG BRW 0 40
1515030-501 (K-35)
IMAGINE THAT EARLY LRNING CTR 339 FITCHBURG RD, RTE 31 MASON
P A E A PT 0 40

Appendix C

Assessments of Public Water Supply Sources - MASONThis report is a summary of NH Department of Environmental Services’ assessments of the vulnerability of each source used by the public water system(s) located in this municipality. The sources listed here are grouped first by the type of public water system and then by the system itself. Each source was ranked according to a number of criteria; a vulnerability ranking is given for each criterion that applies to the source. An explanation of each column in the report can be found on the last page.
Source Number
Source Description
Source Type
Date Assessment
Completed Highs
Mediums
Lows
Well/IntakeKCSsPCSs
Highways/RRsPesticides
SepticsUrban Land CoverAg Land Cover
Animals
LagoonsDry dischargesSanitary radiusTrophic status
Number of Vulnerability
Rankings
Susceptibility Ranking Criteria
Detects
NSystem Type C=Community; P=Non-Transient, Non-Community; N=Transient
EPAID 1518010 PICKITY PLACESystem Name:001 BRW G 01/31/2001 2 0 7 L L H L H L L LL
EPAID 1518020 PARKERS MAPLE BARN/SUGAR HOUSESystem Name:001 BRW G 01/31/2001 1 0 8 L L H L L L L LL
002 BRW G 09/27/2000 1 0 8 L L H L L L L LL
PSystem Type C=Community; P=Non-Transient, Non-Community; N=Transient
EPAID 1515010 MASON PUBLIC SCHOOLSystem Name:001 BRW G 09/28/2001 1 3 8 L L L H L M L M L L ML
Tuesday, August 08, 2006 Page 1 of 4Last update:

Explanatory Notes Abbreviations used in the following notes: HAC = hydrologic area of concern for a surface water source. For small or undeveloped watersheds, the HAC includes the entire watershed. For all other surface sources, the HAC includes only a portion of the watershed close to the water system intake. WHPA = wellhead protection area for a groundwater source. For community and non-transient systems, the WHPA is the area from which water is expected to flow to the well under extremely dry conditions. For transient systems, the WHPA is the area within 500 ft of the well. EPAID: Each public water system is identified by a 7-digit federal ID number. Source number: Each source is further identified by a 3-digit number. Source description: An abbreviated description of the source from NHDES's database. (Some common abbreviations: BRW=bedrock well; GPW=gravel-pack well; GRW=gravel well; DUG=dug well; PTW=point well; SPR=spring; ART=artesian well; INF=infiltration well.) Source type: G=groundwater (well or spring); S=surface water (lakes, reservoirs, ponds, rivers); E = water purchased from another system (Purchased sources are not assessed per se, but the original sources used by the seller are assessed). Date Assessment Completed: The date NHDES completed the process of reviewing available data, collecting new data, and entered the assessment information into its database. Number of Vulnerability Rankings: The number of High, Medium, and Low rankings for that source listed in the columns to the right. Each criterion is explained below. Some criteria do not apply to all types of sources or systems. Detects: Confirmed detections of certain contaminants (after treatment) of suspected human origin, not including disinfection byproducts. L = none detected at or above trigger levels in the most recent round of sampling. There is no M ranking for this criterion. H = contaminants were detected at or above trigger levels. Well/Intake: The integrity of the well (if a groundwater source) or the intake (if a surface water source). L = no unresolved deficiencies with the well or intake identified in the most recent sanitary survey. There is no M ranking for this criterion. H = there are unresolved deficiencies.KCSs: Known contamination sources in the vicinity of the source. This includes any site known to DES where contaminants are known or very likely to have been released to the ground, and where remediation is not complete. L = none present in the WHPA (for groundwater sources) or in the HAC (for surface water sources). M (for community and non-transient systems) = one or more KCSs in the WHPA or HAC but not within 1,000 ft of the well or intake. There is no M ranking for transient systems. H = one or more KCSs within the WHPA or HAC within 1,000 ft of the well or intake. PCSs: Potential contamination sources in the vicinity of the source. This includes any site known to DES where contaminants are known or very likely to be used in significant quantities, but where there are no known releases to the ground. L (for community and non-transient systems) = no PCSs within 1,000 ft of the well in the WHPA (for groundwater sources) or none present in the HAC (for surface water sources). L (for transient systems) = none present in the WHPA. M (for groundwater sources serving community and non-transient systems) = 10 or fewer PCSs within 1,000 ft of the well in the WHPA. M (for surface water sources) = one or more PCSs in the HAC but not within
Tuesday, August 08, 2006 Page 2 of 4Last update:

1,000 ft of the intake. There is no M ranking for transient systems. H (for groundwater sources serving community and non-transient systems) = more than 10 PCSs within 1,000 ft of the well in the WHPA. H (for transient sources) = one or more PCSs in the WHPA. H (for surface water sources) = one or more within 1,000 ft of the intake in the HAC. Highways/RRs: The presence of numbered state highways or active railroads in the vicinity of the source. L = none present in the WHPA or HAC. M (for community and non-transient groundwater sources) = one or more in the WHPA but not within 1,000 ft of the well. M (for surface sources) = one or more in the HAC but not within 300 ft of the source water. There is no M ranking for transient systems. H (for transient sources) = one or more in the WHPA. H (for community and non-transient groundwater sources) = one or more in the WHPA within 1,000 ft of the well. H (for surface sources) = one or more in the HAC within 300 ft of the source water.
Pesticides: Whether or not pesticides have been routinely applied in the vicinity of the source. This is based on the presence of land parcels owned by registered pesticide applicators. L = no application areas in WHPA or HAC. M (for community and non-transient sources) = application site(s) in WHPA or HAC but not within 500 ft of the well or within 300 ft of the intake. There is no M ranking for transient systems. H = application site(s) within 500 ft of the well or within 300 ft of the intake. Septics: The presence or density of septic systems and sewer lines in the vicinity of the source. L (for community and non-transient groundwater sources) = no septic systems or sewer lines located within 500 ft of the well, and fewer than 30 septic systems in the remainder of the WHPA. L (for surface sources) = no septic systems within 500 ft of surface water. L (for transient sources) = no septic systems or sewer lines within 75 ft of the well. M (for community and non-transient groundwater sources) = fewer than 10 septic systems and no sewer line located within 500 ft of well, and fewer than 30 septic systems in remainder of the WHPA. M (for surface sources) = low density of septic systems (lots averaging 2 acres or more) within 500 ft of surface water in the HAC. There is no M ranking for transient systems. H (for community and non-transient groundwater sources) = 10 or more septic systems or any sewer line within 500 ft of the well and/or high density of septic systems (more than 30) in the WHPA. H (for surface sources) = densely developed shoreline (lots averaging less than 2 acres) within 500 ft of surface water in the HAC. H (for transient sources) = one or more septic systems or sewer lines within 75 ft of the well. Urban Land Cover: The percentage of urban land cover in the vicinity of the source, based primarily on satellite images. This criterion does not apply to sources serving transient systems. L = less than 10% of the WHPA or HAC is urban, and less than 10% of the WHPA within 1,000 ft of the well is urban. M (for community and non-transient groundwater sources) = less than 10% of WHPA is urban but 10% or more of the WHPA within 1,000 ft of the well is urban. M (for surface sources) = between 10% and 20% of HAC is urban. H (for community and non-transient groundwater sources) = 10% or more of WHPA is urban. H (for surface sources) = 20% or more of HAC is urban. Ag Land Cover: The percentage of agricultural land cover in the vicinity of the source (in the WHPA or within 300 ft of surface water in the HAC), based primarily on satellite images. This criterion does not apply to sources serving transient systems. L = no ag land. M = less than 10% ag land. H = 10% or more ag land. Animals: The presence of concentrations of 10 or more animal units in the vicinity of the source. L = none in the WHPA or (for a surface source) within 300 ft of surface water in the watershed. M (for community and non-transient groundwater sources) = one or more such farms in the WHPA but not within 1,000 ft of the well. M (for a surface source) = none within 300 ft of surface water in the HAC, but one or more within 300 ft of surface water in the watershed. There is no M ranking for transient systems. H = one or more in the WHPA within 1,000 ft of the well or (for a surface source) within 300 ft of surface water in the HAC.
Tuesday, August 08, 2006 Page 3 of 4Last update:

Lagoons: The presence of wastewater treatment lagoons or spray irrigation sites in the vicinity of the source. L = none in the WHPA or (for a surface source) in the entire watershed. M (for community and non-transient groundwater sources) = one or more in the WHPA but not within 1,000 ft of the well. M (for a surface source) = none within 300 ft of surface water in the HAC, but one or more in the watershed. There is no M ranking for transient systems. H = one or more in the WHPA within 1,000 ft of the well or (for a surface source) within 300 ft of surface water in the HAC. Dry Discharge: The presence of dry-weather stormwater discharge sites in the vicinity of the source. Only a handful of surface sources were evaluated for such discharges; no discharges were found. Sanitary Radius: The presence of development not associated with the well within the sanitary radius (within 75 to 400 ft of the well). Applies only to groundwater sources serving community and non-transient systems. Of particular concern are sewer lines, septic systems, or storage of regulated substances in this area. L = no inappropriate land uses or practices. No medium ranking. H = inappropriate land uses or practices were discovered during the most recent sanitary survey, and have not been corrected. Trophic status: The projected trophic (nutrient) status of the source as predicted by a computer model using a future land development scenario for the watershed. This criterion applies only to 24 lakes, ponds, and reservoirs included in the phosphorus loading study. L = oligotrophic (relatively good clarity and water quality with low algae population). M = mesotrophic (intermediate clarity, quality, and algae population). H = eutrophic
Tuesday, August 08, 2006 Page 4 of 4Last update:

Appendix D

M ay 2 0 0 6 1 7
Many states and leading experts continue to stress the importance of containing and managing hazardous materials as a necessary strategy to
maintain water quality. Managing hazardous materials to avoid releases to New Hampshire’s water continues to be an important goal to ensure high-quality water resources. Releases of hazardous materials, such as gas, oil or solvents, often occur when stormwater washes them from commer-cial or industrial activities and into surrounding water resources. Treating stormwater containing more contami-nants has a cost, and even as stormwater technology and designs improve, the additional cost and complexity of those systems underscores the need to have in place simple controls and management systems for potential ground or surface water contaminants.
The New Hampshire Department of Environmental Ser-vices’ (DES) approach to protecting groundwater is a hierarchical approach that includes land conservation for the most sensitive resource areas, prohibiting a few “high-risk” land use restrictions and then applying proper management of hazardous substances.
Hazardous substances can be properly used in a manner that minimizes the risk of a spill or other release to groundwater or nearby surface water. Accordingly, the focus of ground-water protection programs should be on management of existing activities as well as effective performance standards for those new developments that utilize regulated substances. The need for local management to ensure proper use is ap-parent as many commercial and industrial areas “build out” in New Hampshire. Many of these industrial and commer-cial areas are located over the most productive stratified drift aquifers.
Better Management Through Best Management Practices (BMPs) As directed by the New Hampshire legislature under the Groundwater Protection Act (RSA 485-C) the DES has es-tablished “best management practices” (BMPs) that must be employed by potential contamination sources (PCSs, de-fined under RSA 485-C) throughout the state. However, the reality is that local entities (municipalities and public water suppliers) are indispensable partners with DES in ensuring compliance with the BMP requirements. DES’s Best Management Practices rule, (Env-Ws 421) applies to a defined set of “regulated substances” that pose a higher risk to groundwater quality. The BMPs are basic practices, which include the use of appropriate containers, labeling on containers, impervious floor surfaces and outdoor storage. For example, the BMP rule establishes that containers with regulated substances stored outside must be covered and placed upon impervious surfaces.
The BMP rule applies to any non-residential activity that uses more than household quantities (more than five gallons) of reg-ulated substances, with few exceptions. Determining whether an activity or operation is following the state BMPs is not diffi-cult or time consuming. Many water suppliers and local health officers visit these facilities to ensure BMPs are being used.
DES inspects underground storage tanks (USTs), above ground storage tanks (ASTs), hazardous waste generators, and solid waste facilities (to name several) to ensure that similar BMPs are employed at these facilities. However, many activities that use regulated substances do not require a state permit or registration, and could benefit from local review and oversight.
Protecting Groundwater
Resources By Pierce Rigrod

18 N e w H a M p s H i r e t o w N a N D c i t y
For example, recent DES experiences with some auto salvage yards sug-gest that there is still more work to be done to both raise awareness and implement basic controls on storage, handling and use of gasoline, used oil, antifreeze and other potential contaminants that can be released into the surface or groundwater.
What Is a Local Ground- water Management Program? Local groundwater protection can take a variety of forms, from having the Girl Scouts stenciling storm drains that discharge urban runoff or the Public Works instituting a low-salt policy near a community well. Usually, a groundwater management program is an organized approach to protecting an important groundwater resource area by providing regular public educa-tion activities and conducting on-site inspections to ensure compliance with the BMPs in the Env-Ws 421 rule or similar protections. Public education is targeted to residents and PCSs, and is typically distributed on an annual or a triennial basis. Towns or water sup-pliers are using creative strategies that maximize their educational messages,
often publishing through multiple media outlets (that is, Web site, cable access TV, tax bills or town reports). Stratham, for example, puts informa-tion on managing potential contami-nants within their town report, which is mailed to all residents of the town.
Where PCSs exist, a groundwater pro-tection management program must address how BMPs are used within the context of specific industrial or commer-cial activities. This is done through BMP inspections, also referred to as BMP “surveys” of existing PCS activities and they are typically completed once every three years. Most local BMP inspection programs are conducted on a volun-
tary basis, meaning the PCS owners are not required to participate because the local entity has no regulatory authority. Where local entities acquire regulatory authority, either through local health regulations or through the groundwa-ter reclassification process (see below), compliance with BMPs can be locally enforced. In New Hampshire approxi-mately 73 public water systems conduct voluntary BMP surveys, mostly without enforcement authority.
A local groundwater management pro-gram may involve enforcement of state BMPs under RSA 485-C or RSA 147. A municipal health officer, under RSA 147, has the authority to enter onto private property to inspect and order re-moval of a nuisance that is “injurious” to the public’s health. RSA 485-C:16 also gives concurrent authority (with DES) to health agents to issue cease and desist orders, when deemed necessary to protect groundwater. For example, en-forcement to remove an open drum of oil or gas that is leaking and presents a public health nuisance can be conducted under the authority provided under RSA 147:4. But in circumstances where BMP rules are not being followed and there is no immediate nuisance or public health injury, a health officer must rely upon a local health ordinance or state ground-water reclassification for the authority to enforce state BMPs.
Above: Poor control of regulated fluids at an auto salvage yard, 2005. Photo courtesy New Hampshire Department of Environmental Services.
Handling Place drip pans under spigots, valves and pumps
Have spill control and containment equipment readily available
Perform transfers (for example, filling containers) over impervious surface
•
•
•
Examples of BMPs
Storage
Store regulated substances on an impervious surface Cover regulated containers in outside storage areas
Keep regulated containers at least 50 feet from storm drains, if no secondary containment
•
•
•
GROUNDWATER from page 17

M ay 2 0 0 6 1 9
A Local Health Ordinance as a Groundwater Management Program A town may adopt a local health or-dinance to require local compliance with Env-421 BMPs, and establish a health agent’s authority to enforce BMPs. Such a health ordinance should also spell out the local process regard-ing, PCS notification and BMP survey procedures, and local certification of compliance. Adopting a local health ordinance will be useful to ensure a BMP program is properly adminis-tered and consistent with other local ordinances. Several steps should be taken in advance when planning the adoption of a health ordinance, in-cluding: 1) delineating the ground-water resource area, (that is, wellhead protection areas or aquifer); 2) identi-fying PCSs within that area that will be surveyed; and 3) establishing a survey protocol for use by the health agent. By adopting a local health or-dinance, the municipality may specifi-cally define the set of activities or land use activities that it determines to be PCSs, beyond what is considered a PCS as listed under RSA 485C. DES provides a model health ordinance for communities interested in adopting a local health ordinance, however, con-sult with town counsel and DES in advance of adoption. (DES’s Model Health Ordinance can be found at www.des.nh.gov/dwspp/hodoc4.pdf.)
State Reclassification as a Groundwater Management Program The legislature also allows a local entity (town or water supplier) to make ap-plication to DES to “reclassify” a spe-cific area around a public water supply well, an aquifer or other area that con-tains locally important groundwater resources as determined by the local entity. Reclassification of wellhead protection areas (WHPAs) or other
areas of high-value groundwater (that is, highly productive aquifers), also in-volves instituting a local PCS educa-tion and survey program as a means to greater adherence to BMPs.
Reclassification through RSA 485-C:15 also gives the authority to local health agents to enter onto private property to enforce provisions under the statute, including the state BMPs. DES’s Model Health Ordinance pro-vides an approach with draft language for adopting a local health ordinance in conjunction with or independently from state groundwater reclassification.
New Development and Groundwater Protection Zoning Ordinances The focus of a groundwater protection program should not only be on what currently is “on the ground” but also what activities are coming in the future. At least sixty-two municipalities have land use restrictions to protect ground-water resources. The state Model Groundwater Protection Ordinance combines a few land use restrictions with required performance standards that are based upon the requirements of Env-Ws 421 BMPs. Groundwater protection zoning or rules can establish performance standards that improve stormwater quality and require spill control plans that reduce the release of regulated substances to groundwater. Beyond zoning, site plan review rules can be drafted to improve the control of regulated substances and limit the commingling of contaminated surfac-es with clean stormwater through the
Reclassification of wellhead protection areas (referred to as GAA in RSA 485-C) also prohibits the development of new solid waste landfill or hazardous waste disposal facility, outdoor storage of deicing chemicals (including salt), auto salvage yards, snow dumps or wastewater or septage lagoons within the wellhead protection area of a public water supply.
design and management of loading pads, fuel transfer areas, outdoor stor-age or waste areas. Good site design can offset poor management by having structural protection built around or within the operations or activities that take place upon the site.
RSA 674 permits local governments to adopt innovative land use controls that include environmental characteristics zoning (that is, wetlands, groundwa-ter, etc.) and performance standards. For example, if there is a violation of a local performance standard that protects groundwater (for example, improper storage of wastes) local gov-ernments may issue cease and desist orders (RSA 676:17-a) and local land use citations (RSA 676:17-b), or may pursue civil penalties and injunctive relief in superior or district court (RSA 676:15, 17). Again, when considering the adoption of a groundwater protec-tion ordinance or enforcement, con-sult your local town counsel.
DES can provide BMP survey training, sample forms and letters, model zoning language, maps and information as well as references to existing local ground-water protection programs.
Pierce Rigrod is a Principal Planner with DES’s Source Water Protection Pro-gram and provides technical assistance to municipal officials and water suppliers on protecting drinking water supplies in New Hampshire. He can be contacted by e-mail at [email protected] or by phone at 603.271.0688.

Mason Master Plan, 2007 Update
Population and Housing 93
POPULATION AND HOUSING
INTRODUCTION
The analysis of population and housing trends is a crucial component of a Master Plan. The state statute that addresses the purpose and description of a Master Plan (RSA 674:2) calls for a " housing section which assesses local housing conditions and projects future housing needs of residents of all levels of income and ages in the municipality and the region as identified in the regional housing needs assessment performed by the regional planning commission pursuant to RSA 36:47, II, and which integrates the availability of human services with other planning undertaken by the community.”
Although a demographic analysis is not required by the enabling legislation, it is advisable to plan for the impacts of population changes as they relate to housing availability. This is important because demographic projections make it possible to estimate the level of Town services necessary to serve Mason’s residents in the years to come and to plan for growth to occur in an orderly manner.
An analysis of the population and housing trends also enables the Mason Planning Board to determine whether amendments to the zoning ordinance might be required in order to address any housing inequities. Following two important NH Supreme Court cases, the concept of equal opportunity housing is now formally established in the master plan process. In short, every town must, through its Master Plan, address the current and future housing needs of its residents and, in doing so, must consider the housing situation in its neighboring towns as well. The majority of the historical and current statistical data to support this analysis comes from the US Census Bureau, whereas future projections were obtained from the New Hampshire Office of Energy and Planning. Local data is provided through the Town of Mason’s Building Permit records. The period of time under consideration in this report starts in 1970 and proceeds through 2000 for past trends and from 2000 to 2030 for estimates and future projections. It must be noted that the way in which Census information is collected and reported results in some errors and inconsistencies in the numbers; nevertheless, this is the best and most comprehensive information available for this type of report.
POPULATION ANALYSIS
As illustrated in Figure 7.1, Mason’s population peaked in 1850 at 1,626 and since has faced both steep decreases in population due to the more densely populated area of incorporating as Greenville as a separate municipality in 1872 and the departure of the railroad. The population of Mason in 1880 was 650, showing little change until the latter decades of the 20th century. The ten years from 1980 to 1990 saw a 53% increase in population, from 792 to 1,212 residents. The ten years from 1990 to 2000, saw population declining by 5.4% (65 people) while NH OEP estimates a population increase of 157 people from 2000-2005. In terms of population density, Mason grew from a density of 21.6 persons per square mile in 1970 to 47.8 persons per square mile in 2000. Based on population estimates, population density grew to 54.5 persons per square mile in 2005. Projections from New Hampshire’s Office of Energy and Planning (OEP) estimate that between the years 2010 and 2030, Mason’s population will increase by approximately 15% percent (210 people) to 1,570 people in 2030.

Mason Master Plan, 2007 Update
Population and Housing 94
Figure 7.1: Population Growth, 1790-2005
0
200
400
600
800
1,000
1,200
1,400
1,600
1,800
1790
1800
1810
1820
1830
1840
1850
1860
1870
1880
1890
1900
1910
1920
1930
1940
1950
1960
1970
1980
1990
2000
2005
Popu
latio
n
Source: US Census and NH OEP
Figure 7.1 above shows a large population drop between 1870 and 1880. The reason for this decrease in population was the separation of Greenville from Mason in 1876.
SUB-REGIONAL POPULATION CHARACTERISTICS
Table 7.1 and Figure 7.2 compare population changes in Mason to surrounding towns and the State.
Table 7.1: Comparison of Population, 1970 – 2005
1970 1980 1990 2000 2005 Population
Change Percent Change
New Hampshire 737,681 920,610 1,109,252 1,235,786 1,315,000 577,319 78.26% Mason 518 792 1,212 1,147 1,307 789 152.32%Greenville 1,587 1,988 2,231 2,224 2,268 681 42.91% New Ipswich 1,803 2,433 4,014 4,289 4,945 3,142 174.27%Wilton 2,276 2,669 3,129 3,743 3,995 1,719 75.53% Brookline 1,167 1,766 2,411 4,181 4,755 3,588 307.46%Milford 6,622 8,685 11,828 13,535 14,860 8,238 124.40%Townsend, MA 4,281 7,201 8,496 9,198 9,326 5,045 117.85%
Source: US Census and NH OEP

Mason Master Plan, 2007 Update
Population and Housing 95
Figure 7.2: Comparison of Population, 1970 – 2005
0
2,000
4,000
6,000
8,000
10,000
12,000
14,000
16,000
Mason
Greenv
ille
New Ip
swich
Wilton
Brookli
ne
Milford
Towns
end, M
A
Popu
latio
n1970 1980 1990 2000 2005
Source: U.S. Census
AGE DISTRIBUTION
Table 7.2 and Figure 7.3 show the numbers and proportions for three age groupings in the Town of Mason from 1970-2000. The proportion of persons 65 years of age and older may experience a rise as people are tending to live longer than in previous generations. The proportion of children (age 0-17) declined from 36.6% (1970) to 27.5% (2000). This is due in part to the natural evolution of a family, children growing up and leaving, smaller family units and the lack of affordable housing for younger families. The number of Mason’s working residents between 18 and 64 years of age increased from 970 in 1970 to 1,223 in 2000 – an increase of 26.1%.
Table 7.2: Age Distribution, 1970-2000 1970 1980 1990 2000 1970-2000 Age 0-17 years 194 248 330 279 % of Population 37.5% 31.3% 27.2% 24.3% % Change 27.8% 33.1% -15.5% 43.8% Age 18-64 years 269 486 792 771 % of Population 51.9% 61.4% 65.3% 67.2% % Change 80.7% 63.0% -2.7% 186.6% Age 65+ 55 58 90 97 % of Population 10.6% 7.3% 7.4% 8.5% %Change 5.5% 55.2% 7.8% 76.4%
Source: US Census

Mason Master Plan, 2007 Update
Population and Housing 96
Figure 7.3: Mason Age Distribution
0100200300400500600700800900
1970 1980 1990 2000
Num
ber
of P
eopl
e 0-1718-6465+
Source: US Census
EDUCATION
Table 7.3 shows the highest level of education attained by Mason residents aged 25 and older. The number in parenthesis is the total number of residents considered. From 1990-2000 the percentage of Mason residents whose highest level of education was a high school diploma or less decreased while the percentage of residents whose highest education level was some college or a Bachelor’s degree increased. This reflects a more educated population in 2000 than in 1990. Similar trends were seen in Hillsborough County and in the State.
Table 7.3: Highest Level of Education- Percentage of Residents Aged 25 and Older 1990 2000 1990 2000 1990 2000
Mason (781)
Mason (810)
Hillsborough (215,914)
Hillsborough (251,908)
NH (713,894)
NH (823,987)
Less than High School 14.6% 10.4% 17.8% 13.0% 17.8% 11.9% High School Diploma 26.2% 23.1% 28.6% 27.5% 31.7% 31.0% Some college (no degree) 20.0% 25.7% 18.9% 20.3% 18.0% 20.7% Associate degree 10.9% 9.9% 8.4% 9.1% 8.1% 9.7% Bachelor's degree 18.3% 21.5% 18.1% 20.0% 16.4% 18.0% Graduate Degree 10.0% 9.4% 8.3% 10.0% 7.9% 8.7% Percent high school graduate or higher 85.4% 89.5% 82.2% 87.0% 82.2% 88.2%
Percent bachelor's degree or higher 28.3% 30.9% 26.4% 30.1% 24.4% 26.8%
Source: US Census
HOUSEHOLD INCOME
The Town of Mason’s 2000 median household income of $60,433 was higher than that of the state and Hillsborough County. According to the 2000 Census, 82.4% of households (437 total households) in Mason earned $35,000 or more in annual household income. The percentage of persons below the poverty level in Mason is lower than both the state and Hillsborough County average.

Mason Master Plan, 2007 Update
Population and Housing 97
Table 7.4: Household Income, 2000
Mason Hillsborough County NH
Median Family Income 61,908 62,363 57,575 Per Capita Income 28,503 25,198 23,844 Median Household Income 60,433 53,384 49,467 % Persons Below Poverty Level 3.4% 6.3% 6.5%
Source: US Census
Table 7.5: Year;ly Household Income, 2000
Mason Hillsborough County NH
Less than $10,000 3.9% 5.6% 6.1% $10,000 to $14,999 0.7% 4.3% 4.8% $15,000 to $24,999 4.6% 9.7% 10.8% $25,000 to $34,999 8.5% 10.3% 11.6% $35,000 to $49,999 18.5% 16.0% 17.2% $50,000 to $74,999 30.9% 23.6% 23.1% $75,000 to $99,999 14.9% 13.9% 12.6% $100,000 to $149,999 10.8% 11.0% 9.1% $150,000 to $199,999 5.0% 3.1% 2.6% $200,000 or more 2.3% 2.5% 2.2%
Source: US Census
HOUSING ANALYSIS
HOUSING SUPPLY
Between the years of 1970 and 2000 Mason experienced a 141% increase in its total housing stock from 189 to 455 units. This total is comprised of 435 detached single family units, 3 attached single family units, and 17 mobile homes. From 1970 to 1980 and 1980 to 1990 Mason saw housing units increase by 51.3% and 53.4%, respectively. However, from 1990 to 2000 growth was less than 1.0%. While population declined from 1990 to 2000, 65 housing units were built. There was a greater increase, from 1970-2000, of households in Mason, which means that more housing units were occupied over time.
Table 7.6: Housing Supply, 1970-2000
1970 1980 1990 2000 % Change 1970-2000
Occupied Housing Units (Households) 158 268 422 433 174%
Total Housing Units 189 286 451 455 141% Percent Change -- 51.3% 53.4% 0.9%
Source: US Census

Mason Master Plan, 2007 Update
Population and Housing 98
Between 2000 and 2005, the Town of Mason issued 84 new single-family building permits. If one adds this to the number of housing units in 2000, it can be estimated that there were approximately 539 housing units in Mason in 2005. See Map 5.1
Table 7.7: Issued Building Permits (All Residential), 2000-2005
2000 2001 2002 2003 2004 2005 Total 10 9 15 18 18 14 84
Source: NH Office of Energy and Planning
HOUSING AGE
35% (169) of Mason’s homes were built prior to 1960. These houses in addition to the houses built between 1970 and 1990 (44% of total housing units or 199 units), make up the majority of housing units in Mason (80%).
Figure 7.4: Housing Age
0
20
40
60
80
100
120
140
Built 1939or earlier
Built 1940to 1949
Built 1950to 1959
Built 1960to 1969
Built 1970to 1979
Built 1980to 1989
Built 1990to 2000
Built 1995to 1998
Built 1999to 2000
Num
ber
of S
truc
ture
s
Source: US Census
Mason had 433 occupied housing units and a vacancy rate of 4.8% in 2000, with approximately 6 of those units being for seasonal or recreational use. The ratio of owner occupied homes to renter occupied units in 2000 was 19.6 (the largest ratio in the region). According to the Census Bureau, of the 433 total occupied housing units in 2000, 411 are owner occupied while renter occupied units comprise 22 of the total. In 2000, the average household size was 2.65 people, declining from 2.97 in 1970 (1980: 2.68, 1990: 2.6). Mason has had a relatively consistent level of birth rates since 1990, as well as a consistent death rate.
HOUSING AFFORDABILITY
Affordable housing is gauged by a combination of household income and household size. The federal definition for “affordable housing” specifies that a cost of no more than 30% of a households’ monthly income is devoted to housing costs, which applies to both owners and renters. There are currently no units defined as affordable housing units in Mason through subsidy or some other means of cost control.

Mason Master Plan, 2007 Update
Population and Housing 99
The table below illustrates the costs that households pay for housing as a percentage of their monthly income. Of the 269 specified owner occupied housing units approximately 24% of households are faced with monthly housing costs at 30% and upwards. For 13 renter specified units, the percentage is similarly around 24%. In sum, there are approximately 68 households that face housing costs that are not affordable.
Table 7.8: Percent of Income Spent on Housing
Selected Monthly Owner Costs as a Percentage of Household Income, 1999
Number of Households Percent of Total Less Than 20% 103 38.3% 20.0 to 24.9 Percent 58 21.6% 25.0 to 29.9 Percent 41 15.2% 30.0 to 34.9 Percent 25 9.3% 35.0 Percent or More 40 14.9% Not Computed 2 0.7%
Total 269
Gross Rent as a Percentage of Household Income, 1999 Number of Households Percent of Total Less Than 15% 4 30.8% 15.0 to 19.9 Percent 4 30.8% 20.0 to 24.9 Percent 0 0% 25.0 to 29.9 Percent 0 0% 30.0 to 34.9 Percent 0 0% 35.0 Percent or More 3 23.1% Not Computed 2 15.4%
Total 13 Source: US Census
Figure 7.5: Owners Percent of Income Spent on Housing 1999
0%
5%
10%
15%
20%
25%
30%
35%
40%
Less Than20%
20 to24.9%
25 to29.9%
30 to34.9%
35% orMore
NotComputed

Mason Master Plan, 2007 Update
Population and Housing 100
Figure 7.6: Renters Percent of Income Spent on Housing- 1999
0%
5%
10%
15%
20%
25%
30%
35%
40%
Less Than15%
15 to19.9%
20 to24.9%
25 to29.9%
30 to34.9%
35% orMore
NotComputed
Source: US Census
Based on the assumption that no more than 30% of a household’s income should be spent on housing, the possibilities for home ownership in the Town of Mason are examined in Table 7.9. The projected affordable home is calculated for Mason households at the median income level, at 80% and at 50% of the median income. The federal government considers 80% and 50% to be moderate and low incomes, respectively. The estimated property tax used in the calculation is the 2000 tax rate of $31.90 per $1,000 valuation.
The three scenarios in Table 7.9 show that residents earning the median household income in 2000 could spend about $175,634 on home, whereas those earning 80% or 50% of the median household income could only spend about $138,346 or $88,095 for a home. The median home value in 2000 was $136,700, therefore residents earning both the median household income and 80% of median would be able to afford the median home value.
Table 7.9: Homeowner Affordability, 2000 2000 Median
Household Income
80% 50%
$60,433 $48,346 $30,216
30% OF MONTHLY INCOME $1,510 $1,210 $755
MONTHLY PROPERTY TAX (2000) $257 $205 $128
AVAILABLE FOR MORTGAGE (includes home insurance and mortgage insurance)
$1,230 $984 $615
ESTIMATED MORTGAGE AFFORDABLE AT 6.5% FOR 30YRS $172,934 $138,346 $86,465
CLOSING COSTS $2,700 $2,280 $1,630
PROJECTED AFFORDABLE HOME $175,634 $140,626 $88,095

Mason Master Plan, 2007 Update
Population and Housing 101
Based on Home Affordability Calculator Available at http://www.lifeinsuranceselling.com/calculators, assumes no other monthly debts. The median home sales price in Mason in 2006 was $262,50015. Median household income has not increased at the rate that home prices have over the past 5 years, making Mason less affordable to those earning less than the median income.
SUB-REGIONAL HOUSING COMPARISONS
Housing supply data for 1990 and 2005 for Mason and surrounding towns show that the changes in housing stock for these towns range from an increase in Mason of 18.63% to an increase of 3.7% in Greenville. All other towns experienced higher levels of growth or less decline in the housing supply than Mason during this time period.
Table 7.10: Sub-Regional Housing Comparisons 1990 2000 2005 Percent Change
Mason 451 455 535 18.63% Greenville 918 918 952 3.70% New Ipswich 1,339 1,449 1,740 29.95% Wilton 1,285 1,451 1,595 24.12% Brookline 881 1,384 1,641 86.27% Milford 4,796 5,316 6,014 25.40% Townsend. MA 2,894 3,182 n/a 10.0% (1990-
2000) Source: US Census and NH OEP
HOUSING OPPORTUNITY
The zoning provisions for Mason determine the availability of housing opportunities in the Town, specifically which housing types are permitted and what the minimum lot requirements for those dwelling units are. Mason has three zoning districts that allow only single-family residential development by right. The third district, not present in the chart below, is the Historic District which allows the same uses by right as allowed in the Village Residential Zoning District.
Table 7.11: Zoning Regulations Permitted Uses (Housing) Village Residential (VR)
One Family Dwellings
General Residential (GR)
One Family Dwellings, Mobile Homes when placed on permanent foundation
Lot and Yard Requirements
VR Frontage – 200 ft on a Class V Highway or better, Minimum Lot Area – 88,000 sq. ft. per dwelling
GR Frontage – 250 ft on a Class V Highway or better, Minimum Lot Area – 132,000 sq. ft. per dwelling
Source: Town of Mason Zoning Ordinance, 2005
15 www.melissadata.com

Mason Master Plan, 2007 Update
Population and Housing 102
FUTURE HOUSING NEED
Population projections can be used to estimate future housing need, based on a person-per-unit estimate. Among the towns that make up Mason’s sub-region, Mason’s projected 2005-2030 growth rate of 19.85% has moderate projected growth. According to the projections, the Town of Brookline will grow the most (29%) and the Town of Greenville will grow the least (16%).
Table 7.12: Population Projections for Mason & Sub-Region
2005-2030
2005 2010 2015 2020 2025 2030 2005 - 2030
Mason 1,310 1,360 1,420 1,470 1,520 1,570 19.85% Greenville 2,270 2,350 2,420 2,490 2,560 2630 15.86% New Ipswich 4,950 5,140 5,330 5,500 5,660 5820 17.58% Wilton 4,000 4,170 4,350 4,520 4,680 4840 21.00% Brookline 4,760 5,010 5,330 5,610 5,890 6170 29.62% Milford 14,860 15,500 16,220 16,850 17,480 18110 21.87% Townsend, MA 9,326 9,507 na 10,123 na 8.55%
Source: US Census; NH Office of Energy and Planning Using the projected population data, it is possible to estimate the needed housing supply by dividing the projected population by the average household population—in this case, 2.65 persons per household.16
Table 7.13: Projected Housing Units Need Additional Housing Units
Population Increase Population Rate Increase
Number of Persons Person/Unit Total Per Year
2005-2030 Projection Rate 19.85% 260 2.65 98 4 1980-2000 Actual Rate 66% 904 2.65 341 14
Source: US Census; NH OEP According to the projected data, if Mason were to experience the same level of population growth between 2005 and the year 2030 as it did between 1980 and 2000, the Town would need 341 housing units. If, however, the OEP projections should prove accurate, the Town would need about 98 additional units, approximately 4 new units per year. Between 1980 and 2000, the population of Mason increase by 66% and the housing stock increased by about 83.3%. The Census data also indicates that Mason’s housing stock in 2000 was in good condition. Almost all housing units possess a full kitchen and plumbing facilities; furthermore, the occurrence of overcrowding of dwelling units is very low.
16 Future housing needs are estimated by dividing the population by the number of housing units to reach a person-per-unit figure. According to the 2000 U.S. Census data the person-per-unit ratio for the Town of Mason was 2.65. In order to calculate future housing need, this report assumes that the 2000 average of 2.65 will also apply to the 2005-2030 time period.

Mason Master Plan, 2007 Update
Population and Housing 103
CONCLUSION
The population changes for the Town of Mason from 1970 to 2005 show a total increase of 152.32% or 789 persons. From 1970-2000 The working age group, ages 18 to 64, increased dramatically by 186.6%. However, the number of school age persons and younger, ages 17 and below, only increased by 43.8% during the same time period. In addition, the number of residents 65 and older increased by 76.4% during those three decades. The rise in the working age group may eventually lead to the senior housing projects and accessory apartments or assisted living projects as that cohort ages. Mason, along with Greenville, saw a very minute increase in population from 1990-2005 in comparison to other neighboring towns. Approximately 89.5% of Mason residents 25 years old and over possess a bachelor’s degree or higher. The Town of Mason’s median household income of $60,433 is higher than that of Hillsborough County and of the state. Between 1970 and 2000, Mason experienced a 141% increase in its total housing stock from 189 to 455 units. All neighboring towns, other than Greenville, experienced higher levels of growth in the housing supply than Mason from 1990 to 2000. In 2000, the ratio of owner occupied homes to renter occupied units in Mason was 19.6 and the average household ratio was 2.65 people. Similar to the national and regional trend, over time this ratio might decrease. As a result, Mason’s vacancy rate will decline and the need for more housing units may arise. If Mason were to experience the same level of population growth between now and the year 2025 as it did between 1980 and 2000, the Town would be in need 341 additional housing units. If, however, the Office of Energy and Planning projections should prove accurate, the Town would need about 98 additional units, approximately 4 new units per year. In 2000, according to U.S. Census data, 23.1% of owner-occupied households paid 30% or more of household income on housing. The median home value in Mason was $136,700. Residents earning the median household income can spend about $136,700 on an affordable home, whereas those earning 80% or 50% of the median household income can only spend about $96,000 or $60,000 for their affordable homes; home prices far below the median home selling price. The cost of housing in conjunction with relatively high property taxes in Mason results in diminished availability of affordable housing. The minimal zoning districts in Mason do not allow for a variety of housing types, consideration should be given to widening housing opportunity; for example, through making accessory apartments a permitted use, now only accepted by special exception, in all districts. In addition, multi-family housing is prohibited in every district, further diminishing affordable housing opportunities. Zoning amendments that address these housing restrictions can help in mitigating the affordability problem.

Mason Master Plan, 2007 Update
Transportation 104
TRAFFIC AND TRANSPORTATION
INTRODUCTION
The state statute that deals with Master Plans, RSA 674:2, VI, calls for a transportation section that shows “. . . the location and types of facilities for all modes of transportation required for the efficient movement of people and goods into, about, and through the community.” Good transportation planning is important because of its capital-intensive nature: streets and highways typically represent the most significant public investment in a town’s infrastructure. Outside of school taxes, the highway budget is usually the largest percentage of a town’s operating costs. The primary goal of this section is to identify current issues and/or needs crucial to orderly development and the safe and efficient movement of traffic. A corollary purpose is to assist the Town of Mason in fully participating in all levels of transportation planning. Transportation infrastructure is heavily dependent on public funds, and the NH Department of Transportation (DOT) sets the priorities for spending through the development of a statewide Transportation Plan and Transportation Improvement Program. Both of these are required under federal legislation that prescribes the disbursements to states; in order for New Hampshire to qualify for its full allocation of funds, the NH DOT must comply with federal planning requirements. To accomplish this task, the NH DOT requires each of the nine regional planning commissions in the state to develop a regional transportation plan that describes existing state road conditions within its region, identifies problems and concerns, declares goals and objectives for the regional network, and makes specific recommendations for improvements or new construction. Any local concerns relative to state-maintained roads must be addressed through the Regional Transportation Plan in order to be included in the State Plan. This section, therefore, takes the regional issues into account in the process of developing local goals for a safe and efficient transportation network.
ROAD CLASSIFICATIONS
STATE CLASSIFICATIONS
Public roads are defined by DOT by the type of service they provide and/or by the funding that is available to build, maintain, and repair them. New Hampshire statute RSA 229:5 specifies the following roads within the state system: • Class I: Trunk Line Highways: These belong to the primary state highway system, and the state
assumes full control and responsibility for construction and maintenance. • Class II: State Aid Highways: These belong to the secondary state highway system. The DOT assumes
full control and responsibility for construction and maintenance. • Class III: Recreational Roads: These consist of all roads leading to and within state reservations
designated by the NH Legislature. The DOT assumes full control and responsibility for construction and maintenance.
• Class III-a: Boating Access Roads: These consist of roads that lead to public waters from any existing highway. The DOT assumes full control and responsibility for these roads.
• Class IV: Town and City Streets: These consist of all sections of road that fall within urban compact areas of towns and cities with populations greater than 7,500. The municipality assumes full control and responsibility for construction and maintenance.

Mason Master Plan, 2007 Update
Transportation 105
• Class V: Rural Highways: These consist of all other maintained roads that are not in the state system. They are town-owned and maintained.
• Class VI: Unmaintained Highways: These are all other existing public roads that are not maintained by the town and have not been for at least five years. The road may be closed subject to gates and bars, but it continues as a public roadway.17
Of these seven state road classifications, Mason roads fall into three, as follows: Route 31, Route 123, Route 124, are Class II state highways; all other roads in town are Class V and Class VI town roads. These are illustrated on Map 8.1, and the number of miles comprised by each classification is described in Table #1 below.
Table 8.1: Road Mileage by State Classification
Road Classification Mileage Class I 0.000 Class II 7.347 Class III 0.000 Class IV 0.000 Class V 38.678 Class VI 9.958 Other (including Private)
4.672
Total Mileage: 60.655
Source: NH DOT 2006 Inventory
FUNCTIONAL CLASSIFICATION
A functional classification system identifies roads by the type of service provided and by the role of each highway within the state system, based on standards developed by the US DOT. The purpose of using such a system is to correlate the land planning and traffic planning functions of the Master Plan. Recognition of the principal function that any road is intended to serve can reduce potential conflicts between land use activities and traffic movements. For rural areas such as Mason, the following categories are identified by the US DOT (see Map 8.1):
Other Principal Arterial/Controlled Access. These consist of Interstates and some primary state routes. They are designed to move large volumes of truck and car traffic through and between population centers without disturbing local traffic and land uses. Controlled Access is a means of minimizing the number of curb cuts, thereby controlling the amount of turning movements along the roadway.
There are no Principal Arterials located in Mason or in the Southwest Region.
17 The Class VI designation is applied to roads that have been abandoned or discontinued. A vote of Town Meeting is required to formally discontinue a road rendering it no longer a public right of way. A discontinued road reverts to abutting landowners. A Class VI road can be also closed subject to gates and bars if voted at Town Meeting. The road remains a public right of way but landowners can install gates and bars that will still allow public access.
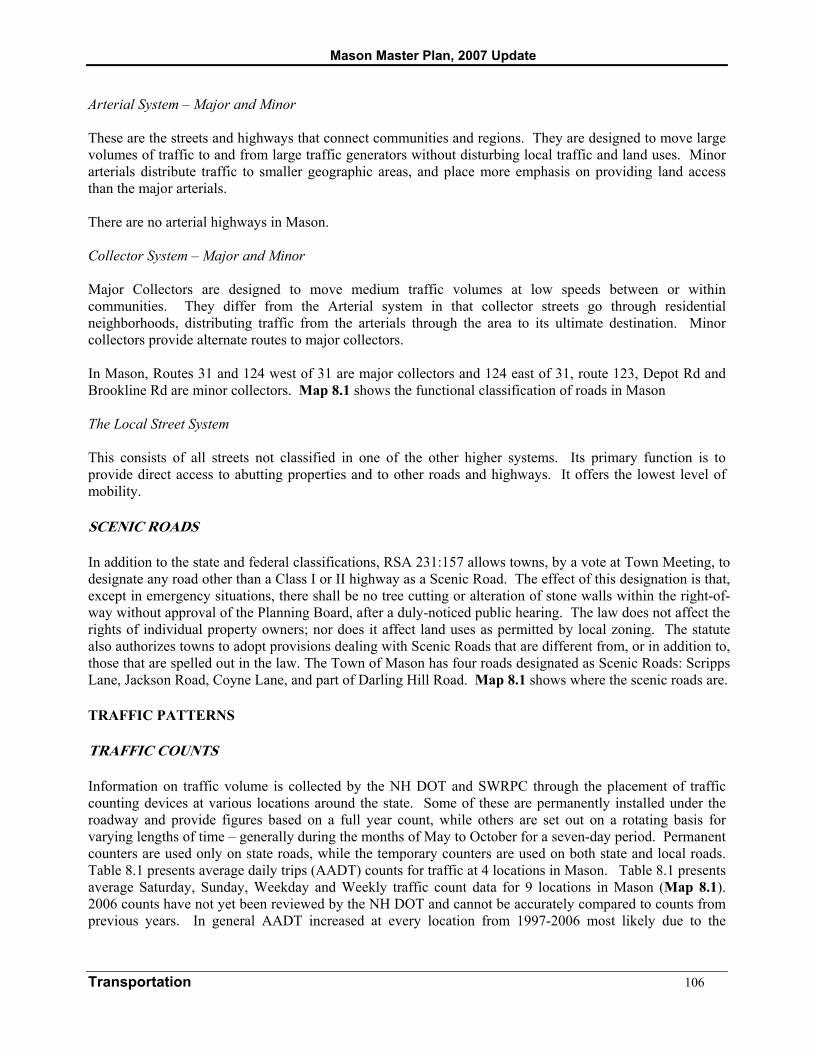
Mason Master Plan, 2007 Update
Transportation 106
Arterial System – Major and Minor These are the streets and highways that connect communities and regions. They are designed to move large volumes of traffic to and from large traffic generators without disturbing local traffic and land uses. Minor arterials distribute traffic to smaller geographic areas, and place more emphasis on providing land access than the major arterials. There are no arterial highways in Mason. Collector System – Major and Minor Major Collectors are designed to move medium traffic volumes at low speeds between or within communities. They differ from the Arterial system in that collector streets go through residential neighborhoods, distributing traffic from the arterials through the area to its ultimate destination. Minor collectors provide alternate routes to major collectors. In Mason, Routes 31 and 124 west of 31 are major collectors and 124 east of 31, route 123, Depot Rd and Brookline Rd are minor collectors. Map 8.1 shows the functional classification of roads in Mason
The Local Street System This consists of all streets not classified in one of the other higher systems. Its primary function is to provide direct access to abutting properties and to other roads and highways. It offers the lowest level of mobility.
SCENIC ROADS
In addition to the state and federal classifications, RSA 231:157 allows towns, by a vote at Town Meeting, to designate any road other than a Class I or II highway as a Scenic Road. The effect of this designation is that, except in emergency situations, there shall be no tree cutting or alteration of stone walls within the right-of-way without approval of the Planning Board, after a duly-noticed public hearing. The law does not affect the rights of individual property owners; nor does it affect land uses as permitted by local zoning. The statute also authorizes towns to adopt provisions dealing with Scenic Roads that are different from, or in addition to, those that are spelled out in the law. The Town of Mason has four roads designated as Scenic Roads: Scripps Lane, Jackson Road, Coyne Lane, and part of Darling Hill Road. Map 8.1 shows where the scenic roads are.
TRAFFIC PATTERNS
TRAFFIC COUNTS
Information on traffic volume is collected by the NH DOT and SWRPC through the placement of traffic counting devices at various locations around the state. Some of these are permanently installed under the roadway and provide figures based on a full year count, while others are set out on a rotating basis for varying lengths of time – generally during the months of May to October for a seven-day period. Permanent counters are used only on state roads, while the temporary counters are used on both state and local roads. Table 8.1 presents average daily trips (AADT) counts for traffic at 4 locations in Mason. Table 8.1 presents average Saturday, Sunday, Weekday and Weekly traffic count data for 9 locations in Mason (Map 8.1). 2006 counts have not yet been reviewed by the NH DOT and cannot be accurately compared to counts from previous years. In general AADT increased at every location from 1997-2006 most likely due to the

Mason Master Plan, 2007 Update
Transportation 107
population increases in the area, except for slight discrepancies at the NH 123 at the Mass State Line location.
Table 8.2: Averaged Annual Daily Traffic Counts, 1998-2006
Location Functional Class 1998 1999 2000 2001 2002 2003 2004
2005
2006
ADT* NH 123 at Mass State Line
Minor Rural Collector
- 480 - - 420 - - - 456
NH 31 (Fitchburg Rd) at Mass State Line
Major Rural Collector
- 2000 - 2200 - - 2600 - 2636
NH 124 at Mass State Line
Minor Rural Collector
- - 2900 - - 3600 - - 3763
NH 124 West of Churchill Rd
Major Rural Collector
2500 2900 - - 3000 - - - 3439
Source: NHDOT and SWRPC*
Table 8.3: Average Saturday, Sunday, Weekday and Weekly Traffic Counts, 2006 ID #
(See Map 8.1) Saturday Sunday Weekday Weekly
1 Brookline Rd at Brookline TL 1928 2076 1272 1515 2 NH 124 West of Churchill Rd 3349 2706 3645 3439 3 Merriam Hill Rd at Greenville TL 879 781 725 760 4 Townsend Rd at Mass State Line 389 309 382 371 5 NH 31 at Mass State Line 2852 2297 2686 2636 6 NH 124 at Mass State Line 3359 2860 4286 3763 7 Greenville Rd at Greenville TL 345 242 237 256 8 NH 123 at Mass State Line 453 400 468 456 9 Abbott Hill Rd at Wilton TL 570 486 447 474
TRAFFIC GENERATORS
Travel can be defined by a wide variety of characteristics, including the purpose of the trip, the time the trip was made, the mode that was used, and the length of the trip. A starting point in all transportation studies is the number of trips generated for a particular land use. This measure is called trip generation and is usually described in terms of person trip generation or vehicle trip generation. A trip is one way movement from origin to destination. Each trip has two trip ends. Although the term round-trip is often used to describe travel that starts and ends at home it is not a technical term and is considered to be two or more separate trips. Trip generation is always given for a specific period of time which is generally a single hour (normally a peak hour) or a full day. Trip generation may be given for a weekday and/or a weekend day. Since the vast majority of travel is conducted by automobile, most trip

Mason Master Plan, 2007 Update
Transportation 108
generation data are provided in terms of vehicles trips. Vehicle occupancy varies by the purpose of the trip. Work trips tend to have low occupancies which relates to the high percentage of commute trips which are drive-alone types. Most of Mason’s traffic is residential, since that is the primary land use in Town. There is of course some amount of truck/ commercial traffic that services the businesses, as well as travel through Mason to and from neighboring towns; Routes 123, 124, and 31, as well as Brookline Road appear to serve as the main roadways into and out of town. Table 8.4 depicts some of the various destinations in town. The destinations represent institutions and businesses in the Town of Mason, as well as several businesses as indicated by the NHES community profile of the Town of Mason. Aside from the residential and local business traffic, Mason has a few large traffic generators.
Table 8.4: Destinations
Destination Type Destination Name Street Address Capacity or Size
Library Mason Public Library 16 Darling Hill Rd 772 SF Town Office Town Office 16 Darling Hill Rd 1,200 SF Elementary School Mason Elementary School 13 Darling Hill Rd 90 Students
Kindergarten Young Childs Creative Workshop 33 Valley Road 15 Students
Hiking Trail Mason-Greenville Rail Road Trail
Depot Road Crossing 16.25 Miles
Restaurant Parker's Maple Barn 1316 Brookline Rd 196 Diners Restaurant Pickity Place 248 Nutting Hill Rd 56 Diners Golf Driving Range The Driving Range 96 Old Turnpike Rd 30 Acres
EMERGING TRENDS IN CHANGES OF LAND USE
The decade of the 1980’s saw vast growth in America’s suburbs, not only in terms of residential development but also in terms of mixed-use development dominated by employment-based activity centers. The rapid improvements in telecommunications allowed companies greater flexibility in location. No longer were they tied to downtown locations with their easy access to finance and government. By moving into lower-density rural areas, they could still communicate with related business and government while enjoying the many amenities the rural environment offers. Those businesses found that those with whom they needed to interact were also joining them in the more rural areas. Employment growth in the suburban and rural areas far outstripped employment growth in central cities. This trend appears to be continuing and is by far the greatest challenge to our transportation system faced by our nation today.
Other changes which continue to take place and which also affect our transportation system include the increase in older Americans as a result of improved medical care, greater affluence, and therefore increased mobility needs for our elderly population; a continuing increase in the number of women in the labor force; and a decreasing household size.

Mason Master Plan, 2007 Update
Transportation 109
ROAD AND BRIDGE CONDITIONS
SURFACE WIDTHS & CONDITIONS
Roads in Mason are of varying widths and surface conditions. The wideness of a road is not necessarily related to the ownership – i.e., the state roads are not always wider than the town roads, although they are more likely to have wider shoulders. The NH DOT has developed standards for road construction, published in December 2003, titled “Suggested Minimum Design Standards for Rural Subdivision Streets”. The specifications recommended for minimum width and materials are based on average daily traffic – in other words, the more traffic a road carries, the wider the traveled way and shoulders, the deeper the base and top coat, etc. According to these standards, the minimum width for the least-traveled road should be 18 feet, plus a two-foot shoulder; this is for a road carrying no more than 50 vehicle trips per day. Most roads in New Hampshire towns do not meet this standard and, even with new construction, many small towns will approve an 18-foot width for a Class V town road carrying more than 50 vehicle trips per day. Widths of pavement in the Town of Mason vary. Pavement widths of 25 feet or less exist throughout town. The pavement widths of major roads like Fitchburg, Townsend, and Brookline Roads are between 21 and 25 feet wide, while less-traveled roads such as Coyne Lane and Lost Valley Road are between 6 and 10 feet. Map 8.2 show pavement widths. Some of the narrower roads in Mason contribute to the Town’s rural character. Consequently, even though these narrow roads are shown to be of deficient width, there is no apparent reason to widen the more scenic and less traveled roads at this time. As development increases, traffic volumes may increase, and road improvements may become necessary. Pavement conditions can be measured using a Ride Comfort Index (RCI). In looking at the RCI levels of major roads in town (NH31, 123, and 124) it appears that the conditions of the pavement varies from High comfort, to Moderate and Low comfort. As these roads are state roads, their improvement would come under the jurisdiction of the NHDOT.
BRIDGES
Bridges present an ongoing maintenance and repair concern for all towns, oftentimes accounting for a large portion of local highway budgets. Bridges also present the potential for a number of safety hazards in instances where they are severely deteriorated or are significantly narrower than the road they serve. Bridges are rated by the DOT, using a system based on federal standards for type of construction, widths, surface condition, and ability to handle traffic volume, etc; Mason has no redlisted bridges at this time (bridges requiring more frequent inspections due to known deficiencies, poor structural conditions, weight restrictions, or the type of construction).
ACCIDENT LOCATIONS
The NH DOT collects data on accident locations throughout the state. Table 8.5 illustrates the largest number of multi-crash locations in Mason between 1995 and 2002; nearly a fourth (23.2%) of all accidents that occurred during that time period occurred at the intersection of NH 124 and NH 31.

Mason Master Plan, 2007 Update
Transportation 110
Table 8.5: Mason Accidents by Intersection 1995-2002
Intersection Total # of Crashes
Abbot Hill Starch Mill 5 Campbell Hill Hurricane Hill 2 Starch Mill Pratt Pond 5 NH 124 NH 31 13 Abbot Hill Mitchell 2 Brookline Rd Fireman's Ln 3 Hurricane Hill Townsend Rd 2 NH 124 MA line 5 Brookline Rd Old County 2 Brookline Rd Campbell 5 Turnpike Marcel 4 Briggs Hurricane Hill 2 Nutting Hill Batchelder 2 Pratt Pond Batchelder 2 NH 31 MA line 2 Total 56
PROBLEM AREAS
The Mason Road Agent/Fire Chief and a representative from the Police Department met with SWRPC staff to discuss existing transportation problems in Town and rank those problems in order of priority. This discussion led to the creation of a transportation matrix depicted in Table 8.6 below and illustrated in Map 8.2. The numbers in the table correspond to the label numbers on the map. The matrix focuses on the problem and location, description, additional comments, and possible solutions to problems such as road width, surface type, speed limit, accidents, other safety hazards, drainage, pedestrian access, parking, snow and ice, and other maintenance issues. Items are not listed in order of priority, though the last column ranks each problem in terms of high, medium or low priority. Table 8.7 presents a summary of recommended transportation management projects which address town-wide maintenance needs rather than location-specific hazards.

Mason Master Plan, 2007 Update
Transportation 111
Table 8.6: Transportation Problem Matrix
Problem Location Description Additional Comments Possible Solutions
Priority (High, Med., Low)
1
Curve Barrett Hill. Curve too sharp. Bad visibility any
time, and it is worse in the snow/winter.
Redesign (not likely) and it is heavily salted
in the winter. Low
2
Grade Barrett Hill. Grade too steep. Worse in the winter. Redesign (not likely), heavily salted in winter. Low
3 Intersection
Angle
Rt. 124/Barrett Hill & Rt. 31.
Tough angle to see oncoming at the
intersection.
Tough turn for 18 wheel trucks and a
confusing intersection design.
Redesign intersection as a “T”.
Medium/ High
4
Non-local
Traffic
Rt. 124/Barret Hill& Rt. 31.
Not familiar with roads/intersections.
Road/intersection design can confuse non-local traffic.
Eliminate islands for better flow. High
5 Operator Error Merriam Hill Road Poor judgment in bad weather. Snow a problem. Maintain Good Salt
Coverage. Repave. Medium/
High
6
Traffic & Pedestrian
concentration
Parkers Maple Barn Parking vehicles and pedestrian concentration
Traffic enforcement in place, Parkers has put in painted crosswalks,
signs, and prohibits parking on the
roadway.
Maintain these mitigation strategies High
7
Visibility
Intersection of Depot & Valley
Tall ledge obstructs view.
Ledge is excessive. Some blasting has
been done.
Increase visibility possibly by blasting
more ledge. Medium
8 Excessive Speed
Valley Road between Jed’s Ln.
and Morse Rd.
Excessive speed on this straight portion
of Valley Road.
Speeding takes place primarily during weekends and
commute hours.
Maintain traffic enforcement. High
9
Traffic Volume & Intersection
Design
31&124; Starch & Abbot; Starch &
Old County; Starch & Russell;
Hurricane Hill & Briggs; Hurricane Hill & Campbell
Intersection designs provide poor visibility.
Lighter traffic volumes of today can make do with these
intersections, but will become worse as
development increases traffic volumes.
Increase sightlines. Low
10
Crest of hill At the intersection
of Briggs and Hurricane Hill.
Poor visibility and a “bottleneck” of
traffic flow.
Will become worse with increased traffic flow as development
continues.
Decrease grades and widen the roads in that
location.
Low/ Medium
11
Pavement width and
surface conditions
Dirt roads and paved roads in
disrepair throughout town.
Width is an issue with dirt roads,
especially as traffic volumes increase.
Numerous paved roads in town should be paved and paved
roads in disrepair need to be repaved.
Widen and pave dirt roads in town, pave the
paved roads in disrepair.
High (Paving)
Low (widening)
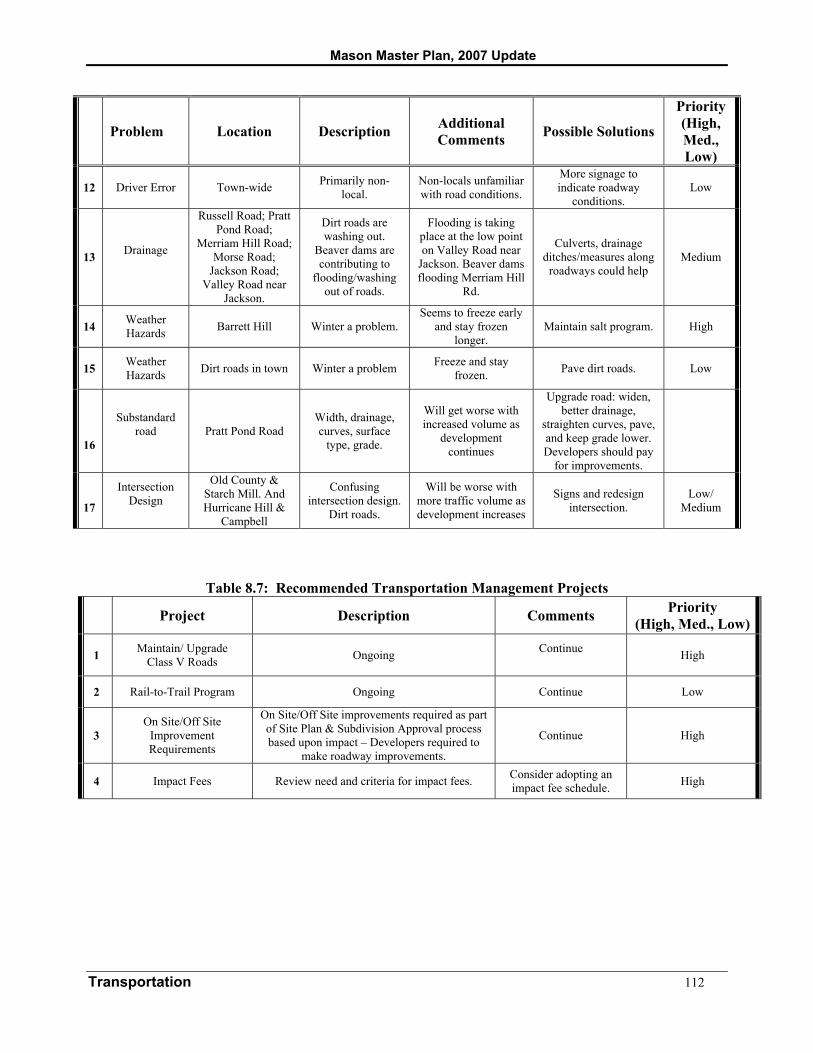
Mason Master Plan, 2007 Update
Transportation 112
Problem Location Description Additional
Comments Possible Solutions
Priority (High, Med., Low)
12 Driver Error Town-wide Primarily non-local.
Non-locals unfamiliar with road conditions.
More signage to indicate roadway
conditions. Low
13
Drainage
Russell Road; Pratt Pond Road;
Merriam Hill Road; Morse Road;
Jackson Road; Valley Road near
Jackson.
Dirt roads are washing out.
Beaver dams are contributing to
flooding/washing out of roads.
Flooding is taking place at the low point on Valley Road near
Jackson. Beaver dams flooding Merriam Hill
Rd.
Culverts, drainage ditches/measures along
roadways could help Medium
14 Weather Hazards Barrett Hill Winter a problem.
Seems to freeze early and stay frozen
longer. Maintain salt program. High
15
Weather Hazards Dirt roads in town Winter a problem Freeze and stay
frozen. Pave dirt roads. Low
16
Substandard road
Pratt Pond Road
Width, drainage, curves, surface
type, grade.
Will get worse with increased volume as
development continues
Upgrade road: widen, better drainage,
straighten curves, pave, and keep grade lower. Developers should pay
for improvements.
17
Intersection Design
Old County & Starch Mill. And Hurricane Hill &
Campbell
Confusing intersection design.
Dirt roads.
Will be worse with more traffic volume as development increases
Signs and redesign intersection.
Low/ Medium
Table 8.7: Recommended Transportation Management Projects
Project Description Comments Priority (High, Med., Low)
1
Maintain/ Upgrade Class V Roads Ongoing Continue
High
2 Rail-to-Trail Program Ongoing Continue Low
3 On Site/Off Site
Improvement Requirements
On Site/Off Site improvements required as part of Site Plan & Subdivision Approval process based upon impact – Developers required to
make roadway improvements.
Continue High
4 Impact Fees Review need and criteria for impact fees. Consider adopting an impact fee schedule. High

Mason Master Plan, 2007 Update
Transportation 113
PUBLIC/ALTERNATIVE TRANSPORTATION MODES
PUBLIC TRANSPORTATION
Mason has no public transportation network. In Mason’s region, however, there are a number of public transportation options. The Massachusetts Bay Transit Authority (MBTA) commuter rail line runs from Fitchburg, MA east to Boston. In Nashua, the Greyhound Bus Service has routes to Boston, Montreal, White River Junction and Burlington (VT). As part of Nashua’s regionalization project, the city has plans underway to extend MBTA commuter rail service from Lowell, MA to Nashua and Manchester. This 10-mile extension will directly serve the City of Nashua, and indirectly serve the surrounding area, including Mason. The 36-mile trip from Nashua to Boston would take approximately 61 minutes. When this project is complete, Mason residents will have commuter rail options in both Fitchburg and Nashua.
BICYCLE/PEDESTRIAN TRAVEL
Alternative travel is limited in this region, although it has certainly seen resurgence over the last several years. Most roads were designed and built with little or no consideration for anything but motor vehicles; pedestrians and bicyclists must share the road with cars and trucks. In recent years there has been an increase in both pedestrian and bicycle traffic, and with it a recognition of the potential dangers of mixing these activities with vehicular traffic. These issues can be partly addressed at the local level by designing new roads with attention to alternative traffic. With existing roads the problems are more difficult, since the Highway Department is dealing with a circumscribed width in most cases; warning signs and speed limits are the traditional techniques for ameliorating the conflicts, although not always effective. The Montachusett Regional Planning Commission, which comprises the towns south of Mason in Massachusetts, notes proposed bikeways in the region in its 2003 Regional Transportation Plan. Of particular interest to Mason, one proposed bikeway extends along Route 31 from Route 119 in Ashby to downtown Fitchburg. There is currently a bikeway on Route 31 north of Route 119 in Ashby extending to Mason. This proposed route would connect Mason via NH 31 to Ashby and Fitchburg.
RAIL/TRAILS
This region of New Hampshire is fortunate in that there are several abandoned railroad lines throughout the region, which are slowly being converted into multi-use recreational trails. Each line that has been purchased was paid for with federal transportation money in order to keep the rail lines protected. The NH Department of Transportation purchased the land, and turned over management of the corridors to the Department of Resources and Economic Development. The “Mason-Greenville Line” (formerly, the Boston and Maine Railroad) is a 10-mile multi-use rail trail popular with bicyclists in the summer, snowmobilers in the winter and hikers and others throughout the year. The line is owned by a state-municipal partnership and runs from the MA state line through Mason and into Greenville. Currently, the Nashua River Watershed Association (NRWA) is leading efforts to create a Townsend Rail Trail on that MBTA “Greenville” Corridor. The project involves the creation of a 9.4-mi long rail trail in Groton and Townsend. The trail will parallel the Squannacook River and will be designed to accommodate equestrian, bicycle and pedestrian use. This trail could eventually continue south to connect to the MBTA commuter line in Fitchburg (thereby connecting Mason to Fitchburg via rail trails) as well as the existing 11-mile “Nashua River Rail Trail” leading to a regionally significant and appealing 34-mile trail.

Mason Master Plan, 2007 Update
Transportation 114
SIDEWALKS
Walking is the most basic form of transportation. Every trip we make, even by car, we begin and end as pedestrians. Sidewalks serve as critical links in the transportation network by providing pedestrian access to commercial districts, schools, businesses, government offices, and recreation areas. Sidewalks with curb ramps and benches invite strolling and shopping. In addition, a broader range of consumer, social, and recreational opportunities are available in areas catering to pedestrians.
Villages with well-designed sidewalks are generally safer because more people are out walking in the community. In addition, the safety and convenience of pedestrian travel is an important factor in quality of life. Low traffic volumes on neighborhood streets allow for bicycles and pedestrians to comfortably use the shoulders of local streets and roads.
OTHER TRANSPORTATION SERVICES
Many human service agencies provide transportation to elderly, low-income and disabled residents. Most of the need is to access agencies’ services or for employment, medical appointments, shopping, etc. Agencies such as Southwestern Community Service, Red Cross, New Hope/New Horizons provide such transportation. Many agencies feel that their transportation service to their own clients is limited because of the costs in the frequency of service (service is usually weekdays only) and in geographic coverage (residents in outlying communities cannot be as frequently transported). Thomas Transportation Services, Inc. offers service to airports and throughout the Northeast. Service is available 24 hours, including private vehicle service, courier service, charter and connections. Thomas Transportation provides approximately 20,000 round trips annually, employing 45 persons in the region.
Monadnock Transportation offers, door-to door service to any city or airport in the Northeast including limited courier services. Currently 400 to 500 trips are provided monthly. Clients are businesses and corporations with some medical trips to regional hospitals (Dartmouth-Hitchcock-Keene and Boston General Hospital). Regarding the future, Monadnock Transportation cited possible expansion into the low-income market which is not currently served by public transportation or by private carriers.
N and M Transportation Provides, service for public schools in Mason, New Ipswich, and Greenville. The company is based in New Ipswich. Provider Enterprises, Inc. Provides special needs transportation services to public schools for Mason, as well as other communities. The company is based in Freemont, but has local bus drivers in various communities.
Swanson Limousine Service, located in Keene, provides stretch limousines for weddings, special events and airport trips (corporate customers) averaging six trips/month. Demand is highest in May and October, and lowest in January.
ROAD IMPROVEMENT PROGRAM
STATE PROJECTS
The spending of state and federal money on highways is directed by the State Department of Transportation’s 10-Year Transportation Improvement Program. This plan is a product of federal priorities,

Mason Master Plan, 2007 Update
Transportation 115
state legislative decisions, the Advisory Commission on Highways, and public input. There are currently no projects in the 10-Year Transportation Improvement Program located in the Town of Mason.
LOCAL PROJECTS
A road improvement program should be based upon a basic set of general goals and objectives to properly evaluate all elements affecting the transportation system. A specific highway improvement program which evaluates new road projects, reviews road improvements, and schedules these projects over a period of several years is an essential part of a sound transportation plan. Beyond just scheduling these projects, a transportation plan should try to make evaluations as to their direct or indirect influence on the town road system and also the impact on the related land use plan. After the identification of major road deficiencies, a program for the elimination of those deficiencies should be developed. Because of the implications these improvements have on land use, the development of a road improvement program should include input from the Planning Board, Town Road Agent, and Board of Selectmen. Road deficiencies should be prioritized with regards to the greatest need, correcting first those problems which pose the greatest threat to safety. Second on the priority list should be those roads serving the largest and/or the fastest growing population area in the town. Finally, other deficiencies can be included based upon the funds available and the percentage of population served by the particular road. Once a priority list has been developed, costs should be estimated and the actual work scheduled. For this scheduling to be realistic with regard to the overall town budget it would be best to include these projects in an overall Capital Improvements Program (CIP). The inclusion of the highway improvement plan within the CIP insures that adequate consideration is given to Mason’s ability to finance these road improvements while maintaining other town services at appropriate levels. In addition to a plan to eliminate and/or correct problem areas, every highway improvement plan should include a continuous maintenance program for Class V roads throughout the town. In the past, the Town of Mason has had an active CIP in place and it had been updated during the 1980’s. It appears that in the 1990’s the CIP had ceased to be updated. The Town of Mason should revise their CIP and ensure that it be updated on a regular basis in an effort to ensure that it can be an effective transportation planning tool.
TECHNIQUES FOR ADDRESSING TRANSPORTATION ISSUES
PLANNING STRATEGIES
• Focus development in the Village. Provide for mixed uses and higher densities in the Village rather than in the outlying parts of Town. • Identify Appropriate Land Uses. Existing land uses can be monitored and the Zoning Ordinance consulted to ensure that development will be compatible with the road system. Applications for development must always be reviewed with the scale of proposal relative to the road network and abutting land uses in mind.

Mason Master Plan, 2007 Update
Transportation 116
• Plan for Pedestrian and Bicycle Connections. The Town can make sure that it is always at the table when the NHDOT is considering plans involving the state routes, and make every effort to see that all due consideration is given to the accommodation of non-motorized traffic. • Develop and adopt a Road Policy. The Planning Board, in conjunction with the Board of Selectmen, can develop a road policy that would guide development in town based on the status of existing roads and any future plans for roads. This can go far to ameliorate potential questions and problems when applications are submitted for the upgrading of a road, or for a building permit on a Class VI road. • Capital Improvements Program. A Capital Improvements Program (CIP) that sets forth the planned capital expenditures over a six year period can also help to guide road development. In conjunction with a Road Policy, the CIP can set the schedule as well as the degree and type of road improvements. • SWRPC Transportation Advisory Committee Participation in this Committee provides an opportunity for the Town to be involved in the development of the Region’s 10-Year Highway Plan.
REGULATORY STRATEGIES: SUBDIVISION AND SITE PLAN CONSIDERATIONS
Access management Techniques Access management is a set of guidelines and standards for the design and location of driveways, major entrances, and new roads intended to reduce conflicts between traffic turning into and entering from roadside development and through traffic. By integrating these techniques for road and driveway standards into Mason’s Site Plan and Subdivision Review Regulations, the Town will ensure that future development will not negatively affect the transportation network, and will increase safety for bicyclists, pedestrians and motorists. Once the access management techniques become part of the Town’s regulations, the NH DOT and Mason can enter into a Memorandum of Understanding (MOU) by which the NH DOT will communicate with the Town regarding proposed curb cuts along state routes. The NH DOT will not grant permits without communicating with the Town and will look to the Town’s access management regulations to make sure the proposed curb cut complies. Road Standards Included in the Subdivision Regulations administered by the Planning Board are standards for road construction. These address such things as width of the traveled way, width of shoulders, type of materials to be used and depth of each level. The Board also has the option, through a waiver procedure, of accepting plans for new roads with modified standards: for example, approving a graveled road rather than a paved road for developments of low traffic impact. Integrating access management principles into Mason’s exiting road standards can contribute to a safe and efficient road network, and ensure safety for bicyclists, pedestrians and motorists. Some of these principles include:

Mason Master Plan, 2007 Update
Transportation 117
• aligning roads either opposite one another or offset them by a safe distance; • constructing an internal road system with access to new parcels rather than providing access from an
arterial or collector roadway; • designing a coordinated street network for subdivisions which provide rights of way or stubs for future
connections to adjacent subdivisions; • providing dedicated turn lanes where appropriate; and • considering frontage and/or back roads which provide alternative access to parcels adjacent to main
roadways Driveway Standards The Planning Board is allowed by state statute to adopt and administer regulations for the construction and permitting of driveways. The NH DOT regulates curb cuts on state roads; towns are allowed the same authority for town roads. A local driveway regulation, however, can cover all aspects of driveway construction for the entire length, not just the access area off of the road. While Mason currently has local driveway regulations, further integrating principles of access management into these standards can contribute to safe and efficient transportation corridor management for bicyclists, pedestrians and motorists. Some of these principles include: • separating curb cuts and intersections; • aligning residential driveways and major entrances either opposite one another or offset them by a safe
distance; • addressing sight distance from the access point. Adequate sight distance will depend on the road
classification and traffic volumes, but ideally, sight distance should be at least 11 times the speed limit; • relating residential driveway and major entrance design such as width, length and curb radii, to travel
speed and traffic volumes; • requiring two-way driveways to intersect the road at an angle of 75-90 degrees; • avoiding curb cuts on sharp hills; and • limiting driveway grades within 20 feet of the road to no more than 3% uphill and 6% downhill. • prohibiting parking that requires backing out onto the road. Parking Lot Location and Design The location and design of parking lots also contributes to an efficient transportation network, and driver, pedestrian and bicycle safety. Some techniques that can be used are: • locating the building(s) close to the road; putting the parking on the side or in the rear of the parcel; • requiring shared parking, when feasible; • requiring interior circulation between adjacent parking; • planning for future shared parking by designating reserved areas on the plan; • accommodating pedestrians and bicyclists by integrating sidewalks and bike lanes; • prohibiting parking and loading that requires backing out onto the street; and • including the use of vegetative buffers between parking lots and roads. During the subdivision or site plan review process the Planning Board has an opportunity to review all proposals based on the transportation issues identified in this section. Some of the pertinent issues include:

Mason Master Plan, 2007 Update
Transportation 118
Viewing the Whole Parcel It is always important to step back from an individual plan and look at it in relation to the neighboring properties and land uses. If the lot fronts on more than one road, decisions can be made about which roads would better serve as access, how the parking should be laid out, etc. Lot Layout When the opportunity presents itself through a multi-lot subdivision, the subdivision design should consider an interior street, with lots fronting off of the interior rather than the main roads. While the Town has addressed this, the Planning Board should continue to monitor future subdivision designs.
ADDITIONAL CONSIDERATIONS
Scenic Roads Mason has four scenic roads: Scripps Lane, Coyne Lane, Jackson Road, and portions of Darling Hill. This designation, in and of itself, does not affect land use or traffic along the road, but it could serve as the basis for developing a Scenic Road Corridor, in which land use and traffic would be reviewed in concert with the objectives of the designation. These scenic roads are shown on Map 8.2.