Maruti Suzuki...January 28, 2021 2 Maruti Suzuki from a shift in demand towards small cars due to...
9
Result Update Healthy order book and low inventory to drive earnings Maruti Suzuki’s 3QFY21 EBITDA margin at 9.5% was below estimates impacted by increase in input cost (GPM slipped by 257bps QoQ), unfavorable FX movement and salary increments to employees. The company has taken an average price hike of ~2% in the month of January 21 to mitigate the impact of RM cost. Demand recovery has been good, volume grew 13.4% YoY in 3Q driven by first-time buyers (share increased to 49% vs 43% YoY), pent-up demand, and strong rural market. Low network inventory (21k vehicle, less than 1 week) and robust order backlog (216k vehicle) are augurs well for wholesale volume in coming months. Commodity price inflation is quite significant in core commodities as well as precious metals, management believes margin pressure to ease out gradually led by price hike and operating leverage. Despite margin pressure in near term, MSIL remains an attractive long term investment bet for domestic discretionary consumption. Improvement in consumer sentiments with recovery in economic activities remains a key trigger for earnings growth. Proven products, cost leadership, strong network and rural presence (+40% sales) define company’s intrinsic strengths. We expect increasing realization of used cars and recovery in urban demand to aid in faster recovery of replacement demand. We expect a broad-based long term demand recovery to be visible from FY22 as GDP growth/job creation rates pick-up. Demand prospects remain upbeat, led by healthy order-book and likely improvement in replacement demand. Near term margins may remain under pressure due to higher commodity prices, any fall in commodity price to be key positive. We estimate 37% CAGR in MSIL’s earnings over FY21-23E led by 14% growth in volume and 300bps margin expansion. We value the stock Rs 8,425 (based on 27xFY23E EPS). Maintain Accumulate. Demand outlook is upbeat Domestic PV demand has seen a swift recovery after the lockdown was lifted, aided by higher preference for personal safety better financing availability and strong rural demand. We expect Maruti will continue to benefit (cont..) Q3FY21 Result (Rs Mn) Particulars Q3FY21 Q3FY20 YoY (%) Q2FY21 QoQ (%) Revenue 2,34,578 2,07,068 13.3 1,87,445 25.1 Total Expense 2,12,317 1,86,047 14.1 1,68,109 26.3 EBITDA 22,261 21,021 5.9 19,336 15.1 Depreciation 7,413 8,580 (13.6) 7,659 (3.2) EBIT 14,848 12,441 19.3 11,677 27.2 Other Income 9,937 7,840 26.7 6,025 64.9 Interest 287 217 32.3 224 28.1 EBT 24,498 20,064 22.1 17,478 40.2 Tax 5,084 4,416 15.1 3,762 35.1 RPAT 19,414 15,648 24.1 13,716 41.5 APAT 19,414 15,648 24.1 13,716 41.5 (bps) (bps) Gross Margin (%) 27.5 27.5 (3) 30.0 (257) EBITDA Margin (%) 9.5 10.2 (66) 10.3 (83) NPM (%) 8.3 7.6 72 7.3 96 Tax Rate (%) 20.8 22.0 (126) 21.5 (77) EBIT Margin (%) 6.3 6.0 32 6.2 10 CMP Rs 7,871 Target / Upside Rs 8,424 / 7% NIFTY 13,818 Scrip Details Equity / FV Rs 1,510mn / Rs 5 Market Cap Rs 2,378bn USD 33bn 52-week High/Low Rs 8,329/ 4,001 Avg. Volume (no) 11,45,050 Bloom Code MSIL IN Price Performance 1M 3M 12M Absolute (%) 5 10 12 Rel to NIFTY (%) 6 (8) (2) Shareholding Pattern Jun'20 Sep'20 Dec'20 Promoters 56.3 56.4 56.4 MF/Banks/FIs 17.7 17.3 15.7 FIIs 21.7 22.0 23.1 Public / Others 4.4 4.3 4.9 Valuation (x) FY21E FY22E FY23E P/E 46.7 29.5 25.2 EV/EBITDA 39.0 22.9 19.2 ROE (%) 10.1 14.7 15.5 RoACE (%) 10.1 14.5 15.3 Estimates (Rs mn) FY21E FY22E FY23E Revenue 6,97,050 8,52,251 9,40,135 EBITDA 60,146 1,01,755 1,20,757 PAT 50,910 80,658 94,242 EPS (Rs.) 168.5 267.0 312.0 Analyst: Abhishek Jain Tel: +9122 40969739 E-mail: [email protected] Associate: Kripashankar Maurya Tel: +91 22 4096 9741 E-mail: [email protected] Maruti Suzuki Accumulate January 28, 2021
Transcript of Maruti Suzuki...January 28, 2021 2 Maruti Suzuki from a shift in demand towards small cars due to...

Re
sult
Up
da
te
Healthy order book and low inventory to drive earnings Maruti Suzuki’s 3QFY21 EBITDA margin at 9.5% was below estimates
impacted by increase in input cost (GPM slipped by 257bps QoQ), unfavorable FX movement and salary increments to employees. The company has taken an average price hike of ~2% in the month of January 21 to mitigate the impact of RM cost.
Demand recovery has been good, volume grew 13.4% YoY in 3Q driven by first-time buyers (share increased to 49% vs 43% YoY), pent-up demand, and strong rural market. Low network inventory (21k vehicle, less than 1 week) and robust order backlog (216k vehicle) are augurs well for wholesale volume in coming months.
Commodity price inflation is quite significant in core commodities as well as precious metals, management believes margin pressure to ease out gradually led by price hike and operating leverage.
Despite margin pressure in near term, MSIL remains an attractive long term investment bet for domestic discretionary consumption. Improvement in consumer sentiments with recovery in economic activities remains a key trigger for earnings growth. Proven products, cost leadership, strong network and rural presence (+40% sales) define company’s intrinsic strengths.
We expect increasing realization of used cars and recovery in urban demand to aid in faster recovery of replacement demand. We expect a broad-based long term demand recovery to be visible from FY22 as GDP growth/job creation rates pick-up.
Demand prospects remain upbeat, led by healthy order-book and likely improvement in replacement demand. Near term margins may remain under pressure due to higher commodity prices, any fall in commodity price to be key positive. We estimate 37% CAGR in MSIL’s earnings over FY21-23E led by 14% growth in volume and 300bps margin expansion. We value the stock Rs 8,425 (based on 27xFY23E EPS). Maintain Accumulate.
Demand outlook is upbeat Domestic PV demand has seen a swift recovery after the lockdown was lifted, aided by higher preference for personal safety better financing availability and strong rural demand. We expect Maruti will continue to benefit (cont..) Q3FY21 Result (Rs Mn)
Particulars Q3FY21 Q3FY20 YoY (%) Q2FY21 QoQ (%)
Revenue 2,34,578 2,07,068 13.3 1,87,445 25.1
Total Expense 2,12,317 1,86,047 14.1 1,68,109 26.3
EBITDA 22,261 21,021 5.9 19,336 15.1
Depreciation 7,413 8,580 (13.6) 7,659 (3.2)
EBIT 14,848 12,441 19.3 11,677 27.2
Other Income 9,937 7,840 26.7 6,025 64.9
Interest 287 217 32.3 224 28.1
EBT 24,498 20,064 22.1 17,478 40.2
Tax 5,084 4,416 15.1 3,762 35.1
RPAT 19,414 15,648 24.1 13,716 41.5
APAT 19,414 15,648 24.1 13,716 41.5
(bps) (bps)
Gross Margin (%) 27.5 27.5 (3) 30.0 (257)
EBITDA Margin (%) 9.5 10.2 (66) 10.3 (83)
NPM (%) 8.3 7.6 72 7.3 96
Tax Rate (%) 20.8 22.0 (126) 21.5 (77)
EBIT Margin (%) 6.3 6.0 32 6.2 10
CMP Rs 7,871
Target / Upside Rs 8,424 / 7%
NIFTY 13,818
Scrip Details
Equity / FV Rs 1,510mn / Rs 5
Market Cap Rs 2,378bn
USD 33bn
52-week High/Low Rs 8,329/ 4,001
Avg. Volume (no) 11,45,050
Bloom Code MSIL IN
Price Performance 1M 3M 12M
Absolute (%) 5 10 12
Rel to NIFTY (%) 6 (8) (2)
Shareholding Pattern
Jun'20 Sep'20 Dec'20
Promoters 56.3 56.4 56.4
MF/Banks/FIs 17.7 17.3 15.7
FIIs 21.7 22.0 23.1
Public / Others 4.4 4.3 4.9
Valuation (x)
FY21E FY22E FY23E
P/E 46.7 29.5 25.2
EV/EBITDA 39.0 22.9 19.2
ROE (%) 10.1 14.7 15.5
RoACE (%) 10.1 14.5 15.3
Estimates (Rs mn)
FY21E FY22E FY23E
Revenue 6,97,050 8,52,251 9,40,135
EBITDA 60,146 1,01,755 1,20,757
PAT 50,910 80,658 94,242
EPS (Rs.) 168.5 267.0 312.0
Analyst: Abhishek Jain Tel: +9122 40969739
E-mail: [email protected]
Associate: Kripashankar Maurya Tel: +91 22 4096 9741
E-mail: [email protected]
Maruti Suzuki
Accumulate
January 28, 2021

January 28, 2021 2 Maruti Suzuki
from a shift in demand towards small cars due to faster recovery in demand in rural areas and increasing preference for personal mobility. Although replacement demand is weak now, increasing realization of used cars and recovery in urban demand to aid in faster recovery of replacement demand. Network inventory is also remains much below (less than 1 weeks) vs the normalized level of 4 weeks, this augurs well for channel restocking in coming months.
SUV segment to be focus area for MSIL In the last 9 months the company has lost market share 300bps loss in market share of UV segment due to unavailability of diesel variant. Hence, MSIL is closely evaluating this opportunity and its re-entry in the above 1.5ltr diesel category. Management Expect SUV share to improve by 400-500bps in near to medium term. This will be positive for realization and volume both. Jimny exports have commenced, and markets being targeted are Latin America, Middle east and Africa markets. Company is evaluating launch of this model for domestic market. Margin levers in place We expect MSIL’s EBITDA margins to remain under pressure in the near term due to commodity inflation, adverse product mix, adverse currency movement (JPY/INR). Management is aggressively working towards bringing down the fixed cost, model development cost and increasing localization levels. We expect sharper recovery in margin from FY22, driven by operating leverage, price hike, easing off commodity prices and cost cutting measures. Dealership strength provides an edge over peers
With the robust network of dealers, Maruti is expected to do better than competitors on all fronts (resumption of supply and market share). Dealer survival is the key during this crisis and service revenue will help dealers to sail through this tough time. We believe MSIL's dealers are in a better position with more than 50% market share in the PV market. Over the years MSIL has developed such a business model for dealers which helps them to make some money even if they sell vehicles in loss by cross selling other products such as insurance, spare parts, accessories etc.
Conference Call Highlights
During the quarter operating margin was impacted due to increase in commodity prices (~300bps) and adverse FX movement, however it was partially offset by cost reduction efforts.
Current inventory for MSIL at beginning of January is less than one week. Average discount is Rs.20.1k/vehicle during the quarter. Company has order back log of 216k unit.
Post festive demand has been good so far. Demand from urban market started improving whereas rural market is continuously doing well, rural market share stood at 40% for the quarter.
Management expect margin to be under pressure due to increasing commodity prices in near term. Increase in precious commodity prices such as Platinum has impacted the margin during the quarter and expect Q4FY21 to be also impacted. However, company is working on various cost measures to mitigate the higher input cost.
MSIL has not yet impacted by shortage of key raw material like semi-conductor as compared to other OEM.
Overall sales conversion ratio is 12%, however digital channel conversion is comparatively low. Enquiry from digital channel has improved to 30% currently from 3% in 2016.

January 28, 2021 3 Maruti Suzuki
Replacement demand for Q3Y21 was 19% vs 26% last year. Financing penetration is around 80%. In PC company gain market share however it loses some market share in SUV segment. Management expect SUV share to improve by 400-500bps over 4-5 years.
First time car buyer segment improved by 5% and second car segment improved by 2%, Share of first time buyer improved to 48-49% vs 43-44% last year.
Adoption of EV is minuscule at global level due to 1) high battery technology (50% of vehicle cost), 2) charging infrastructure and 3) Range anxiety. Management expect EV transition to happen through Hybrid electric vehicle.
Royalty for the quarter is 4.9% vs 5% in previous quarter. Management expect 90-96% models to move to INR based royalty by 2023.
PAT grew by 24% YoY to Rs.19.4bn led by higher other income. Export revenue stood at Rs.13.8 bn.
Company has started export of Jimny model to LATM, Middle est and African market.
Actual vs DART Estimates
Particulars (Rs mn) Actual Dart Estimates Variance (%) Comments
Revenue 2,34,578 2,37,745
EBIDTA 22,261 26,152 Higher RM and adverse forex movement EBIDTA Margin (%) 9.5 11.0
PAT 19,414 18,587
Source: Company, DART
Change in estimates
Rs Mn FY22E FY23E
New Previous Chg (%) New Previous Chg (%)
Volumes (in mn) 1.72 1.64 5.4 1.85 1.83 0.9
Net sales 8,52,251 8,11,662 5.0 9,40,135 9,18,057 2.4
EBITDA 1,01,755 1,01,439 0.3 1,20,757 1,23,429 -2.2
EBITDA margin 11.9 12.5 (55.8)bps 12.8 13.4 (60.0)bps
APAT 80,658 78,260 3.1 94,242 94,425 -0.2
EPS (Rs) 267 259 3.1 312 313 -0.2
Source: Company, DART
Volume grew YoY/QoQ PV market share remain healthy QoQ
Source: Company, DART Source: SIAM, DART
(100)
(80)
(60)
(40)
(20)
0
20
40
50100150200250300350400450500550
Q3
FY1
9
Q4
FY1
9
1Q
FY2
0
Q2
FY2
0
Q3
FY2
0
Q4
FY2
0
Q1
FY2
1
Q2
FY2
1
Q3
FY2
1
Volume (000, units) ( % YoY) - RHS

January 28, 2021 4 Maruti Suzuki
Net revenue increase YoY/QoQ Net ASP weaken YoY/QoQ on adverse
product mix
Source: Company, DART Source: Company, DART
Disc. level increased QoQ EBITDA margin contacted YoY/QoQ on
higher RM cost
Source: Company, DART Source: Company, DART
EBIT improved YoY/QoQ Forex movement remain unfavorable
Source: Company, DART Source: Company, DART
(100)
(80)
(60)
(40)
(20)
0
20
40
30,000
80,000
1,30,000
1,80,000
2,30,000
2,80,000
Q3
FY1
9
Q4
FY1
9
Q1
FY2
0
Q2
FY2
0
Q3
FY2
0
Q4
FY2
0
Q1
FY2
1
Q2
FY2
1
Q3
FY2
1Net Revenue Growth (%)
4,20,000
4,40,000
4,60,000
4,80,000
5,00,000
5,20,000
5,40,000
5,60,000
Q3
FY1
9
Q4
FY1
9
1Q
FY2
0
Q2
FY2
0
Q3
FY2
0
Q4
FY2
0
Q1
FY2
1
Q2
FY2
1
Q3
FY2
1
8
13
18
23
28
33
38
Q3
FY1
9
4Q
FY1
9
1Q
FY2
0
Q2
FY2
0
Q3
FY2
0
Q4
FY2
0
Q1
FY2
1
Q2
FY2
1
Q3
FY2
1
Discount /vehicle (Rs in '000)
(25)(20)(15)(10)(5)05101520
(20,000)
(10,000)
0
10,000
20,000
30,000
40,000
Q3
FY1
9
4Q
FY1
9
1Q
FY2
0
Q2
FY2
0
Q3
FY2
0
Q4
FY2
0
Q1
FY2
1
Q2
FY2
1
Q3
FY2
1
EBITDA (Rs mn) EBITDA margin - RHS
(50)
(40)
(30)
(20)
(10)
0
10
20
(20,000)(15,000)(10,000)
(5,000)0
5,00010,00015,00020,00025,00030,000
Q3
FY1
9
4Q
FY1
9
1Q
FY2
0
Q2
FY2
0
Q3
FY2
0
Q4
FY2
0
Q1
FY2
1
Q2
FY2
1
Q3
FY2
1
EBIT (Rs. mn) EBIT margin (%) - RHS
0.64 0.64 0.62
0.66 0.66
0.70 0.71 0.71 0.72
0.560.580.600.620.640.660.680.700.720.74
3Q
FY1
9
4Q
FY1
9
Q1
FY2
0
Q2
FY2
0
Q3
FY2
0
Q4
FY2
0
Q1
FY2
1
Q2
FY2
1
Q3
FY2
1
January 28, 2021 5 Maruti Suzuki
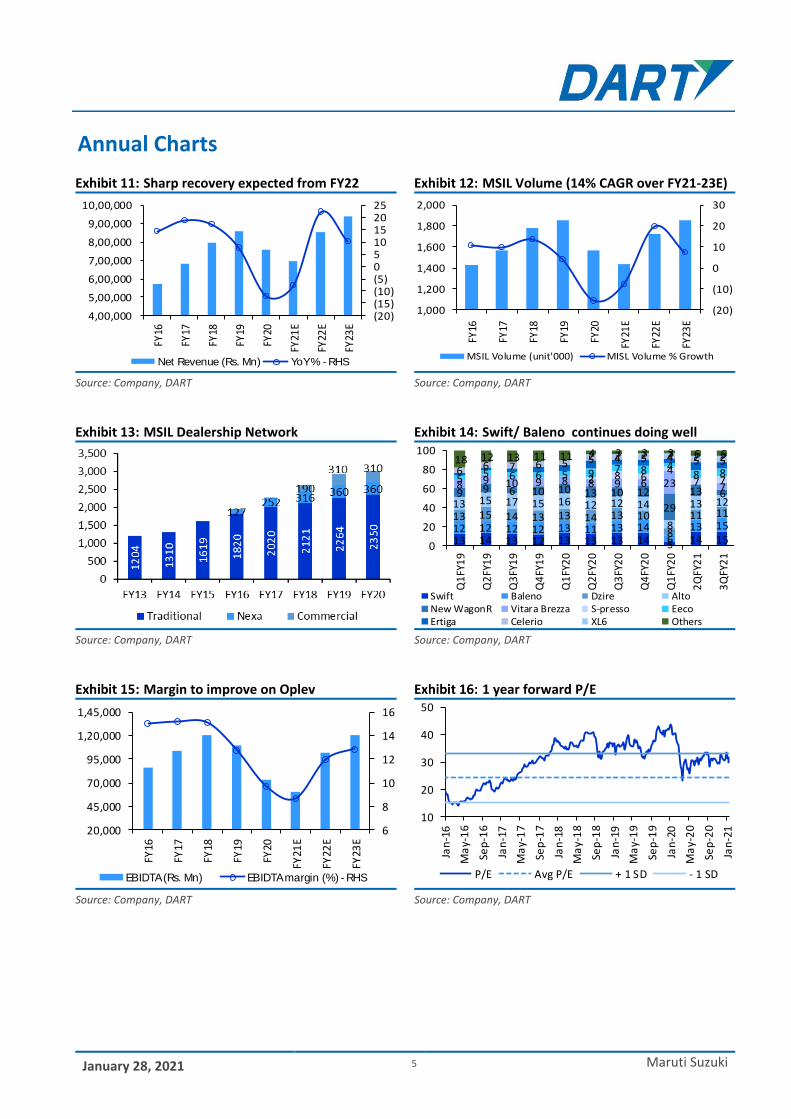
Annual Charts
Sharp recovery expected from FY22 MSIL Volume (14% CAGR over FY21-23E)
Source: Company, DART Source: Company, DART
MSIL Dealership Network Swift/ Baleno continues doing well
Source: Company, DART Source: Company, DART
Margin to improve on Oplev 1 year forward P/E
Source: Company, DART Source: Company, DART
(20)(15)(10)(5)0510152025
4,00,000
5,00,000
6,00,000
7,00,000
8,00,000
9,00,000
10,00,000
FY16
FY17
FY18
FY19
FY20
FY21
E
FY22
E
FY23
ENet Revenue (Rs. Mn) YoY % - RHS
(20)
(10)
0
10
20
30
1,000
1,200
1,400
1,600
1,800
2,000
FY
16
FY
17
FY
18
FY
19
FY
20
FY
21E
FY
22E
FY
23E
MSIL Volume (unit'000) MISL Volume % Growth
13 14 13 12 13 13 13 14 5 14 1512 12 12 12 13 11 13 14
613 15
13 15 14 13 13 14 13 10
8
11 1113 15 17 15 16 12 12 14
8
13 129 9 6 10 10 13 10 12
29
13 68 9 10 9 8 8 9 6 23 7
2 8 64
7 75 5 6 6 5 9 7 8 48 86 6 7 6 5 5 4 5 4 5 52 2 2 2 2 218 12 13 11 11 4 3 3 3 6 6
0
20
40
60
80
100 Q
1FY
19
Q2
FY1
9
Q3
FY1
9
Q4
FY1
9
Q1
FY2
0
Q2
FY2
0
Q3
FY2
0
Q4
FY2
0
Q1
FY2
0
2Q
FY2
1
3Q
FY2
1
Swift Baleno Dzire AltoNew WagonR Vitara Brezza S-presso EecoErtiga Celerio XL6 Others
6
8
10
12
14
16
20,000
45,000
70,000
95,000
1,20,000
1,45,000
FY16
FY17
FY18
FY19
FY20
FY21
E
FY22
E
FY23
E
EBIDTA (Rs. Mn) EBIDTA margin (%) - RHS
10
20
30
40
50
Jan
-16
Ma
y-1
6
Sep
-16
Jan
-17
Ma
y-1
7
Sep
-17
Jan
-18
Ma
y-1
8
Sep
-18
Jan
-19
Ma
y-1
9
Sep
-19
Jan
-20
Ma
y-2
0
Sep
-20
Jan
-21
P/E Avg P/E + 1 SD - 1 SD

January 28, 2021 6 Maruti Suzuki
Profit and Loss Account
(Rs Mn) FY20A FY21E FY22E FY23E
Revenue 7,56,106 6,97,050 8,52,251 9,40,135
Total Expense 6,83,080 6,36,904 7,50,496 8,19,378
COGS 5,31,566 4,94,906 5,94,873 6,52,457
Employees Cost 33,839 34,516 37,277 41,005
Other expenses 1,17,675 1,07,482 1,18,346 1,25,916
EBIDTA 73,026 60,146 1,01,755 1,20,757
Depreciation 35,257 30,546 33,285 35,121
EBIT 37,769 29,600 68,470 85,636
Interest 1,329 450 300 250
Other Income 34,208 37,837 40,097 41,969
Exc. / E.O. items 0 0 0 0
EBT 70,648 66,987 1,08,267 1,27,356
Tax 14,142 16,077 27,609 33,114
RPAT 56,506 50,910 80,658 94,242
Minority Interest 0 0 0 0
Profit/Loss share of associates 0 0 0 0
APAT 56,506 50,910 80,658 94,242
Balance Sheet
(Rs Mn) FY20A FY21E FY22E FY23E
Sources of Funds
Equity Capital 1,510 1,510 1,510 1,510
Minority Interest 0 0 0 0
Reserves & Surplus 4,82,860 5,18,498 5,74,155 6,38,243
Net Worth 4,84,370 5,20,008 5,75,665 6,39,753
Total Debt 1,063 1,063 1,063 1,063
Net Deferred Tax Liability 7,444 7,944 8,444 8,944
Total Capital Employed 4,92,877 5,29,015 5,85,172 6,49,760
Applications of Funds
Net Block 1,52,129 1,54,957 1,66,671 1,76,551
CWIP 13,374 14,374 15,374 16,374
Investments 3,52,488 3,92,488 4,37,488 4,79,488
Current Assets, Loans & Advances 1,01,236 1,21,493 1,45,077 1,76,011
Inventories 32,149 28,646 35,024 41,211
Receivables 21,270 22,917 23,349 28,333
Cash and Bank Balances 4,869 16,037 27,707 43,713
Loans and Advances 5,246 13,941 17,045 18,803
Other Current Assets 37,702 39,952 41,952 43,952
Less: Current Liabilities & Provisions 1,26,350 1,54,296 1,79,438 1,98,664
Payables 74,914 97,717 1,17,201 1,30,202
Other Current Liabilities 51,436 56,580 62,238 68,461
sub total
Net Current Assets (25,114) (32,803) (34,361) (22,652)
Total Assets 4,92,877 5,29,015 5,85,172 6,49,760
E – Estimates

January 28, 2021 7 Maruti Suzuki
Important Ratios
Particulars FY20A FY21E FY22E FY23E
(A) Margins (%)
Gross Profit Margin 29.7 29.0 30.2 30.6
EBIDTA Margin 9.7 8.6 11.9 12.8
EBIT Margin 5.0 4.2 8.0 9.1
Tax rate 20.0 24.0 25.5 26.0
Net Profit Margin 7.5 7.3 9.5 10.0
(B) As Percentage of Net Sales (%)
COGS 70.3 71.0 69.8 69.4
Employee 4.5 5.0 4.4 4.4
Other 15.6 15.4 13.9 13.4
(C) Measure of Financial Status
Gross Debt / Equity 0.0 0.0 0.0 0.0
Interest Coverage 28.4 65.8 228.2 342.5
Inventory days 16 15 15 16
Debtors days 10 12 10 11
Average Cost of Debt 103.9 42.3 28.2 23.5
Payable days 36 51 50 51
Working Capital days (12) (17) (15) (9)
FA T/O 5.0 4.5 5.1 5.3
(D) Measures of Investment
AEPS (Rs) 187.1 168.5 267.0 312.0
CEPS (Rs) 303.8 269.7 377.2 428.2
DPS (Rs) 60.0 50.6 82.8 99.8
Dividend Payout (%) 32.1 30.0 31.0 32.0
BVPS (Rs) 1603.4 1721.4 1905.7 2117.8
RoANW (%) 11.9 10.1 14.7 15.5
RoACE (%) 12.0 10.1 14.5 15.3
RoAIC (%) 7.9 5.9 12.8 14.7
(E) Valuation Ratios
CMP (Rs) 7871 7871 7871 7871
P/E 42.1 46.7 29.5 25.2
Mcap (Rs Mn) 23,77,642 23,77,642 23,77,642 23,77,642
MCap/ Sales 3.1 3.4 2.8 2.5
EV 23,61,648 23,48,480 23,34,810 23,16,804
EV/Sales 3.1 3.4 2.7 2.5
EV/EBITDA 32.3 39.0 22.9 19.2
P/BV 4.9 4.6 4.1 3.7
Dividend Yield (%) 0.8 0.6 1.1 1.3
(F) Growth Rate (%)
Revenue (12.1) (7.8) 22.3 10.3
EBITDA (33.6) (17.6) 69.2 18.7
EBIT (52.7) (21.6) 131.3 25.1
PBT (32.5) (5.2) 61.6 17.6
APAT (24.7) (9.9) 58.4 16.8
EPS (24.7) (9.9) 58.4 16.8
Cash Flow
(Rs Mn) FY20A FY21E FY22E FY23E
CFO 34,051 1,02,816 1,29,674 1,36,165
CFI (4,639) (76,374) (93,000) (90,000)
CFF (31,000) (17,748) (29,056) (35,045)
FCFF 3,450 68,442 83,674 90,165
Opening Cash 1,789 4,869 16,037 27,707
Closing Cash 4,869 16,037 27,707 43,713
E – Estimates

DART RATING MATRIX
Total Return Expectation (12 Months)
Buy > 20%
Accumulate 10 to 20%
Reduce 0 to 10%
Sell < 0%
Rating and Target Price History
Month Rating TP (Rs.) Price (Rs.)
Jan-20 BUY 7,942 6,997
Mar-20 Accumulate 5,694 5,079
Mar-20 Accumulate 5,694 4,328
Apr-20 Accumulate 5,282 4,698
May-20 BUY 5,570 5,114
Jul-20 Reduce 6,519 6,185
Sep-20 Reduce 6,791 7,209
Oct-20 Accumulate 7,815 7,118
*Price as on recommendation date
DART Team
Purvag Shah Managing Director [email protected] +9122 4096 9747
Amit Khurana, CFA Head of Equities [email protected] +9122 4096 9745
CONTACT DETAILS
Equity Sales Designation E-mail Direct Lines
Dinesh Bajaj VP - Equity Sales [email protected] +9122 4096 9709
Kapil Yadav VP - Equity Sales [email protected] +9122 4096 9735
Yomika Agarwal VP - Equity Sales [email protected] +9122 4096 9772
Jubbin Shah VP - Derivatives Sales [email protected] +9122 4096 9779
Ashwani Kandoi AVP - Equity Sales [email protected] +9122 4096 9725
Lekha Nahar AVP - Equity Sales [email protected] +9122 4096 9740
Equity Trading Designation E-mail
P. Sridhar SVP and Head of Sales Trading [email protected] +9122 4096 9728
Chandrakant Ware VP - Sales Trading [email protected] +9122 4096 9707
Shirish Thakkar VP - Head Domestic Derivatives Sales Trading [email protected] +9122 4096 9702
Kartik Mehta Asia Head Derivatives [email protected] +9122 4096 9715
Dinesh Mehta Co- Head Asia Derivatives [email protected] +9122 4096 9765
Bhavin Mehta VP - Derivatives Strategist [email protected] +9122 4096 9705
3,810
4,700
5,590
6,480
7,370
8,260
Jan-2
0
Fe
b-2
0
Mar-
20
Apr-
20
May-2
0
Jun-2
0
Jul-20
Aug-2
0
Sep-2
0
Oct-
20
Nov-2
0
Dec-2
0
Jan-2
1
(Rs) MSIL Target Price
Dolat Capital Market Private Limited. Sunshine Tower, 28th Floor, Senapati Bapat Marg, Dadar (West), Mumbai 400013

Our Research reports are also available on Reuters, Thomson Publishers, DowJones and Bloomberg (DCML <GO>)
Analyst(s) Certification The research analyst(s), with respect to each issuer and its securities covered by them in this research report, certify that: All of the views expressed in this research report accurately reflect his or her or their personal views about all of the issuers and their securities; and No part of his or her or their compensation was, is, or will be directly or indirectly related to the specific recommendations or views expressed in this research report.
I. Analyst(s) and Associate (S) holding in the Stock(s): (Nil)
II. Disclaimer: This research report has been prepared by Dolat Capital Market Private Limited. to provide information about the company(ies) and sector(s), if any, covered in the report and may be distributed by it and/or its affiliated company(ies) solely for the purpose of information of the select recipient of this report. This report and/or any part thereof, may not be duplicated in any form and/or reproduced or redistributed without the prior written consent of Dolat Capital Market Private Limited. This report has been prepared independent of the companies covered herein. Dolat Capital Market Private Limited. and its affiliated companies are part of a multi-service, integrated investment banking, brokerage and financing group. Dolat Capital Market Private Limited. and/or its affiliated company(ies) might have provided or may provide services in respect of managing offerings of securities, corporate finance, investment banking, mergers & acquisitions, financing or any other advisory services to the company(ies) covered herein. Dolat Capital Market Private Limited. and/or its affiliated company(ies) might have received or may receive compensation from the company(ies) mentioned in this report for rendering any of the above services. Research analysts and sales persons of Dolat Capital Market Private Limited. may provide important inputs to its affiliated company(ies) associated with it. While reasonable care has been taken in the preparation of this report, it does not purport to be a complete description of the securities, markets or developments referred to herein, and Dolat Capital Market Private Limited. does not warrant its accuracy or completeness. Dolat Capital Market Private Limited. may not be in any way responsible for any loss or damage that may arise to any person from any inadvertent error in the information contained in this report. This report is provided for information only and is not an investment advice and must not alone be taken as the basis for an investment decision. The investment discussed or views expressed herein may not be suitable for all investors. The user assumes the entire risk of any use made of this information. The information contained herein may be changed without notice and Dolat Capital Market Private Limited. reserves the right to make modifications and alterations to this statement as they may deem fit from time to time. Dolat Capital Market Private Limited. and its affiliated company(ies), their directors and employees may; (a) from time to time, have a long or short position in, and buy or sell the securities of the company(ies) mentioned herein or (b) be engaged in any other transaction involving such securities and earn brokerage or other compensation or act as a market maker in the financial instruments of the company(ies) discussed herein or act as an advisor or lender/borrower to such company(ies) or may have any other potential conflict of interests with respect to any recommendation and other related information and opinions. This report is neither an offer nor solicitation of an offer to buy and/or sell any securities mentioned herein and/or not an official confirmation of any transaction. This report is not directed or intended for distribution to, or use by any person or entity who is a citizen or resident of or located in any locality, state, country or other jurisdiction, where such distribution, publication, availability or use would be contrary to law, regulation or which would subject Dolat Capital Market Private Limited. and/or its affiliated company(ies) to any registration or licensing requirement within such jurisdiction. The securities described herein may or may not be eligible for sale in all jurisdictions or to a certain category of investors. Persons in whose possession this report may come, are required to inform themselves of and to observe such restrictions.
For U.S. Entity/ persons only: This research report is a product of Dolat Capital Market Private Limited., which is the employer of the research analyst(s) who has prepared the research report. The research analyst(s) preparing the research report is/are resident outside the United States (U.S.) and are not associated persons of any U.S. regulated broker-dealer and therefore the analyst(s) is/are not subject to supervision by a U.S. broker-dealer, and is/are not required to satisfy the regulatory licensing requirements of FINRA or required to otherwise comply with U.S. rules or regulations regarding, among other things, communications with a subject company, public appearances and trading securities held by a research analyst account.
This report is intended for distribution by Dolat Capital Market Private Limited. only to "Major Institutional Investors" as defined by Rule 15a-6(b)(4) of the U.S. Securities and Exchange Act, 1934 (the Exchange Act) and interpretations thereof by U.S. Securities and Exchange Commission (SEC) in reliance on Rule 15a 6(a)(2). If the recipient of this report is not a Major Institutional Investor as specified above, then it should not act upon this report and return the same to the sender. Further, this report may not be copied, duplicated and/or transmitted onward to any U.S. person or entity.
In reliance on the exemption from registration provided by Rule 15a-6 of the Exchange Act and interpretations thereof by the SEC in order to conduct certain business with Major Institutional Investors, Dolat Capital Market Private Limited. has entered into an agreement with a U.S. registered broker-dealer Ltd StoneX Financial Inc.(“StoneX”). Transactions in securities discussed in this research report should be effected through StoneX Financial Inc.(“StoneX”) or another U.S. registered broker dealer/Entity as informed by Dolat Capital Market Private Limited. from time to time.
Dolat Capital Market Private Limited.
Corporate Identity Number: U65990DD1993PTC009797 Member: BSE Limited and National Stock Exchange of India Limited.
SEBI Registration No: BSE - INZ000274132, NSE - INZ000274132, Research: INH000000685 Registered office: Unit no PO6-02A - PO6-02D, Tower A, WTC, Block 51, Zone-5, Road 5E, Gift City, Gandhinagar, Gujarat – 382355
Board: +9122 40969700 | Fax: +9122 22651278 | Email: [email protected] | www.dolatresearch.com