MARSHALL’S ‘TREES’ AND THE GLOBAL ‘FOREST’: WERE...
58
CENTRE FOR ECONOMIC PERFORMANCE DISCUSSION PAPER NO. 318 January 1997 MARSHALL’S ‘TREES’ AND THE GLOBAL ‘FOREST’: WERE ‘GIANT REDWOODS’ DIFFERENT? L. HANNAH
Transcript of MARSHALL’S ‘TREES’ AND THE GLOBAL ‘FOREST’: WERE...

CENTRE FOR ECONOMIC PERFORMANCE
DISCUSSION PAPER NO. 318
January 1997
MARSHALL’S ‘TREES’ AND THE GLOBAL ‘FOREST’:WERE ‘GIANT REDWOODS’ DIFFERENT?
L. HANNAH

ABSTRACT
This essay examines the fate of the 100 largest industrial firms in theworld in 1912 over the period to 1995. Disappearance and declinewere the most common outcomes, but a few outstanding performers —firms like Burmah / BP and Procter & Gamble — left descendants eightor nine times their initial size, in “real stock exchange price” terms.There were no significant differences between the performance of giantGerman, British and American firms, other than a slightly greatertendency to disappear among American firms. The convergence ofnational performance of giant firms is probably related to convergingstrategies and structures of such firms in advanced industrial countries.Long-run differences in national economic performance in thetwentieth century, at least among industrial leaders, are rootedelsewhere: in non-industrial sectors of the economy or smallerindustrial firms. The analysis of the long-run evolution of giant firmsalso suggests that, while firms in “old” industries on average performedworse than those in “new” ones, the 1912 population included equalnumbers of each and there was, in any case, greater variability ofoutcomes within than between industries. No simple formula enablesus to discriminate ex ante between long-run corporate success andfailure, for reasons inherent in the nature of modern corporatecapitalism’s success as an economic system.
This paper was produced as part of the Centre’sProgramme on Corporate Performance

MARSHALL’S ‘TREES’ AND THE GLOBAL ‘FOREST’:WERE ‘GIANT REDWOODS’ DIFFERENT?
L. HANNAH

JANUARY 1997

Published byCentre for Economic Performance
London School of Economics and Political ScienceHoughton Street
LondonWC2AE 2AE
©L.Hannah
ISBN 0 7530 0984 6
MARSHALL’S ‘TREES’ AND THE GLOBAL ‘FOREST’:WERE ‘GIANT REDWOODS’ DIFFERENT?
L. HANNAH
Page
1. The Problem 1
2. A Proposed Test 3
3. Did Giant Firms Grow or Decline (1912-1995)? 8
4. National Differences in Corporate Performance 13
5. Are there “Sunset” and “Sunrise” Industries or“Sunset” and “Sunrise” Firms? 15
6. Which National Differences wereMost Sustainable? 19
Endnotes 23Tables 31Appendix A 36Appendix B 40References 41
The Centre for Economic Performance is financed by the Economicand Social Research Council.
ACKNOWLEDGEMENTS
This paper was presented at an NBER Conference, Cambridge,Massachusetts, 19 October 1996.
I am grateful to the Centre for Economic Performance for funding andto Nick Crafts, John Kay, Danny Quah, John Sutton and othermembers of LSE seminars and the editors for helpful criticisms ofearlier drafts.
Leslie Hannah is Pro-Director of the London School of Economics anda member of the Centre for Economic Performance.
MARSHALL’S ‘TREES’ AND THE GLOBAL ‘FOREST’:WERE ‘GIANT REDWOODS’ DIFFERENT?
L. HANNAH
1. THE PROBLEM
How can we generalise from the case studies in this volume? Howrepresentative are they? Are alternative post hoc rationalisationsequally plausible? In altered circumstances, (inherently unpredictableat the time) would different outcomes have been observed? Many ofthese questions are unanswerable the lessons of the cases are often suigeneris, the counterfactuals are unknowable, the data for comparablefirms are unobtainable or no such firms exist. This does not mean thatcases cannot enrich our understanding, but it has sometimes ledfrustrated business historians to claim rather more for their craft thanis justifiable. This essay reviews some of their problems and suggestshow we might focus their research on areas where significant progressis most likely. It addresses, particularly, the experience of large firms,in the context of differences in national industrial systems andperformance outcomes.
Writing at the time that large corporations were being built on anunprecedented scale, Alfred Marshall felt the need to modify hisfavoured analogy of firms in the economy as trees in the forest. In hisfirst (1890) edition of the Principles of Economics, he had suggestedthat, like trees in the forest, there would be large and small firms, but“sooner or later age tells on them all”. However, by the 6th edition of1910 he was cautioning that his earlier sentence could appropriately beput in the past tense, for “vast joint stock companies ... often stagnate,but do not readily die” (Marshall, (ed Guillebaud) 1961, p.316).Marshall was an acute observer of the contemporary real economy inBritain, Germany and America: he would not have modified his viewwithout substantial evidence that the Giant Redwoods he observed inthese economies were qualitatively different from the nineteenthcentury firms on which he had based his generalisations of two decadesearlier.

2
The work of business historians — even those who profoundly disagreewith Marshallian perspectives on industrial economics — has generallyconcurred with his view that something new was happening in thetwentieth century corporate world. Chandler (1990) and Lazonick(1991), for example, have suggested that large corporations, by thebeginning of this century, built significant technical, organisational andmarketing capabilities, thus acquiring often unassailable first-moveradvantages, so that they generally still dominate the global oligopoliesthey first created. The purpose of this essay is not to question whetherthey (and Marshall) were right, for they clearly were, but rather toestablish the degree to which the traditional analogy of rising anddeclining trees, or the implied new one of Giant Redwoods with acharmed life, perhaps of centuries rather than decades, best describesthe reality of the modern corporate economy. We will suggest that —on the evidence of the century so far — there is some life in the oldview and that understanding where and why helps us diagnose thenature, strengths and limits of dynamic organisational capabilities.
Scepticism about corporate capabilities is not universal amongbusiness historians. The tendency to over-emphasise successes (and torationalise them ex post) — what has been criticised as the “Whig”misinterpretation in the context of political history — is chronicallyendemic among them, as it is also among businessmen and managementconsultants (see eg Hamel and Prahalad, 1994). It commonly co-existswith the conviction that they have found the unique recipe forrectifying the failure of firms or countries (a trait particularly well-developed in the Anglo-Saxon world of one-time leaders that haveallegedly failed). I believe that some of the insights this process hasgenerated have been valuable: it has, for example, helped us tounderstand the role of corporate learning and organisationalcapabilities in generating asymmetries between firms that provide a keyto understanding competitive performance. Like Monsieur Jourdainand his prose, “new” industrial economists and business historians arenow beginning to formulate explicitly what thoughtful businessmenhave long implicitly understood about the limits of the simpler,

3
neoclassical models of “old” industrial economists. The followingcomments are not intended to undermine that endeavour, but toreinforce it by disciplining some of its more adventurousgeneralisations.
2. PROPOSED TEST
The over-use of the survivor technique, distorting our understanding ofthe process that has led to the present state of things, has affectedseveral disciplines besides business history. If we merely observe thatmany of the firms that now dominate the economy are of ancientlineage1, or that some of today’s top firms were also at the top acentury earlier, we might conclude that giant firms are generally longlasting; yet the stated observation is equally compatible with thehypothesis that some initially small firms grow rapidly to become large,while corporate giants have, over reasonably long periods, a poorsurvival rate. Our current knowledge of survivors dominates ourimpression of the typical experience and their triumphs are lionised;while the history of the failures is forgotten or considered untypical.
The first step in rectifying resulting misinterpretations has usuallybeen to examine a population of firms defined ex ante. For this essayI have extended Schmitz’s (1993) work, to generalise about the globalindustrial giants of 1912. While there are no doubt still someomissions, I believe the amended list in Appendix A below includesalmost all the industrial (mining and manufacturing2) firms in the worldwith an equity market capitalisation3 of $26m or more in 1912. Thesewere large firms even by today’s standards: the largest (US Steel)employed 221,025 workers in 1912; other firms on the list typicallyemployed more than 10,000.4 They were also, generally, firms thathad already stood the test of time, being on average 32 years “old” inthe corporate sense, and often much longer established as partnershipsor earlier private firms. They were not the outcome of temporary stockmarket bubbles: these were the survivors of a brutal shake-out process

4
after the global turn-of-the-century stock market booms and mergerwaves, in which many giants with watered stock but few capabilitieshad drastically declined (Livermore, 1935; Lamoreaux, 1984; Hannah,1975; Tilly, 1982; Samber 1997). They were, on the whole, firms thatcontemporary stock market analysts considered attractive and safebecause of their consistently reliable record of generous but sustainabledividends (Meyer 1910, p.196). A population of 1900 giant firmswould almost certainly show earlier exits and faster rates of declinethan this population of maturing “Giant Redwoods”.
In order to assess their propensity to decline or develop, it wasnecessary to devise a comparable measure of the size of the 1912 firmsin 1995. Equity market capitalisation is again available for survivors,but, the comparison needs to take account of inflation. The deflator Ihave used is US stock market prices, more specifically the Standard &Poor industrial ‘500’ index. The rise in US stock prices (measured thusbetween 1912 and 1995 and averaging about 6% compound per year)clearly partly reflects the declining value of the dollar (averaging 4%per year between 1912 and 1995) but also some real growth. It seemsappropriate to use a deflator that also captures the fact that even firmsmerely sustaining their market position would have participated in thisgrowth, which in the OECD countries has, over the century as a whole,attained levels just above 2% per annum per caput, with some extensivegrowth in the number of industrial workers also (Maddison 1981,p.15).
One intuitive interpretation of the 1995 equity marketcapitalisation, thus revalued “at 1912 Stock Exchange prices”, is thatit reflects the difference between how the long-run strategy of the 1912managers actually turned out and what they would have left posterityif they had instead decided they had no distinctive capabilities, retiredand handed their assets to a hypothetical index-matching fund manager.If the 1912 and 1995 values were found to be equal, it would implythey would have lost nothing (except their managerial incomes) if theyhad followed that path, while a ratio of 1995 to 1912 “size” below 1would suggest that giving up in 1912 would have been a better bet. A
5
ratio above 1 would suggest that, in the long-term, the firm’scapabilities were broadened (eg by extensive growth into widergeographic or product space) or deepened (by adding new competitiveadvantages, perhaps from R&D, or branding).
This appealing intuition should not be pressed too far, however.A sell-out in 1912 of firms of this size, even where possible, would notnecessarily have been at the market price: break-up values were lessthan the going-concern values reflected in the market price; buttakeover values could be higher. Equally the ratio of 1995 to 1912 sizeshould not be taken as a measure of investor returns: that would requirean analysis of the intervening dividends (and other flows to and fromshareholders), which could have seen higher or lower than theStandard & Poor average. In principle, investor returns could be bettereven if no firm existed at the end: a monopoly well-milked is better forinvestors than a residue of unprofitable corporate assets.5 By the sametoken, a firm may have been under bankruptcy protection, severelycompromising its equity investors’ assets, but still remain large-scale,reflecting its other capabilities rather than temporary financialmismanagement or ill-luck. A recent example is Texaco, which wasunder bankruptcy protection in 1987, but still retains significantcapabilities and, by our measure, is the fifth best performer of thehundred 1912 giants. Several German firms have also had parallelexperiences in their frequently disrupted and dismembered nationalpast. Our concern is not the outcome for investors, but rather thesurvival, development or decline of capabilities embodied in the firm.In that spirit we are primarily interested in the “size” of the 1995 firmrelative to that of 1912: the 1912 firm’s adjusted 1995 stock marketvalue reflects in some sense whether the “lump” of corporatecapability, defined by the boundaries of the firm, has grown ordeclined.
Of course that size will have been affected by many factors otherthan its assets in 1912 and the skill with which its 1912 managers thendeployed them.6 Market position and scale often conferred first-moveradvantages, but the competitive process was one of continuous

6
movement, not just initial position: the capabilities needed (and theirpotential usefulness in the marketplace) were naturally transformedover time. New corporate resources were also added, not just in waysindirectly captured in our Stock Exchange price deflator (eg reinvestedprofits), but by new capital issues or new stock issued for firmsacquired (and acquisition activity was one to which many of these firmswere strongly prone). By implication, we assume all of Unilever’s“organisational capability” came from the British half (Lever Brothers)not its Dutch half (Margarine Unie), while DuPont’s stock of skillsimplicitly came entirely from its chemical rather than oil company(Conoco) heritage. Because of stock issued to finance such mergersand acquisitions or to finance internal expansion, stockholders willprobably have done worse than our measure of changes in the “lumpof managerial capability” suggests.7 In that sense, adopting a ratio of1 between the 1995 and 1912 values as the threshold definingcorporate capability enhancement (rather than decline) should beconsidered a very weak test, biased in favour of diagnosing corporategrowth. We will be making simple, comparative, long-run judgementsand our choice of deflators and benchmarks is usually biased againstthe hypothesis being tested.
There are two remaining problems of the capability survival testfor our 1912 giant firms: identifying the precise ‘heir’ of the 1912 firm,and dealing with giant firms that were themselves taken over orotherwise ‘disappeared’ between 1912 and 1995. Some arbitraryjudgements are inevitable — the genetic descent of corporations is lessunambiguously defined by economic than by human reproductiveprocesses — but we have tried to apply standard rules to resolvedifficult cases. Corporate descent is defined in organisational (ratherthan legal or technological or marketing) terms. The successor firm ofAmerican Tobacco is American Brands, even though it no longer sellstobacco in America and recently disposed of the subsidiary bearing itsoriginal name in that business.8 Considered strategic decisions tochange business lines are accepted as the corporate destiny: AmericanCan is now Travelers Group (not part of the Triangle Group that

7
bought the can-making subsidiary), Singer is now Bicoastal (not theHong Kong-Bermudan sewing machine and computer company thatlaboriously re-assembled a world-class sewing machine business, thatSinger’s managers had believed had no future and broken up).9 Wheremergers have been reversed, the intervening life is ignored: Bayer is thesuccessor of Elberfelder Farbenfabriken (the intervening IG Farbennotwithstanding), Zeneca is the successor of Brunner Mond (theintervening ICI notwithstanding). Where voluntary demergers haveoccurred, the larger core is taken as the continuing firm. However,when demerger derived from government action, large resulting entitiesare credited as joint successors: Du Pont became Du Pont plus Herculesand Atlas, Lothringer Hüttenverein became Knutange and Klöckner,Burmah is now Burmah Castrol plus BP, Western Electric is nowLucent Technologies plus Northern Telecom.10 Firms may leavearchaeological remains — as in the survival of the Armour and Swiftbrand names as a small part of a subsidiary of Conagra — but bothfirms are (reasonably) judged no longer to exist.
Yet some firms that have ‘disappeared’ into a larger entity retainsubstantial, separately identifiable, capabilities in “quasi-firms”, clearlyderiving from the 1912 entity. The National Biscuit Company istraceable in 1995, but had ‘disappeared’ into RJR Nabisco; similarlyImperial Tobacco is now a division of Hanson Industries. In both casesthe larger entity built on the surviving capability of the acquiredcompany and sometimes recognised its independent viability. Indeed,in these two special cases, both parents were discussing demerger oftheir subsidiary, so that it would again become an independent firm.Clearly such cases on the verge of corporate “reincarnation” aredifferent from a 1912 firm that had truly “disappeared” in the sense ofbeing liquidated (eg Central Leather), sold at a price reflecting long-run decline (eg Pullman) or acquired from bankruptcy protection by anoptimistic corporation which proved unable to turn it around (egAEG). Valuing surviving subsidiaries or divisions in 1995 as separateentities is problematic: AEG, for example, if valued on the basis ofcapitalising divisional profits, would actually have a negative value

8
(which would probably be too pessimistic an assessment of its survivingcapabilities). We have therefore valued acquired firms at the estimatedprice paid for acquiring their equity11 at the time of their substantivedisappearance12, converting this to “1912 Stock Exchange prices” bythe appropriate Standard & Poor 500 index point, as with 1995survivors. Acquisition prices are usually at a substantial premium tomarket values and, if acquired firms were generally declining13, theearlier date of the acquisition would impart an upward bias, relative tosurviving firms valued in 1995. This measure is, therefore, presentedseparately in our tables. Recognising its upward bias, it will be usedwhen a full sample of outcomes is required or where it is clear that itis biased against the hypothesis being tested.
A final problem is nationalisation. This was, for reasons notunconnected with their size14, a serious risk for the giant firms of 1912.All the Russian, Mexican and French firms in the 1912 list, many ofthe German ones, and parts of some British15 ones were at some stagenationalised and some remain in state hands. Nationalised firms likeBP and St Gobain continued to be managed like private firms and by1995 were privatised, so can be treated in the normal way. GiantRussian companies (of which there were three in 1912) posedifficulties. Nobel Brothers (the only Asian firm in the 1912 list, withSt Petersburg headquarters but mainly Azerbaijani operations) wasexpropriated after the Russian Revolution; the company’s rump ofWestern operations (eg in Poland) was worth little when finallyliquidated in the 1950s. Two other Russian firms in industries with nolarge quoted 1995 successors (one iron and steel firm, the other inrailroad engineering) are also pessimistically treated as declining tozero value. However, where Western firms remain nationalised, wehave taken the 1995 balance sheet assets less any traceable dedicateddebts as a proxy for market value.
3. DID GIANT FIRMS GROW OR DECLINE (1912-1995)?

9
Four-fifths of the giant companies in the 1912 list were based in themajor industrial countries of their day: Germany, Britain, and, aboveall, America, which alone accounted for over half. They had amassedsubstantial assets — physical, human and/or reputational — to becomethe largest corporations globally. Most had distinctive accumulationsof skills, architectures of internal or external relationships, first moveradvantages, economies of scale, scope or experience, or technologicalleads, of a kind that asymmetrically endowed them with competitiveadvantages over other firms. That these were in many cases theoutcome of a path-dependent (and difficult to replicate) process oforganisational learning is also clear. The parables of learning that wehave told16 are prominently represented among the 1912 giants andthey could be replicated many times over. They include WestinghouseAir Brake, whose market power over its railroad customers — then thedominant transportation providers — derived from network standardsetting in which exclusive private ownership (at least in the days beforeMicrosoft) was not common. Some — including Shell, Jersey Standard(Exxon) and Rio Tinto (RTZ) — derived market power from control ofraw material resources or distribution networks, or — like EastmanKodak or Siemens — from popularising new technologies. Others —like Guinness, Procter & Gamble and Lever Brothers — had pioneeredbranded products in mass urban markets.
The business history literature understandably focuses oncompanies such as these which, because they have been sustainedsuccesses, remain familiar to us today. There is, however, a danger inthis perspective of developing a somewhat Panglossian view of giantcorporations as repositories of capabilities which are self-sustaining.Indeed, their long-run success easily reinforces the stronger view thatsuch corporations were able to entrench their existing market positionand also developed organisational routines which reinforced what theyhad already learned, creating dynamic, learning organisations whichwould, through geographical (often multinational) expansion, throughdiversification into new product markets, or through theinstitutionalisation of innovation by R&D, constantly expand the ambit

10
of their capabilities. That some firms — Procter & Gamble, Du Pont,Shell, Siemens and others — did so is undoubtedly true, but howtypical were they? That question is rarely answered in relation to apopulation defined at the start of the process, rather than by theremembered survivors.
Yet who now remembers German giants of 1912 like HohenloheIron & Steel, British ones like Metropolitan Carriage or US ones likeCentral Leather, the Nevada Consolidated and Utah Copper group orCudahy Packing? And when firms that have drastically declined, likeUS Steel (now USX Marathon), are remembered, it is usually asexemplars of their failure to expand their capabilities, as elephants thatdid not learn to dance in a world in which corporations (if they arewise or well-advised) normally do.
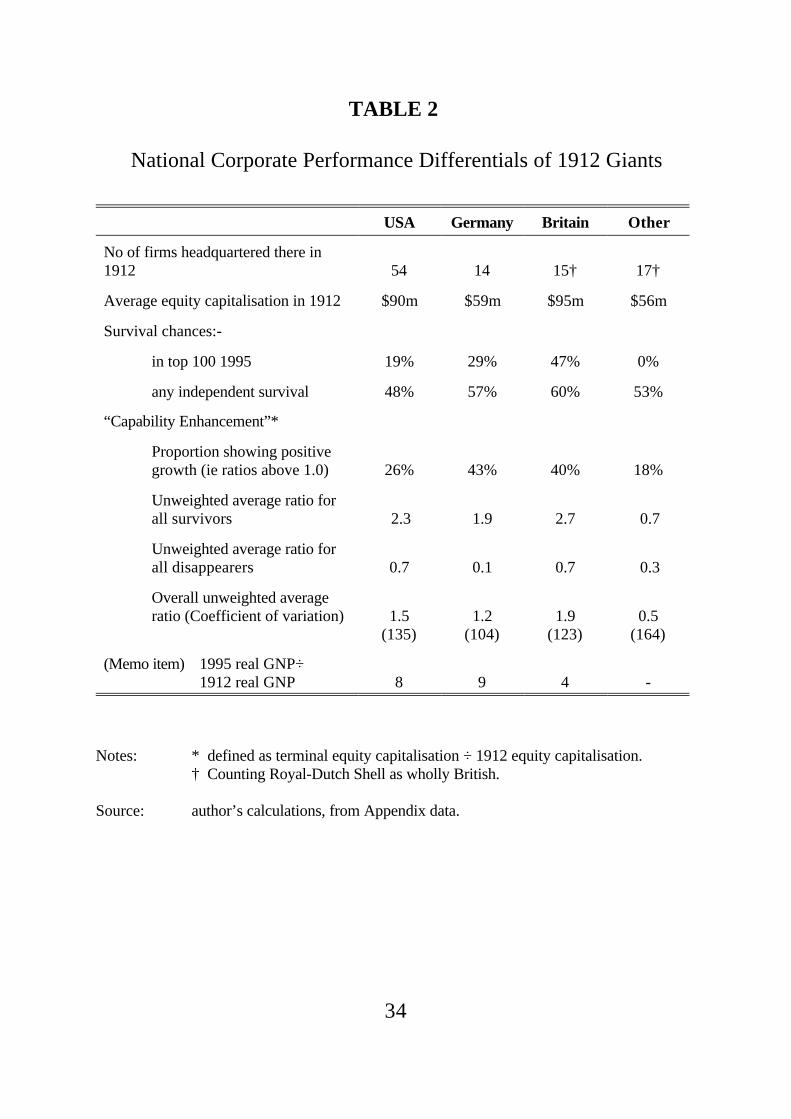
Our 1912 population — and our tracking of the outcomes by1995 — enable us to judge how typical the firms we remember are,relative to those we have largely forgotten. Is it easy to expandcorporate capability (whether at the terminal date of 1995 or by earlierexit at a respectable size) or are cumulative corporate learning andcapability expansion difficult tricks for giant firms to pull off? Table2 indicates that just over a quarter of the firms did both remainindependent and experience growth and just over a fifth managed tostay in the top 100 by market capitalisation in 1995. Yet suchfavourable outcomes were less common for giants than either corporatedisappearance or experience of bankruptcy or a close shave with it.17
Nearly three-quarters of the 100 giant firms had disappeared or weresmaller in 1995 than in 1912. The average giant firm, it is true, waslarger in size in 1995 (or on its earlier disappearance) than it had beenin 1912, but this average was heavily influenced by the few cases ofexceptionally strong growth18, less than a third of companies showedpositive growth, and the modal ratio was zero. Overall, in this highlyskewed distribution, the ratio of terminal to 1912 values was,depending on the assumptions made, between 1.1 and 1.4 whensomething around 3 was required to stay in the global top 100

11
industrial firms.19 The dominant tendency to experience decline wasparticularly marked among the larger of the 1912 giants.20
To extend Marshall’s analogy of the population of firms as the“trees of the forest”, the Giant Redwoods among them were in thelong-run prone to death and decline, and the super giants more thanmost. Economists are notoriously shy about defining what they meanby the long-run, but it is certainly a shorter time in economics than insilviculture: we are talking about corporate “redwoods” with a distinctpropensity to die over decades, not the centuries of their naturalcousins. The “quarter-life” of the 1912 giants (ie the time taken for aquarter of them to disappear in bankruptcy, nationalisation or merger)was thirty-three years, and they are, as we approach the millennium,now hovering around their half-life.21 The time elapsed since 1912 —eight decades or so — is not much longer than the business “half-life”of a single human being22, though, of course, personally-managedbusinesses generally had much shorter average life spans than this.Small firms certainly have shorter average lives than giant firms23 — itusually takes longer to walk down a mountain than to roll off a hillock— but both large and small firms commonly die. They differ only inthe length of time they take and, even in that respect, by surprisinglylittle: to raise a joint stock company’s half-life by one year, it isnecessary to increase its size by twenty-three times.24 The propositionthat it would be possible to fritter away $3b (much less $90b) in ahuman lifetime is one I personally find daunting, but business leadersare evidently made of sterner stuff. Three billion dollars is the value(in 1995 stock exchange prices) that the market placed on the smallestof these firms’ “lump of capabilities” in 1912 (and $90b that of thelargest); yet overall these firms barely increased their value, many haddecimated it or dissipated it completely. The supposedly exceptionalturbulence in corporate rankings (now modishly asserted bybusinessmen to have followed the liberalisation of world trade, oilcrises and the spread of industrialisation) is in fact also observed in theearlier periods of increasing national autarchy and relative economicstagnation. Corporate dinosaurs are ubiquitous in an ever-changing

12
world. As the old English music hall joke had it: Q. How do I build asuccessful small firm? A. Easily! Buy a large one and wait!
One interpretation of the strong tendency to stagnation or declinewould be that it was the rational strategy of dominant firms pursuingshareholder profit-maximisation, a point argued for US Steel’s earlydecline by Stigler (1965). Rather than set an entry-preventing price, itmay be sensible for dominant firms to milk their monopoly positionwhile yielding market share to competitors. This was particularly likelywhere it helped firms appear respectable to anti-trust authorities,especially when rivals thus indulged respected price levels. Casualinspection of the business histories of the declining firms in thispopulation suggests that planned decline was rarely their explicitobjective, though it may have been implicit in their muddled reactions.We have not investigated overall stockholder returns, but the generalimpression in these companies’ histories is of depressed profitsdesperately used by managements to paper over the cracks of decliningcapabilities, not of generosity to stockholders during a pre-plannedyielding to competitors of market share they could not have expectedto keep. Stigler’s hypothesis could clearly be investigated further, butit appears unlikely to account for more than a small proportion of the1912 giants’ propensity to reduce their size.25
The implications of these observations for industrial economistsare clear. While we naturally focus on success — on corporations thatdid learn to expand or sustain their capabilities — this is not somethingthat giant managerial hierarchies have normally been very good at. Infact the alleged twentieth century tendency to increased industrialconcentration is by no means universal or sustained in all nationalmarkets (Hannah, 1995) and probably is quite mild on a global basisalso.
The implications for the parables that business historians tell andfor understanding individual corporate evolution are that we should beas sensitive to the sources of eroding capabilities as of their building.Corporations can forget as well as learn; their inherited learning canbecome redundant (or even dysfunctional) in a changed environment;

13
“first mover” advantages appear fleeting; supposedly distinctivecapabilities can be replicated or improved upon by competitor firms.26
Such outcomes appear to be twice as common as successful expansionof capabilities for giant corporations.
Clearly if we could distinguish ex ante what determines how firmscan beat the normal form and do well, we could change the balance ofeconomic evolution and (presumably) become very rich men. Thereader will not, then, be surprised that it is in fact very difficult to doso, and that those who have so far been brave enough to attempt it arequite unconvincing. While this population of firms is not large enough— given the variability of outcomes — to generate many statisticallysignificant results27, it does enable us at least to call in question somegeneric recipes for corporate success, even those generated withhindsight. If ex post “prediction” is difficult, we can be reasonablycertain that ex ante prediction will pose a few problems; the strategicmanagement consultants we should most respect are the modest ones.
4. NATIONAL DIFFERENCES IN CORPORATEPERFORMANCE
Perhaps the most widely believed systematic model of corporate failureis Chandler’s recent international comparison, invoking Britain’sfailure to develop professionally managed, large, corporate hierarchiesas a reason for Britain’s twentieth century economic decline, relativeto Germany and the USA (Chandler, 1990). This thesis is appealinglygrounded in a compelling argument about corporate capability, but itsvigorously stated comparative perspectives are vulnerable from anumber of angles (Alford, 1994; Hannah, 1995). Our population of“Giant Redwoods” certainly provides no support for the hypothesisthat large British firms were less likely to sustain their capabilities thanGerman and American ones. Indeed, as Table 2 suggests, the reverseis true: British firms were more likely to survive, more likely to remain

14
in the top 100 and averaged a higher degree of capability expansionthan American or German ones.28
These results invite speculation rather on British advantages as ahome for corporate Giant Redwoods29, particularly when viewed inrelation to the markedly inferior growth performance of the UKeconomy for many decades after 1912. The British giant corporationsperhaps had more staying power because in 1912 they were domiciledin a free trade country, while American corporations were substantiallyover-protected by high tariffs and German ones moderately so (Capie1994, p.59): British 1912 capabilities were thus already disciplined bymore stringent (because more global) market tests. British giantcorporations also tended already to spread an unusually highproportion of their corporate resources globally. Since perhaps a thirdof the British giant corporations’ activities were located overseas in1912, probably twice as much as the average American or Germangiant corporation at that time (Hannah, 1996), they were lessconstrained by their home market performance and already more fittedto compete globally.
However, it would be a mistake to pursue such speculations veryfar. Our results are sufficient to cast doubt on the notion that therewere exceptionally few large British corporations or that they wereespecially notable for failing to sustain or develop their capabilities, butthey are vulnerable to highly variable individual outcomes on smallnumbers of cases. They add to the suspicion that Chandler started awild goose chase in Scale and Scope, and his conclusions on nationaldifferences are unlikely to be rescued by wider samples including more,moderately large, industrial firms.30 Broadberry (forthcoming) has, inany case, shown that America and Germany overtook Britain in thetwentieth century not by maximising their relative labour productivityperformance in manufacturing, but rather by shifting resources out ofagriculture (an option not open to already heavily industrialisedBritain) and by overtaking the exceptionally strong British labourproductivity performance in services. (For one example of USperformance see Raff and Temin (forthcoming); for a general discussion

15
see Wright (forthcoming).) Broadberry’s sectoral disaggregation ofproductivity change thus further undermines the view that nationaldifferentiation in the performance of manufacturing corporationsfundamentally drove twentieth century changes in national competitiveadvantage. More generally, Robert Reich has exposed some flaws inthe view that the national corporate champions and the economies ofnation states are closely coupled (Reich, 1992; but cf Lazonick, 1996).Nor can the possibility be ruled out that vigorous competition ofsmaller firms displacing giants, not sustaining the first-mover giantsthemselves, is the primary sign of a vigorous economy and that thisdifferentiates Germany and America from Britain more than their largecorporations.
If business historians devote more attention to national differencesin large corporates’ performance, they should formulate some clearerhypotheses that fit the facts better. Until then it would be best toassume that nationality is not a significant variable in the performanceof large corporations at least among industrial leaders. Some of themethods of successful large corporations and nations31, and — it seemsreasonable now to add — some of the mistakes of unsuccessful ones,appear to be equally easily replicated or spread.
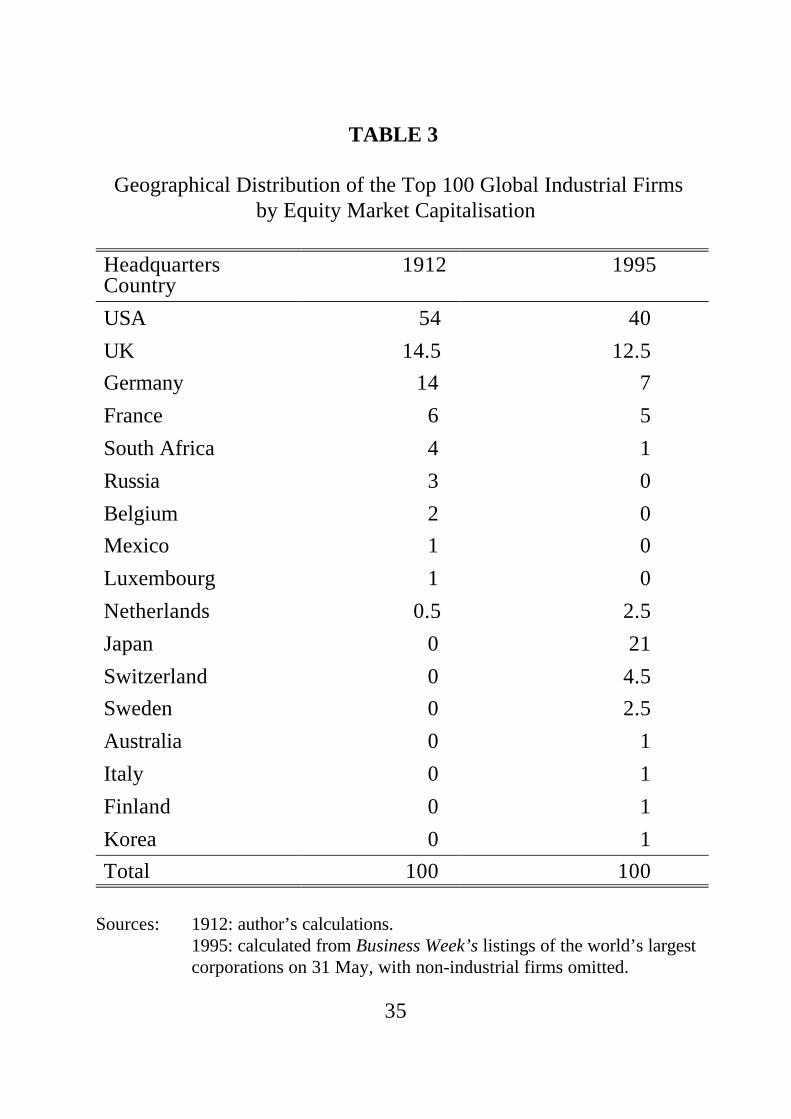
As Table 3 suggests, more countries host the giant industrial firmsof today than in 1912, though the newcomers have mainly entered atthe expense of the USA and of Germany not of Britain.32 Weevidently have to look elsewhere than giant corporate performance todifferentiate successful from unsuccessful nations. We will return laterto the question of more plausible candidates in the analysis of nationaleconomic differentiation.33
5. ARE THERE “SUNSET” AND “SUNRISE” INDUSTRIESOR “SUNSET” AND “SUNRISE” FIRMS?
The various industries in which the giant firms of 1912 wereconcentrated appear at first sight to have exhibited more consistent

16
patterns of performance than their nationality.34 As Table 4 shows,about half the firms are in five industries — coal mining, textiles andleather, non-ferrous metals and other mining, iron and steel (andrelated heavy industries) and mechanical engineering — in which theaverage firm had substantially declined in size at the terminal date,very few giant firms increased in size and only one (RTZ) remained inthe 1995 top 100. The “successes” in these “old”35 industries oftenachieved it by selling out early (eg the railroad equipmentmanufacturer, Metropolitan Carriage, in 1919 with a ratio of 2.0);others succeeded in their core old activities as well as new ones (egMannesmann, with the best ratio for this group of industries of 2.7 in1995). A few well-performing survivors shifted industry completely:eg American Can into financial services (with a ratio of 1.9) or theFrench steel giant Schneider into electrical engineering (achieving thestability ratio of 1.0). Such “new” industries undoubtedly offeredbetter growth opportunities but, of course, many of the “old” 1912industries did not have any relevant capabilities to transfer to them inorder to escape constraints in individual markets. Judging from giantfirms in coal, textiles and railroad equipment manufacture, the speedor degree of the collapse of their markets and/or the limitations oninter-industry transfer of their capabilities of 1912 posed particularlytough obstacles. The most promising solution for such firms may havebeen the absorption into other firms that many of them suffered,presumably to maximise the value of what few transferable skills theystill embodied.36 By the same token, firms that were in 1912 alreadyin the rapidly-growing industries of petroleum, chemicals and electricalengineering (industries whose giant firms more than doubled in real sizeon average) perhaps had a somewhat easier task in converting theirinitial stock of skills and building dynamic capabilities. Brandedproducts firms — the most numerous of the “new” industries in the1912 list — were also more likely to grow than to decline.
However, it would be wrong to suggest that giant firms hadclearly pre-destined outcomes depending on their initial “sunrise” or“sunset” industry base. In fact, there was more diversity of

17
performance within industries than between them.37 Even in anindustry as promising as electrical manufacturing — where three out offive firms scored above 1 — Westinghouse (0.7) and AEG (0.3)performed weakly. Oil companies overall did well, but relativelaggards, when nationalised or taken over, could be below their 1912size. The branded product firms include some of the great twentiethcentury successes like Procter & Gamble (8.2) or Lever Brothers(Unilever) (3.4) but also some of the more remarkable failures likeAmerican Tobacco/Brands (0.4) or Cudahy Packing (0.1). In industrieswhere decline was the typical outcome — like the steel and relatedengineering industries — not all had to go the way of US Steel (0.1),International Harvester (0.1) or Krupp (0.2); Gewerkschaft deutscherKaiser (Thyssen) (0.9) and John Deere & Co (0.9) did distinctly better.As the last column of Table 4 shows, both old and new industriesshowed considerable variability of growth outcomes: the coefficient ofvariation exceeded 60 in all industries and exceeded 100 in half ofthem. This pattern of diversity of experience within industries isconsistent with the pattern revealed by wider samples of firms overshorter periods (eg Schmalensee, 1985; Rumelt, 1991). Dynamiceconomies — of which the global economy in which most of thesefirms in varying degrees operated is the largest case — indeed consistof rising and declining industries, but businesses can develop andsustain competitive advantages in either kind of industry. Simplisticrecipes for industry portfolio management may have earned consultantsfortunes, but a surer key to sustained success is learning to operatedistinctively and profitably anywhere, rather than paying expensivelyfor fashionable diversifying acquisitions in industries in which nodistinctive new proprietor value can be added (Kay, 1995).
How, then, can large corporations retain their positions, continueto add value and expand their capabilities? The only reasonableanswer is: with great difficulty. Samuel Johnson’s view, that “businesscould not be managed by those who manage it if it had muchdifficulty”, has often appealed to academic analysts and is probablytrue of the generality of businesses; but the generality of businesses —

18
in the short- or long-term depending on their initial size — are dead.It is a pleasant conceit of us all — from business school professors,through academic analysts to management consultants — that theworld would be a better place if systematic analysis could change that.Given the high incidence and costs of corporate decline and failure —and the distance of the spectre of global domination by a fewexceptionally competent firms — it is doubtless in the social (as wellas the private) interest that all possible steps should be taken toencourage such systematic analysis. To date, however, we have madegreat strides in storytelling, but a clearer, surer recipe for sustained38
success for large corporations has remained elusive.This outcome is not accidental: it is inherent in the competitive
market process that underpins the success of twentieth centurycapitalism. Most of the companies we have described were remarkablesuccesses in 1912; their high stock market valuation reflected theirability to earn super-normal profits. These profits were often a rewardfor large-scale investments in production, management and marketing,along the lines described by Chandler (1990). There was oftensomething more — a technological advantage, exclusive possession ofraw materials or of valuable distribution networks, a strong brandimage — to entrench the position of the first movers in the Chandleriansense. Yet, as Lieberman and Montgomery (1988) have emphasised,such advantages are often fleeting and contingent. Patents were oflimited effectiveness, advertising built up rival brands, new mines andoil wells were discovered, techniques of management, production andmarketing were copied. Even where this could not easily happen,exogenous changes in the technology of production or in the nature ofmarkets could make the initial advantage insecure; entrenched positionscould also be challenged by anti-trust or by expropriations (bothnationalisations and those following defeat in war).
Where such challenges were ineffective, or where they wereneutralised by the firms’ own strategic initiatives, the giants survived,but, given the power of competitive forces, it is arguably no surprisethat disappearance or decline was nearly three times more likely among

19
the giants than growth. The process of copying was one that oftencompeted the profits of the onetime leaders down to normal levels,spreading the benefits of their initial advantage more widely. Firms thatlimited this process and maintained some competitive advantage oncecould, in principle, have had a run of further luck that enabled themconstantly to entrench new capabilities. A more plausible explanationof survivors is that they had some distinctive architecture whichenabled them — but not others — constantly to replicate their earlysuccess (Kay, 1993). Such corporate architectures must be complexand difficult to identify, describe and copy, for, if that were not thecase, their value would be competed down by emulators. Bydefinition, we do not know what those architectures are, though it isplausible that their corporate operators have acquired that knowledgethrough a process of collective, tacit learning, transmissable betweenmanagerial generations.
This points up starkly the catch-22 of their craft for all businesshistorians and management gurus. They naturally view that bleakscientific point sceptically, as the fund manager views the financialeconomist’s “efficient markets hypothesis”, with which it has closeaffinities.39 It is perfectly possible, in both cases, to discover agenerically effective strategy, but, when we do, its profitability will becompeted down by the emulation our discovery prompts. The gold wehave unearthed will very soon turn into the dross of normal profits, asits benefits are widely spread, but the private dross represents the broadsocial benefit of expanding average capabilities.
Both the incentive to develop competitive advantages, and theincentive to emulate them, were strong in the societies in which thegiant firms of 1912 operated.40 Large firms themselves became veryefficient surveyors of the possibilities, increasingly competing with andemulating each other. In that sense, the averagely weak ability of largefirms to develop the distinctive capabilities that had once generatedtheir size is a sign, not of their individual weaknesses, but of theircollective strengths within the capitalist market system. Marxunderstood the ‘contradictions’ in this dialectical system well.

20
Paradoxically, capitalist firms are induced by the search for surplusvalue (supernormal profits) to grow; but competition between themalso tends to destroy the distinctive sources of supernormal profits.Marx’s mistake was to consider this a weakness in the stage ofeconomic evolution he then saw unfolding. In fact, the mix ofincentives and checks it created has been capitalism’s fundamentalstrength as the (now globally favoured) system of social organisation.
6. WHICH NATIONAL DIFFERENCES WERE MOSTSUSTAINABLE?
If that view of the world is accepted, we might expect internationaldifferences among giant firms to diminish in all except a few cases ofwell-entrenched or undiscoverable competitive advantages. We can seesome of this process in the chemical industry, which accounted for tenof the world’s largest 100 industrial firms in 1912 and for twenty in the1995 top 100. In 1912 the chemical giants of Britain, Germany andAmerica were substantially differentiated. The Germans — withexcellent universities and moderately-paid scientists — were strongestin the research-intensive sector, where these cheap human resourceswere a particular advantage, that is in fine chemicals (then mainlydyestuffs). The British, with plentiful and cheap supplies of capital,excelled in the capital-intensive sector. The major technologicalinnovation in this sector, the Solvay process, had been licensed by itsBelgian owners to separate British, US and German companies: ofthese, only the British firm, Brunner Mond, was large enough to enterthe top 100 (the other licensees, Deutsche Solvay and the US-basedSolvay Process Company, though operating in bigger national markets,were less profitable). The largest US chemical firm was Du Pont, anexplosives specialist, with its national market among mines and gun-owners larger than European equivalents (the London-based NobelDynamite Trust had a near-monopoly in both the British and German

21
explosives markets, but was still just too small to qualify for entry tothe 1912 list).
However, these superficially strong national differences amonggiant chemical corporations were short-lived. Du Pont had already in1912 begun to focus its research and development strategy, so that itwas poised to become an engine of growth and diversification for thecompany nach deutscher Art (Hounshell and Smith, 1988). In thenext quarter century, the somewhat diverse chemical giants of Britain,Germany and America all became very much more like each other: asresearch-intensive as the Germans, as capital-intensive as the Britishand as market-orientated as the Americans. This occurred partly byexpropriation (notably by the British and Americans of German patentsand other assets) but also by processes of competition and emulationof advantages seen in domestic and overseas competitors. Chemicalengineering and financing techniques, research laboratories, patentpools and multinational investment all played their part in the process.The competitive advantages that had once seemed nationally distinctiverarely remained so. Indeed, with the widespread post-World War IIentry of the oil companies into downstream chemical operations, itbecame obvious that not only rival chemical companies but alsovertically-related producers could copy and acquire the chemicalcompanies’ various research, production and marketing skills. Theprocess was not all one-way, for there were still some good reasons forpursuing distinctive strategies in a changing and complex world41, but,except in the pharmaceutical sector (where, patent protection isunusually effective), it was difficult for companies to entrench anydistinctiveness (and the supernormal profits that brought) for long.
The process of competitive emulation of distinctive advantagesnationally and internationally can be traced more precisely for whathas been seen by many business historians as the distinctive genericcapability facilitating the management of the giant diversifiedcorporations that allegedly prospered in the twentieth century world.Chandler (1962) showed the postwar spread of the multi-divisionalorganisation through US industry, after its pioneering in the 1920s by

22
firms like General Motors.42 Table 5 shows that its postwar spreadthroughout the five other major industrial countries was less rapid, but,with only a slight lag, the M-form was widely adopted in Britain, and,soon after, in Germany, France, Japan and even in Italy, which wasnotorious for having relatively few giant US-style corporations.
Yet, in many respects, these countries’ business cultures areundoubtedly profoundly different; the spread of the M-form simplydemonstrates that these national differences are minimised by large-scale business institutions. Techniques of managing large corporations,of harnessing central research laboratories to diversification, or ofadvertising national brands may easily be copied by the largecorporations of one nation from another, or a multinational may enterthe market to spread them. Competition and emulation thus do a greatdeal to homogenise the giant firm sector in reasonably competentadvanced industrial countries.43 In that sense, we should not besurprised at our earlier conclusion that some popular characterisationsof national differences in large corporations appeared to be caricatures,even if (like all good caricatures) they sharply focus on one distortedaspect of the truth.
Where, then, is national differentiation in business cultures andbusiness institutions likely to reside, if it is not in industrial giants?There are, I suggest, two main locations. First, the culturally-embedded characteristics of business are often reinforced by localinstitutions underpinning small and medium-sized businesses: suchessentially localised businesses are inherently less subject to (though,of course, not entirely immune from) many of the pressures forinternational emulation and homogenisation. Well-known examplesin the literature are the German apprenticeship training system (whichunderpins the powerful world market position of German Mittelstandfirms in the engineering industry) and Italian small firm networks(typified by Porter’s (1990) well-known example of Sassuolo’s ceramictiles). Firms may find it difficult to capture the resulting rents — sothey do not generally appear in lists of large firms like ours — but the

23
positive impact on national living standards (and the sustainability ofthe differences underpinning that) are likely to be considerable.
The second likely area of substantial and sustained nationaldifferentiation is in the utilities and communications sectors. Publicownership or state regulation of competitive processes dominate hereand frequently prevent international convergence of institutions andstandards. It seems quite likely, for example, that the USA’s ability toincrease its lead over Britain in living standards in the first half of thetwentieth century was more due to its relative performance in theseservices (in which Britain had an initial lead which was reversed) thanin manufacturing (in which the British productivity gap remainedremarkably stable) (Hannah, 1995; Broadberry, 1998).
Research on contrasts in national economic performance and theirrelationship to business institutions is difficult and not yetsystematically developed. There may be some mileage in furtherinternational comparisons of giant industrial corporations, but, if ourfindings are a pointer, business historians may more productively focustheir research on national institutional differences in other directions.The prize of focussing our efforts accurately is an attractive one: theunderstanding of the microeconomic foundations of themacroeconomic convergence processes that economists have identifiedin the modern economic development of advanced industrial nations,and also of the limits on such convergence processes.

24
1. Harris Corporation (1996) shows that 39% of the Fortune US top500 are more than 100 years old and a further 50% were foundedbetween the 1880s and 1920s. The oldest American firm in the 1912list, Lorillard & Co, can be traced back to 1760. European firms are,of course, generally older: some (relatively small) modern firms hadmediaeval origins and the large French firm St Gobain can plausibly betraced back to the mid-seventeenth century, though it did not takemodern corporate form until the nineteenth century.
2. The study is confined to these sectors because they most clearlyapproximate to being globally competitive in the twentieth century andwe wish to test how corporate evolution in such markets works.
3. A few giant companies (mainly American and German and oftenfamily-owned) had no quoted equity capital in 1912; we have takentotal balance sheet assets, net of any bonded debt, or similar proxies forequity market capitalisation in such cases, noted by a * in Appendix A.We have also treated Western Electric (which had recently become asubsidiary of AT&T) in this way. All nationalised or substantiallystate-owned firms of 1912 have been excluded.
4. These employment figures are provided only for illustrativepurposes. Because the population is defined by a capital measure(equity market capitalisation), some firms in capital-intensive industrieswill be included but employ under 10,000. Employment data is morereadily available for British and German firms than for other countries:see eg Shaw (1983), Kocka and Siegrist (1979).
5. see p.14.
6. For that reason, I would expect correlations between 1912 sizeand 1995 outcomes to be very low; but since much has been made inthe literature of first mover advantages, dynamic increasing returns andthe sustainability of core corporate capabilities, it is worth defining the
ENDNOTES
25
extent of the phenomenon more precisely.
7. eg four of these firms appear on a list of the top ten firms thatdestroyed shareholder value by over-investing in the 1980s (Jensen1993).
8. Such decisions can notably affect the results: the AmericanTobacco subsidiary was sold in 1994 for $1b, whereas at our 1995benchmark the rest of American Brands was worth $8b.
9. While in individual cases this affects the calculated outcome,overall the swings may well cancel out the roundabouts: the alternativeoption would show American Can performing much worse and Singerperforming rather better.
10. However, most problems of this kind have been avoided by ourchoice of dates: 1912 is after the major 1911 divestitures imposed onStandard Oil and American Tobacco and before the major Germanmergers (Vereinigte Stahlwerke and IG Farben) which were laterreversed by allied anti-trust action.
11. Where this was not published in the press at the time, we haveestimated it from market price data at the time surrounding the merger.
12. Some judgements verge on the arbitrary eg where firms weretemporarily absorbed into a larger firm, then de-merged, then latermerged more completely, we have generally taken their laterdisappearance, to preserve some symmetry with our treatment ofsurviving (but once merged) firms.
13. As our data imply. The average terminal ratio of surviving firmswas three times that of acquired ones; and firms acquired prior to 1950had twice the ratio of firms acquired after 1950, see Table 1 andAppendix A below.
14. On the Caligulan principle (“I wish the Roman people had but asingle neck”) governments were more likely to nationalise large firms
26
than small.
15. BP was majority owned by the state for most of its twentiethcentury existence, but not in 1912 or 1995; parts of several other 1912companies were nationalised in Britain but they were left with a rangeof capabilities which have been considered the surviving firms. In somecases (eg Vickers) the effects of nationalisation of large parts exaggeratetheir measured decline.
16. eg Usselman (1997) for Westinghouse Air Brake, Samber (1997)for Pittsburgh firms, Genovese & Mullen (1997) for American Sugar,Lamoreaux & Sokoloff (1977) for Pullman.
17. including nationalisations, which in the longer-run shielded someof these firms from bankruptcy.
18. Only four cases (Burmah/BP 9.1, Procter & Gamble 8.1, DuPont7.2 and Arco 5.9) account for about a quarter of the average ratios forthe whole population shown in Table 1 ( their sum divided by 100 is0.3).
19. To outrank the 100th ranked firm in the 1995 giant industrials,the lowest-ranked firm of 1912 would have had to achieve a ratio of4.0. Of course, much less was required of the very largest 1912 firms:indeed the largest, US Steel, needed to decline to a tenth of its 1912size to drop out of the 1995 top 100. If it had maintained the same realsize, it would have been worth $90.5b in 1995, only a little short ofRoyal-Dutch Shell, the actual 1995 leader (at $107.6b), though USX’sactual 1995 size (even after merging with a 1912 giant oil companyalready twice its own size in 1982) was $8.7b and USX did drop outof the top 100. The average giant firm of 1912 would have had to growto 2.7 its 1912 size to achieve the average size of the 1995 top 100,from $81m to $218m in 1912 stock exchange prices.
20. As is suggested by the gap between the unweighted average ratios(1.4) and the (lower) average ratios weighted by 1912 size (1.2), shown

27
in Table 1.
21. 52 of the 1912 top hundred firms still formally existindependently, though arguably some — eg Singer (Biocoastal) andUnited States Rubber (Uniroyal) — are so small that they are as goodas disappeared. The problem of reincarnation also complicates thecalculation: paradoxically rather more 1912 giant firms still existed in1950 than earlier, in 1945 (largely because of the break-up of I GFarben and Vereinigte Stahlwerke, which in the 1920s had absorbedhalf the German giants of 1912); similarly at least two firms (Nabiscoand Imperial Tobacco) are about to be de-merged from their recentlyacquired parents at the time of writing. Because of such reincarnations,it is wrong to conclude from the longer interval between the quarter life(1912-45) and the half life (-1999?) that the rate of disappearancedeclines over time, though, in the limit, that will become true.Moreover, if economic evolution is Lamarckian rather than Darwinian(and the process of corporate learning clearly implies that), we mightexpect organisational death rates to decline with age, see eg, Hannanand Freeman (1984). In calculating half-lives of giant firms we haveassumed they were born giants in 1912, rather than when founded assmall firms.
22. Demographers do not conventionally use the concept of “half-life” to describe life expectancy, but in advanced industrial economiesthe half-life of an 18-year old male would be about fifty years, seeRegistrar General (1914), Table III.
23. Most studies of new, small firms show a half-life in very lowsingle digits. At the time Marshall began writing, English joint stockcompanies had a half-life of about seven years (Shannon, 1933).
24. In the range between the average English joint stock company andthe average global 1912 giant firm. Around 1885, joint-stockcompanies, whose half-lives are referred to in the previous endnote,averaged paid-up capital of about £60,000 (Jeffreys 1938, p.130),compared with equity market values averaging £16.6m in the 1912

28
global top 100, a ratio of about 1:275. Their half-lives were in the ratio1:12.
25. Even in Stigler’s (1965) study of US Steel, the returns to itsstockholders peaked in real terms 10 years after the merger, in 1911,and US Steel stockholders did worse on average than other steelcompanies for the remainder of his analysis (1912-25), which cover theperiod of this study. The impression of US Steel post-1925 is also notvery favourable to an extension forward in time of the Stiglerhypothesis.
26. See eg Raff and Temin (1997), Hounshell (1997) and, moregenerally, Lieberman and Montgomery (1988), Henderson and Clark(1990).
27. Why not, then, increase the size of the sample? Because this isnot a sample; it is (or is very close to being) the whole population ofgiant firms in 1912. Though inclusion of very large firms in the $15-$25M range would be possible, that suffers from the same problem asthe econometrics of national growth rates and convergence (do wereally want Iceland to have the same weight as the United States?).The truth is that, for assessing corporate or national performance, theworld has not generated enough human experience for us to generaliseeconometrically. Disciplined parables are a more realistic scholarlyobjective. For some indication of the likely results of adding firms ina lower size range to the study, cf n.32, below.
28. The use of the US rather than the British stock exchange index(which rose by less) as the deflator biases the results against British-based firms.
29. Given the poorer performance of larger firms within this samplenoted in Table 1, it might be thought that this would affect nationalperformance; in fact, however, as Table 2 line 2 shows, the averageBritish giant firm was slightly larger than the average US firm andsubstantially larger than German and ‘other’ firms. Cf n.36, below, on

29
the neutrality of industrial composition effects.
30. Teece (1993, p.214) noted that on Chandler’s own data on thetop 200 firms in each country, leading German firms had a lowprobability of maintaining their position, though he was inclined toexcuse it as the effect of war at the 1953 benchmark date for Germany.But Cassis (1997) observes that the poor German performance persistsin longer-run comparisons with the longevity of large British andFrench firms. Chandler’s study (1990 apppendices) of the largest 200firms in each country shows that in 1919-48 the median British firm’senterprise value (equity capitalisation plus value of quoted debt) nearlyquadrupled, whereas in 1917-48 the median US firm only tripled itsbalance sheet assets and 1913-53 the median German firm less thandoubled its balance sheet assets. There are problems in such directcomparisons. The collapse of the mark raises questions about Germanbalance sheet assets at historic cost as a measure of size, while Tobin’sq (the ratio between the equity values used by Chandler to measureBritish firm sizes and the balance sheet assets he uses to measure USfirm sizes) could have varied substantially at the benchmark dates.Nonetheless it is striking that Chandler’s own quantitative data requiresvery substantial correction to generate results consistent with what hisbook purports to explain, and that the only quantitative evidence heexplicitly provides for differential national performance is at themacroeconomic level, the significance of which Broadberry (1998)seriously challenges. This is not to deny that, in some manufacturingindustries, the USA forged ahead of Britain and Germany in the 1940sand after, see eg, Mishina (1997) for the aircraft manufacturingexample.
31. The evidence implicit in Kim (1995), of the spread of industrialcapabilities regionally within the USA, especially from the 1930s, isalso consistent with this suggestion.
32. The numbers are small and too much should not be read intothem. These results, for the whole population of 1995 firms, compared

30
with those in Table 2 for 1912 survivors, imply that, although its 1912giant corporations have not performed well, the USA has created quitea lot of new ones, while Germany has not: the latter’s distinctivemodern industrial strength is correctly identified with the Mittelstand.
33. see Section 6.
34. Though the poor performance of “Germany” and “other” in Table2, relative to Britain, is partly due to their having more giant firms inthe “old” industries. Britain had old industries but eg in coal they wereorganised on the basis of Marshallian industrial districts, with externaleconomies substituting for economies of scale internal to large firms.However, America’s poor performance cannot be explained byindustrial composition: it had the same proportions of giant firms in“new” industries as Britain.
35. Of course they were often considered important and significantindustries at the time: railroad manufacturers were then bigger than carmanufacturers; gold, diamond and copper mines were felt to haveexcellent prospects, as were high-tech armaments and shipmanufacturers. They are “old” only in retrospect.
36. US coal firms were absorbed into firms like Du Pont; in Europethe post-1945 solution was nationalisation (Britain’s National CoalBoard and Charbonnages de France) or publicly-subsidised privatecorporations (Ruhrkohle in Germany): a solution that seems more oftento have expensively delayed decline than facilitated diversification orskill transfer.
37. The coefficient of variation of the average ratios from the nineindustries is 95; thus there is more variation within the majority of theindustry groups (coal, mechanical engineering, non-ferrous metals, etc,iron and steel, and branded products) than between industry groupsand, within the four less variable groups (textiles, chemicals, electricalengineering and petroleum), there is still almost as much variability asthere is between industry groups.

31
38. Though, as we suggest below, much diagnosis and emulation, ofa kind which erodes rather than sustains profits, has occurred.
39. and, as with stock-picking, it is easier to give business strategyadvice retrospectively than prospectively!
40. Or at least in the US, the UK and Germany. The “other”countries — many what we would now call “emerging markets” —actually show the worst performance in Table 2, perhaps reflecting thatthey did not have these social capabilities in such large measure.
41. A recent example is the rise of the British pharmaceutical industryin the last quarter of a century. In 1970 the largest Britishpharmaceutical company rated only sixteenth in the world; now Glaxo-Wellcome is the largest in the world and several others are ranked inthe top 20; even a foreign company like the merger of US Upjohn withSwedish Pharmacia chose to base its new headquarters in London.This change in the British position in research-based fine chemicals isprobably due to the advantages of London as a commercial financialcentre and the availability of cheaper scientists from good universitiesthan the USA and Germany now offer (a similar advantage to pre-1914Germany, though not one that any sensible country would like to baseits competitive advantage on for long, since it implied sustaining lowliving standards).
42. Though Hounshell (1997) suggests the problem of applying it todifferent corporations, eg Ford.
43. Even here, however, note that the adoption of the M-formstabilised in continental Europe and Japan at lower levels than in the“Anglo-Saxon” countries. One plausible explanation is contrasts intheir capital markets: the monitoring processes of M-form head officesmay, for example, be undertaken by universal banks or other agents inless fluid capital markets. Significantly, while in the US and UK apositive correlation is found between profitability and M-form adoption(Armour and Teece 1978, Steer and Cable 1978), no such correlations

32
appear in Germany and Japan (Cable and Dirrheimer, 1983; Cable andYasuki, 1985; and cf Ingham, 1992).

33
TABLE 1
Summary Measures of Long-Run Corporate “Performance” of the100 Largest Firms of 1912 by 1995
Probability
Survival - in top 100 21%- larger in 1995 than in 1912 28%- in recognisable independent form in 1995 of whatever size 52%
Firms that had experienced some form of liquidation,nationalisation, break-up or corporate bankruptcy protection 29%
Capability “expansion ratios”* (1=stability, below 1= decline) Ratio
- average of survivors 2.0 (1995 value ÷ 1912 value)
- average of disappearers 0.6 (exit value ÷ 1912 value)
- overall unweighted average 1.4- overall average weighted by 1912 size 1.2- overall unweighted average counting all disappearances as zero 1.1- overall weighted average omitting double counting† 1.1- proportion of the 100 showing positive growth (ie terminal value exceeding 1.0) 35%- modal value 0- median 0.4
Notes: * defined as terminal equity capitalisation at 1912 stock exchangeprices ÷ 1912 equity capitalisation.† ie counting as zero any firms permanently acquired by a firm alsoin the 1912 top 100.
Source: author’s calculations, based on data in Appendix A.
34
TABLE 2
National Corporate Performance Differentials of 1912 Giants
USA Germany Britain Other
No of firms headquartered there in1912 54 14 15† 17†
Average equity capitalisation in 1912 $90m $59m $95m $56m
Survival chances:-
in top 100 1995 19% 29% 47% 0%
any independent survival 48% 57% 60% 53%
“Capability Enhancement”*
Proportion showing positivegrowth (ie ratios above 1.0) 26% 43% 40% 18%
Unweighted average ratio forall survivors 2.3 1.9 2.7 0.7
Unweighted average ratio for all disappearers 0.7 0.1 0.7 0.3
Overall unweighted averageratio (Coefficient of variation)
1.5(135)
1.2(104)
1.9(123)
0.5(164)
(Memo item) 1995 real GNP÷ 1912 real GNP 8 9 4 -
Notes: * defined as terminal equity capitalisation ÷ 1912 equity capitalisation.† Counting Royal-Dutch Shell as wholly British.
Source: author’s calculations, from Appendix data.
35
TABLE 3
Geographical Distribution of the Top 100 Global Industrial Firmsby Equity Market Capitalisation
HeadquartersCountry
1912 1995
USA 54 40UK 14.5 12.5Germany 14 7France 6 5South Africa 4 1Russia 3 0Belgium 2 0Mexico 1 0Luxembourg 1 0Netherlands 0.5 2.5Japan 0 21Switzerland 0 4.5Sweden 0 2.5Australia 0 1Italy 0 1Finland 0 1Korea 0 1Total 100 100
Sources: 1912: author’s calculations.1995: calculated from Business Week’s listings of the world’s largestcorporations on 31 May, with non-industrial firms omitted.

36

37
TABLE 4
Industrial Performance Differentials among 1912 Corporations
Industry No of 1912Giant Firms
in theIndustry
Aggregate1912 MarketCapitalisation
of theIndustry’s
Giant Firms
*OverallIndustry
Performance
*AverageIndustry
Performance
StandardDeviation
Coefficient of variation
Textiles & Leather 4 $0.4B 0.2 0.1 0.1 79
Coal Mining 7 $0.4B 0.1 0.2 0.3 185Mechanical Engineering 10 $0.9B 0.2 0.4 0.6 164
Non-Ferrous Metals etc 14 $1.2B 0.4 0.4 0.5 116
Iron/Steel/Heavy Industrial 18 $1.5B 0.3 0.6 0.7 125
Branded Products 18 $1.6B 1.1 1.3 1.9 142 Chemicals 10 $0.4B 2.7 2.4 1.9 79 ElectricalEngineering 5 $0.4B 3.0 2.7 1.9 70
Petroleum 14 $1.2B 3.2 3.7 2.3 62 ___ _____ ___ ___ ___ ___
All 1912 giant firms 100 $8.1B 1.1† 1.4 1.9 140
* The “overall” industry performance is the average capability enhancement ratio of all firms inthe industry weighted by their 1912 size; “average” industry performance is unweighted meanperformance; if the former exceeds the latter, truly giant firms perform better than merely verylarge firms.
† See Table 1 for omission of double counting.
Source: Author’s calculations from data in Appendix A.

38
TABLE 5
Adoption of The Multidivisional Structure(% of the top approximately 100 corporations with M-Form structure)
1913 1932 1950 1960 1970 1980
USA 0 8 17 43 71 81
Japan 1 0 8 29 55 58
Germany 1 - 5 15 50 58
France 1 3 6 21 54 58
Italy - - 7 17 48 -
UK 0 5 13 30 72 80
Source: See Appendix B.

39
APPENDIX A
The World’s 100 Largest Capitalist Industrial Enterprises of 1912
All industrial enterprises1 with equity market capitalisation of $26mor more in 1912 are listed in rank order within industry groups. For a fulleraccount of the construction of this population see Hannah (1997) andSchmitz (1993). I am grateful to Alison Sharp for research assistance andto many national specialists for advice which is more fully acknowledged inHannah (1997). For industry averages see Table 4; for national averages seeTable 2; for overall totals see Table 1.
Rank inGlobaltop 100 in1912(and, inbrackets,1995,where stillranked)
1912HQ
location
Name of Company in 1912 (in brackets, 1995 changed nameor alternative outcome;acq = acquirednat = nationalised)
Market Capitalization ofEquity (in US$m at 1912 stock marketprices)
1912initialcapitalisation
1995multiple2 (orin bracketsmultiple onearlier exit)
(*=estimate from balance sheetassets)
3686982
UKUSUSUK
Textiles and LeatherJ&P Coats (Viyella acq 1986)Central Leather (liquidated 1952)American Woolen (Textron acq 1955Fine Cotton Spinners (Courtauldsacq 1964)
287404034
(0.3)(0)(0.1)(0.1)
1 Defined as all non-government enterprises with more than 50% of their activity in mining and manufacturing.2 ie 31 May 1995 equity capitalisation, revalued at 1912 Stock Exchange prices by the Standard & Poor ‘industiral 500’ index, divided by 1912 equity market value.

40
Coal Mining
23 F Mines de Lens (Charbonnages de France) 94 0*
28 F Mines de Bruay (nat. 1945) 87 (0)
29 G Gelsenkirchener (Ruhrkohle/RWE acq. 1968/9) 86 (0.2)
47 F Mines de Courrières (nat. 1945) 55 (0)
61 F Mines d’Anzin (nat. 1945) 47 (0)
72 G Harpener Bergbau (VEW acq.1992) 38 (0.1)
91 US Pittsburgh Coal (Continental acq.1966) 31 (1.0)
Mechanical Engineering
4 US Pullman (Wheelabrator-Frye acq.1980) 200 (0.1)
8 US Singer (Bicoastal) 173 0*
10 US International Harvester (Navistar) 160 0.1
21 US Westinghouse Air Brake (American Standard acq. 1968) 102 (0.1)
36 US John Deere 70* 0.9
50 US American Car & Foundry (Icahn acq.1984) 52 (0.3)
64 R Briansk Rail & Engineering (nat.1917) 45 (0)
79 US American Locomotive (Worthington acq. 1964) 37 (0)
88 US Baldwin Locomotive (Armour acq.1965) 32 (0.1)
95 UK Metropolitan Carriage (Vickers acq. 1919) 27 (1.9)
Non-Ferrous Metals and Other Mining (including related refining and smelting)
6 US Anaconda (Arco acq. 1977) 178 (0.2)
12 SA De Beers 158 0.3
13(88) UK Rio Tinto (RTZ) 148 0.8
18 US Utah Copper & Nevada Consolidated (Kennecott acq. 1923-33) 116 (1.1)
22 US Phelps Dodge 95 0.3
25 US American Smelting (Asarco) 92 0.1
42 SA Rand Mines 65 0.0
43 SA Crown Mines (Rand Mines acq. 1968) 63 (0)
45 US International Nickel (Inco) 57 0.4
54 US Calumet & Hecla (Universal Oil acq. 1968) 51 (0.1)
60 UK Consolidated Goldfields (Hanson acq. 1989) 47 (1.6)
70 US National Lead (NL Industries) 39 0.2
83 US US Smelting R&M (Sharon acq. 1979) 34 (0.2)
86 SA E Rand Proprietary 33 0.0
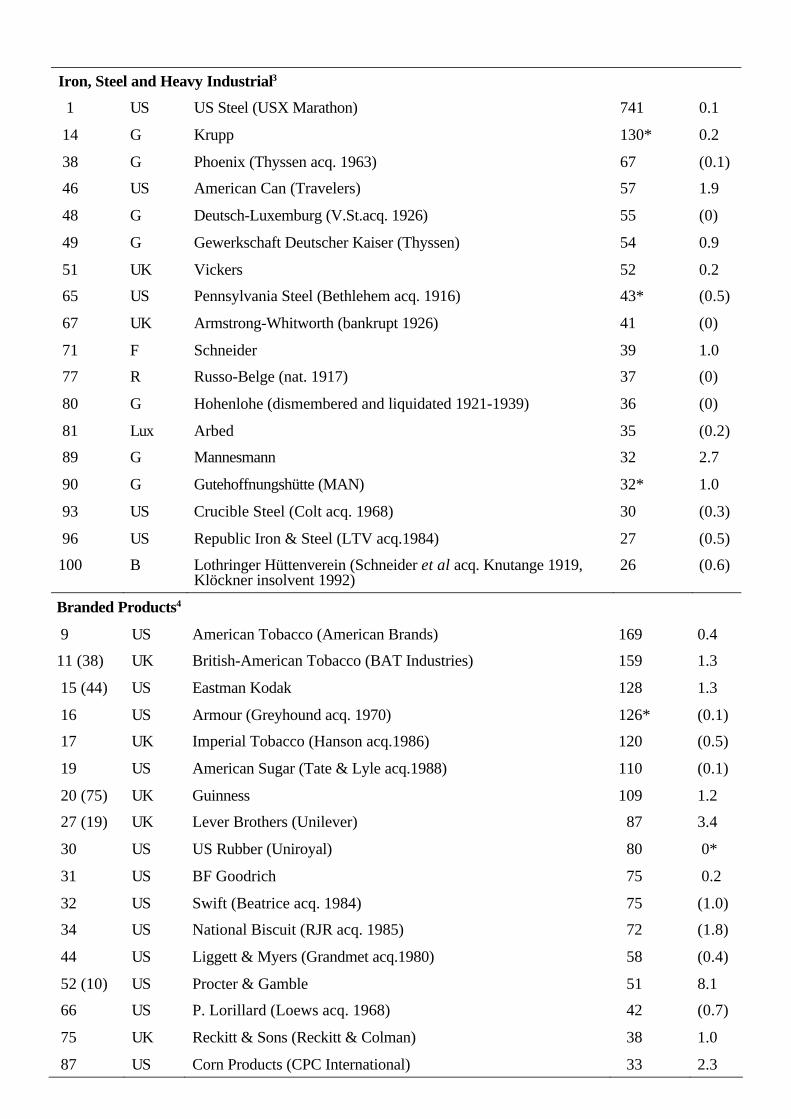
Iron, Steel and Heavy Industrial3
1 US US Steel (USX Marathon) 741 0.1
14 G Krupp 130* 0.2
38 G Phoenix (Thyssen acq. 1963) 67 (0.1)
46 US American Can (Travelers) 57 1.9
48 G Deutsch-Luxemburg (V.St.acq. 1926) 55 (0)
49 G Gewerkschaft Deutscher Kaiser (Thyssen) 54 0.9
51 UK Vickers 52 0.2
65 US Pennsylvania Steel (Bethlehem acq. 1916) 43* (0.5)
67 UK Armstrong-Whitworth (bankrupt 1926) 41 (0)
71 F Schneider 39 1.0
77 R Russo-Belge (nat. 1917) 37 (0)
80 G Hohenlohe (dismembered and liquidated 1921-1939) 36 (0)
81 Lux Arbed 35 (0.2)
89 G Mannesmann 32 2.7
90 G Gutehoffnungshütte (MAN) 32* 1.0
93 US Crucible Steel (Colt acq. 1968) 30 (0.3)
96 US Republic Iron & Steel (LTV acq.1984) 27 (0.5)
100 B Lothringer Hüttenverein (Schneider et al acq. Knutange 1919,Klöckner insolvent 1992)
26 (0.6)
Branded Products4
9 US American Tobacco (American Brands) 169 0.4
11 (38) UK British-American Tobacco (BAT Industries) 159 1.3
15 (44) US Eastman Kodak 128 1.3
16 US Armour (Greyhound acq. 1970) 126* (0.1)
17 UK Imperial Tobacco (Hanson acq.1986) 120 (0.5)
19 US American Sugar (Tate & Lyle acq.1988) 110 (0.1)
20 (75) UK Guinness 109 1.2
27 (19) UK Lever Brothers (Unilever) 87 3.4
30 US US Rubber (Uniroyal) 80 0*
31 US BF Goodrich 75 0.2
32 US Swift (Beatrice acq. 1984) 75 (1.0)
34 US National Biscuit (RJR acq. 1985) 72 (1.8)
44 US Liggett & Myers (Grandmet acq.1980) 58 (0.4)
52 (10) US Procter & Gamble 51 8.1
66 US P. Lorillard (Loews acq. 1968) 42 (0.7)
75 UK Reckitt & Sons (Reckitt & Colman) 38 1.0
87 US Corn Products (CPC International) 33 2.3

42
97 US Cudahy Packing (General Host acq.1968) 26* (0.1)
Chemicals5
37 (20) US Du Pont (+ Hercules + ICI acq. Atlas 1971) 69* 7.2
53 (94) G Farbwerke v. L & B (Hoechst) 51 2.0
57 (85) UK Brunner Mond (Zeneca) 49 2.4
62 (67) G Elberfelder Farbenfabriken (Bayer) 45 3.0
63 (95) G BASF 45 2.3
73 US American Agricultural (Continental acq. 1963) 38 (0.2)
76 US Virginia-Carolina (Mobil acq. 1963) 38 (0.2)
84 F St. Gobain 33 2.5
85 B Solvay 33* 1.1
92 US General Chemical (Allied-Signal) 30 3.1
Electrical Engineering
7 (2) US General Electric 174 4.7
24 G AEG (Daimler-Benz acq. 1985) 93 (0.3)
39 US Westinghouse Electric 67 0.7
41 (32) G Siemens 65 3.4
59 US Western Electric (Lucent+Northern Telecom) 47* 4.7
Petroleum
2 (3) US Jersey Standard (Exxon) 390 1.9
5 (1) N/UK Royal Dutch Shell 187 4.8
26 (22) US Indiana Standard (Amoco) 88 3.2
33 (14) US New York Standard (Mobil) 73 4.4
35 US California Standard (Chevron) 71 3.7
40 US Ohio Oil (US Steel acq. 1982) 66* (3.5)
55 US Prairie Oil & Gas (Sinclair acq.1932) 50 (0.3)
56 Mex El Aguila (Shell acq. 1919) 50 (2.4)
58 R Nobel Bros (nat 1917, rump dissolved 1959) 48 (0)
74 (16) UK Burmah Oil (Burmah Castrol + BP) 38 9.1
78 US Mexican Petroleum (PNP acq. 1919) 37 (2.3)
94 (58) US Texas Co (Texaco) 29 5.2
98 (52) US Atlantic Refining (Arco) 26 5.9
99 US Vacuum Oil (NY Standard acq. 1931) 26 (5.1)
3 Many firms in this category included vertically integrated coal mines and shipbuilding yards in 1912.
4 in addition to the core food, drink and tobacco industry, this category includes branded household chemicals, rubber tyres and photographic goods.

43
5 This category includes St. Gobain, which in 1912 (as now) was mainly a glass producer, though in 1912 it also had a major interest in chemicals.

APPENDIX BSources for Table 5
USA 1913. Inferred from Chandler (1962)1932. Chandler (1962) and based on 50 companies, but with no multidivisionalsin the next 50 assumed.1950-80. Percentages estimated from the chart in Kogut and Anderson (1993),p.190, based on 150 firms - this may underestimate multidivisionals in the top 100.However, Rumelt (1974) basing his study on samples of 183-207 of the top 500firms, suggests figures of 20% for 1949, 50% for 1959 and 77% for 1969, whichrather surprisingly implies no greater propensity to adopt multidivisionalorganisation among very large than among more moderately-sized corporations, atleast after the war.
Japan 1913-32 inferred from Morikawa (1992), pp.113-4.1950-80 Suzuki (1991), based on 114 companies. He has a category “mixedfunctional and divisional”, half of which I have allocated to the multidivisionalcategory. Kono (1980) p.80 gives very similar results, though cf. Fruin (1992) forthe view that multidivisionals were not so common in Japan as these figures imply.
Germany 1913 “at least one”, ie Siemens, in Kocka (1978), p.577.1950-70. Dyas and Thanheiser (1976).1980. Grossing up of the figures for 48 firms in Cable and Dirrheimer (1980),p.46.
France 1912 Levy-Leboyer 1980 (but cf. Daviet 1988).1932. Fridenson 1994.1950-70. Dyas and Thanheiser (1976) pp.186-7.1980. Approximation based on the trend line in Kogut and Anderson (1993),p.193, though it is hard to discern how that table has been calibrated.
Italy 1950-70. Pavan (1970) p.67, percentages based on 6/84 firms in 1950, 16/94 in1960 and 48/100 in 1970.
UK 1913 inferred from Hannah (1976).1932. Hannah (1976), based on approximately 50 companies, with the assumptionthat lower-ranked companies did not adopt the multidivisional structure, as for theUSA at that date.1950-70. Channon (1972) p.67, percentages based on 12/92 in 1950, 29/96 in1960, 72/100 in 1970.1980. Approximation based on the trend line in Kogut and Anderson (1993),p.193, though it is hard to determine how that table has been calibrated.
REFERENCES

45
Alford, B.W.E., (1994), “Chandlerism, the New Orthodoxy of US andEuropean Corporate Development”, Journal of EuropeanEconomic History, Vol.23, No.3, pp.631-643.
Broadberry, S.N., (1998), “How did the United States and Germanybecome richer than Britain? A sectoral analysis and comparativeproductivity levels, 1870-1990”,prepared for Leuven pre-conference, November 1996, to Seville International EconomicHistory Congress, August 1998.
Cable, J. and Dirrheimer, M.F., (1983), “Hierarchies and markets: anempirical test of the multi-division hypothesis in West Germany”,International Journal of Industrial Organisation, 1, 1, pp.3-62.
Capie, F., (1994), Tariffs and Growth, Some insights from the WorldEconomy, 1850-1940, Manchester University Press, Manchester.
Cassis, Y., (1997), Big Business: The European Experience, OxfordUniversity Press, Oxford (forthcoming).
Chandler Jnr, A.D., (1962), Strategy and Structure: Chapters in theHistory of American Industrial Enterprise, MIT Press,Cambridge, Mass.
Chandler Jnr, A.D., (1990), Scale and Scope: The Dynamics ofIndustrial Capitalism, Belknap Press of HUP, Cambridge, Mass.
Channon, D.F., (1972), Strategy and Structure of British Enterprise,Macmillan, London.
Daviet, J-P, (1988), “Some Features of Concentration in France”, inPohl (1988).

46
Fruin, W.M., (1992), The Japanese Enterprise System: CompetitiveStrategies and Cooperative Structures, Clarendon Press, Oxford.
Genovese, D. and Mullin,W., (1997), “The Sugar Institute Learning toControl its Market”, paper presented to this conference.
Hamel, G. and Prahalad C. K., (1994), “Competing for the Future”,
Harvard Business Review, July-August 1994, Vol.72, No.4,pp.122-130.
Hannah, L., (1974), “Mergers in British Manufacturing Industry, 1880-1918", Oxford Economic Papers, 26.
Hannah, L., (1976a), “Strategy and Structure in the ManufacturingSector”, in Hannah, ed. (1976b).
Hannah, L., (ed) (1976b), Management Strategy and BusinessDevelopment, Macmillan, London.
Hannah, L., (1995), “The American Miracle, 1875-1950, and After: AView in the European Mirror”, Business and Economic History,24, 2, pp.197-263.
Hannah, L., (1996), “Multinationality: Size of Firm Size of Countryand History Dependence”, Business and Economic History, 25,forthcoming.
Hannan, M.T. and Freeman, J., (1984), “Structural Interaction andOrganisational Change”, American Sociological Review, 49,1984, pp.149-164.
Harris Corporation, (1996), “Founding Dates of the 1994 Fortune 500US Companies”, Business History Review, Vol.70, Spring 1996,pp.69-90.

47
Henderson, R.M. and Clark, K.B., (1990), “Architectural innovation:the configuration of existing product technologies and the failureof established firms”, Administrative Science Quarterly, Vol. 35,201, March 1990, pp.9-30.
Hounshell, D.A., (1997), “Ford Automates”, paper presented to thisConference.
Hounshell, D.A. and Smith Jnr, J.K., (1988), Science and CorporateStrategy: Du Pont R & D 1902-1980, CUP, New York.
Jefferys, J.B., (1938), Business Organisation in Great Britain 1850-1914, University of London dissertation, 1938, reprinted ArnoPress, N.Y., 1977.
Jensen, M., (1993), “The modern industrial revolution, exit and thefuture of internal control systems”, Harvard Business SchoolWorking Paper, May 1993, quoted in Economist, 2 December1995, p.111.
Kim, S., (1995), “Expansion of markets and the geographic distributionof economic activities: the trends in US regional manufacturingstructure, 1860-1987", Quarterly Journal of Economics, 110,pp.881-908.
Kocka, J., (1976), “Entrepreneurs and Managers in GermanIndustrialisation”, in Mathias and Postan (1978).
Kogut, B., (ed), (1993), Country Competitiveness: Technology andthe Organising of Work, OUP, New York.
Kogut, B. and Parkinson, D., (1993), “The Diffusion of AmericanOrganizing Principles to Europe”, in Kogut (1993).

48
Kono, T., (1980), Strategy and Structure of Japanese Enterprise,Macmillan, London.
Lamoreaux, N.R., (1984), The Great Merger Movement in AmericanBusiness 1895-1904, CUP, New York.
Lamoreaux, N. and Sokoloff K., (1997), “Investors, Firms and theMarket for Technology”, paper presented to this conference.
Lazonick, W., (1991), Business, Organisation and the Myth of theMarket Economy, CUP, New York.
Lazonick, W., (1993), “Industry Clusters versus Global Webs:Organizational Capabilities in the American Economy”, Industrialand Corporate Change, Vol.2, No.1, pp.1-24.
Livermore, S., (1935), “The Success of Industrial Mergers”, QuarterlyJournal of Economics, 50.
Maddison, A., (1989), The World Economy in the Twentieth Century,Paris.
Marshall, A., (ed. Guillebaud) (1961), Principles of Economics,(Variorum edition).
Mathias, P. and Postan M.M., (eds), (1978), The CambridgeEconomic History of Europe, Vol.VII, The IndustrialEconomies: Capital Labour and Enterprise, part I, Britain,France, Germany and Scandinavia, CUP, Cambridge.
Meyer, E.J., (1910), “Industrial Stocks as Investments”, Annals of theAmerican Academy of Political and Social Science, XXXV, May1910.

49
Mishino, K., (1997), “Learning by New Experience”, paper presentedto this Conference.
Morikawa, H., (1992), Zaibatsu: the rise and fall of Family
Enterprise Groups in Japan, University of Tokyo Press, Tokyo.
Pavan, R.J., (1970), “Strategy and Structure in Italian Enterprise”,Ph.D. dissertation, Harvard Business School.
Pohl, H., (ed), (1988), “The Concentration Process in theEntrepreneurial Economy since the late 19th Century”,Zeitschrift für Unternehmengeschichte, Stuttgart, 55.
Porter, M.E., (1990), The Competitive Advantage of Nations,Macmillan, London.
Pooley-Dyas, G. and Thanheiser H.T., (1976), The EmergingEuropean Enterprise: Strategy and Structure in French andGerman Industry, Macmillan, London.
Raff, D. and Temin P., (1997), “Sears Roebuck in the TwentiethCentury: Competition, Complementarities, and the Problem ofWasting Assets”, paper presented to this conference.
Registrar-General (1914), English Life Tables, Cmd. 7512, Table III.
Reich, R., (1992), The Work of Nations, Vintage Books, NY.
Rumelt, R.P., (1974), Strategy, Structure and EconomicPerformance, Boston, Mass.
Rumelt, R.P., (1991), “How much does industry matter?”, StrategicManagement Journal, 12, 1991.
50
Sanber, M., (1997), “Firm Behaviour and Financial Panic in anIndustrial District”, paper presented to this conference.
Schmalensee, R., (1985), “Do Markets Differ Much?”, AmericanEconomic Review, 75, 2, 1985.
Schmitz, C., (1995), “The World’s Largest Industrial Companies of1912" Business History, October, 85-96.
Shannon, H. A., (1933), “The Limited Liability Companies of 1866-1883", Economic History Review, IV, 1933.
Shaw, C., (1983), “The Large Manufacturing Employers of 1907",Business History, Vol.25, pp.42-60.
Stigler, G.J., (1965), “The Dominant Firm and the Inverted Umbrella”,Journal of Law and Economics, 8, 1965, reprinted in Stigler(1968).
Stigler, G.J., (1968), The Organisation of Industry, Homewood,Illinois.
Suzuki, Y., (1991), Japanese Management Structures 1920-80,Macmillan, London.
Teece, D.J., (1993), “The Dynamics of Industrial Capitalism:Perspectives on Alfred Chandler’s Scale and Scope”, Journal ofEconomic Literature, XXXI, March 1993, pp.199-225.
Tilly, R., (1982), “Mergers, external growth and finance in thedevelopment of the large-scale enterprise in Germany, 1880-1913", Journal of Economic History, 42.

51
Usselman, S.W., (1997), “Internalization of discovery by AmericanRailroads”, paper presented to this conference.
Wright, G., (1997), “The Myth of the American Miracle”, paperpresented this conference.