BLACK BEAR DAMAGE TO FOREST TREES - Oregon€¦ · Black Bear Damage to Forest Trees in Northwest...
33
BLACK BEAR DAMAGE TO FOREST TREES IN NORTHWEST OREGON Aerial and Ground Surveys, 2000 Oregon Department of Forestry Pest Management Report July 2001 Alan Kanaskie Mike McWilliams Dave Overhulser Rick Christian
Transcript of BLACK BEAR DAMAGE TO FOREST TREES - Oregon€¦ · Black Bear Damage to Forest Trees in Northwest...
BLACK BEAR DAMAGE TO FOREST TREES IN NORTHWEST OREGON
Aerial and Ground Surveys, 2000
Oregon Department of Forestry Pest Management Report
July 2001
Alan Kanaskie Mike McWilliams Dave Overhulser
Rick Christian
Black Bear Damage to Forest Trees in Northwest Oregon i
Table of Contents
INTRODUCTION ...................................................................................................................... 1
OBJECTIVES .......................................................................................................................... 1
METHODS ............................................................................................................................... 2
Aerial Survey ......................................................................................................................................................2
Ground Survey Procedures ................................................................................................................................2
Cooperator Sample ............................................................................................................................................3
Helicopter Sample ..............................................................................................................................................3
DATA ANALYSIS .................................................................................................................... 4
Accuracy of Polygon Location ............................................................................................................................4
Estimates of Number of Polygons and Number of Acres with Bear Damage ....................................................4
RESULTS AND DISCUSSION ................................................................................................ 6
Selecting and Locating the Sample Polygons ....................................................................................................8
Accuracy of Polygon Location by Aerial Observers ...........................................................................................9
Comparison of Polygon Size and Area for the Helicopter and Fixed Wing Surveys of the Same Polygons .. 11
Number and Proportion of Sample Polygons with Bear Damage ................................................................... 12
Estimate of the Population Proportion of Polygons with Bear Damage .......................................................... 13
Estimate of the Population Proportion and Area of Polygons with Damage by Various Agents ..................... 15
Number of Acres with Bear Damage ............................................................................................................... 16
Relationship Between the Occurrence of Bear Damage and Polygon Size (Number of Trees) or
Area (Acres) ........................................................................................................................................... 17
Estimated Total Number of Trees Damaged by Bears and Other Agents ...................................................... 19
Estimated Number of Conifer Trees Damaged by Bear Annually ................................................................... 20
Volume of Trees Killed or Damaged by Bears ................................................................................................ 21
Severity of Bear Damage on Individual Trees (Percentage of bole circumference peeled) ........................... 22
Crown Color of Bear-Damaged Trees ............................................................................................................. 24
Tree Species Preference ................................................................................................................................. 25
CONCLUSIONS AND RECOMMENDATIONS ...................................................................... 27
LITERATURE CITED ............................................................................................................. 28
ATTACHMENT--EXAMPLE OF GIS-PRODUCED MAP OF POLYGON LOCATION........... 29
Black Bear Damage to Forest Trees in Northwest Oregon ii
Acknowledgements: We gratefully acknowledge the numerous forest land owners who cooperated in the survey by providing funding through the Oregon Forest Industries Council Animal Damage Committee, by providing access to their lands, and by ground verifying many polygons. Specifically we thank the following individuals for participating in the ground verification of polygons: Rick Christian (ODF), Bob Gilman, Vince Brand (Frank Lumber), Scott Griesa, Wilard Dierdorf, Ron Bevin (Longview Fibre), Lary Hurley (Longview Fibre), Wayne Auble (ODF), Bob Teran (ODF), Steve Skinner (ODF), Wayne Brown (ODF), Tom Budge (Longview Fibre), Keith Klecker (Olympic Resources), Sherry Andrews (BLM), Tom Parke (Willamette Industries), Terry Caster, Dennis St.Clair (Willamette Industries), Mark Gourley (Starker Forests), Jerry Chetock (ODF), Bob Orn (BLM), Dale Anders (ODF), Dan Upton (Willamette Industries), Don LaFrance (ODF), Howard Dew (Timber Services), Jay Holland (Longview Fibre), Kent Boring (Stimson), Mike Totey (ODF), Paul Gnerer (BLM), Roger Johnson (ODF), Steve Cafferata (Weyerhaeuser), Tally Patton (Boise Cascade), Ted Neef (Guistina Land and Timber)), Scott Marlega (Willamette Industries), Tash Shaheed (Weyerhaeuser), Tyson Losli (Willamette Industries)., Steve Fergusen (ODF), Walt Kastner (BLM), Matt Fehrenbacher (John Hancock), Mr. Sorter, (Longview Fibre), Bill O’Brian (Longview Fibre), R, VanDyke Stimson Lumber), Mr. Roberts (The Timber Company), Eric Kranzush (Weyerhaeuser), Bensen (Wilamette Industries), White (Willamette Industries), Metcalf (Willamette Industries),We regret any omissions. We also thank the USDA Forest Service Forest Health Monitoring Program for partial funding of the project. Special Thanks to Doug Maguire (Oregon State University) for invaluable statistical assistance, and to Greg Johnson (Willamette Industries) and Dave Enck (ODF) for advice on sampling and statistics. Thanks to Barnes and Associates (Rick Barnes, Mark Montpas, Ed Malmsten, Rick Shepherd) for their excellent field work on the tree measurements and damage assessments, and to Jack Prukop (Oregon Department of Forestry) for coordinating the helicopter survey and piloting the fixed wing survey.
Black Bear Damage to Forest Trees in Northwest Oregon iii
Highlights
The tree mortality aerial survey was flown in June 2000, and covered approximately 6.4 million acres of forest. We mapped approximately 29,500 acres (1,835 polygons) as having some recent tree mortality. Of these 29,500 acres, we estimate that approximately 19,370 acres had some mortality or tree damage caused by bears peeling bark.
We estimate that 739 polygons (42 percent) in the survey area contain trees damaged by bears. This was about 50 percent lower than reported for the 1989 ground-verification.
We estimate that 1,150 polygons (63 percent) in the survey area contain trees damaged root disease. Although root disease occurred more frequently than bear damage, it did not affect as many trees or acres as bear damage.
Although bears damaged more trees than any other agent in the survey area, root disease killed more trees than bears.
The polygons mapped in the 2000 survey represented 426,650 dead or damaged trees, 250,470 of which were damaged or killed by bears.
We estimate that 55,180 trees are damaged annually by bears in the survey area. Of these 19, 350 were completely peeled and killed, and 35,830 were partially peeled.
The ratio of partially peeled trees to completely peeled trees was 2:1, which is about the same as determined in the 1989 survey. In other words, for every tree killed by bear we found 2 others with partial bark-peeling.
Douglas-fir was the tree species most frequently damaged by bear, followed by western hemlock and western red cedar.
Eighty-five percent of the trees killed by bears in 1999 had red, brown or yellow foliage at the time of the ground survey (August and September), confirming June-July as the preferred time for bear damage surveys.
Based on the “cooperator sample” (n=79 polygons), 88 percent of polygons in the fixed wing survey were drawn accurately enough to be found by field crews.
Based on the “helicopter sample” (n=34 polygons), approximately half of the polygons in the fixed wing survey were drawn within 0.2 miles of the true location, 83 percent were within 0.5 miles of the true location, and all polygons were within 0.75 miles of the true location.
Digital sketch mapping was used for the first time by both observers in the aircraft. Unfortunately, A major error in translating digital survey data from the aircraft computer to GIS format rendered much of the ground-verification data useless, but enough data remained to complete the project.
Black Bear Damage to Forest Trees in Northwest Oregon 1
INTRODUCTION In the Pacific Northwest, black bears damage forest trees in the spring of the year by peeling the bark and eating the cambium. If the entire circumference of the bole is peeled, the tree will die. Partial peeling can reduce growth rate and vitality, introduce decay which lowers wood quality, and eventually may result in mortality (Maser 1967, Pierson 1966, Levin 1954, Schmidt and Gourley 1992). Damage in individual stands varies from a few to more than 75 percent of the trees (Hartwell and Johnson 1988, Mason and Adams 1989, Schmidt and Gourley 1992). However, estimates of the amount of damage over large geographic regions are scarce. In 1987, at the request of the Animal Damage Committee of the Oregon Forest Industries Council (OFIC), the Oregon Department of Forestry (ODF) Insect and Disease section mapped bear damage during the annual aerial survey of pest conditions in western Oregon. Although the survey detected numerous areas of unverified bear damage, we considered the results unsatisfactory because of the lack of ground-checking and the wide spacing between aerial survey lines. In the following two years (1988 and 1989) industrial forest landowners, federal land management agencies, and the State Forestry Department collectively supported a comprehensive assessment of bear damage using a combination of aerial sketch mapping and ground checking. In the 1988 and 1989 surveys about 75 percent of the polygons that were ground-checked contained trees damaged by bears, while the remainder contained trees that were damaged by other agents, usually root pathogens. The surveys also showed that June generally is the preferred time to detect bear damage from the air (Kanaskie and others 1990). However, yearly variations in weather may differentially affect the development of symptoms caused by various damaging agents, which could affect the results and interpretation of the survey. One justification for ground-checking the year 2000 aerial survey is to strengthen the link between aerial observations and actual tree damage. Tree mortality surveys have been flown annually in western Oregon since 1993 and show that the number of acres mapped as having recent mortality averages about 34,000 acres per year (Overhulser and McWilliams 1998). However, systematic ground checking of the surveys has not been done since 1989. All surveys since 1989 have relied on the data from the 1989 ground checking plots. This project will provide detailed information on the cause and amount of damage detected in an aerial survey conducted in early summer, and will help develop quantitative procedures for ground verification of this and similar aerial surveys. OBJECTIVES The original long-term objectives of the tree mortality surveys (formerly called bear damage surveys) were: 1) to document the region-wide trend in bear damage, and; 2) to indicate to forest landowners the approximate location of recent tree mortality that probably resulted from bear damage. These objectives have been achieved through repeated surveys over the past decade. Although these objectives remain fundamental to the tree mortality survey, ground verification had the following additional objectives; 1) To estimate the amount (acres and trees) and distribution of recent tree mortality caused by bear and other agents in conifer forests of northwest Oregon; 2) To estimate the number and volume of trees killed by bears annually; 3) To identify the various causes of tree mortality that produce visible symptoms in June; 4) To evaluate the effectiveness of the aerial survey at detecting bear damage, and; 5) To determine the accuracy of aerial sketch-mapping of tree mortality.
Black Bear Damage to Forest Trees in Northwest Oregon 2
METHODS Aerial Survey The aerial survey was flown between June 11 and June 23, 2000 at approximately 1000 feet above the forest canopy in the Oregon Department of Forestry twin-engine Partenavia aircraft with a pilot and two observers. Average air speed was 90 miles per hour. Survey lines were oriented north/south at three-mile intervals. Aerial observers recorded the location of recently dead trees (trees with red, brown, or yellow foliage indicative of recent or imminent tree death) by drawing either a point or a polygon on a computer touch screen linked to a real-time Global Positioning System (GPS). The screen displayed a USGS 1:100,000 topographic map enlarged to appear on the screen at a scale of about 1:42,000, and also showed the location of the survey aircraft. Using the touch screens, observers digitally recorded the size, shape, attributes, and location of the polygon. Observers classified their sketch of a patch of dead trees as either a point or a polygon. Points had no area estimate attached to them, while the area of a polygon (in acres) was computed from the sketched figure. Aerial observers cannot accurately draw to scale polygons representing less than five acres. Although some polygons had a computed size of less than 5 acres, these are not meaningful size estimates and should have been recorded as points. For sampling and analysis we assigned an area of five acres to all points, and to polygons with a computed area of less than 5 acres. For each point or polygon, the observers estimated the number of recently killed trees, and the probable casual agent (bear, Douglas-fir bark beetle, other). Only trees with red, brown, or yellow foliage were counted; dead trees without needles were not counted. Aerial observers distinguished bear-damaged trees from trees killed by the Douglas-fir bark beetle based on tree size and pattern of damage. Mature (>12 inches dbh) dead Douglas-fir in tight groups was coded as Douglas-fir beetle mortality. All other mortality was considered bear damage unless an obvious other cause was evident. After the survey flights, data were downloaded and translated into GIS format. Maps were produced in ArcView, and a list of polygons was compiled. Each polygon had the following attributes: 1) a unique identification number; 2) latitude/longitude of polygon center (computed); 3) area; 4) number of recently dead trees as seen by aerial observers, and; 5) whether it was a point or polygon. Ground Survey Procedures The ground verification was composed of two separate samples of polygons. One was the “cooperator sample” and the other the “helicopter sample”. The cooperator sample polygons were intended as an extensive and relatively rapid way to verify the polygon locations and to estimate the proportion of polygons with bear damage and the acreage represented by them. The helicopter sample involved intensive plot measurements that were used to estimate the amount of tree damage in relatively fewer polygons than in the cooperator sample. The sample polygons were chosen with the probability of selection proportional to size (PPS), with size defined as the number of recently killed trees in the polygon. PPS sampling ensured that we sampled across the range of polygon sizes, which is particularly important for bear damage surveys because occurrence of damage is correlated with polygon size (number of trees) and polygon area (acres). Secondly, it allowed all dead trees mapped by the observers an approximately equal chance of being selected for ground verification. Without PPS, our sample would have been almost entirely very small polygons with little probability of containing bear damaged trees.
Black Bear Damage to Forest Trees in Northwest Oregon 3
Cooperator Sample From the list of all polygons coded as “bear damage” by the observers, we selected 150 polygons for ground verification by cooperators, 100 in the Coast Block, and 50 in the Cascade block. The probability of selection was proportional to the number of dead trees in the polygon as recorded by aerial observers (polygons with many trees had a greater chance of selection than polygons with few trees). Once the polygons were selected we overlaid the polygons with a 1992 GIS ownership layer to determine the probable ownership and the nearest cooperating landowner. We then produced individual maps at 1:15840 (1 mile = 4 inches) showing roads, streams and topographic lines (example attached), and distributed them to the appropriate cooperators and field crews. If a sample polygon was located on land with an unidentified or non-cooperating owner, we sent the maps to a nearby cooperating landowner. Cooperators determined or confirmed ownership of the sample polygons and made the necessary contacts with landowners for access and permission. Using the maps provided, the latitude/longitude coordinates (WGS-84 map datum) and a GPS unit, cooperators looked for the polygon on the ground, using the number of dead trees and the size of the polygon (as estimated by the aerial observers) to help characterize the area that the surveyors mapped. They looked for recently killed trees that would have had red or brown needles at the time of the survey in late June. If the polygon could not be found within about ½ mile of the mapped location, they stopped searching. Once the polygon was located, cooperators walked through the polygon area and determined the cause (or causes) of death for trees with red or brown crowns (some trees may have lost needles since the aerial survey was completed). They did not search for every dead tree in the polygon. They perused the area and estimated the percentage (to the nearest 5 percent) of the dead trees in the polygon that were killed by each agent (usually bear, root disease, or abiotic agents). The completed data forms were sent to ODF in Salem. Helicopter Sample Using list sampling with the probability of selection proportional to the number of dead trees in the polygon as estimated by aerial observers, we randomly selected 55 polygons as candidates for intensive ground sampling (36 in the Coast block and 18 in the Cascade block). The sample polygons were overlaid onto topographic, road, and ownership GIS layers and printed onto 1:15840 scale maps (1 mile = 4 inches). Using these maps an aerial observer from the original fixed-wing survey then attempted to visit each of the sample polygons in a GPS-equipped helicopter, using the maps and computed polygon center points as guides. Once the location was determined based on maps and dead trees, the pilot hovered near the polygon center, and the observer and pilot each recorded the latitude/longitude of the polygon center and of the nearest road access point. The polygon center was marked from the air by tossing at least two large orange fabric streamers with metal weights attached. This step was taken to facilitate location of the plot by ground crews. The aerial observer also sketched the polygon onto the map, and estimated the size of the polygon in acres and the number of recently killed trees in the polygon. An example of a polygon map appears in the Appendix. Polygons that were successfully located by helicopter were intensively ground sampled by contract field crews during August and September. Using maps, orange streamers, and GPS data from the helicopter assessments, crews located the approximate center point of each polygon. Trees were sampled by
Black Bear Damage to Forest Trees in Northwest Oregon 4
establishing a 5-acre square (466 feet on a side) sampling grid near the approximate polygon center, oriented North/South or East/West to take advantage of topography. The sampling grid consisted of four equally spaced transects, with 132 feet between centerlines. Each transect consisted of two consecutive segments, each 233 feet long. Each transect had two widths. The narrow transect was 16 feet wide (8 feet on either side of center line) and was used for tallying all trees. The wide transect was 66 feet wide (33 feet on either side of the center line) and was used for tallying only dead or damaged trees. Crews recorded tree species, diameter at breast height (nearest 2-inch class), and condition of all trees within 8 feet of either side of the center line. Height and diameter of two site trees were measured on each narrow transect (total of 8 trees per polygon) for each major conifer species. For all other live undamaged trees in the narrow transect, only tree species and diameter were recorded. For all dead and damaged trees within 33 feet of either side of the center line, the following were recorded: tree species, diameter, tree condition (healthy, live with damage, dead), crown condition (green, yellow, red/brown, or no foliage), and damage agent (up to three). For trees with bear damage, the following were recorded: distance from ground to the bottom and top of bark peeling, the percentage of tree circumference peeled at widest point, and the year in which the peeling occurred. When necessary, the year in which peeling occurred was determined by taking an increment core in the peeled area of the bole and in an adjacent undamaged area and comparing the number of annual rings. The volume of dead and damaged trees was calculated by determining Tariff numbers for site trees in each polygon, and then estimating volume of the dead or damaged trees from local volume tables generated from the Tariff Program, version 5.0 (Maguire, 2000). All estimates of tree damage were based on the helicopter sample polygons. Because of the small sample size, we combined the Coast and Cascades blocks for much of the analysis. DATA ANALYSIS Accuracy of Polygon Location To determine how accurately observers mapped polygons during the fixed wing survey, we calculated the polygon center point (Arc View centroid function) for the fixed wing survey and compared it to the polygon center point determined by the helicopter observer. We assumed that the helicopter observer's GPS point was the “true" location of the polygon center point. We projected a map of both polygons and measured the distance and azimuth from the true location (helicopter) to the fixed wing location. Estimates of Number of Polygons and Number of Acres with Bear Damage For the estimate of the number of polygons and the number of acres that have some amount of bear damage, we combined the cooperator and helicopter sample polygons. The number of trees damaged by bears or other agents for all polygons was estimated by calculating the number of dead or damaged trees/acre for each polygon, and expanding this by the number of acres in each polygon (as estimated by aerial observers). We intended to used the helicopter sample polygons to verify or adjust the polygon area estimated in the fixed-wing survey, but the uncertainty of the exact place being mapped and dependence on a visual estimate (as opposed to a measure made form aerial photographs) did not improve the reliability of this estimate enough to make it worthwhile. We made no attempt to further refine the estimate of polygon area (acres) during ground verification because most polygons are not easily viewed from the ground.
Black Bear Damage to Forest Trees in Northwest Oregon 5
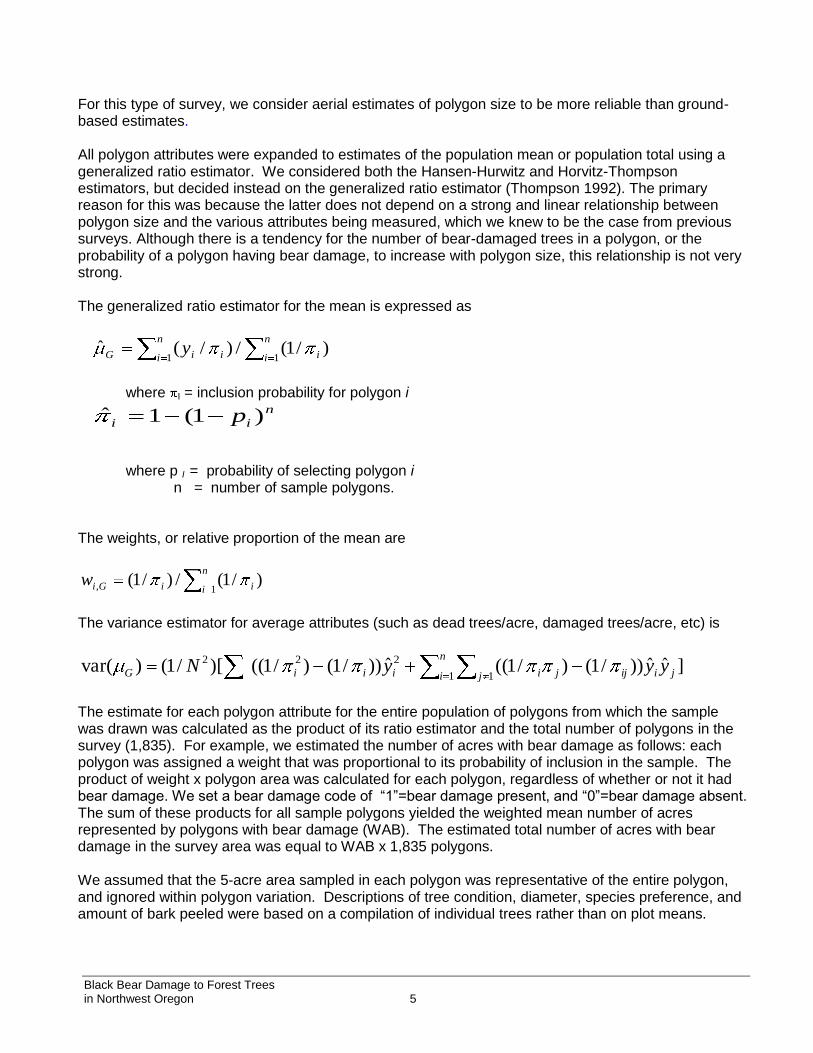
For this type of survey, we consider aerial estimates of polygon size to be more reliable than ground-based estimates. All polygon attributes were expanded to estimates of the population mean or population total using a generalized ratio estimator. We considered both the Hansen-Hurwitz and Horvitz-Thompson estimators, but decided instead on the generalized ratio estimator (Thompson 1992). The primary reason for this was because the latter does not depend on a strong and linear relationship between polygon size and the various attributes being measured, which we knew to be the case from previous surveys. Although there is a tendency for the number of bear-damaged trees in a polygon, or the probability of a polygon having bear damage, to increase with polygon size, this relationship is not very strong. The generalized ratio estimator for the mean is expressed as
)/1(/)/(ˆ11
n
i ii
n
i iG y
where I = inclusion probability for polygon i
n
ii p )1(1ˆ
where p I = probability of selecting polygon i n = number of sample polygons. The weights, or relative proportion of the mean are
n
i iiGiw1, )/1(/)/1(
The variance estimator for average attributes (such as dead trees/acre, damaged trees/acre, etc) is
]ˆˆ))/1()/1((ˆ))/1()/1(()[/1()var(1 1
222
jiijj
n
i j iiiiG yyyN
The estimate for each polygon attribute for the entire population of polygons from which the sample was drawn was calculated as the product of its ratio estimator and the total number of polygons in the survey (1,835). For example, we estimated the number of acres with bear damage as follows: each polygon was assigned a weight that was proportional to its probability of inclusion in the sample. The product of weight x polygon area was calculated for each polygon, regardless of whether or not it had bear damage. We set a bear damage code of “1”=bear damage present, and “0”=bear damage absent. The sum of these products for all sample polygons yielded the weighted mean number of acres represented by polygons with bear damage (WAB). The estimated total number of acres with bear damage in the survey area was equal to WAB x 1,835 polygons. We assumed that the 5-acre area sampled in each polygon was representative of the entire polygon, and ignored within polygon variation. Descriptions of tree condition, diameter, species preference, and amount of bark peeled were based on a compilation of individual trees rather than on plot means.
Black Bear Damage to Forest Trees in Northwest Oregon 6
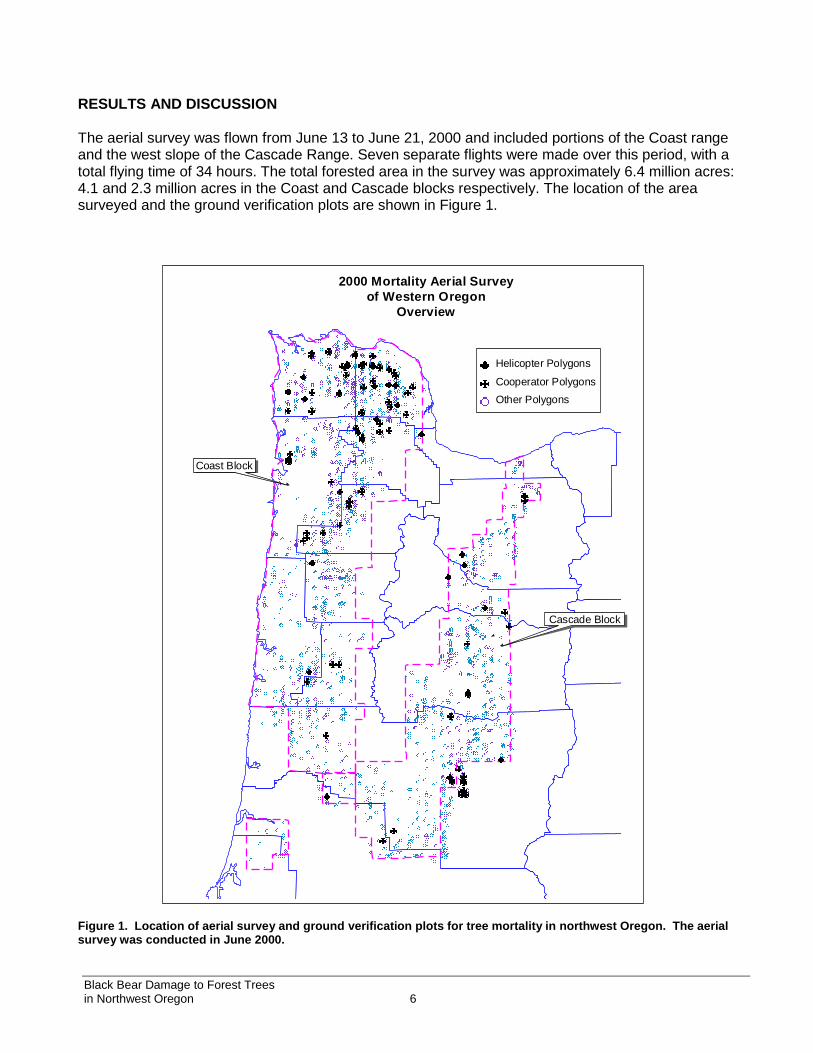
RESULTS AND DISCUSSION The aerial survey was flown from June 13 to June 21, 2000 and included portions of the Coast range and the west slope of the Cascade Range. Seven separate flights were made over this period, with a total flying time of 34 hours. The total forested area in the survey was approximately 6.4 million acres: 4.1 and 2.3 million acres in the Coast and Cascade blocks respectively. The location of the area surveyed and the ground verification plots are shown in Figure 1.
Figure 1. Location of aerial survey and ground verification plots for tree mortality in northwest Oregon. The aerial survey was conducted in June 2000.
2000 Mortality Aerial Survey
of Western Oregon
Overview
Helicopter Polygons
Cooperator Polygons
Other Polygons
Cascade Block
Coast Block
Black Bear Damage to Forest Trees in Northwest Oregon 7
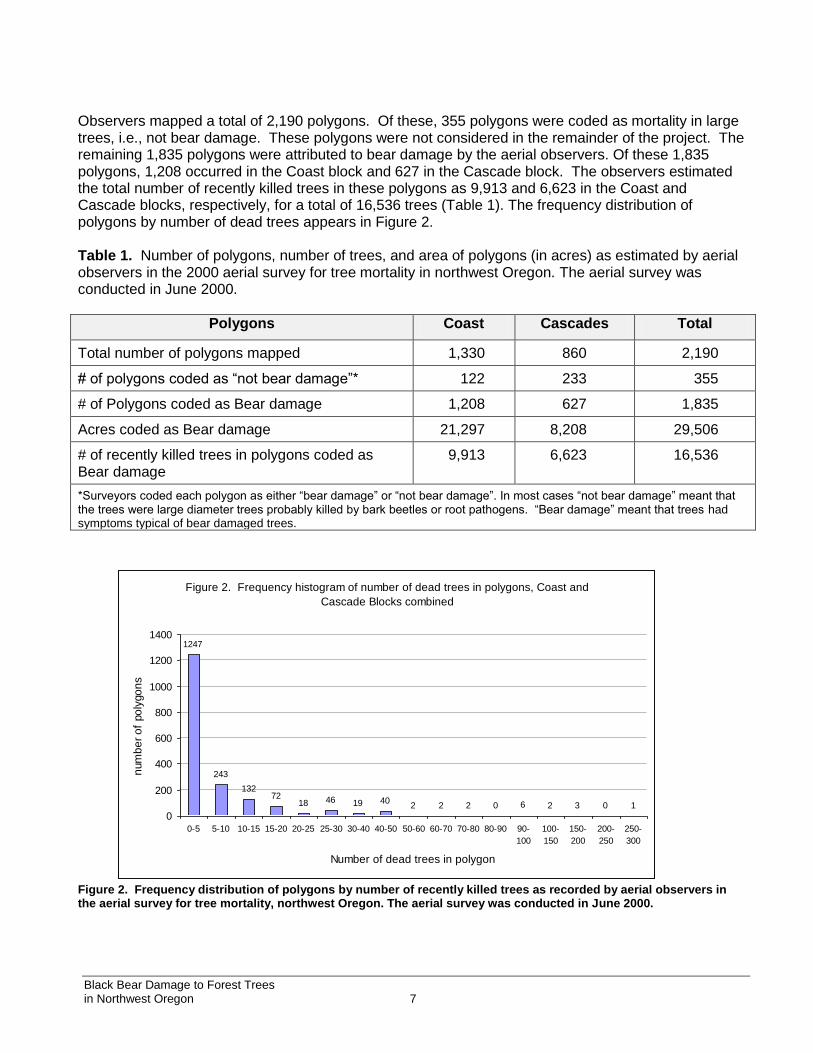
Observers mapped a total of 2,190 polygons. Of these, 355 polygons were coded as mortality in large trees, i.e., not bear damage. These polygons were not considered in the remainder of the project. The remaining 1,835 polygons were attributed to bear damage by the aerial observers. Of these 1,835 polygons, 1,208 occurred in the Coast block and 627 in the Cascade block. The observers estimated the total number of recently killed trees in these polygons as 9,913 and 6,623 in the Coast and Cascade blocks, respectively, for a total of 16,536 trees (Table 1). The frequency distribution of polygons by number of dead trees appears in Figure 2. Table 1. Number of polygons, number of trees, and area of polygons (in acres) as estimated by aerial observers in the 2000 aerial survey for tree mortality in northwest Oregon. The aerial survey was conducted in June 2000.
Polygons Coast Cascades Total
Total number of polygons mapped 1,330 860 2,190
# of polygons coded as “not bear damage”* 122 233 355
# of Polygons coded as Bear damage 1,208 627 1,835
Acres coded as Bear damage 21,297 8,208 29,506
# of recently killed trees in polygons coded as Bear damage
9,913 6,623 16,536
*Surveyors coded each polygon as either “bear damage” or “not bear damage”. In most cases “not bear damage” meant that the trees were large diameter trees probably killed by bark beetles or root pathogens. “Bear damage” meant that trees had symptoms typical of bear damaged trees.
Figure 2. Frequency distribution of polygons by number of recently killed trees as recorded by aerial observers in the aerial survey for tree mortality, northwest Oregon. The aerial survey was conducted in June 2000.
Figure 2. Frequency histogram of number of dead trees in polygons, Coast and
Cascade Blocks combined
1247
243
13272
18 46 19 402 2 2 0 6 2 3 0 1
0
200
400
600
800
1000
1200
1400
0-5 5-10 10-15 15-20 20-25 25-30 30-40 40-50 50-60 60-70 70-80 80-90 90-
100
100-
150
150-
200
200-
250
250-
300
Number of dead trees in polygon
num
be
r o
f po
lygo
ns
Black Bear Damage to Forest Trees in Northwest Oregon 8
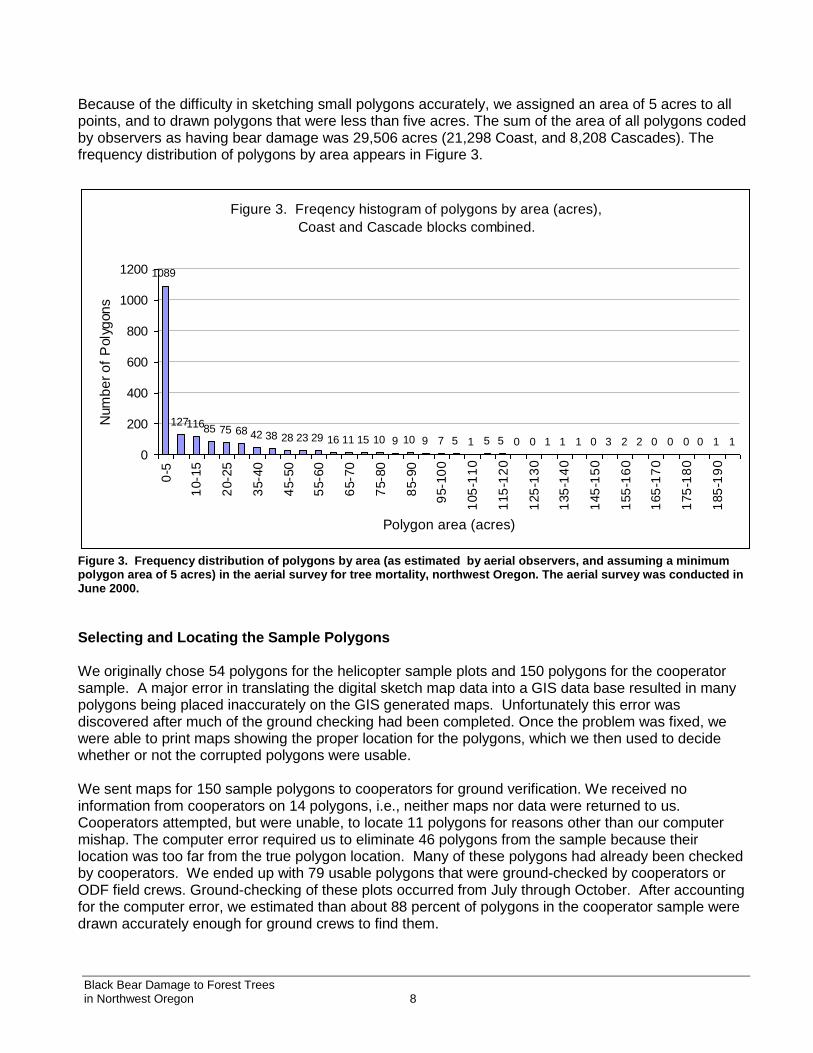
Because of the difficulty in sketching small polygons accurately, we assigned an area of 5 acres to all points, and to drawn polygons that were less than five acres. The sum of the area of all polygons coded by observers as having bear damage was 29,506 acres (21,298 Coast, and 8,208 Cascades). The frequency distribution of polygons by area appears in Figure 3.
Figure 3. Frequency distribution of polygons by area (as estimated by aerial observers, and assuming a minimum polygon area of 5 acres) in the aerial survey for tree mortality, northwest Oregon. The aerial survey was conducted in June 2000.
Selecting and Locating the Sample Polygons We originally chose 54 polygons for the helicopter sample plots and 150 polygons for the cooperator sample. A major error in translating the digital sketch map data into a GIS data base resulted in many polygons being placed inaccurately on the GIS generated maps. Unfortunately this error was discovered after much of the ground checking had been completed. Once the problem was fixed, we were able to print maps showing the proper location for the polygons, which we then used to decide whether or not the corrupted polygons were usable. We sent maps for 150 sample polygons to cooperators for ground verification. We received no information from cooperators on 14 polygons, i.e., neither maps nor data were returned to us. Cooperators attempted, but were unable, to locate 11 polygons for reasons other than our computer mishap. The computer error required us to eliminate 46 polygons from the sample because their location was too far from the true polygon location. Many of these polygons had already been checked by cooperators. We ended up with 79 usable polygons that were ground-checked by cooperators or ODF field crews. Ground-checking of these plots occurred from July through October. After accounting for the computer error, we estimated than about 88 percent of polygons in the cooperator sample were drawn accurately enough for ground crews to find them.
Figure 3. Freqency histogram of polygons by area (acres),
Coast and Cascade blocks combined.
1089
12711685 75 68 42 38 28 23 29 16 11 15 10 9 10 9 7 5 1 5 5 0 0 1 1 1 0 3 2 2 0 0 0 0 1 1
0
200
400
600
800
1000
1200
0-5
10-1
5
20-2
5
35-4
0
45-5
0
55-6
0
65-7
0
75-8
0
85-9
0
95-1
00
105
-11
0
115
-12
0
125
-13
0
135
-14
0
145
-15
0
155
-16
0
165
-17
0
175
-18
0
185
-19
0
Polygon area (acres)
Num
be
r o
f P
oly
gon
s
Black Bear Damage to Forest Trees in Northwest Oregon 9
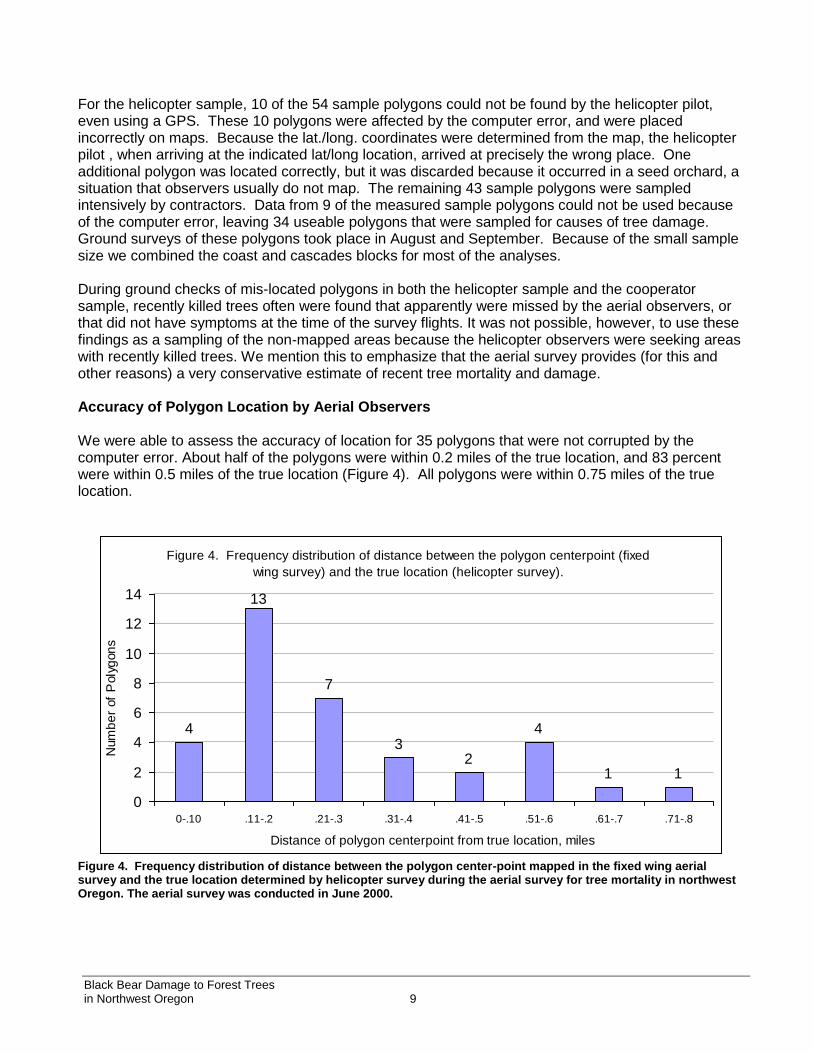
For the helicopter sample, 10 of the 54 sample polygons could not be found by the helicopter pilot, even using a GPS. These 10 polygons were affected by the computer error, and were placed incorrectly on maps. Because the lat./long. coordinates were determined from the map, the helicopter pilot , when arriving at the indicated lat/long location, arrived at precisely the wrong place. One additional polygon was located correctly, but it was discarded because it occurred in a seed orchard, a situation that observers usually do not map. The remaining 43 sample polygons were sampled intensively by contractors. Data from 9 of the measured sample polygons could not be used because of the computer error, leaving 34 useable polygons that were sampled for causes of tree damage. Ground surveys of these polygons took place in August and September. Because of the small sample size we combined the coast and cascades blocks for most of the analyses. During ground checks of mis-located polygons in both the helicopter sample and the cooperator sample, recently killed trees often were found that apparently were missed by the aerial observers, or that did not have symptoms at the time of the survey flights. It was not possible, however, to use these findings as a sampling of the non-mapped areas because the helicopter observers were seeking areas with recently killed trees. We mention this to emphasize that the aerial survey provides (for this and other reasons) a very conservative estimate of recent tree mortality and damage. Accuracy of Polygon Location by Aerial Observers We were able to assess the accuracy of location for 35 polygons that were not corrupted by the computer error. About half of the polygons were within 0.2 miles of the true location, and 83 percent were within 0.5 miles of the true location (Figure 4). All polygons were within 0.75 miles of the true location.
Figure 4. Frequency distribution of distance between the polygon center-point mapped in the fixed wing aerial survey and the true location determined by helicopter survey during the aerial survey for tree mortality in northwest Oregon. The aerial survey was conducted in June 2000.
Figure 4. Frequency distribution of distance between the polygon centerpoint (fixed
wing survey) and the true location (helicopter survey).
4
7
32
4
1 1
13
0
2
4
6
8
10
12
14
0-.10 .11-.2 .21-.3 .31-.4 .41-.5 .51-.6 .61-.7 .71-.8
Distance of polygon centerpoint from true location, miles
Num
be
r of
Poly
gon
s
Black Bear Damage to Forest Trees in Northwest Oregon 10
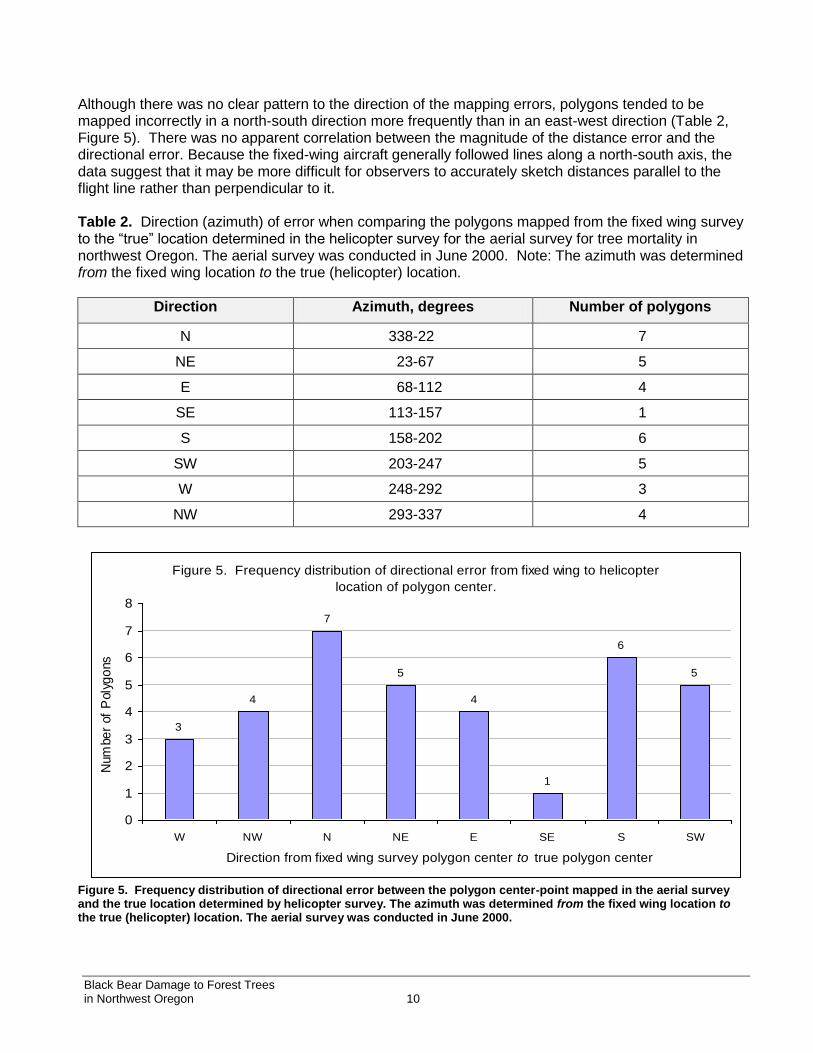
Although there was no clear pattern to the direction of the mapping errors, polygons tended to be mapped incorrectly in a north-south direction more frequently than in an east-west direction (Table 2, Figure 5). There was no apparent correlation between the magnitude of the distance error and the directional error. Because the fixed-wing aircraft generally followed lines along a north-south axis, the data suggest that it may be more difficult for observers to accurately sketch distances parallel to the flight line rather than perpendicular to it. Table 2. Direction (azimuth) of error when comparing the polygons mapped from the fixed wing survey to the “true” location determined in the helicopter survey for the aerial survey for tree mortality in northwest Oregon. The aerial survey was conducted in June 2000. Note: The azimuth was determined from the fixed wing location to the true (helicopter) location.
Direction Azimuth, degrees Number of polygons
N 338-22 7
NE 23-67 5
E 68-112 4
SE 113-157 1
S 158-202 6
SW 203-247 5
W 248-292 3
NW 293-337 4
Figure 5. Frequency distribution of directional error between the polygon center-point mapped in the aerial survey and the true location determined by helicopter survey. The azimuth was determined from the fixed wing location to the true (helicopter) location. The aerial survey was conducted in June 2000.
Figure 5. Frequency distribution of directional error from fixed wing to helicopter
location of polygon center.
3
4
7
5
4
1
6
5
0
1
2
3
4
5
6
7
8
W NW N NE E SE S SW
Direction from fixed wing survey polygon center to true polygon center
Num
be
r of
Poly
go
ns
Black Bear Damage to Forest Trees in Northwest Oregon 11
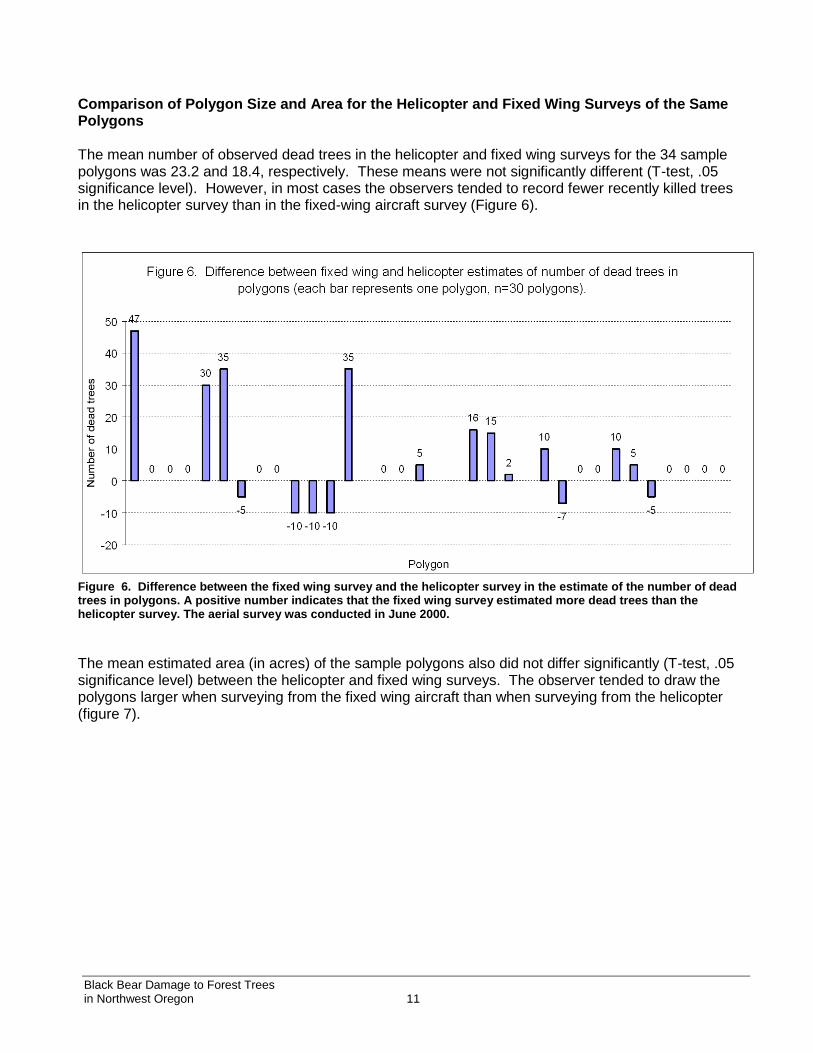
Comparison of Polygon Size and Area for the Helicopter and Fixed Wing Surveys of the Same Polygons The mean number of observed dead trees in the helicopter and fixed wing surveys for the 34 sample polygons was 23.2 and 18.4, respectively. These means were not significantly different (T-test, .05 significance level). However, in most cases the observers tended to record fewer recently killed trees in the helicopter survey than in the fixed-wing aircraft survey (Figure 6).
Figure 6. Difference between the fixed wing survey and the helicopter survey in the estimate of the number of dead trees in polygons. A positive number indicates that the fixed wing survey estimated more dead trees than the helicopter survey. The aerial survey was conducted in June 2000.
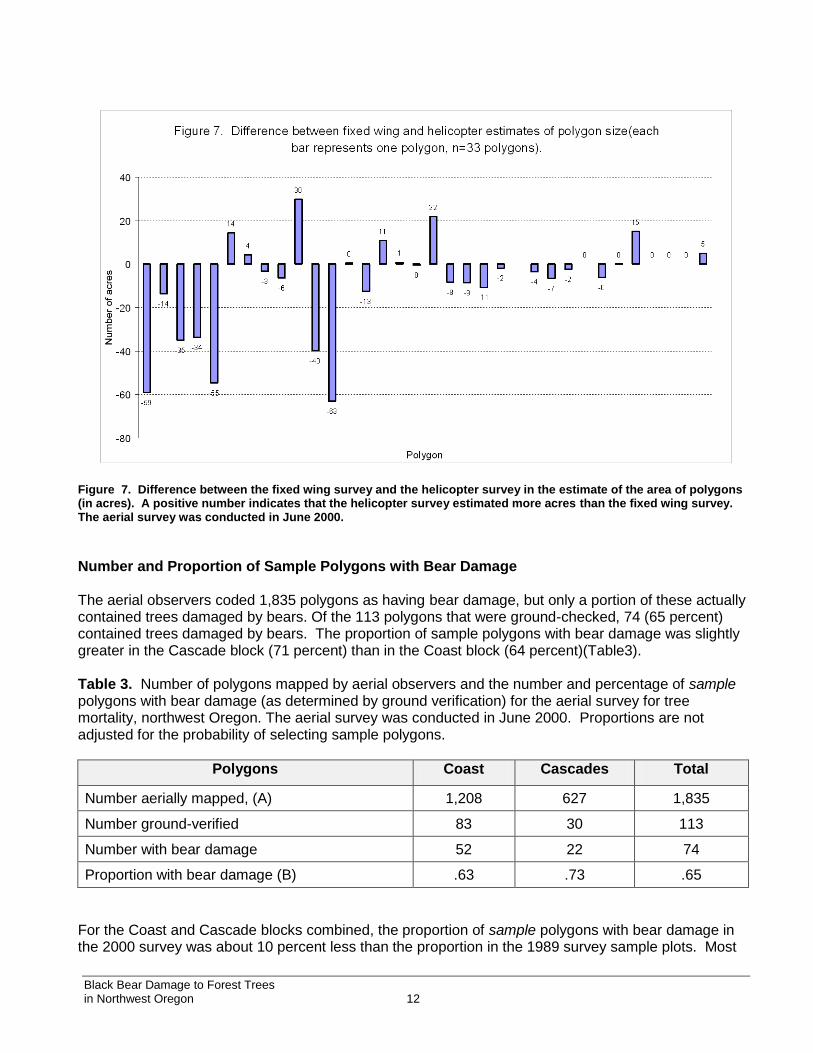
The mean estimated area (in acres) of the sample polygons also did not differ significantly (T-test, .05 significance level) between the helicopter and fixed wing surveys. The observer tended to draw the polygons larger when surveying from the fixed wing aircraft than when surveying from the helicopter (figure 7).
Black Bear Damage to Forest Trees in Northwest Oregon 12
Figure 7. Difference between the fixed wing survey and the helicopter survey in the estimate of the area of polygons (in acres). A positive number indicates that the helicopter survey estimated more acres than the fixed wing survey. The aerial survey was conducted in June 2000.
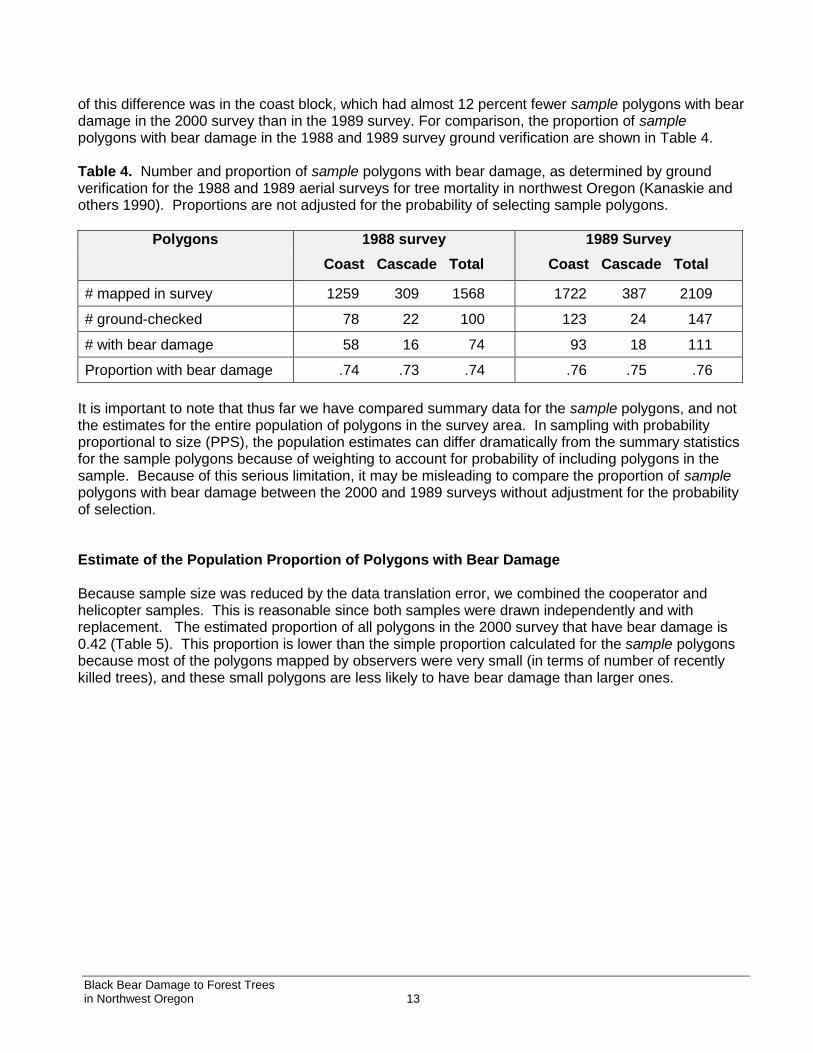
Number and Proportion of Sample Polygons with Bear Damage The aerial observers coded 1,835 polygons as having bear damage, but only a portion of these actually contained trees damaged by bears. Of the 113 polygons that were ground-checked, 74 (65 percent) contained trees damaged by bears. The proportion of sample polygons with bear damage was slightly greater in the Cascade block (71 percent) than in the Coast block (64 percent)(Table3). Table 3. Number of polygons mapped by aerial observers and the number and percentage of sample polygons with bear damage (as determined by ground verification) for the aerial survey for tree mortality, northwest Oregon. The aerial survey was conducted in June 2000. Proportions are not adjusted for the probability of selecting sample polygons.
Polygons Coast Cascades Total
Number aerially mapped, (A) 1,208 627 1,835
Number ground-verified 83 30 113
Number with bear damage 52 22 74
Proportion with bear damage (B) .63 .73 .65
For the Coast and Cascade blocks combined, the proportion of sample polygons with bear damage in the 2000 survey was about 10 percent less than the proportion in the 1989 survey sample plots. Most
Black Bear Damage to Forest Trees in Northwest Oregon 13
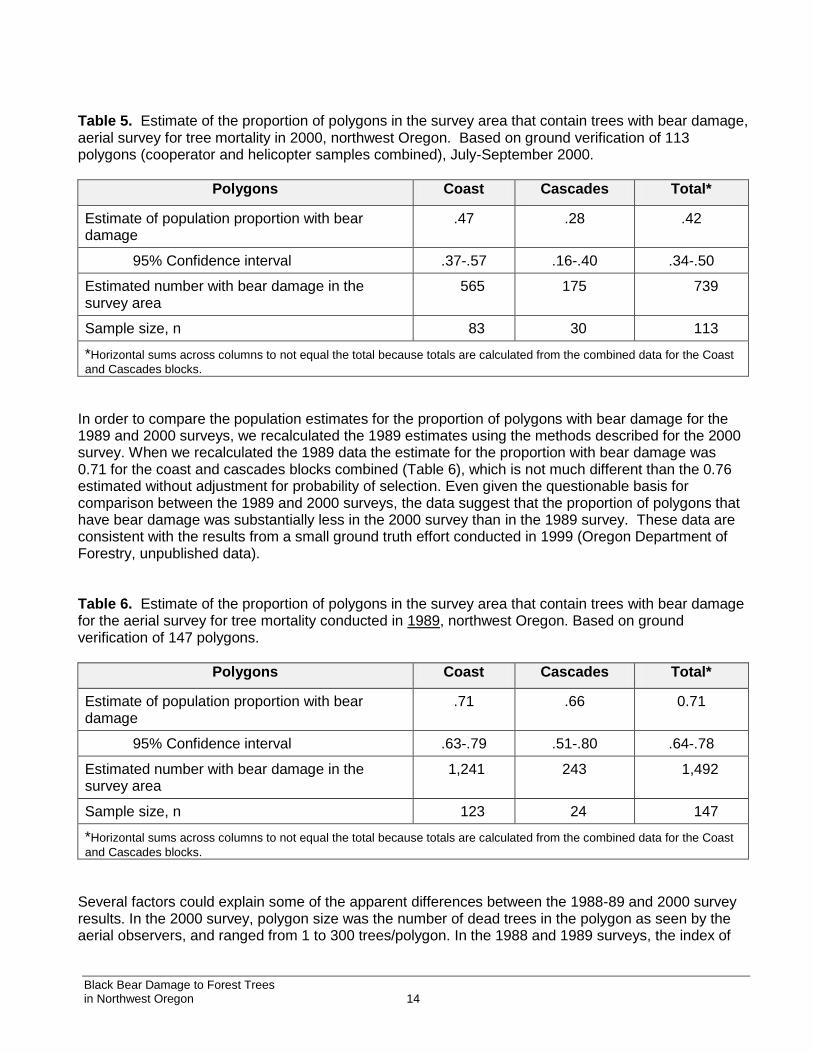
of this difference was in the coast block, which had almost 12 percent fewer sample polygons with bear damage in the 2000 survey than in the 1989 survey. For comparison, the proportion of sample polygons with bear damage in the 1988 and 1989 survey ground verification are shown in Table 4. Table 4. Number and proportion of sample polygons with bear damage, as determined by ground verification for the 1988 and 1989 aerial surveys for tree mortality in northwest Oregon (Kanaskie and others 1990). Proportions are not adjusted for the probability of selecting sample polygons.
Polygons 1988 survey
Coast Cascade Total
1989 Survey
Coast Cascade Total
# mapped in survey 1259 309 1568 1722 387 2109
# ground-checked 78 22 100 123 24 147
# with bear damage 58 16 74 93 18 111
Proportion with bear damage .74 .73 .74 .76 .75 .76
It is important to note that thus far we have compared summary data for the sample polygons, and not the estimates for the entire population of polygons in the survey area. In sampling with probability proportional to size (PPS), the population estimates can differ dramatically from the summary statistics for the sample polygons because of weighting to account for probability of including polygons in the sample. Because of this serious limitation, it may be misleading to compare the proportion of sample polygons with bear damage between the 2000 and 1989 surveys without adjustment for the probability of selection. Estimate of the Population Proportion of Polygons with Bear Damage Because sample size was reduced by the data translation error, we combined the cooperator and helicopter samples. This is reasonable since both samples were drawn independently and with replacement. The estimated proportion of all polygons in the 2000 survey that have bear damage is 0.42 (Table 5). This proportion is lower than the simple proportion calculated for the sample polygons because most of the polygons mapped by observers were very small (in terms of number of recently killed trees), and these small polygons are less likely to have bear damage than larger ones.
Black Bear Damage to Forest Trees in Northwest Oregon 14
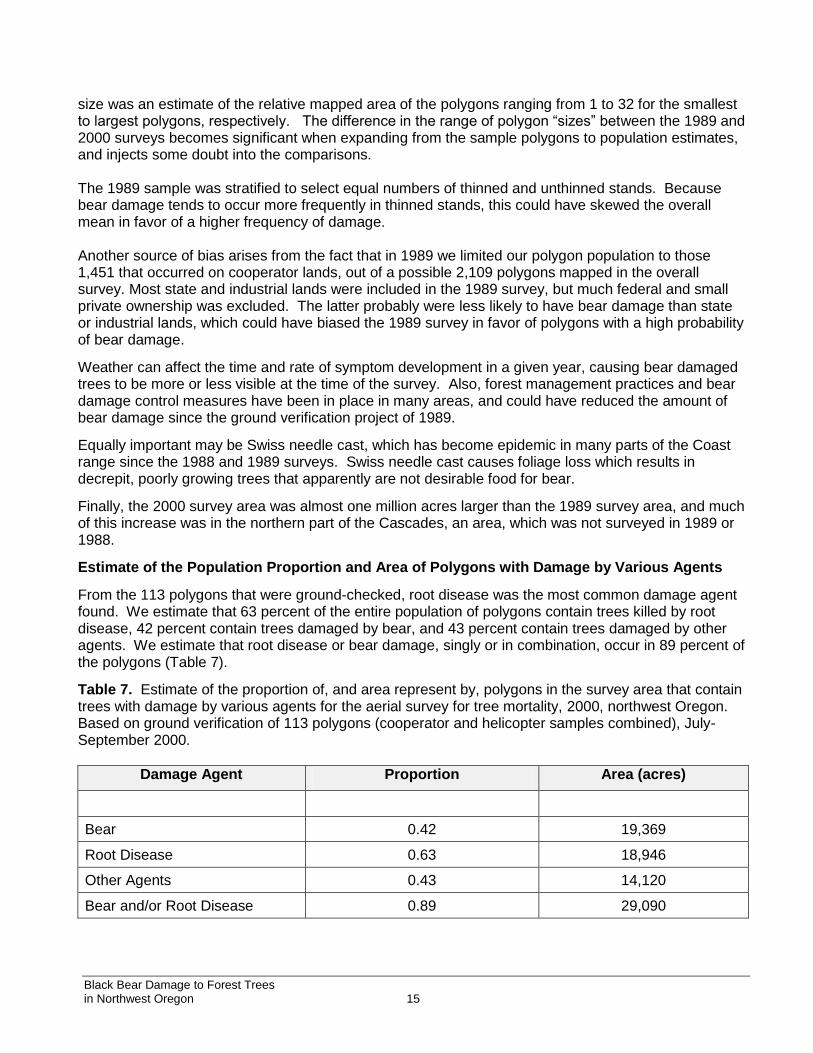
Table 5. Estimate of the proportion of polygons in the survey area that contain trees with bear damage, aerial survey for tree mortality in 2000, northwest Oregon. Based on ground verification of 113 polygons (cooperator and helicopter samples combined), July-September 2000.
Polygons Coast Cascades Total*
Estimate of population proportion with bear damage
.47 .28 .42
95% Confidence interval .37-.57 .16-.40 .34-.50
Estimated number with bear damage in the survey area
565 175 739
Sample size, n 83 30 113
*Horizontal sums across columns to not equal the total because totals are calculated from the combined data for the Coast
and Cascades blocks.
In order to compare the population estimates for the proportion of polygons with bear damage for the 1989 and 2000 surveys, we recalculated the 1989 estimates using the methods described for the 2000 survey. When we recalculated the 1989 data the estimate for the proportion with bear damage was 0.71 for the coast and cascades blocks combined (Table 6), which is not much different than the 0.76 estimated without adjustment for probability of selection. Even given the questionable basis for comparison between the 1989 and 2000 surveys, the data suggest that the proportion of polygons that have bear damage was substantially less in the 2000 survey than in the 1989 survey. These data are consistent with the results from a small ground truth effort conducted in 1999 (Oregon Department of Forestry, unpublished data). Table 6. Estimate of the proportion of polygons in the survey area that contain trees with bear damage for the aerial survey for tree mortality conducted in 1989, northwest Oregon. Based on ground verification of 147 polygons.
Polygons Coast Cascades Total*
Estimate of population proportion with bear damage
.71 .66 0.71
95% Confidence interval .63-.79 .51-.80 .64-.78
Estimated number with bear damage in the survey area
1,241 243 1,492
Sample size, n 123 24 147
*Horizontal sums across columns to not equal the total because totals are calculated from the combined data for the Coast
and Cascades blocks.
Several factors could explain some of the apparent differences between the 1988-89 and 2000 survey results. In the 2000 survey, polygon size was the number of dead trees in the polygon as seen by the aerial observers, and ranged from 1 to 300 trees/polygon. In the 1988 and 1989 surveys, the index of
Black Bear Damage to Forest Trees in Northwest Oregon 15
size was an estimate of the relative mapped area of the polygons ranging from 1 to 32 for the smallest to largest polygons, respectively. The difference in the range of polygon “sizes” between the 1989 and 2000 surveys becomes significant when expanding from the sample polygons to population estimates, and injects some doubt into the comparisons. The 1989 sample was stratified to select equal numbers of thinned and unthinned stands. Because bear damage tends to occur more frequently in thinned stands, this could have skewed the overall mean in favor of a higher frequency of damage. Another source of bias arises from the fact that in 1989 we limited our polygon population to those 1,451 that occurred on cooperator lands, out of a possible 2,109 polygons mapped in the overall survey. Most state and industrial lands were included in the 1989 survey, but much federal and small private ownership was excluded. The latter probably were less likely to have bear damage than state or industrial lands, which could have biased the 1989 survey in favor of polygons with a high probability of bear damage.
Weather can affect the time and rate of symptom development in a given year, causing bear damaged trees to be more or less visible at the time of the survey. Also, forest management practices and bear damage control measures have been in place in many areas, and could have reduced the amount of bear damage since the ground verification project of 1989.
Equally important may be Swiss needle cast, which has become epidemic in many parts of the Coast range since the 1988 and 1989 surveys. Swiss needle cast causes foliage loss which results in decrepit, poorly growing trees that apparently are not desirable food for bear.
Finally, the 2000 survey area was almost one million acres larger than the 1989 survey area, and much of this increase was in the northern part of the Cascades, an area, which was not surveyed in 1989 or 1988.
Estimate of the Population Proportion and Area of Polygons with Damage by Various Agents
From the 113 polygons that were ground-checked, root disease was the most common damage agent found. We estimate that 63 percent of the entire population of polygons contain trees killed by root disease, 42 percent contain trees damaged by bear, and 43 percent contain trees damaged by other agents. We estimate that root disease or bear damage, singly or in combination, occur in 89 percent of the polygons (Table 7).
Table 7. Estimate of the proportion of, and area represent by, polygons in the survey area that contain trees with damage by various agents for the aerial survey for tree mortality, 2000, northwest Oregon. Based on ground verification of 113 polygons (cooperator and helicopter samples combined), July-September 2000.
Damage Agent Proportion Area (acres)
Bear 0.42 19,369
Root Disease 0.63 18,946
Other Agents 0.43 14,120
Bear and/or Root Disease 0.89 29,090

Black Bear Damage to Forest Trees in Northwest Oregon 16
Number of Acres with Bear Damage We estimate that the area represented by polygons containing bear-damaged trees is 19,369 acres for the entire survey area. Estimates for the Coast and Cascades blocks are 13,696 and 5,080 acres, respectively. For future surveys, the area with bear damage can be estimated for the entire survey area by multiplying the number of polygons coded as bear damage by observers by 10.52 acres. This factor (10.52 acres) can be applied to future aerial surveys for as long as the 2000 ground verification data is considered reliable, and as long as the aerial observers adhere to procedures and conventions of the 2000 survey. This area estimate does not describe the amount of bear damage within the polygons, just whether or not it occurs.
For comparison, in the 1989 survey we estimated that polygons with bear damage represented 48,700 acres. This estimate was calculated differently than in the 2000 survey in that it did not account for the probability of selection for sample polygons. When we recalculated 1989 data to account for the probability of selecting sample polygons, the new estimate of the area represented by polygons with bear damage is 23,300 acres (18,908 in the Coast block, and 4,302 in the Cascades block). Even with recalculation, there appears to have been an overall decrease (17%) in the acres with bear damage in the survey area between 1989 and 2000, and this decrease is due to a decrease of approximately 25 percent in the Coast block. If one adjusted (normalized) these estimates to account for the difference in total number of acres surveyed in 1989 and 2000, the magnitude of the decrease would be even larger.
One key factor which could explain the decrease is Swiss needle cast, which has become epidemic in many parts of the Coast range since the 1988 and 1989 surveys. The disease causes foliage loss, which results in decrepit, poorly growing trees that apparently are not desirable food for bear.
Another way to examine change in the estimate of amount of area affected by bear damage is to calculate the proportion of the total acres surveyed in each year. In this case the difference is largest in the Cascade block, which showed a nearly three-fold reduction in the proportion of all acres in the survey area with bear damage (Table 8). Some of this probably is due to the 1 million-acre increase in the size of the survey area between 1989 and 2000. This increase mostly occurred in the northern Cascades an area with much root disease that was not surveyed in 1989.
Table 8. Estimate of the number of acres represented by polygons with bear damage in the 1989 and 2000 aerial tree mortality surveys, northwest Oregon. The 2000 survey results were based on ground verification of 113 polygons (cooperator and helicopter samples combined), July-September 2000. The 1989 results were based on 147 sample polygons.
Polygons
1989 Survey
Coast Cascade Total
2000 Survey
Coast Cascade Total*
Acres with bear damage 18,908 4,302 23,200 13,696 5,080 19,369
Acres surveyed (millions) 4.86 0.67 5.53 3.98 2.34 6.30
Proportion of all acres in survey area with bear damage**
.0039 .0064 .0042 .0034 .0022 .0031
*Horizontal sums across columns do not equal the total because totals are calculated from the combined data for the Coast
and Cascades blocks.
**Estimated number of acres with bear damage divided by the total number of acres surveyed.
Black Bear Damage to Forest Trees in Northwest Oregon 17
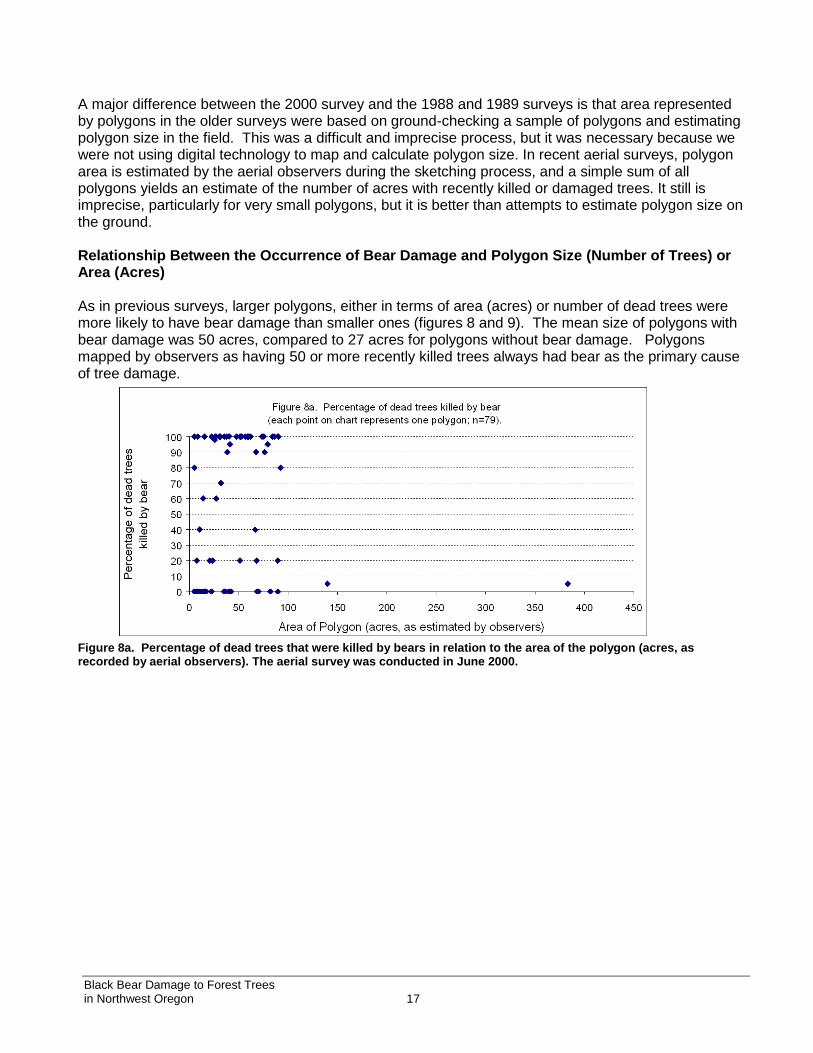
A major difference between the 2000 survey and the 1988 and 1989 surveys is that area represented by polygons in the older surveys were based on ground-checking a sample of polygons and estimating polygon size in the field. This was a difficult and imprecise process, but it was necessary because we were not using digital technology to map and calculate polygon size. In recent aerial surveys, polygon area is estimated by the aerial observers during the sketching process, and a simple sum of all polygons yields an estimate of the number of acres with recently killed or damaged trees. It still is imprecise, particularly for very small polygons, but it is better than attempts to estimate polygon size on the ground. Relationship Between the Occurrence of Bear Damage and Polygon Size (Number of Trees) or Area (Acres) As in previous surveys, larger polygons, either in terms of area (acres) or number of dead trees were more likely to have bear damage than smaller ones (figures 8 and 9). The mean size of polygons with bear damage was 50 acres, compared to 27 acres for polygons without bear damage. Polygons mapped by observers as having 50 or more recently killed trees always had bear as the primary cause of tree damage.
Figure 8a. Percentage of dead trees that were killed by bears in relation to the area of the polygon (acres, as recorded by aerial observers). The aerial survey was conducted in June 2000.
Black Bear Damage to Forest Trees in Northwest Oregon 18
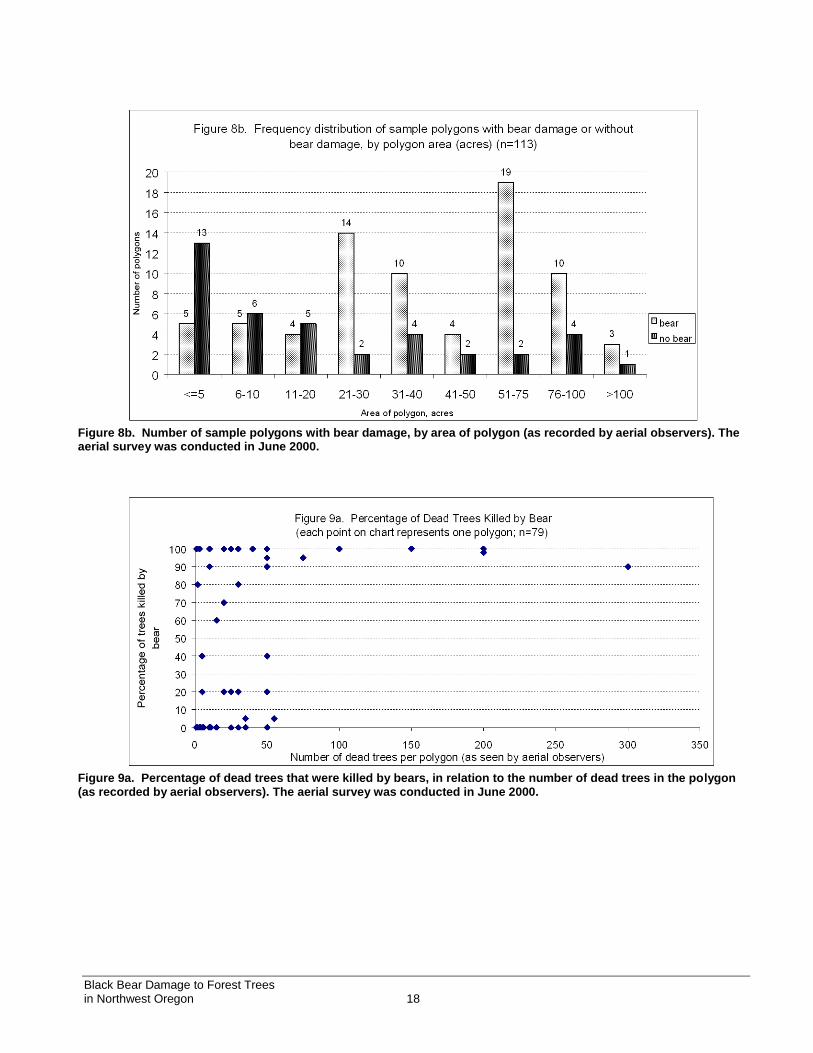
Figure 8b. Number of sample polygons with bear damage, by area of polygon (as recorded by aerial observers). The aerial survey was conducted in June 2000.
Figure 9a. Percentage of dead trees that were killed by bears, in relation to the number of dead trees in the polygon (as recorded by aerial observers). The aerial survey was conducted in June 2000.
Black Bear Damage to Forest Trees in Northwest Oregon 19
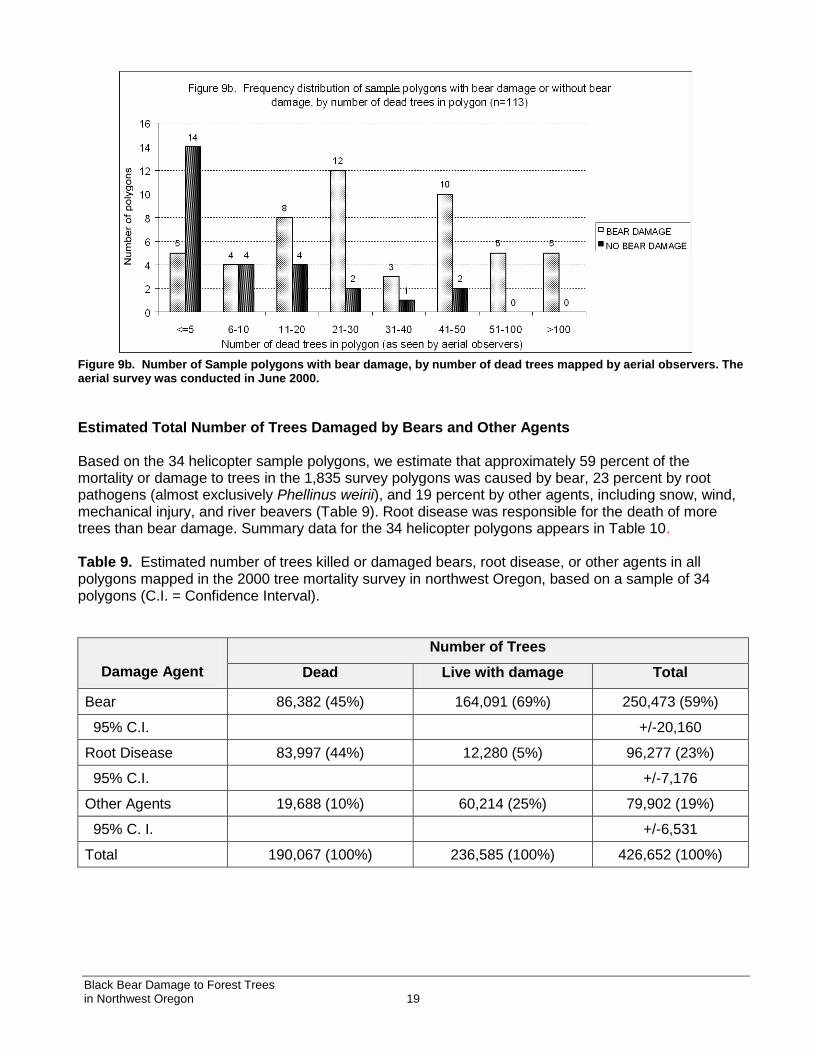
Figure 9b. Number of Sample polygons with bear damage, by number of dead trees mapped by aerial observers. The aerial survey was conducted in June 2000.
Estimated Total Number of Trees Damaged by Bears and Other Agents Based on the 34 helicopter sample polygons, we estimate that approximately 59 percent of the mortality or damage to trees in the 1,835 survey polygons was caused by bear, 23 percent by root pathogens (almost exclusively Phellinus weirii), and 19 percent by other agents, including snow, wind, mechanical injury, and river beavers (Table 9). Root disease was responsible for the death of more trees than bear damage. Summary data for the 34 helicopter polygons appears in Table 10. Table 9. Estimated number of trees killed or damaged bears, root disease, or other agents in all polygons mapped in the 2000 tree mortality survey in northwest Oregon, based on a sample of 34 polygons (C.I. = Confidence Interval).
Damage Agent
Number of Trees
Dead Live with damage Total
Bear 86,382 (45%) 164,091 (69%) 250,473 (59%)
95% C.I. +/-20,160
Root Disease 83,997 (44%) 12,280 (5%) 96,277 (23%)
95% C.I. +/-7,176
Other Agents 19,688 (10%) 60,214 (25%) 79,902 (19%)
95% C. I. +/-6,531
Total 190,067 (100%) 236,585 (100%) 426,652 (100%)
Black Bear Damage to Forest Trees in Northwest Oregon 20
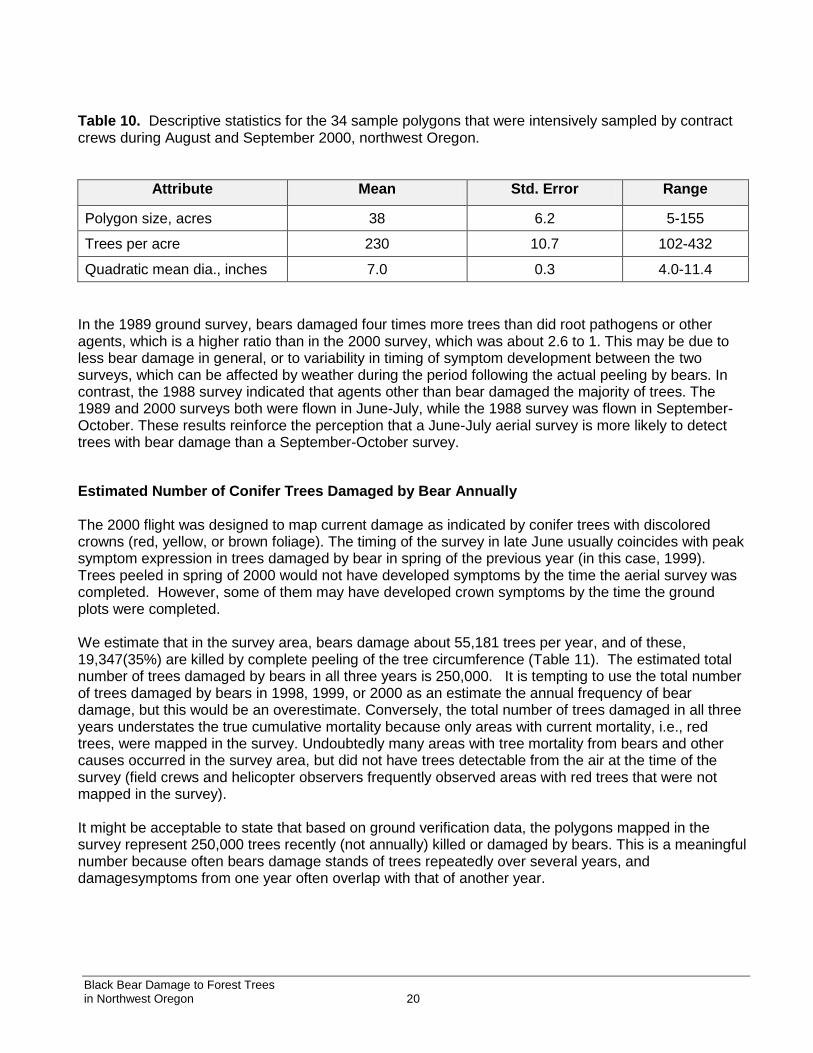
Table 10. Descriptive statistics for the 34 sample polygons that were intensively sampled by contract crews during August and September 2000, northwest Oregon.
Attribute Mean Std. Error Range
Polygon size, acres 38 6.2 5-155
Trees per acre 230 10.7 102-432
Quadratic mean dia., inches 7.0 0.3 4.0-11.4
In the 1989 ground survey, bears damaged four times more trees than did root pathogens or other agents, which is a higher ratio than in the 2000 survey, which was about 2.6 to 1. This may be due to less bear damage in general, or to variability in timing of symptom development between the two surveys, which can be affected by weather during the period following the actual peeling by bears. In contrast, the 1988 survey indicated that agents other than bear damaged the majority of trees. The 1989 and 2000 surveys both were flown in June-July, while the 1988 survey was flown in September-October. These results reinforce the perception that a June-July aerial survey is more likely to detect trees with bear damage than a September-October survey.
Estimated Number of Conifer Trees Damaged by Bear Annually The 2000 flight was designed to map current damage as indicated by conifer trees with discolored crowns (red, yellow, or brown foliage). The timing of the survey in late June usually coincides with peak symptom expression in trees damaged by bear in spring of the previous year (in this case, 1999). Trees peeled in spring of 2000 would not have developed symptoms by the time the aerial survey was completed. However, some of them may have developed crown symptoms by the time the ground plots were completed. We estimate that in the survey area, bears damage about 55,181 trees per year, and of these, 19,347(35%) are killed by complete peeling of the tree circumference (Table 11). The estimated total number of trees damaged by bears in all three years is 250,000. It is tempting to use the total number of trees damaged by bears in 1998, 1999, or 2000 as an estimate the annual frequency of bear damage, but this would be an overestimate. Conversely, the total number of trees damaged in all three years understates the true cumulative mortality because only areas with current mortality, i.e., red trees, were mapped in the survey. Undoubtedly many areas with tree mortality from bears and other causes occurred in the survey area, but did not have trees detectable from the air at the time of the survey (field crews and helicopter observers frequently observed areas with red trees that were not mapped in the survey). It might be acceptable to state that based on ground verification data, the polygons mapped in the survey represent 250,000 trees recently (not annually) killed or damaged by bears. This is a meaningful number because often bears damage stands of trees repeatedly over several years, and damagesymptoms from one year often overlap with that of another year.
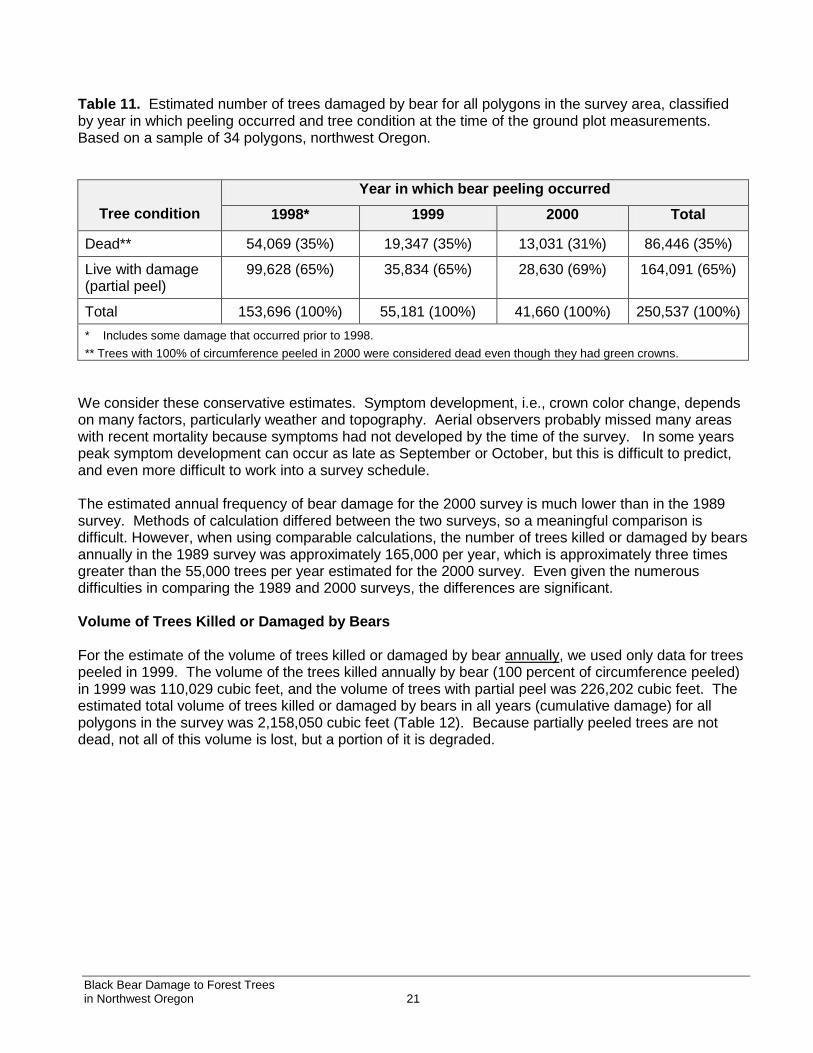
Black Bear Damage to Forest Trees in Northwest Oregon 21
Table 11. Estimated number of trees damaged by bear for all polygons in the survey area, classified by year in which peeling occurred and tree condition at the time of the ground plot measurements. Based on a sample of 34 polygons, northwest Oregon.
Tree condition
Year in which bear peeling occurred
1998* 1999 2000 Total
Dead** 54,069 (35%) 19,347 (35%) 13,031 (31%) 86,446 (35%)
Live with damage (partial peel)
99,628 (65%) 35,834 (65%) 28,630 (69%) 164,091 (65%)
Total 153,696 (100%) 55,181 (100%) 41,660 (100%) 250,537 (100%)
* Includes some damage that occurred prior to 1998.
** Trees with 100% of circumference peeled in 2000 were considered dead even though they had green crowns.
We consider these conservative estimates. Symptom development, i.e., crown color change, depends on many factors, particularly weather and topography. Aerial observers probably missed many areas with recent mortality because symptoms had not developed by the time of the survey. In some years peak symptom development can occur as late as September or October, but this is difficult to predict, and even more difficult to work into a survey schedule. The estimated annual frequency of bear damage for the 2000 survey is much lower than in the 1989 survey. Methods of calculation differed between the two surveys, so a meaningful comparison is difficult. However, when using comparable calculations, the number of trees killed or damaged by bears annually in the 1989 survey was approximately 165,000 per year, which is approximately three times greater than the 55,000 trees per year estimated for the 2000 survey. Even given the numerous difficulties in comparing the 1989 and 2000 surveys, the differences are significant. Volume of Trees Killed or Damaged by Bears For the estimate of the volume of trees killed or damaged by bear annually, we used only data for trees peeled in 1999. The volume of the trees killed annually by bear (100 percent of circumference peeled) in 1999 was 110,029 cubic feet, and the volume of trees with partial peel was 226,202 cubic feet. The estimated total volume of trees killed or damaged by bears in all years (cumulative damage) for all polygons in the survey was 2,158,050 cubic feet (Table 12). Because partially peeled trees are not dead, not all of this volume is lost, but a portion of it is degraded.

Black Bear Damage to Forest Trees in Northwest Oregon 22
Table 12. Estimated volume of trees killed or damaged by bears or other agents for all polygons mapped in the 2000 tree mortality survey in northwest Oregon. Based on a sample of 34 polygons.
Damage description Tree volume (cubic feet) 95% C. I.*
Killed by bears in 1999 110,029 +/- 8,166
Damaged by bear in 1999 (partial peel only) 226,202 +/- 15,402
Killed by bears, all years 644,080 +/- 40,658
Damaged by bears (partial peel only), all years
1,513,970 +/- 108,636
Killed or damaged by root disease, all years 574,289 +/- 43,588
Killed by other agents, all years 140,538 +/- 10,393
*Confidence Interval
Severity of Bear Damage on Individual Trees (Percentage of bole circumference peeled) Of the 890 conifer trees that were damaged by bears in the 34 sample polygons, one-third (34 percent) were completely peeled and two-thirds (66 percent) were partially peeled (Table 13). Of the 890 bear damaged trees, 104 had two separate areas on the bole with peeling, and 10 trees had three separate areas with peeling. The ratio of partially peeled to 100% peeled trees was 1.9 to 1. The ratios of partially peeled to 100% peeled trees in the 1988 and 1989 Oregon surveys were 3.5 to 1 and 2 to 1, respectively. These results show a much higher proportion of completely peeled trees than Poelker and Hartwell (1973) and Hartwell and Johnson (1988), who reported a ratio of 4.6 to 1 (partially-peeled to100% peeled) for conifers in western Washington. Table 13. Number and percentage of conifer trees arrayed by percentage of bole circumference peeled by bears for the 2000 and 1989 aerial surveys, northwest Oregon. Sample size of 890 trees in 2000, and 1,463 trees in 1989.
Percentage of Bole Circumference Peeled
2000 Survey 1989 Survey
# of Trees Percentage # of trees Percentage
1-15 266 29.9 372 25.4
26-50 164 18.4 301 20.6
51-75 90 10.1 173 11.8
76-99 67 7.5 130 8.9
Subtotal, partial peel 587 66.0 976 66.7
100 (complete peel) 303 34.0 487 33.3
Total 890 100 1,463 100
Black Bear Damage to Forest Trees in Northwest Oregon 23
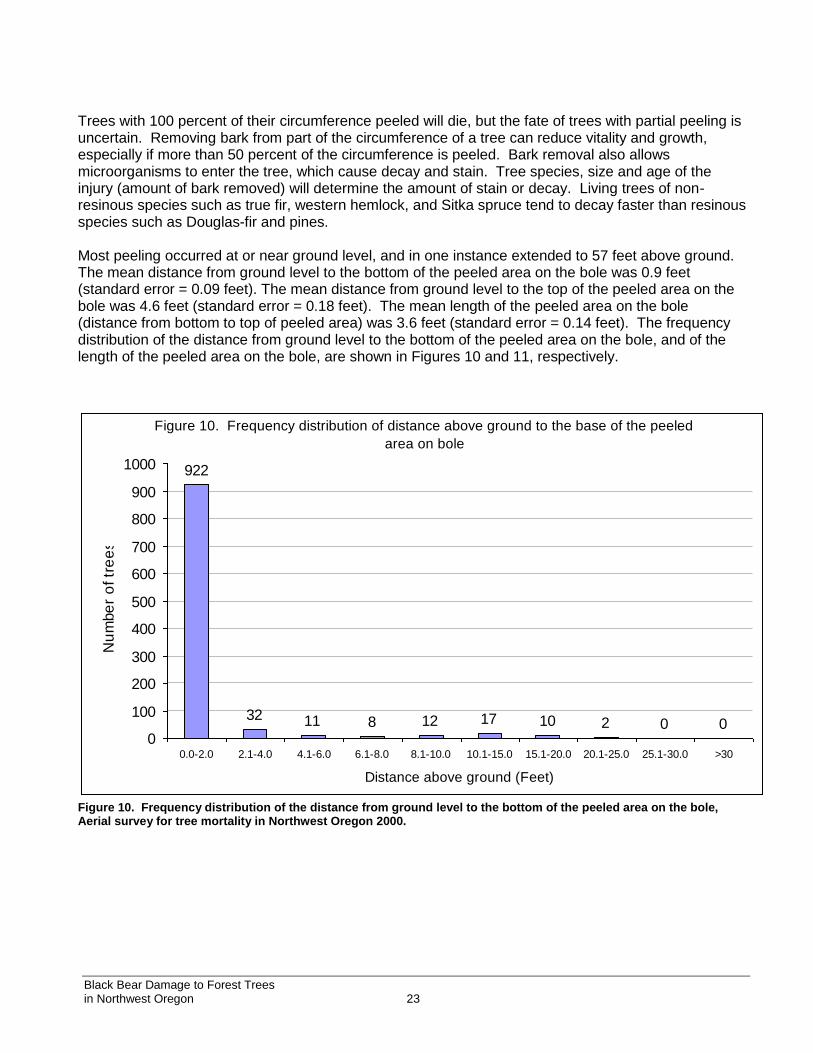
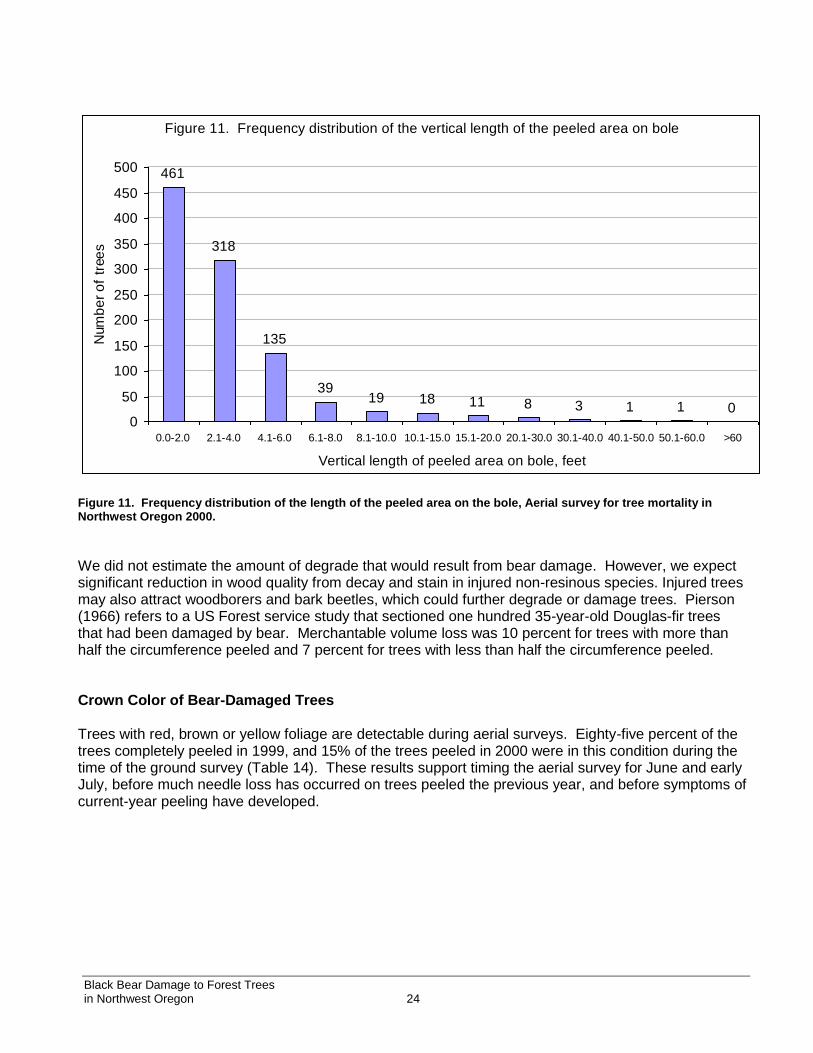
Trees with 100 percent of their circumference peeled will die, but the fate of trees with partial peeling is uncertain. Removing bark from part of the circumference of a tree can reduce vitality and growth, especially if more than 50 percent of the circumference is peeled. Bark removal also allows microorganisms to enter the tree, which cause decay and stain. Tree species, size and age of the injury (amount of bark removed) will determine the amount of stain or decay. Living trees of non-resinous species such as true fir, western hemlock, and Sitka spruce tend to decay faster than resinous species such as Douglas-fir and pines. Most peeling occurred at or near ground level, and in one instance extended to 57 feet above ground. The mean distance from ground level to the bottom of the peeled area on the bole was 0.9 feet (standard error = 0.09 feet). The mean distance from ground level to the top of the peeled area on the bole was 4.6 feet (standard error = 0.18 feet). The mean length of the peeled area on the bole (distance from bottom to top of peeled area) was 3.6 feet (standard error = 0.14 feet). The frequency distribution of the distance from ground level to the bottom of the peeled area on the bole, and of the length of the peeled area on the bole, are shown in Figures 10 and 11, respectively.
Figure 10. Frequency distribution of the distance from ground level to the bottom of the peeled area on the bole, Aerial survey for tree mortality in Northwest Oregon 2000.
Figure 10. Frequency distribution of distance above ground to the base of the peeled
area on bole
922
32 11 8 12 17 10 2 0 00
100
200
300
400
500
600
700
800
900
1000
0.0-2.0 2.1-4.0 4.1-6.0 6.1-8.0 8.1-10.0 10.1-15.0 15.1-20.0 20.1-25.0 25.1-30.0 >30
Distance above ground (Feet)
Nu
mbe
r o
f tr
ee
s
Black Bear Damage to Forest Trees in Northwest Oregon 24
Figure 11. Frequency distribution of the length of the peeled area on the bole, Aerial survey for tree mortality in Northwest Oregon 2000.
We did not estimate the amount of degrade that would result from bear damage. However, we expect significant reduction in wood quality from decay and stain in injured non-resinous species. Injured trees may also attract woodborers and bark beetles, which could further degrade or damage trees. Pierson (1966) refers to a US Forest service study that sectioned one hundred 35-year-old Douglas-fir trees that had been damaged by bear. Merchantable volume loss was 10 percent for trees with more than half the circumference peeled and 7 percent for trees with less than half the circumference peeled. Crown Color of Bear-Damaged Trees Trees with red, brown or yellow foliage are detectable during aerial surveys. Eighty-five percent of the trees completely peeled in 1999, and 15% of the trees peeled in 2000 were in this condition during the time of the ground survey (Table 14). These results support timing the aerial survey for June and early July, before much needle loss has occurred on trees peeled the previous year, and before symptoms of current-year peeling have developed.
Figure 11. Frequency distribution of the vertical length of the peeled area on bole
461
318
135
3919 18 11 8 3 1 1 0
0
50
100
150
200
250
300
350
400
450
500
0.0-2.0 2.1-4.0 4.1-6.0 6.1-8.0 8.1-10.0 10.1-15.0 15.1-20.0 20.1-30.0 30.1-40.0 40.1-50.0 50.1-60.0 >60
Vertical length of peeled area on bole, feet
Num
be
r o
f tr
ee
s
Black Bear Damage to Forest Trees in Northwest Oregon 25
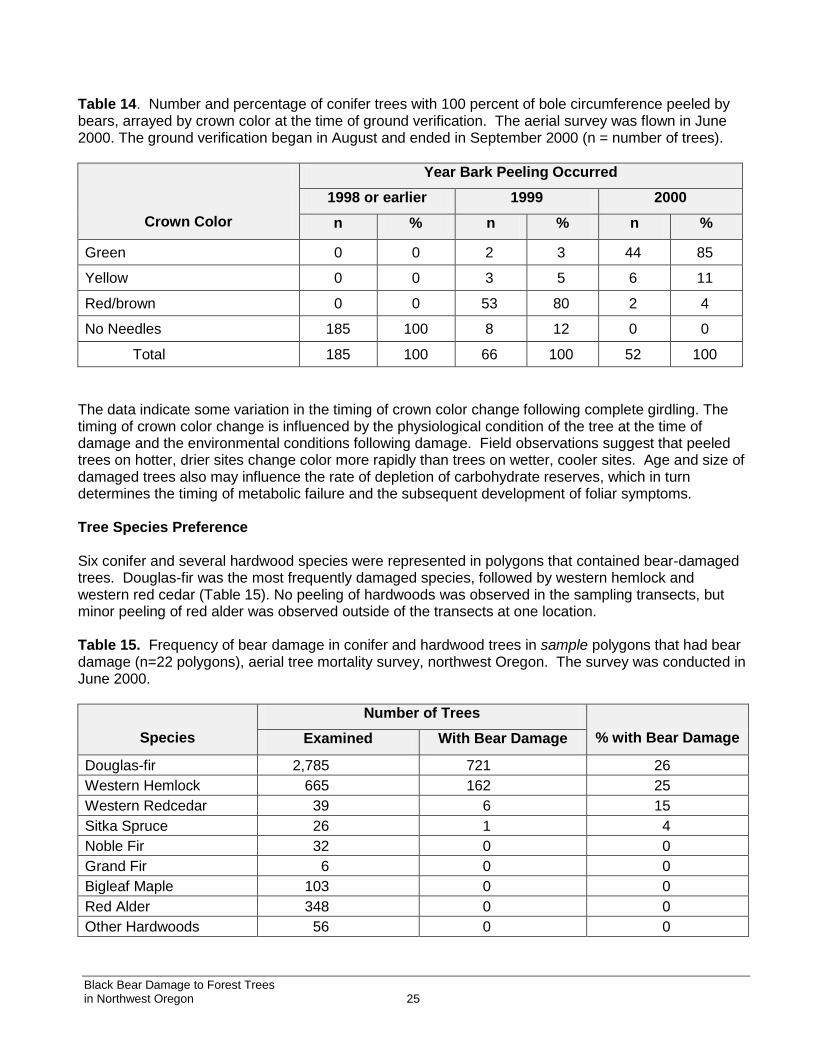
Table 14. Number and percentage of conifer trees with 100 percent of bole circumference peeled by bears, arrayed by crown color at the time of ground verification. The aerial survey was flown in June 2000. The ground verification began in August and ended in September 2000 (n = number of trees).
Crown Color
Year Bark Peeling Occurred
1998 or earlier 1999 2000
n % n % n %
Green 0 0 2 3 44 85
Yellow 0 0 3 5 6 11
Red/brown 0 0 53 80 2 4
No Needles 185 100 8 12 0 0
Total 185 100 66 100 52 100
The data indicate some variation in the timing of crown color change following complete girdling. The timing of crown color change is influenced by the physiological condition of the tree at the time of damage and the environmental conditions following damage. Field observations suggest that peeled trees on hotter, drier sites change color more rapidly than trees on wetter, cooler sites. Age and size of damaged trees also may influence the rate of depletion of carbohydrate reserves, which in turn determines the timing of metabolic failure and the subsequent development of foliar symptoms. Tree Species Preference Six conifer and several hardwood species were represented in polygons that contained bear-damaged trees. Douglas-fir was the most frequently damaged species, followed by western hemlock and western red cedar (Table 15). No peeling of hardwoods was observed in the sampling transects, but minor peeling of red alder was observed outside of the transects at one location. Table 15. Frequency of bear damage in conifer and hardwood trees in sample polygons that had bear damage (n=22 polygons), aerial tree mortality survey, northwest Oregon. The survey was conducted in June 2000.
Species
Number of Trees
% with Bear Damage Examined With Bear Damage
Douglas-fir 2,785 721 26
Western Hemlock 665 162 25
Western Redcedar 39 6 15
Sitka Spruce 26 1 4
Noble Fir 32 0 0
Grand Fir 6 0 0
Bigleaf Maple 103 0 0
Red Alder 348 0 0
Other Hardwoods 56 0 0
Black Bear Damage to Forest Trees in Northwest Oregon 26
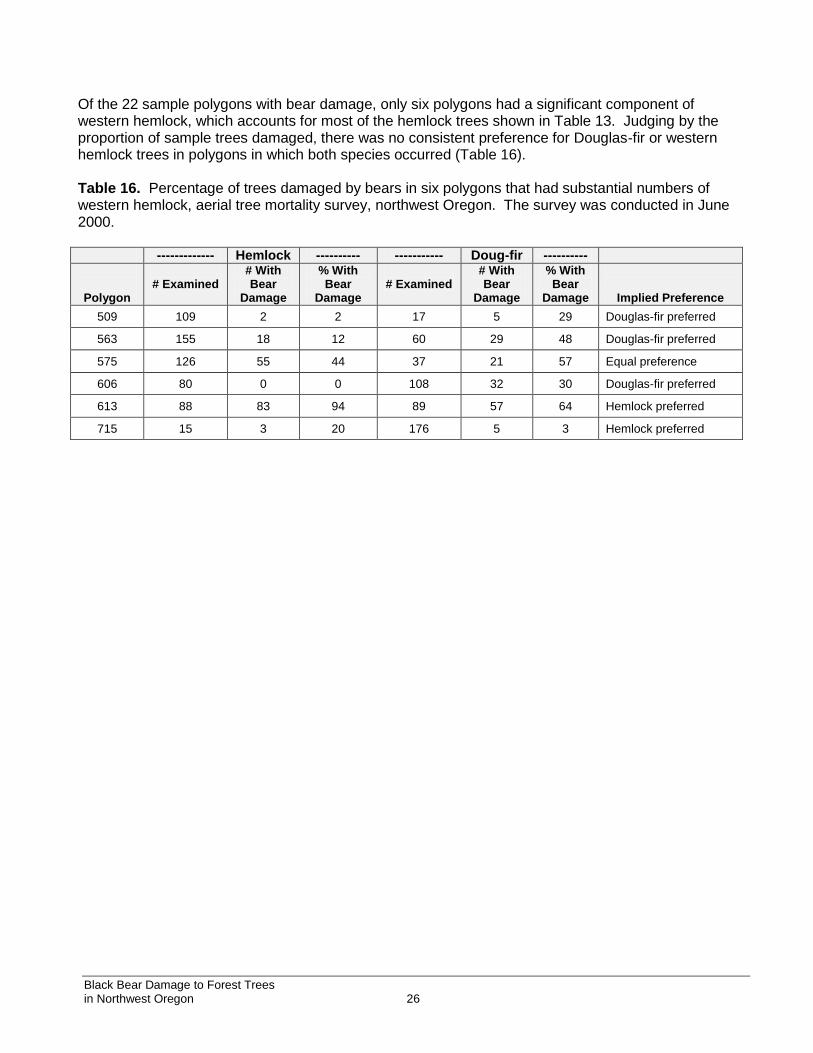
Of the 22 sample polygons with bear damage, only six polygons had a significant component of western hemlock, which accounts for most of the hemlock trees shown in Table 13. Judging by the proportion of sample trees damaged, there was no consistent preference for Douglas-fir or western hemlock trees in polygons in which both species occurred (Table 16). Table 16. Percentage of trees damaged by bears in six polygons that had substantial numbers of western hemlock, aerial tree mortality survey, northwest Oregon. The survey was conducted in June 2000.
------------- Hemlock ---------- ----------- Doug-fir ----------
Polygon
# Examined
# With Bear
Damage
% With Bear
Damage
# Examined
# With Bear
Damage
% With Bear
Damage
Implied Preference
509 109 2 2 17 5 29 Douglas-fir preferred
563 155 18 12 60 29 48 Douglas-fir preferred
575 126 55 44 37 21 57 Equal preference
606 80 0 0 108 32 30 Douglas-fir preferred
613 88 83 94 89 57 64 Hemlock preferred
715 15 3 20 176 5 3 Hemlock preferred
Black Bear Damage to Forest Trees in Northwest Oregon 27
CONCLUSIONS AND RECOMMENDATIONS Our estimates of number of trees damaged or killed by bear in the survey area are conservative. A large source of error is in the ability of aerial observers to detect all areas with bear damage. Ground survey crews and the helicopter observers often noted areas of bear damage that were not mapped during the aerial survey. In addition, areas with partially damaged trees and no mortality (no red crowns) were not visible from the air and could not be mapped. Therefore we have no estimate of the amount of bear damage that occurred in areas not mapped during the aerial survey. The 2000 ground verification project generally showed a smaller percentage of polygons with bear damage, and fewer trees damaged by bears than was estimated in the 1989 ground verification project. Although the different methodologies may explain some of these differences, they do not explain them all. It is possible that various bear damage control efforts and the intensification of Swiss needle cast both are having an effect on bear damage levels. Because the survey is a snapshot in time, it also is possible that environmental conditions affected symptom development and allowed detection of damage from root pathogens at a greater frequency in 2000 than in previous surveys. Although both the 1989 and 2000 ground verifications are valid, we recommend using the results of the 2000 project for describing aerial survey results for the next few years. The impact of killing trees in young stands depends not only on the number of trees killed, but also on their distribution. The sample polygon with the most severe bear damage had 27 trees per acre (tpa) killed by bear and 30 tpa partially peeled by bears. However, the overwhelming majority of polygons had 10 tpa or fewer trees damaged or killed by bear. Widely scattered mortality in an un-thinned stand could have the same effects as thinning, but in thinned or under-stocked stands, even small amounts of bear damage may reduce stocking of crop trees below the silvicultural optimum. This could negate many of the benefits of tree improvement and crop tree selection during thinning, especially since bears preferentially damage the largest and most vigorous trees in a stand. Regarding the aerial survey, we recommend that all observers train prior to a survey using a polygon size chart that is tailored to the scale of map they will use for sketching. Because it was difficult or impossible to sketch small polygons accurately, we considered polygons with an estimated area of 5 acres or less to be uniformly 5 acres in size for the analysis. It might be possible to estimate the area (acres) of small polygons (such as 2 or 3 acres) if the electronic map scale was adjusted, but the extra work required might not be feasible during busy survey periods. Standardization of how to group trees into polygons also is important for consistency among observers. Finally, we suggest a small project to ground-truth the “not bear” polygons, i.e., Douglas-fir bark beetle or other agents, to verify causal agents in these polygons.
Black Bear Damage to Forest Trees in Northwest Oregon 28
LITERATURE CITED: Childs, T. W. and N. P. Worthington. 1955. Bear damage to young Douglas-fir. USDA Forest Service Pacific Northwest Forest and range Experiment Station Research Note Number 113, Portland, Oregon. 4 p Hartwell, H. D.; Johnson, L. E. 1988. Silvicultural effects of basal girdling by black bear in a young Douglas-fir plantation. State of Washington Department of Natural Resources Technical report. 28 p. Kanaskie, A.; Chetock, J.; Irwin, G.; Overhulser, D. 1990. Black bear damage to forest trees in northwest Oregon, 1988-1989. . Oregon Department of Forestry Pest Management Report 90-1. Salem, OR. 34 p. Levin, O. R. 1954. The South Olympic Tree farm. Journal of Forestry 52:243-249. Maguire, Doug. 2000. Tarif Program version 5.0. Oregon State University, Corvallis, OR Maser, C. 1967. Black bear damage to Douglas-fir in Oregon. Murrelet 48(2):34-38. Nelson, E. E. 1989. Black bear prefer urea-fertilized trees. Western Journal of Applied Forestry 4(1):10-13. Oregon Department of Fish and Wildlife. 1987. Black bear management plan. Portland, Oregon Pierson, D. 1966. Washington's black bear problem. Pages 96-100 in Proceedings of the 46th Annual Conf. Wash. Assoc. State Game and Fish Comm. Poelker, R. J.; Hartwell., H. D. 1973. Black bear of Washington. Biol. Bull. 14, Washington State Game Department, Olympia, WA. Schmidt, W. C. , Gourley, Mark. 1992. Chapter 15 - Black Bear. Pages 309-331, In: Black, H., ed. Silvicultural approaches to animal damage management in Pacific Northwest forests. Gen. Tech. Rep. PNW-GTR-287. Portland, OR: U.S. Dept. Agric., Forest Service, Pacific Northwest Research Station. 422 p. Thompson, S. K. 1992. Sampling. John Wiley and Sons, Inc., New York. 343 p.

Black Bear Damage to Forest Trees in Northwest Oregon 29
ATTACHMENT Example of GIS-produced map of polygon location.