MARKET WATCHMARKET WATCH MILK - progressivedairy.com · 12 Progressive Dairyman Issue 6 • April...
2
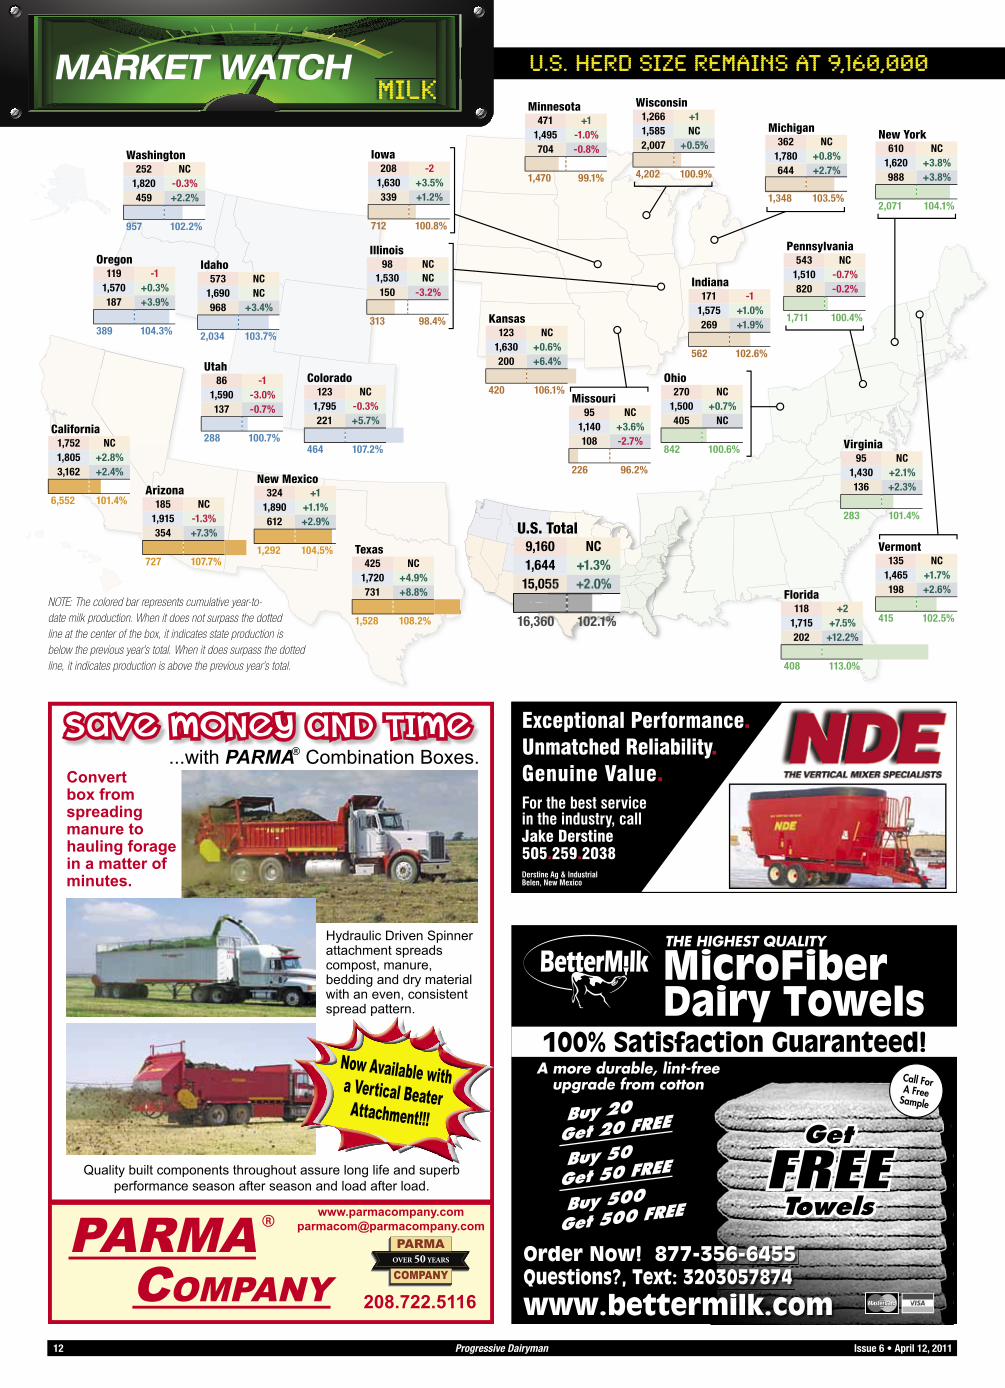
NOTE: The colored bar represents cumulative year-to- date milk production. When it does not surpass the dotted line at the center of the box, it indicates state production is below the previous year’s total. When it does surpass the dotted line, it indicates production is above the previous year’s total. MARKET WATCH MARKET WATCH U.S. Herd size remains at 9,160,000 MILK Texas 425 NC 1,720 +4.9% 731 +8.8% 1,528 108.2% Utah 86 -1 1,590 -3.0% 137 -0.7% 288 100.7% Vermont 135 NC 1,465 +1.7% 198 +2.6% 415 102.5% Virginia 95 NC 1,430 +2.1% 136 +2.3% 283 101.4% Washington 252 NC 1,820 -0.3% 459 +2.2% 957 102.2% Wisconsin 1,266 +1 1,585 NC 2,007 +0.5% 4,202 100.9% Arizona 185 NC 1,915 -1.3% 354 +7.3% 727 107.7% California 1,752 NC 1,805 +2.8% 3,162 +2.4% 6,552 101.4% Colorado 123 NC 1,795 -0.3% 221 +5.7% 464 107.2% Florida 118 +2 1,715 +7.5% 202 +12.2% 408 113.0% Idaho 573 NC 1,690 NC 968 +3.4% 2,034 103.7% Illinois 98 NC 1,530 NC 150 -3.2% 313 98.4% Indiana 171 -1 1,575 +1.0% 269 +1.9% 562 102.6% Iowa 208 -2 1,630 +3.5% 339 +1.2% 712 100.8% Kansas 123 NC 1,630 +0.6% 200 +6.4% 420 106.1% Michigan 362 NC 1,780 +0.8% 644 +2.7% 1,348 103.5% Minnesota 471 +1 1,495 -1.0% 704 -0.8% 1,470 99.1% Missouri 95 NC 1,140 +3.6% 108 -2.7% 226 96.2% New Mexico 324 +1 1,890 +1.1% 612 +2.9% 1,292 104.5% U.S. Total 9,160 NC 1,644 +1.3% 15,055 +2.0% 16,360 102.1% New York 610 NC 1,620 +3.8% 988 +3.8% 2,071 104.1% Ohio 270 NC 1,500 +0.7% 405 NC 842 100.6% Oregon 119 -1 1,570 +0.3% 187 +3.9% 389 104.3% Pennsylvania 543 NC 1,510 -0.7% 820 -0.2% 1,711 100.4% 12 Progressive Dairyman Issue 6 • April 12, 2011 Exceptional Performance. Unmatched Reliability . Genuine Value. For the best service in the industry, call Jake Derstine 505.259.2038 Derstine Ag & Industrial Belen, New Mexico A more durable, lint-free upgrade from cotton Get FREE Towels www.bettermilk.com Order Now! 877-356-6455 Questions?, Text: 3203057874 THE HIGHEST QUALITY MicroFiber Dairy Towels Buy 500 Get 500 FREE Buy 20 Get 20 FREE Buy 50 Get 50 FREE Call For A Free Sample 100% Satisfaction Guaranteed! Convert box from spreading manure to hauling forage in a matter of minutes. SAVE MONEY AND TIME ...with PARMA Combination Boxes. Hydraulic Driven Spinner attachment spreads compost, manure, bedding and dry material with an even, consistent spread pattern. 208.722.5116 www.parmacompany.com [email protected] PARMA COMPANY Quality built components throughout assure long life and superb performance season after season and load after load. ® ® Now Available with a Vertical Beater Attachment!!!
Transcript of MARKET WATCHMARKET WATCH MILK - progressivedairy.com · 12 Progressive Dairyman Issue 6 • April...
NOTE: The colored bar represents cumulative year-to-date milk production. When it does not surpass the dotted line at the center of the box, it indicates state production is below the previous year’s total. When it does surpass the dotted line, it indicates production is above the previous year’s total.
MARKET WATCHMARKET WATCH U.S. Herd size remains at 9,160,000MILK
Texas425 NC
1,720 +4.9%731 +8.8%
1,528 108.2%
Utah86 -1
1,590 -3.0%137 -0.7%
288 100.7%
Vermont135 NC
1,465 +1.7%198 +2.6%
415 102.5%
Virginia95 NC
1,430 +2.1%136 +2.3%
283 101.4%
Washington252 NC
1,820 -0.3%459 +2.2%
957 102.2%
Wisconsin1,266 +11,585 NC2,007 +0.5%
4,202 100.9%
Arizona185 NC
1,915 -1.3%354 +7.3%
727 107.7%
California1,752 NC1,805 +2.8%3,162 +2.4%
6,552 101.4%
Colorado123 NC
1,795 -0.3%221 +5.7%
464 107.2%
Florida118 +2
1,715 +7.5%202 +12.2%
408 113.0%
Idaho573 NC
1,690 NC968 +3.4%
2,034 103.7%
Illinois98 NC
1,530 NC150 -3.2%
313 98.4%
Indiana171 -1
1,575 +1.0%269 +1.9%
562 102.6%
Iowa208 -2
1,630 +3.5%339 +1.2%
712 100.8%
Kansas123 NC
1,630 +0.6%200 +6.4%
420 106.1%
Michigan362 NC
1,780 +0.8%644 +2.7%
1,348 103.5%
Minnesota471 +1
1,495 -1.0%704 -0.8%
1,470 99.1%
Missouri95 NC
1,140 +3.6%108 -2.7%
226 96.2%New Mexico
324 +11,890 +1.1%612 +2.9%
1,292 104.5%
U.S. Total9,160 NC1,644 +1.3%15,055 +2.0%
16,360 102.1%
New York610 NC
1,620 +3.8%988 +3.8%
2,071 104.1%
Ohio270 NC
1,500 +0.7%405 NC
842 100.6%
Oregon119 -1
1,570 +0.3%187 +3.9%
389 104.3%
Pennsylvania543 NC
1,510 -0.7%820 -0.2%
1,711 100.4%
12 Progressive Dairyman Issue 6 • April 12, 2011
Exceptional Performance.Unmatched Reliability.Genuine Value.For the best servicein the industry, callJake Derstine505.259.2038Derstine Ag & IndustrialBelen, New Mexico
A more durable, lint-free upgrade from cotton
Get
FREETowels
www.bettermilk.com
Order Now! 877-356-6455Questions?, Text: 3203057874
THE HIGHEST QUALITY
MicroFiberDairy Towels
Buy 500
Get 500 FREE
Buy 20Get 20 FREE
Buy 50Get 50 FREE
Call ForA Free
Sample
100% Satisfaction Guaranteed!
Convert box from spreading manure to hauling forage in a matter of minutes.
SAVE MONEY AND TIME...with PARMA Combination Boxes.
Hydraulic Driven Spinner attachment spreads compost, manure, bedding and dry material with an even, consistent spread pattern.
208.722.5116
COMPANY
Quality built components throughout assure long life and superb performance season after season and load after load.
®
®
Now Available with a Vertical Beater Attachment!!!

Of the 23 milk production reporting states, 19 had higher milk production than a year ago in February. � e four states with less milk production were Illinois, Missouri, Utah and Pennsylvania.
Florida led all states with relative increases in milk production, with February’s production 12.2 percent higher than a year ago. All Western states continue with increases in milk production, with production up in February 8.8 percent in Texas, 7.3 percent in Arizona, 5.7 percent in Colorado and 3.4 percent in Idaho.
Production was up just 2.4 percent for February in California. For the Northeast, as indicated, production was down in Pennsylvania but up in New York and Michigan. In the Upper Midwest, production was up just in Wisconsin and Iowa but down in Minnesota.
Milk production is likely to show relatively smaller increases as we approach summer. PD
FLORIDA year-To-Date production up 13%, leading the nation in increases
Florida118 +2
1,715 +7.5%202 +12.2%
408 113.0%
Legend
Number of cows(in thousands)
Milk per cow(month)
(lbs.)Total milk
production (month)
(in millions of lbs.)
Year-to-date milkproduction (total)(in millions of lbs.)
Percentage of year-to-date production versus previous year-to-date
Monthly change(in thousands)
Annual percentchange
Annual percentchange
95% 100% 105%
Mar2010
Jan2011
FebApr May June July Aug Sept Oct Nov Dec
2009
2010
9,000
9,050
9,100
9,150
9,200
9,250
9,300
Feb. 2011: 9,160 High: 9,283 Low: 9,082
Milk cows (in thousands)
Mar2010
Jan2011
FebApr May June July Aug Sept Oct Nov Dec
20092010
1,600
1,650
1,700
1,750
1,800
1,850 Feb. 2011: 1,761 High: 1,809 Low: 1,640Milk per cow (in pounds, 30-day equivalent )
Mar2010
Jan2011
FebApr May June July Aug Sept Oct Nov Dec
2009
2010
14,500
15,000
15,500
16,000
16,500
17,000 Feb. 2011: 16,130High: 16,490 Low: 14,923Milk production (in pounds, 30-day equivalent)
U.S. HERD STATS
Feb. daily avg. milk per cow: 58.7 lbs.
Bob CroppProfessor EmeritusUniversity of Wisconsin – Madison
CUT YOUR FEED COST!
®
FEEDING YOUR COWS RIGHT EVERY TIME IS THE BOTTOM LINE
800-225-7695 t m r t r a c k e r. c o m
FEEDFFFFEED
TMR TRACKERFEED MANAGEMENT SOFTWARE
800 225 7695 tt t
NEW! TMR Tracker Online!View/Edit data & reports from any PC
TOUCHING EMBRYOS!!HING EMBRYHING EMBRYSTOP BLOOD TEST
FOR PREGNANCYNoninvasive
Highly AccurateInexpensive
Dairy Pharm & Diagnostic Services, LLC
Frederic, WI
www.dairydoctor.com
715-653-2201
Special introductory price!
per test
$2
Issue 6 • April 12, 2011 Progressive Dairyman 13