Market volatility conversations...Volatility is back < Market volatility has been increasing since...
21
Market volatility conversations
Transcript of Market volatility conversations...Volatility is back < Market volatility has been increasing since...

Market volatility conversations

Managing volatility – focus on what you can control
Maintain a long-term focus Stay invested Diversify Employ tactical asset
allocation
Probability of negative returns historically
decreased with extended time horizon.
Resisting temptation to time the market can help ensure
participation in the rebounds.
Structure the portfolio to have exposure to assets that are not perfectly correlated to reduce overall volatility.
Shifting risk exposure as market moves through the
cycle can add to incremental returns.

To avoid some of the common mistakes that can derail your plan
Managing volatility: stick to your plan
Failing to diversify
Selling low
Missing the best
trading days
Reacting to the media
Trying to time the market
Not controlling what you
can
Focusing on the short-term

To the old normal
Volatility is back
< Market volatility has been increasing since 2017.
< However, It is not that the current levels of volatility are unusual, rather it is that 2017 was unusually calm.
< In 2017 the S&P 500 only had 4 days when the index was down between 1% and 2%...
< …Compare that to the average of ~24 days per year of 1% to 2% declines over the past two decades.
S&P 500 daily declines by magnitude
Source: Bloomberg L.P as at December 31, 2019
0
10
20
30
40
50
60
70
80
-1% to -2% -2% to -3% -3% to -4% -4% or worse

Putting equity market performance in context
The “old normal”
< Despite average intra-year drops of 13.9%, annual returns for S&P 500 have been positive in 30 out of 40years (75% of time).
< Corrections (drawdowns of 10% or more) or bear markets (drawdowns of 20% or more) have happened in 22 out of 40 years.
< Even the current bull market has experienced 7 declines in excess of 10%.
S&P 500 intra-year declines vs. calendar year returns
Source: J.P. Morgan, Guide to the Markets, December 31, 2019.
-50
-30
-10
10
30
50
1990
1991
1992
1993
1994
1995
1996
1997
1998
1999
200
0
200
1
200
2
200
3
200
4
200
5
200
6
200
7
200
8
200
9
2010
2011
2012
2013
2014
2015
2016
2017
2018
2019
Calendar return Intra-year max drawdown

Earnings growth was expected to pick up from last year, but near-term
expectations are likely to be revised lower due to the impact of COVID-19 outbreak.
Maturing business cycle The impact of COVID-19 outbreak on global economic growth, particularly in
the context of a maturing business cycle, has magnified the uncertainty.
Exogenous event: COVID-19
The “old normal” is the way forward
as the business cycles progresses and uncertainties remain
Market volatility may be exacerbated by the upcoming federal elections in the U.S.
U.S. elections
$
Poor liquidity can exacerbate market moves as there are fewer buyers to step
in during periods of market sell offs.
Liquidity
Economic developments in China, which now accounts for ~16% of global GDP, will
have implications for global growth.
China slowdown
Interest rates are expected to remain low given the maturing business cycle. Additional policy support is increasingly likely as on offset to the
economic impact of the virus outbreak.
Monetary and fiscal policy

But uncertainty has always been a part of investing
Times change, but nothing is really different
Cuban missile crisis Vietnam War
Great inflation starts S&P 500 - 3 bear markets
1960s 1973 Arab oil embargo Oil price quadruples
Energy crisis sparks economic crisis End of gold standard
S&P 500 plunges 45.1% (1973 – 1974) Prime rate surges to 15.7%
1980s
2 recessions (2001 & 2007) 2 massive bear markets (dotcom and credit
crisis) Corporate misconduct
Iraq war Hurricane Katrina
Peak oil $145/barrel Intro of negative interest rates
2000s
1970s
Fed raises rates to 20% as inflation peaks Recession
Iraq invades Iran LatAm sovereign debt crisis
Savings & loan crisis “Black Monday” DJIA falls 22.6%
Junk bond crash
1990s 2010s
Recession Gulf war
Tequila crisis Asian currency crisis
Russian default & crisis LTCM collapse
Y2K worries
Gulf oil spill U.S. - debt ceiling, credit downgrade,
fiscal cliff European sovereign debt crisis
Japan tsunami & nuclear disaster ECB – negative interest rates
Oil price declines Rise of populism
E.U. issues - Brexit, Italy, Spain

And disciplined investors have been rewarded
Market rebounds have been powerful
Select crises since 1960 Market low
Cuban missile crisis 23/10/1962
JFK assassination 23/11/1963
1969 to 1970 market break 26/05/1970
1973 to 1974 market break 06/12/1974
1979 to 1980 oil crisis 27/03/1980
1987 stock market crash 19/10/1987
Desert storm 11/10/1990
Asian financial crisis 02/04/1997
Dotcom bubble crash/Sept 11/Enron 09/10/2002
Invasion of Iraq 11/03/2003
Subprime mortgage crisis 09/03/2009
33.8%
25.0%
43.6%
42.2%
27.9%
22.9%
21.1%
49.3%
33.7%
38.2%
68.6%
57.3%
33.0%
53.9%
66.5%
5.9%
54.3%
30.2%
76.2%
44.8%
50.6%
95.1%
1-yr later 2-yr later
U.S. equities change in market value 1 and 2 years after lows Cumulative total returns since 1960 to 2019*:
S&P 500 Index + 29,772%
S&P/TSX Composite Index + 5,808%
Source: Bloomberg L.P. Select significant international events from 1960 and the subsequent change in market value from the stock market low in that calendar year to one and two years later. Based on performance of S&P 500 Composite, ($US). *Source: Bloomberg L.P. January 1, 1960 – December 31, 2019, based on S&P 500 Total Return Index ($US) and S&P/TSX Composite Total Return Index.

But what about economic downturns?
Table of five recessions: returns are not always negative
1 2 3 4 5
Start November 1973 January 1980 July 1981 July 1990 December 2007
End March 1975 July 1980 November 1982 March 1991 June 2009
End announced March 1975 July 1981 July 1983 December 1992 September 2010
Details Oil embargo causes oil prices to quadruple Inflation rate soars
Double digit inflation since mid 1970s Oil imports reduced from Iran US central bank aggressively raises interest rates
Runaway inflation: $1 in 1975 has same buying power as $2 in 1985 US central bank raises rates from 11% in 1979 to 20% in 1981
Real estate bubble of the late 1980s bursts Savings and loan crisis – 1,000 + institutions go bankrupt (1986 – 1995)
US housing downturn, subprime mortgage meltdown, global financial crisis Recession lasted 18 months – the longest since WWII
S&P 500 recession return* -18.0% 16.4% 14.2% 7.9% -35.0%
Source: NBER (U.S. Business cycle expansions and contractions), Bloomberg L.P. S&P 500 Total Return Index ($US) based on monthly returns.*Total return from start of recession (including the start month) to end. **Total return for the 24-month period following recession end announcement.

What we know for sure: markets move in cycles
And so do investor emotions
$0
$200
$400
$600
$800
$1,000
$1,200
1990
1991
1992
1993
1994
1995
1996
1997
1998
1999
200
0
200
1
200
1
200
2
200
3
200
4
200
5
200
6
200
7
200
8
200
9
2010
2011
2012
2012
2013
2014
2015
2016
2017
2018
2019
Surprised Thrilled
Euphoric
Confident
Positive
Panic Nervous
Encouraged
Dotcom crash
9/11 attacks
Hopeful
Encouraged
Thrilled
Euphoric
Confident
U.S. housing booms
2008 financial crisis
Surprised
Panic
Nervous
Confident
Positive
Encouraged
Hopeful
Quantitative easing
Source: Bloomberg L.P. S&P/TSX Composite Total Return Index ($C) as at December 31, 2019.
< Markets move in cycles. A full market cycle includes both a bear and a bull market, but it is impossible to time when a bull market ends and a bear begins and vice versa.
< Staying invested has been one of the most prudent strategies for building long-term wealth.

Emotions – one of few things investors can control
But typically do not, selling at market lows and missing out on rebounds
9.9%
7.7% 7.0%
5.6% 5.2% 5.0% 4.5%
4.0% 3.4%
2.2% 1.9%
REITs Gold Oil S&P 500 60/40Portfolio
40/60Portfolio
Bonds EAFE Homes Inflation Averageinvestor
Source: J.P. Morgan Asset Management; (Top) Barclays, Bloomberg, FactSet, Standard & Poor’s; (Bottom) Dalbar Inc. Indices used are as follows: REITS: NAREIT Equity REIT Index, EAFE: MSCI EAFE, Oil: WTI Index, Bonds: Bloomberg Barclays U.S. Aggregate Index, Homes: median sale price of existing single-family homes, Gold: USD/troy oz., Inflation: CPI. 60/40: A balanced portfolio with 60% invested in S&P 500 Index and 40% invested in high-quality U.S. fixed income, represented by the Bloomberg Barclays U.S. Aggregate Index. The portfolio is rebalanced annually. Average asset allocation investor return is based on an analysis by Dalbar Inc., which utilizes the net of aggregate mutual fund sales, redemptions and exchanges each month as a measure of investor behavior. Returns are annualized (and total return where applicable) and represent the 20-year period ending 12/31/18 to match Dalbar’s most recent analysis. The data is representative of U.S. market. Not the Canadian market.
< Trying to time the market contributes to investor mistakes.
< Periods of turmoil and declines have subsequently proved to be some of the best times to invest.
< Some of the strongest rallies occurred as stocks bounced back from recessionary levels.
Which may have led to poor relative returns for average investor

What we know for sure: missing best days can be damaging
Adversely impacting longer-term returns
$10,000 invested in TSX for 15 years ending February 26, 2020
< Declines are painful to endure, but missing even on part of an average bull market’s gain could have a more adverse impact on wealth.
< The annualized total return for the S&P 500 over the past 15 years was 8.8%. Missing just 10 best trading days (only 10 out of 3,775) would have cut the annualized return by more than half to 3.9%!!!
$19,060
$10,381
$7,057
Stayed fully invested
Missed best 10 days
Missed best 20 days
$10,000 invested in S&P 500 for 15 years ending February 26, 2020
$20,908
$10,546
$6,848
Stayed fully invested
Missed best 10 days
Missed best 20 days
Source: Bloomberg L.P., S&P/TSX Composite Total Return Index and S&P 500 Total Return Index ($US).

What we know for sure: a bear market will eventually come
< Markets spend more time in positive territory than in negative.
< Bull markets are, on average longer and more intense, providing a more significant percentage change.
< On average, bear markets are brief, but instill fear.
< Investor discipline during bear markets is critical.
The good news: short-term pain, long-term gain
-100%
-50%
0%
50%
100%
150%
200%
250%
1960 1965 1970 1975 1980 1985 1990 1995 2000 2005 2010 2015
42% 17
60% 40
-18% 9
-17% 8
49% 32
-28% 13
64% 40
-37% 11
35% 21
-43% 9
188% 74
-43% 19
195% 61
-26% 4
-23% 14
178% 90
-28% 4
109% 24
-38% 14
16% 6
-21% 6
168% 68
194% 131
Bear markets relatively short, bulls lengthier and more intense Average gain in bull market 108%
Average length of bull market 50 months
Average loss in bear market 29%
Average length of bear market 10 months
Bulls, bears, and changes of more than 15% (monthly data) S&P/TSX Composite (% change and duration in months)
Source: Bloomberg L.P. S&P/TSX Composite Total Return Index ($C) August 31, 1960 – December 31, 2019 based on monthly returns.

What we know for sure: a bear market will eventually come
The good news: short-term pain, long-term gain
Bear markets relatively short, bulls lengthier and more intense Bulls, bears, and changes of more than 15% (monthly data) S&P 500 (% change and duration in months)
-200%
-100%
0%
100%
200%
300%
400%
500%
600%
1960 1965 1970 1975 1980 1985 1990 1995 2000 2005 2010 2015
32% 25
90% 43
-22% 6
-16% 7
51% 27
-29% 19
176% 30
-43% 21
-51% 16
198% 74
-17% 20
280% 61
-30% 3
-15% 5
514% 113
-44% 30
71% 30
108% 61
451% 130 < Markets spend more time in positive
territory than in negative.
< Bull markets are, on average longer and more intense, providing a more significant percentage change.
< On average, bear markets are brief, but instill fear.
< Investor discipline during bear markets is critical.
Average gain in bull market 197%
Average length of bull market 59 months
Average loss in bear market 30%
Average length of bear market 14 months
Source: Bloomberg L.P. S&P/TSX Composite Total Return Index ($C) August 31, 1960 – December 31, 2019 based on monthly returns.

Managing volatility: maintain a long-term focus
Downside risk materially reduced as holding period increases
Longer time horizon reduces volatility
1-year
25% 21%
Source: Bloomberg total returns (January 1960 – February 2020) for the S&P 500 Total Return Index ($US) and S&P/TSX Composite Total Return ($C).
-39% -43%
-11% -16% -2% -7%
3% -3%
87%
61%
39% 33% 28% 30% 20% 19% 11% 11% 10% 10% 9% 10% 9% 10%
1 yr 3 yr 5 yr 10 yr
S&P/TSX Composite Index
S&P 500 Index
Highs, lows, and average rolling returns across various periods
Historical % negative returns
3-year
5-year 10-year
11% 13%
2% 9%
0% 4%

Managing volatility: stay invested
Resist the temptation to time the market
Source: Bloomberg total returns for the S&P 500 Total Return Index ($US)
Importance of staying invested S&P 500 ($US) growth of $10,000
$0
$5,000
$10,000
$15,000
$20,000
$25,000
$30,000
$35,000
Staying invested in the stock market
Exit market and reinvest after 1 year
Financial crisis 2008: Staying invested versus exiting
the market
$27,493
$19,503
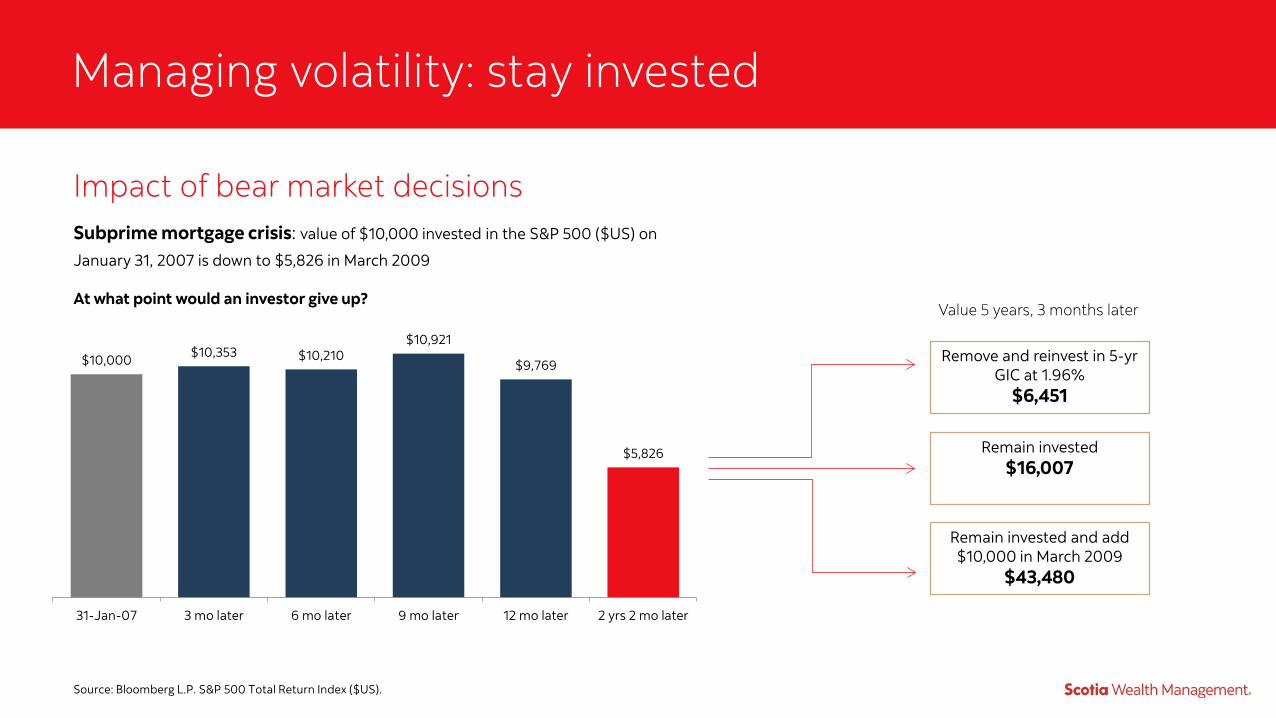
Managing volatility: stay invested
Impact of bear market decisions
Source: Bloomberg L.P. S&P 500 Total Return Index ($US).
Subprime mortgage crisis: value of $10,000 invested in the S&P 500 ($US) on
January 31, 2007 is down to $5,826 in March 2009
At what point would an investor give up?
$10,000 $10,353 $10,210 $10,921
$9,769
$5,826
31-Jan-07 3 mo later 6 mo later 9 mo later 12 mo later 2 yrs 2 mo later
Value 5 years, 3 months later
Remove and reinvest in 5-yr GIC at 1.96%
$6,451
Remain invested $16,007
Remain invested and add $10,000 in March 2009
$43,480

Managing volatility: diversify to limit downside
And to help ensure you have exposure to the winners
< Over the past 15 years, a sample diversified asset allocation portfolio has delivered strong risk-adjusted returns, largely on lower volatility.
< Diversification can help limit downside risk, smooth out the returns, and capture performance from some of the top performing asset classes.
Source: Bloomberg L.P., Scotia Wealth Management as at February 28, 2020 Notes: Equity index total returns in ($C). Fixed income index returns in ($C), 100% hedged. Indices used are the S&P/TSX Composite Index, S&P500 Index, MSCI World ex-U.S. Index, MSCI Emerging Markets Index, BofA Merrill Lynch (BAML) Global Government Bond Index, BAML Global Corporate Bond Index, BAML Global High Yield Bond Index, Scotia Multi-Strategy Hedge Fund Index. Asset Allocation is 65% Equities (20% Canada, 30% U.S. and 15% International), 25% Fixed Income (5% Sovereign, 10% Investment Grade, 10% High Yield) and 10% Alts (5% Gold and 5% Hedge Funds).
RETURN ST. DEV
Equities U.S.
20.7%
Equities Canada 21.1%
Equities Intl
22.3%
Alternative Assets 4.1%
Equities U.S.
25.3%
Equities U.S. 9.6%
Equities U.S.
11.2%
Alternative Assets 10.7%
Bonds High Yield
15.7%
Equities U.S.
13.5%
Equities U.S. 4%
Equities Canada 22.9%
Asset Allocation 7.8%
Asset Allocation 7.6%
Equities Intl
8.8%
Asset Allocation 10.1%
Asset Allocation 10.8%
Bonds Sovereign
2%
Asset Allocation 18.1%
Equities Intl
7.2%
Equities Intl
13.5%
Asset Allocation 6.9%
Equities U.S. 8.9%
Equities Canada
9.1%
Asset Allocation -1.5%
Equities Intl
15.2%
Equities Canada
7.2%
Equities Canada 12.4%
Bonds Sovereign
2%
Bonds Invst Grade
5.8%
Bonds High Yield
7.5%
Bonds Invst Grade
-1.6%
Bonds High Yield
13.4%
Bonds High Yield
6.9%
Bonds High Yield
9.2%
Bonds Invst Grade
0.4%
Equities Intl
4.6%
Bonds Invst Grade
5.3%
Bonds High Yield
-2.8%
Bonds Invst Grade
11.6%
Alternative Assets 5.6%
Alternative Assets 9.6%
Bonds High Yield
-2%
Bonds Sovereign
3.6%
Alternative Assets 2.5%
Equities Intl
-6.4%
Alternative Assets 8.1%
Bonds Invst Grade
4.8%
Bonds Invst Grade
4%
Equities Canada -8.3%
Alternative Assets 2.4%
Bonds Sovereign
1.8%
Equities Canada -8.9%
Bonds Sovereign
6.4%
Bonds Sovereign
4.2%
Bonds Sovereign
3%
201915 YEAR ANNUALIZED
2016 2017 20182015
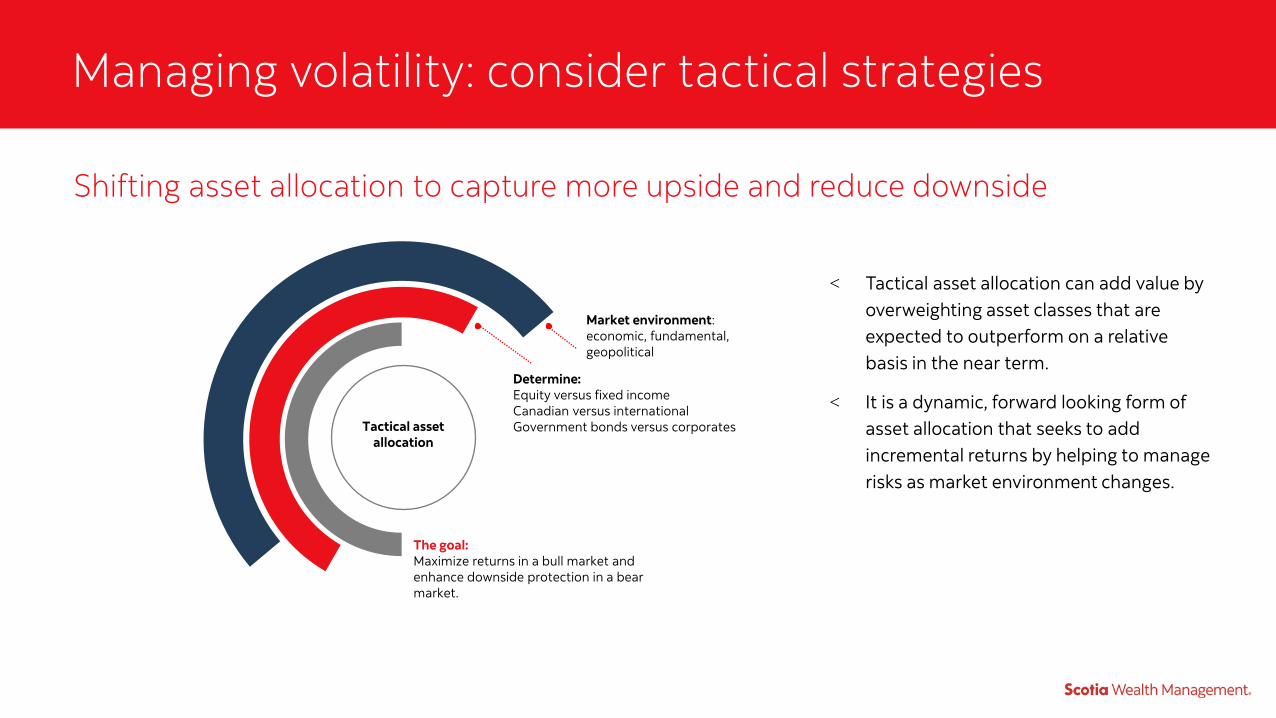
Managing volatility: consider tactical strategies
Shifting asset allocation to capture more upside and reduce downside
Tactical asset allocation
The goal: Maximize returns in a bull market and enhance downside protection in a bear market.
Market environment: economic, fundamental, geopolitical
Determine: Equity versus fixed income Canadian versus international Government bonds versus corporates
< Tactical asset allocation can add value by overweighting asset classes that are expected to outperform on a relative basis in the near term.
< It is a dynamic, forward looking form of asset allocation that seeks to add incremental returns by helping to manage risks as market environment changes.

This report is provided to you for informational purposes only and is not intended to provide personal investment advice. This report does not include or constitute an investment recommendation and does not take into account the particular investment objectives, financial conditions, or specific needs of individual clients. Any statements regarding future prospects may not be realized. Before acting on this material, you should consider whether it is suitable for your particular circumstances and talk to your investment advisor.
The author(s) of the report and the supervisors of the Global Portfolio Advisory Group may own securities of the companies included herein.
Scotia Capital Inc. is what is referred to as an “integrated” investment firm since we provide a broad range of corporate finance, investment banking, institutional trading and retail client services and products. As a result we recognize that there are inherent conflicts of interest in our business since we often represent both sides to a transaction, namely the buyer and the seller. While we have policies and procedures in place to manage these conflicts, we also disclose certain conflicts to you so that you are aware of them. Please note that we may have, from time to time, relationships with the companies that are discussed in this report.
The Global Portfolio Advisory Group prepared this report by analyzing information from various sources. Information obtained in the preparation of this report may have been obtained from the Equity Research and Fixed Income Research departments of the Global Banking and Markets division of Scotiabank. Information may be also obtained from the Foreign Exchange Research and Scotia Economics departments within Scotiabank. In addition to information obtained from members of the Scotiabank group, information may be obtained from the following third party sources: Standard & Poor’s, Morningstar, Bloomberg, Credit Suisse AG, Perimeter Markets Inc., and FactSet. The information and opinions contained in this report have been compiled or arrived at from sources believed reliable but no representation or warranty, express or implied, is made as to their accuracy or completeness.
While the information provided is believed to be accurate and reliable, neither Scotia Capital Inc., which includes the Global Portfolio Advisory Group, nor any of its affiliates makes any representations or warranties, express or implied, as to the accuracy or completeness of such information. Neither Scotia Capital Inc. nor its affiliates accepts any liability whatsoever for any direct or consequential loss arising from any use of this report or its contents.
Nothing contained in this report is or should be relied upon as a promise or representation as to the future. The pro forma and estimated financial information contained in this report, if any, is based on certain assumptions and analysis of information available at the time that this information was prepared, which assumptions and analysis may or may not be correct. There is no representation, warranty or other assurance that any projections contained in this report will be realized.
Opinions, estimates and projections contained herein are those of the Global Portfolio Advisory Group as of the date hereof and are subject to change without notice. For that reason, it cannot be guaranteed by The Bank of Nova Scotia or any of its subsidiaries, including Scotia Capital Inc. This report is not, and is not to be construed as: (i) an offer to sell or solicitation of an offer to buy securities and/or commodity futures contracts; (ii) an offer to transact business in any jurisdiction; or (iii) investment advice to any party. Products and services described herein are only available where they can be lawfully provided. Scotia Capital Inc. and its affiliates and/or their respective officers, directors or employees may from time to time acquire, hold or sell securities and/or commodities and/or commodity futures contracts mentioned herein as principal or agent.
Trademarks are the property of their respective owners.
Copyright 2019 Scotia Capital Inc. All rights reserved.
This report is distributed by Scotia Capital Inc., a subsidiary of The Bank of Nova Scotia. Scotia Capital Inc. is a member of the Canadian Investor Protection Fund and the Investment Industry Regulatory Organization of Canada.
Disclaimer

® Registered trademark of The Bank of Nova Scotia, used under licence. Scotia Wealth Management® consists of a range of financial services provided by The Bank of Nova Scotia (Scotiabank®); The Bank of Nova Scotia Trust Company (Scotiatrust®); Private Investment Counsel, a service of 1832 Asset Management L.P.; 1832 Asset Management U.S. Inc.; Scotia Wealth Insurance Services Inc.; and ScotiaMcLeod®, a division of Scotia Capital Inc. Private banking and International private banking services are provided in Canada by The Bank of Nova Scotia. Estate and trust services are provided by The Bank of Nova Scotia Trust Company. Portfolio management is provided by 1832 Asset Management L.P. and 1832 Asset Management U.S. Inc. Insurance services are provided by Scotia Wealth Management Insurance Services Inc. Wealth advisory and brokerage services are provided by ScotiaMcLeod, a division of Scotia Capital Inc. International investment advisory services are provided in Canada by Scotia Capital Inc. Financial planning services are provided by The Bank of Nova Scotia, 1832 Asset Management L.P., and ScotiaMcLeod, a division of Scotia Capital Inc. Scotia Capital Inc. is a member of the Canadian Investor Protection Fund and the Investment Industry Regulatory Organization of Canada. Scotia Wealth Insurance Services Inc. is the insurance subsidiary of Scotia Capital Inc., a member of the Scotiabank group of companies. When discussing life insurance products, ScotiaMcLeod advisors are acting as Life Insurance Agents (Financial Security Advisors in Quebec) representing Scotia Wealth Insurance Services Inc.
Scotia Wealth Management consists of a range of financial services provided, in The Bahamas, by Scotiabank (Bahamas) Limited and The Bank of Nova Scotia Trust Company (Bahamas) Limited. International private banking services are provided in The Bahamas by Scotiabank (Bahamas) Limited, an entity registered with The Central Bank of The Bahamas. International investment advisory services are provided in The Bahamas by Scotiabank (Bahamas) Limited, an entity registered with The Securities Commission of The Bahamas. International wealth structuring solutions are provided in The Bahamas by The Bank of Nova Scotia Trust Company (Bahamas) Limited, an entity registered with The Central Bank of The Bahamas.
Scotia Wealth Management consists of international investment advisory services provided, in Barbados, by The Bank of Nova Scotia, Barbados Branch, an entity licensed by the Barbados Financial Services Commission.
Scotia Wealth Management consists of a range of financial services provided, in the Cayman Islands, by Scotiabank & Trust (Cayman) Ltd. International private banking services, international investment advisory services and international wealth structuring solutions are provided in the Cayman Islands by Scotiabank & Trust (Cayman) Ltd., an entity licensed by the Cayman Islands Monetary Authority.
Scotia Wealth Management consists of international private banking services provided, in Peru, by Scotiabank Peru S.A.A, an entity supervised by the Peru Superintendence of Banking and Insurance.
Disclaimer (continued)