
Economic & Fiscal Impact of Introducing Broadband Networks and ...

MARKET STUDY AND ECONOMIC AND FISCAL IMPACT
ANALYSIS OF WILDERNESS CROSSING DEVELOPMENT
(2020-2030) Orange County, Virginia
Prepared by:
RKG Associates, Inc. Economic, Planning and Real Estate Consultants
300 Montgomery Street, Suite 203 Alexandria, Virginia 22314 Tel: 703.739.0965
www.rkgassociates.com
January 2021

Market Study and Economic and Fiscal Impact Analysis of
Wilderness Crossing Development (2020-2030)
Orange County, Virginia
January 2021
Prepared for:
Mr. Ken Dodson
Keg 3 and Associates LLC 33225 Constitution Highway
Locust Grove, VA 22508
Tel: 540-840-5335
E-mail: [email protected]
Prepared by:
300 Montgomery Street, Suite 203
Alexandria, VA 22314 Tel: 703-739-0965 Website: www.rkgassociates.com

Wilderness Crossing Market, Economic, and Fiscal Impact Analysis Orange County, Virginia January 2021
Page 1-1
1 SUMMARY OF FINDINGS
A. INTRODUCTION Wilderness Crossings is proposed mixed-use development is located in Locust Grove in eastern Orange County, Virginia. RKG was engaged to provide three analyses related to the proposed development:
• Market Analysis – an evaluation of the market opportunity for both residential and commercial land uses
• Economic Impact Analysis – an evaluation of direct, indirect, and induced impacts on employment, wages, and economic output as a result of the proposed development
• Fiscal Impact Analysis – an evaluation of the effects the proposed development would have on Orange County’s municipal service demand and budget.
RKG’s approach to the engagement included an initial site assessment to understand the advantages/disadvantages of the site compared to the broader local and regional market. RKG also gathered data on local and regional economics, demographics, and real estate fundamentals from the client, county, and third-party data providers. This information helped RKG to establish an understanding of existing conditions in the market today and start to understand how market dynamics could evolve in the future. RKG also conducted interviews with market professionals to provide additional insight into the local market. From there, RKG was able to make recommendations around a proposed development program for the first ten years of development at Wilderness Crossing – including pricing, absorption, and market segmentation. After a proposed development program was established, RKG evaluated the economic impacts likely to be generated both from the construction and the continued operation of commercial space at Wilderness Crossing. These impacts were calculated using RKG’s own analysis of construction values and revenues generated, along with the input-output model simulation using IMPLAN, an econometric model that projects the impact resulting from a direct investment or job creation event. In addition to economic impacts, RKG calculated the forecasted fiscal impacts the proposed development program would have on Orange County’s general fund, from both a tax revenue and expenditures perspective. RKG conducted interviews with various county department heads to understand how their operations would be impacted from the proposed developments.
B. SUMMARY OF FINDINGS 1. Market Analysis Summary The table below details the program recommendations for Wilderness Crossing for the first ten years of development (2020-2030). These recommendations came out of the market analysis RKG conducted evaluating the opportunity for new residential and commercial development at Wilderness Crossing.

Wilderness Crossing Market, Economic, and Fiscal Impact Analysis Orange County, Virginia January 2021
Page 1-2
Table 1-1
Development Program Recommendations, 2020-2030
Wilderness Crossing, Orange County, VA
Development
Rec. Pricing Target Market/Segmentation
Townhomes 185 Homes $280K First-time buyers, value-conscious
Small-Lot Single Family (50’) 74 Homes $310K First-time buyers, more purchasing power than townhome customer
Conventional Single Family (60’-100’)
407 Homes $365K-$435K Varied, move-up buyers; out-of-market relocators
Estate Lots (200’) 74 Homes $500K+ Move-up buyers desiring large home on large lot
Rental Apartments 260 Units $1.30 PSF Professionals not read to buy a home; down-sizing lifestyle renters
Retail 125,000 SF ~$18 PSF Shops, restaurants, and services catering to those in local community
Seniors Housing 80 Beds Varies by Care Aging population in Orange County and surrounding areas requiring additional care services
Source: RKG Associates, Inc.
2. Economic Impact Analysis Summary RKG Associates conducted an economic impact analysis to measure the direct, indirect, and induced economic benefits development at Wilderness Crossing would have on Orange County from 2020-2030. These economic benefits where measured for two events: the impacts associated with construction of new development and the impacts associated with the ongoing operation of commercial development. Table 1-2 Wilderness Crossing Construction Phase Economic Impacts (2020-2030) Annual Economic Impacts (in 2019 dollars)
Employment
Direct Effect 2.482 Indirect Effect 513 Induced Effect 324
Total Effect 3,319 Labor Income
Direct Effect $121,392,247 Indirect Effect $20,225,976 Induced Effect $9,927,017
Total Effect $151,545,240 Value Added
Direct Effect $156,306,601 Indirect Effect $36,648,738 Induced Effect $24,967,617
Total Effect $217,922,955 Output
Direct Effect $290,816,034 Indirect Effect $66,746,816 Induced Effect $44,003,914
Total Effect $401,566,765 Source: RKG Associates, Inc. and IMPLAN V.3.1, 2016

Wilderness Crossing Market, Economic, and Fiscal Impact Analysis Orange County, Virginia January 2021
Page 1-3
Table 1-3
Wilderness Crossing Operations Phase Economic Impacts (2020-2030) Annual Economic Impacts (in 2019 dollars)
Employment
Direct Effect 2506
Indirect Effect 355
Induced Effect 142
Total Effect 3004
Labor Income
Direct Effect $63,651,201
Indirect Effect $13,640,810
Induced Effect $4,365,829
Total Effect $81,657,840
Value Added
Direct Effect $97,283,051
Indirect Effect $25,447,965
Induced Effect $10,957,867
Total Effect $133,688,883
Output
Direct Effect $182,363,127
Indirect Effect $53,247,768
Induced Effect $19,317,801
Total Effect $254,928,696
Source: RKG Associates, Inc. and IMPLAN V.3.1, 2016 3. Fiscal Impact Analysis Summary
a.) Municipal Revenue Projections
• Real Estate Tax Revenues - By the year 2030, roughly $9 million in real estate taxes will be collected from the new development, both residential and commercial. This represents roughly 55.3% of the $16.4 million in total revenues generated by the project during the 2020-2030 projection period. The largest single source will come from new ownership housing, which will account for $6.6 million (Figure 1-1).
• Personal Property Tax Revenues - For every $1 million in real property value, there is roughly $67,096 in personal property. Based on this
55.3%
10.0%
1.9%
6.8%
0.7%
8.5%
16.9%
Municipal Tax RevenuesWilderness Crossing
(2020-2030)
Total: $16.4 million
Real Estate
Fire & EMT
Recordation
Local Opton Sales
Construction Sales
Meals
Personal Property
Figure 1-1
Source: RKG Associates, Inc., 2020

Wilderness Crossing Market, Economic, and Fiscal Impact Analysis Orange County, Virginia January 2021
Page 1-4
dollar relationship, RKG projects that $2.7 million in personal property taxes will be collected from residential and commercial properties at the Wilderness Crossing development, or roughly 17% of total revenues over 10 years.
• Local Optional Sales Tax and Meal Tax Revenues - Roughly 125,000 SF of new commercial space is planned by 2030 and the cumulative retail sales is estimated at $163.4 million. A 1% local option sales tax will be levied on retail sales and 4% will be levied on drinking and dining sales. In total, RKG projects local sales and meals tax revenues of approximately $2.5 million during the first 10 years or roughly 15.3% of total revenues.
• Countywide Fire & EMT District Taxes - Based on the projected assessed value of real estate at Wilderness Crossing, the new fire and EMT tax would generate $1.6 million in tax revenues by 2030.
• Real Estate Recordation Taxes - Based on the sale of over $337 million in real property value, the recordation tax would generate over $310,000 by 2030, or 1.9% of all revenues.
b.) Municipal Expenditure Projections
• Fire & EMT Services - According to the County Administrator, Chairman of the Board of Supervisors and the Fire Chief, the County will eventually have to invest in a new fire substation in this part of the County. This will include a new substation equipped with a 75-foot ladder truck, a pumper engine, and a medic unit. RKG also estimated the cost of a new 5,800 SF station based on prevailing construction costs for such facilities (Table 1-4).
• RKG estimates that total fire department expenses could equal approximately $2.2 million by 2030, with half of that amount attributable to Wilderness Crossing and the remainder attributable to other growth in the area. Once the vehicles are paid off, the annual operating expenses drop to roughly $470,000/yr. It is worth noting that the County will collect $1.6 million from Wilderness Crossing from its new Fire & EMT tax over the next decade.
• Sheriff’s Department - Over the 10-year projection period, RKG estimates that $384,000 in public safety services from the Sheriff’s Department will be demanded. This amount is roughly 50.4% of the full police expenses during this period and the remaining amount is attributed to other developments in the area.
• Public Education - Based on the number of new housing units constructed at Wilderness Crossing by 2030 (1,000 units), it is estimated that as many as 352 new school-age students could be added to the County’s schools in all grades (Figure 4-2). This would result in a 7.4% increase over 10 years. By 2030, the cumulative education cost will equal roughly $5.4 million, with the peak occurring in 2030 at $1.4 million. Education expense account for 55.3% of all expenses over the first
Table 1-4
Estimated Fire Department Expenses
Route 3 Fire Substation
Vehicles & Equipment Costs Yrs. of Service
Vehicle &
Equipment
Ladder Truck (5 yr. Fiunancing Term) 20 1,000,000$
Engine Truck (5 Yr. Financings Term) 20 700,000$
Medic Unit (3 Yr. Financing Term) 7 305,600$
Staffing Needs 4 Total
Annual Salary - Entry level fire fighters [1] 46,548$ 186,192$
Initial Training 26,000$ 104,000$
Equipment 12,500$ 50,000$
Firefighter/Medic 1 63,553$
New Fire Substation (20 Yr. Financing Term) 20 2,685,625$
Total - Fire Department Operating & Financing Costs
Source: RKG Associates, Inc. and Orange County Adopted Budget Fiscal Year 2021

Wilderness Crossing Market, Economic, and Fiscal Impact Analysis Orange County, Virginia January 2021
Page 1-5
decade. Based on a student:teacher ratio of 20.1 students per teacher, Wilderness Crossing will generate demand for 17.5 new teachers.
• Other General Government Services - Based on RKG’s analysis, roughly $2.7 million in general government expenditures would be incurred during the 10-year study period, with $2.2 million driven by residential households.
c.) Net Fiscal Impacts
• Net Fiscal Impact Results - It should be noted that municipal expenditures contained in the analysis are portrayed as being directly related to new development that is planned over the next decade. Of course, this distorts the fact that thousands of existing households and business are currently located in the eastern part of the county and have an unmet need for these services and will benefit from them. With that being said, Wilderness Crossing still is projected to realize a net positive fiscal impact of approximately $6.6 million over the first 10 years (Table 1-5).

Wilderness Crossing Market, Economic, and Fiscal Impact Analysis Orange County, Virginia January 2021
Page 1-6
Net
Fis
cal
Imp
act
An
aly
sis
Wil
dern
ess C
rossin
g
(20
20
-20
30
)
Yea
r1
23
45
67
89
10
Rev
en
ues b
y T
yp
e2
02
02
02
12
02
22
02
32
02
42
02
52
02
62
02
72
02
82
02
92
03
0
Real Est
ate
Taxes
80
,56
6$
8
0,5
66
$
8
0,5
66
$
2
25
,55
4$
3
70
,54
2$
60
3,4
95
$
89
8,0
16
$
1,1
84
,67
2$
1
,53
0,1
57
$
1,8
60
,46
4$
2
,12
8,0
10
$
9,0
42
,60
7$
County
wid
e F
ire &
EM
T D
istr
ict Taxes
14
,52
8$
1
4,5
28
$
1
4,5
28
$
4
0,6
74
$
6
6,8
19
$
1
08
,82
7$
16
1,9
37
$
21
3,6
29
$
27
5,9
30
$
33
5,4
93
$
38
3,7
40
$
1,6
30
,63
4$
Real Est
ate
Reco
rda
tion T
axes
-$
-
$
-
$
1
9,8
59
$
1
9,8
59
$
1
9,8
59
$
4
3,2
57
$
5
5,5
09
$
4
5,2
20
$
5
2,8
48
$
5
4,1
13
$
3
10
,52
5$
Loca
l O
ptions
Sale
s Taxes
-$
-
$
-
$
-
$
-
$
-
$
7
9,0
13
$
1
58
,02
5$
23
7,0
38
$
31
6,0
50
$
31
6,0
50
$
1,1
06
,17
5$
Const
ruct
ion M
ate
ria
ls -
Loca
l Sale
s and U
se T
axes
(1%
)-
$
-
$
-
$
8
,03
3$
8,0
33
$
8
,03
3$
1
6,7
45
$
2
0,7
72
$
1
5,6
45
$
1
9,3
62
$
1
8,2
48
$
1
14
,87
2$
Loca
l M
eals
Taxes
-$
-
$
-
$
-
$
-
$
-
$
9
9,0
00
$
1
98
,00
0$
29
7,0
00
$
39
6,0
00
$
39
6,0
00
$
1,3
86
,00
0$
Pers
onal Pro
pert
y T
axes
-$
-
$
-
$
6
0,2
01
$
1
20
,40
2$
18
0,6
03
$
26
3,4
89
$
37
1,7
75
$
48
0,0
61
$
59
2,2
11
$
70
3,3
52
$
2,7
72
,09
5$
Tota
l -
Annual Tax R
evenues
95
,09
4$
9
5,0
94
$
9
5,0
94
$
3
54
,32
1$
5
85
,65
5$
92
0,8
18
$
1,5
61
,45
7$
2
,20
2,3
82
$
2,8
81
,05
1$
3
,57
2,4
29
$
3,9
99
,51
3$
1
6,3
62
,90
8$
Ex
pen
dit
ure
s b
y T
yp
e
E
duca
tion
-$
-
$
-
$
9
3,2
86
$
1
86
,57
2$
27
9,8
58
$
51
3,7
91
$
78
3,6
03
$
94
1,4
72
$
1,1
88
,32
1$
1
,43
5,1
71
$
5,4
22
,07
5$
F
ire &
EM
T-
$
-
$
-
$
-
$
-
$
-
$
-
$
-
$
7
8,3
83
$
5
43
,87
8$
46
6,2
57
$
1,0
88
,51
9$
C
ounty
Sheriff
-$
-
$
-
$
-
$
-
$
-
$
-
$
-
$
1
81
,45
2$
10
1,5
42
$
10
1,5
42
$
38
4,5
36
$
P
lannin
g D
epa
rtm
ent
-$
1
2,5
00
$
1
2,5
00
$
2
5,0
00
$
2
5,0
00
$
2
5,0
00
$
1
2,5
00
$
1
2,5
00
$
1
2,5
00
$
1
2,5
00
$
1
2,5
00
$
1
62
,50
0$
Oth
er
Genera
l G
overn
ment Expenditure
s
R
esidentia
l-
$
-
$
-
$
4
1,4
56
$
8
2,9
12
$
1
24
,36
8$
20
3,5
66
$
30
2,9
92
$
37
7,4
32
$
47
0,6
24
$
56
3,8
15
$
2,1
67
,16
5$
C
om
merc
ial
-$
-
$
-
$
-
$
-
$
-
$
3
6,0
84
$
9
1,6
42
$
1
47
,19
9$
15
5,9
56
$
15
5,9
56
$
58
6,8
37
$
Tota
l -
Annual Expenditure
s-
$
1
2,5
00
$
1
2,5
00
$
1
59
,74
2$
2
94
,48
4$
42
9,2
26
$
76
5,9
41
$
1,1
90
,73
7$
1
,73
8,4
39
$
2,4
72
,82
2$
2
,73
5,2
42
$
9,8
11
,63
2$
Net
Fis
cal
Imp
act
(G
ap
/Su
rplu
s)
95
,09
4$
82
,59
4$
82
,59
4$
19
4,5
79
$
29
1,1
71
$
49
1,5
92
$
79
5,5
16
$
1,0
11
,64
5$
1
,14
2,6
12
$
1,0
99
,60
7$
1
,26
4,2
72
$
6,5
51
,27
5$
Sourc
e: R
KG
Ass
oci
ate
s, Inc.
, 20
20
Tota
l Tax
Revenues
(20
20
-
20
30
)
Tab
le 1
-5

Wilderness Crossing Market, Economic, and Fiscal Impact Analysis Orange County, Virginia January 2021
Page 2-1
2 REAL ESTATE MARKET ANALYSIS
A. SITE ANALYSIS The site of the proposed Wilderness Crossing development is located at the eastern edge of Orange County, roughly half a mile from the Orange County/Spotsylvania County border. The site is bordered to the south by Virginia State Road 3 and to the north by the Rapidan River. The site is bound to the west by parcels owned by the Dean Family, another established landowner in the county. The site is located at the intersection of State Route 20 and State Route 3, two well-traveled throughfares running through Central Virginia, and a key artery to travel from northern and western counties into Spotsylvania County and Fredericksburg. Together, the stretch of State Route 20 and State Route 3 support over 26,000 vehicles a day, making the site very visible and is supportive of new development (Map 2-1). Map 2-1: Traffic Counts by Wilderness Crossing
Source: Virginia Department of Transportation; RKG Associates, Inc.
Wilderness Crossing

Wilderness Crossing Market, Economic, and Fiscal Impact Analysis Orange County, Virginia January 2021
Page 2-2
B. DEMOGRAPHIC ANALYSIS 1. Population Trends According to American Community Survey estimates for 2018, the population of Orange County, VA was 32,700. From 2010-2018, Orange County’s population grew 8.8%, slightly above the statewide rate of 7.4%, but was partially driven by the overall small size of Orange County, where relatively small incremental changes in population growth have a large impact. Compared to the state (14.6%), Orange County has a higher share (19.5%) of people aged 65 and older. Additionally, growth in this age cohort fueled Orange County’s population growth between 2010 to 2018, accounting for 45% of total population growth. Another point of contrast with state-wide trends is that Orange County has a smaller share of the population aged 20-34 (15.9% compared to 20.8%). These two demographic trends make the population of Orange County much older than the state. 2. Household Trends From 2010 to 2018, the household base in Orange County grew 6.2% from 12,669 to 13,453 households, roughly in line with the state-wide household growth rate of 6.1% over the same period. However, compared to the state, Orange County has a higher share of two-person and larger households. This trend, coupled with the regions faster-than-state-wide-average population growth, indicates that much of the recent household growth in the region likely emanates from family households. Orange County does have a higher share of family households (70.6% compared to 66%) than the state. Further, Orange County also has a higher share of households with children (32.6% vs. 30.4%) than the state as a whole. These demographic trends would indicate households likely to demand or require larger housing types (e.g., single family homes instead of small rental apartments) compared to the housing likely demanded from all households in the state. 3. Housing Tenure Rates Given the demographic composition of the county detailed above, it is not surprising that Orange County’s housing is predominantly owner-occupied and owned at rates that outpace the state and national averages. According to the American Community Survey, in 2018, 77.7% of all occupied-housing units were owned, compared with 65.9% in the state, and 64.8% nationally. However, between 2010 and 2018, the overall homeownership rate in the County decreased slightly from 78.4% to the 77.7% mentioned previously. This was driven by the growth in renter households as the total number of renter households grew 10%, faster than the growth rate of owner households. Further, during this period, the average household size of renter households increased significantly, growing from 2.46 persons per household to 2.86 which is also significantly higher than the state-wide renter household average of 2.48. This would infer than the growth in renter households was likely driven by an increasing number of family households renting.
D. ECONOMIC ANALYSIS
1. Income and Wealth
Historically, Orange County has lagged the state-wide median income. However, this gap has started to narrow. In 2010, Orange County had a median household income of $54,900 compared to Virginia’s median of $61,400, a difference of 11.1%. In 2018, that gap has narrowed, with Orange County median income of $68,500 and Virginia median income of $71,600, a difference of only 4.5%. The narrowing of the income gap between Orange County and the state was primarily driven by the growth in the share of households earning over $200,000, which grew 72% in the County compared with 60.3% statewide.

Wilderness Crossing Market, Economic, and Fiscal Impact Analysis Orange County, Virginia January 2021
Page 2-3
While Orange County lags the state in terms of median income, Orange County has a higher median net worth, $179,500 compared to $127,500. This is a difference of nearly 30% and is a significantly larger gap than the income gap. This gap is driven by the significantly smaller share of households with net worth under $35,000, with only 27% of households in Orange County with less compared with 38% of households statewide. There is also a gap amongst the higher net-worth households also contributing to the gap. In Orange County, over a third of households have a net-worth of over $250,000 compared to around a quarter of households in the state. The income and net worth dynamics present in Orange County, coupled with the demographic and economic trends above, indicate that many of the households in the region are likely retired or semi-retired with lower incomes than at other points in the career but with high net worth fueled by owning a home and other investments often correlated with age. 2. Employment According to data from EMSI, from 2014 to 2019, employment in Orange County grew 9.1%, faster than the state growth rate of 7.1%. The current employment base in Orange County is predominantly jobs in Government, Manufacturing, Retail Trade, Agriculture, and Accommodation/Food Service which together comprise 60% of all jobs. Compared to the state, Orange County has high concentrations of employment in Agriculture, Manufacturing, and Real Estate/Leasing, with a particularly high concentration of Agriculture employment. Compared to the nation, Orange County has 16 times the number of Agriculture-related jobs, making it one of the more important employment sectors in the region, even though it accounts for only 8.6% of total employment. From 2020 to 2030, Employment in Orange County is anticipated to grow 10.7%, continuing to outpace the state-wide projected growth rate of 7.5%. Much of the anticipated growth is projected to emanate from Manufacturing, Health Care, Government, and Agriculture with growth rates of all five sectors significantly outpacing the growth rates in the state. These sectors account for nearly two-thirds of all employment growth in Orange County and will continue to be important employment sectors for the region over the next ten years. However, compared to its population, Orange County has a small job base. Currently, there were 3.1 people for every job in Orange County, over a person-per-job more than the statewide average of 1.9 people per job. 3. Commuting
According to data from the US Census Bureau’s Longitudinal Employer-Household Dynamics survey, only 14% of workers earning more than $40,000 annually and living in Orange County also work in the County. Other major destinations included Fairfax County (8%), Albemarle County (7.8%), Culpeper County (7.3%), and Spotsylvania County (6.5%). For context, the same “live-work” analysis was run for Loudoun County which found that 30% of workers earning more than $40,000 annually who live in Loudoun County also work there. While it is not expected that Orange County would be able to capture as large of a share of employment from its residents as Loudoun, the large gap between these two geographies coupled with the high person-per-job ratio indicates that Orange County is not a significant employment center and that residents live and are moving to the area for reasons other than to be close to work.

Wilderness Crossing Market, Economic, and Fiscal Impact Analysis Orange County, Virginia January 2021
Page 2-4
E. RESIDENTIAL MARKET ANALYSIS 1. For-Sale Housing Trends According to data from the Orange County Property Assessor, the current housing stock in the county is predominately single-family detached homes, which account for approximately 92% of the total housing stock. Of the remaining 8% of the housing stock, 3% are townhomes and 5% are other types of housing, mostly mobile homes. However, of homes constructed since 2010, approximately 10% are townhomes, indicating that there have been shifting product preferences to include denser, and often cheaper, housing types. Prior to the Great Recession in the late 2000s, Orange County was averaging approximately 450 home sales per year, of which approximately 35% (158 sales) were of newly constructed homes. During the recovery that spanned from 2012 through 2019, the total number of annual home sales in Orange County grew steadily year-over-year, reaching approximately 1,250 homes in 2019, over 2.5 times the average number of home sales annually during the pre-Recession period (Figure 2-1). This rapid increase corresponds with households “discovering” Orange County as a residential destination for both households looking for affordability or a more relaxed lifestyle, as local interviews indicated. While total home sales surpassed pre-recession levels only a couple years into the recovery, the sale of newly constructed homes did not approach pre-Recession levels until 2017 when regional and national production home builders moved into the market. As these builders establish and expand their presence in the County, the number and share of newly constructed home are expected to increase into the future. Figure 2-1: Residential Sales in Orange County
Source: Orange County Property Assessment Records, 2020
2. For-Sale Competitive Analysis To understand the current for-sale housing landscape in the region and to determine the positioning of for-sale units for Wilderness Crossing, RKG identified and surveyed competitive developments currently selling homes in the local market. The competitive set includes communities currently selling in Locust Grove or are proximate to Wilderness Crossing, as well as communities located to the east of Wilderness Crossing in Spotsylvania County. Below are descriptions of the competitive communities:
• Wilderness Shores and Lake of the Woods are the two main communities currently selling homes in Orange County located near Wilderness Crossing. These two communities are the least expensive of the competitive set (Map 2-2).

Wilderness Crossing Market, Economic, and Fiscal Impact Analysis Orange County, Virginia January 2021
Page 2-5
Map 2
-2: M
ap o
f C
om
petitive P
ropert
ies
Sour
ce: Red
fin,
Ora
nge C
oun
ty P
ropert
y A
ssess
ors
Da
ta, Spots
ylv
ani
a C
oun
ty P
rop
ert
y A
ssess
ors
Da
ta

Wilderness Crossing Market, Economic, and Fiscal Impact Analysis Orange County, Virginia January 2021
Page 2-6
• Regency at Chancellorsville is a recently completed Active Adult (55+) residential community. The community offers single-story homes and robust amenities to appeal to owners.
• The three currently selling communities closest to Wilderness Crossing in Spotsylvania County are Mineral Springs Plantation, Estate at Chancellorsville, and Thornburn Estates which offer large estate homes on 2+ acre lots. These communities represent the high-end of the residential market in the region.
• Pennington Estates is a small community of more moderately sized homes, but on larger lots which helps to drive its high per-square-foot pricing and help offset the community’s secondary location within greater Spotsylvania County.
• Fredericksburg Park is a Ryan Home community located towards the heart of Fredericksburg. The community offers a more conventional product type in terms of lot and home sizes compared to the other for-sale communities in western Spotsylvania County.
• New Post is the most value-oriented of the communities in Spotsylvania. While the community offers a decent amenity package, the community is in a more pioneering location.
3. For-Sale Pricing Recommendations
Wilderness Crossing can be positioned above the currently selling communities in Orange County but will need to be priced at a discount compared to the communities in better locations in Spotsylvania. Today in Orange County, Lake of the Woods offers a robust amenity package, including a private lake, but much of the construction is dated and would not compete well against newly constructed product. Additionally, Wilderness Shores is currently a value-oriented option offering townhomes and single- family homes from national builders at relative discounts primarily targeting first-time buyers. A well-executed new home community from a similar regional or national builder should be able to achieve higher pricing by including a variety of products targeting customer segments beyond just first-time buyers.
Of the communities located in prime locations in Spotsylvania County, Fredericksburg Park is the only one offering conventional product and is priced at a relative discount compared to the other communities. While this community offers product like what may be offered at Wilderness Crossing, its superior location gives it a slight pricing advantage. Base prices at Wilderness Crossing should start around $280,000 for townhomes and go up to $500,000 for estate homes. It is important to note that these recommended prices do not include any upgrades or premiums that would contribute to higher sale prices (Figure 2-2).

Wilderness Crossing Market, Economic, and Fiscal Impact Analysis Orange County, Virginia January 2021
Page 2-7
Figure 2-2: Price ($) to Size (SF) Relationship of Competitive Communities and Proposed Pricing
Source: NewHomeSource, Redfin, Orange County Property Assessors Data, Spotsylvania County Property Assessors Data, RKG Associates, Inc.
4. Future Competitive Set and Annual Absorption Projections The future competitive landscape in Orange County was evaluated to understand the share and number of annual home sales that could be captured by Wilderness Crossing. Current development and ownership patterns for the land around Wilderness Shores was evaluated to estimate the number of additional new lots that could be available for development in this community in the near-term. Local market interviews helped to identify communities that had started construction or are going through the development approval process that could be competitive with Wilderness Crossing in the near and medium terms. Lastly, based on local interviews and analysis of current land holdings, large tracts of land surrounding nearby developments were identified as potential long-term competitors. While none of these sites are currently active, they could easily be sold off to developers or home builders and therefore could become competitive in the future. Once all future competitors in the near, medium, and long-term were identified, RKG made assumptions regarding product types and densities to forecast the potential number of homes associated with each of these competitive subdivisions. RKG also made inferences around the timing of these developments and the number of home sales each of the pipeline developments could achieve per year. These values were forecasted based on information obtained from news sources and local interviews regarding product type being offered and historical sales data from property assessment records. Based on these values, the forecasted number of sales Wilderness Crossing could achieve each year relative to the competition was forecasted to calculate Wilderness Crossing’s annual capture rate of total sales (Map 2-3/Table 2-1.

Wilderness Crossing Market, Economic, and Fiscal Impact Analysis Orange County, Virginia January 2021
Page 2-8
Map 2-3: Map of Future Competitive Developments
Source: Local Market Interviews, The Daily Progress, ArcGIS
Based on the capture rates calculated in the analysis detailed above and the total demand for new for- sale housing in Orange County (detailed in the next section), Wilderness Crossing should be able to sell approximately 96 home lots per year over the first ten years of development. Based on the likely product types being offered by the competition, RKG recommended a lot segmentation strategy that prioritizes lots between 50’ and 80’ feet which have historically not been served by new construction at scale in Orange County. However, the strategy also includes a sizable number of townhome and estate lots to be able to offer a diversity of product to appeal to all buyers within Orange County (Table 2-2). Roughly half of the lots are projected to be townhome lots and more conventional quarter-acre lots.
Table 2-1: Projected Annual Absorption – Competitive Subdivisions (2020-2030)
Property Name Total 2020 2021 2022 2023 2024 2025 2026 2027 2028 2029 2030
Wilderness Shores 482 80 80 60 60 60 60 60 22
Ryan Homes Age-Restricted 282 60 60 60 60 42
Signature Station 220 20 20 20 20 30 30 40 40
Dean Properties 0
Brumbelow Property 0
Azimipour Properties by Walmart 0
Wilderness Crossing 740 65 65 65 85 110 110 120 120
1724 0 80 140 205 205 205 207 200 162 160 160
Wilderness Crossing Capture Rate 0.0% 0.0% 0.0% 31.7% 31.7% 31.7% 41.1% 55.0% 67.9% 75.0% 75.0%
Source: Local Market Interviews, The Daily Progress, ArcGIS, RKG Associates, Inc.
Table 2-2: Lot Sales Per Year and Lot Size Wilderness Crossing (2020-2030)
Source: RKG Associates, Inc.
Owner Demand (Annual Units) 278
2+ Acre Homes 20%
Demand for Conventional Lot Homes 223
Wilderness Crossing Capture % (2020-30) 43%
Sales per year 96
RKG
Housing Type and Annual Absorption 100% 96
Townhomes (under 5,750SF) 25.0% 24
50 Foot Lots (5.75K-7.5K) 10.0% 10
60 Foot Lots (7.5K-10K SF) 15.0% 14
80 Foot Lots (10K-20K SF) 25.0% 24
100 Foot Lots (20K-40K SF) 15.0% 14
200 Foot Lots (40K+ SF) 10.0% 10

Wilderness Crossing Market, Economic, and Fiscal Impact Analysis Orange County, Virginia January 2021
Page 2-9
5. Future Housing Demand RKG forecasted the number of new for-sale and rental apartment units Orange County would be able to support from population growth, as forecasted by the Weldon Cooper Center, and induced population growth attracted to Orange County above baseline forecasts due to the unprecedented level of future residential development slated for the region. This forecast for new housing accounts for changes in household composition and shifts in owning/renting preferences. Demand for new for-sale and rental housing emanates from three sources of demand:
• New Renter or Owner Household growth.
• Existing Owners or Renters in turnover, and
• Tenure change (Owners becoming Renters/Renters Becoming Owners). Once total demand for for-sale and rental housing from these three groups was forecasted, and product preferences were accounted for to understand what share of total demand for owner-occupied and renter housing would be for new for-sale housing and new rental housing. This analysis forecasted that there is demand in Orange County for approximately 2,800 new for-sale homes and approximately 260 new rental apartment units from 2020-2030 (Figure 2-4).
6. Rental Apartment Supply Trends
According to data from American Community Survey, in 2018 there were approximately 3,000 renter occupied units in Orange County. Further analysis using Public Use Microdata (PUMS) from the Census Bureau, indicates that of these renter-occupied units, approximately 52% of them were single family detached homes, 21% were townhomes, and only 23.1% were multifamily apartments indicating that the rental housing market in Orange County is overwhelmingly satisfied by a shadow rental market of homes that are traditionally owner-occupied. The ACS PUMS files are a set of records from surveyed individuals, with disclosure protection enabled so that individuals or housing units cannot be identified. The Census Bureau produces American Community Survey (ACS) 1-year and 5-year PUMS files. Of those households renting multi-family units in Orange County, approximately 59% of them have household incomes of less than $35,000 and an additional 18% have household incomes between $35,000 and $50,000. This suggests that the rental properties that exist in the county today caters to
Figure 2-4: Forecasted Housing Demand in Orange County (2020-2030)
Source: Cooper Center for Public Service, American Community Survey, US Census Public Use Microdata

Wilderness Crossing Market, Economic, and Fiscal Impact Analysis Orange County, Virginia January 2021
Page 2-10
lower income households as a value housing option and an upmarket rental apartment market does not truly exist in the county today. 7. Rental Apartment Competitive Analysis Like the for-sale housing analysis, a selection of market rate (i.e., not wholly income restricted) rental apartment communities in Orange County and Spotsylvania were surveyed to understand the current rental apartment market in the region. Most new rental apartment communities are in and around the core of Fredericksburg, near I-95 (Map 2-4). The following are descriptions of the communities in the competitive set:
• The lone market-rate rental apartment building in Orange County is Round Hill Meadow, located in the Town of Orange. While the community has units that are not income-restricted, rents are significantly lower than the other communities in the competitive set due to both location and execution.
• Brittnay Commons is an older rental apartment community that, while located outside the core of downtown, is still well-located. The clubhouse was recently renovated but the units are still from original construction.
• The other three communities in the competitive set, Apartments at Cobblestone Square, The Haven, and Silver Collection at Celebrate, are three relatively new rental buildings with superior locations close to I-95 and the commercial cores along Route 3 and in Downtown Fredericksburg.
8. Rental Apartment Pricing and Development Recommendations Rental apartments at Wilderness Crossing will need to be positioned below the rental apartment communities located in Spotsylvania County due to their locational advantages. However, a well-executed and professionally managed apartment community at Wilderness Crossing should be able to achieve rents just below that of Brittany Commons. While Brittnay Commons will still be able to achieve higher rents due to its superior location, the community is approaching 25 years old and is not as competitive with new construction. As such, there is an opportunity at the site to achieve rents approaching Brittnay Commons. Across the competitive set, approximately 36% of units are one-bedroom units, 49% are two-bedroom units. And 12% are three-bedroom units. Given that the current rental base in Orange County is primarily single-family homes and townhomes and that demographic trends indicate growth in the family rental market in the region, a unit mix more heavily weighted towards three-bedroom units is appropriate (Table 2-3).
Table 2-3: RKG Rental Apartment Recommendations
No. of Bdrm. Unit Mix Avg. Size Avg. Rent Avg. $/SF
1 30% 800 $1,200 $1.50
2 45% 1,200 $1,525 $1.27
3 25% 1,350 $1,600 $1.19
Total 100% 1,120 $1,450 $1.29
Source: RKG Associates, Inc., 2020

Wilderness Crossing Market, Economic, and Fiscal Impact Analysis Orange County, Virginia January 2021
Page 2-11
Map 2
-4: M
ap o
f R
enta
l A
pa
rtm
ent C
om
petitive S
et
Sour
ce: A
part
ment
s.co
m, REI
S, Le
asing
Agent
Int
erv
iew
s

Wilderness Crossing Market, Economic, and Fiscal Impact Analysis Orange County, Virginia January 2021
Page 2-12
F. RETAIL MARKET ANALYSIS 1. Retail Current Trends Retail markets are often analyzed by looking at drive-time radii, particularly for the car-centric retail landscape present in Central Virginia. As such, RKG looked at the supply/demand balance of household retail spending in the 10-, 20-, and 30-minute drive-time radii from Wilderness Crossing to understand the total retail spending potential from households in each of these geographies by type of retail. Retail supply/demand balance is measured through retail spending leakage (local retail spending demand not captured by local businesses) and surplus (excess retail spending demand local businesses capture beyond what local households demand) (Map 2-5). The areas that are within a 10- and 20-minute drive of the site have significant retail leakage, meaning that households are driving outside of these market geographies to accommodate their shopping needs, thus there could be an opportunity to provide retail space to capture some of this spending. However, the 30-minute drive time radius has a significant retail surplus, indicating there is an ample supply of retail to satisfy retail demand from households in this geography (Map 2-6). RKG identified and surveyed shopping centers in the region larger than 100,000 square feet to understand where households in the region were going to shop. As illustrated in the map below, there are eight shopping centers containing over 5.4 million square feet of retail space located just outside of a 20-minute drive from Wilderness Crossing in Spotsylvania and Culpeper counties. As such, demand for retail space at the site is likely to emanate from households living within a 20-minute drive time from the site and should be local-serving in nature.

Wilderness Crossing Market, Economic, and Fiscal Impact Analysis Orange County, Virginia January 2021
Page 2-13
Map 2
-5: R
eta
il S
urp
lus/
Leakage A
naly
sis
by D
rive-T
ime R
adii
Radiu
s
Household
s
(Surp
lus)/
Leakage S
pendin
g
(Surp
lus)/
Leakage P
er
HH
10
-Min
ute
Dri
ve T
ime
6,4
75
$2
22
,50
0,0
00
$
34
,36
3
20
-Min
ute
Dri
ve T
ime
25
,54
8
$3
30
,40
0,0
00
$
12
,93
3
30
-Min
ute
Dri
ve T
ime
75
,54
2
($1
,44
6,5
00
,00
0)
($1
9,1
48
)
Sour
ce: Es
ri B
usin
ess
Ana
lyst
, 202
0

Wilderness Crossing Market, Economic, and Fiscal Impact Analysis Orange County, Virginia January 2021
Page 2-14
Map 2
-6: Sele
cted S
hoppin
g C
ente
rs L
arg
er
than 1
00,0
00
SF
Sour
ce: REI
S, Lo
opne
t, G
oogle
, C
old
well
Bake
r C
om
merc
ial,
Loca
l M
ark
et In
terv
iew
s, 2
020

Wilderness Crossing Market, Economic, and Fiscal Impact Analysis Orange County, Virginia January 2021
Page 2-15
2. Retail Recommendations Demand for retail space at Wilderness Crossing is likely to stem from four main sources:
• Recapture of retail spending leakage from households within a 10-minute drive of Wilderness Crossing
• Recapture of retail spending leakage from households within a 20-minute drive of Wilderness Crossing
• Retail demand from households living at Wilderness Crossing.
• Retail demand from households living in other competitive developments to Wilderness Crossing in Orange County
RKG calculated the amount of retail spending that could be recaptured from households living within a 10- and 20- mile radius of Wilderness Crossing by estimating the share of retail spending leakage by category that could reasonably be recaptured. This analysis forecasted that approximately $15.5 million in retail spending annually can be recaptured by retail offerings at Wilderness Crossing. This $15.5 million equates to approximately 43,000 square feet of retail space (Figure 2-6).

Wilderness Crossing Market, Economic, and Fiscal Impact Analysis Orange County, Virginia January 2021
Page 2-16
A similar analysis was conducted to understand the amount of retail spending from households living at Wilderness Crossing and the other new, competitive developments that could be captured at Wilderness Crossing. This analysis forecasted that Wilderness Crossing could capture $28.7 million of retail spending from households living at Wilderness Crossing or other developments by 2030. This $28.7 million in retail spending could support approximately 82,000 square feet of retail space. In total, between these sources, the site could support approximately 125,000 square feet of retail space by 2030. Of these 125,000 square feet, 90,000 square feet is for general retail stores, 13,000 square feet is for services (e.g., nail salons, fitness studios, dry cleaners, etc.), and 22,000 square feet is for restaurants (both full service and limited service). However, it is important to note that not all capturable building space is adequate to attract a new business but may create opportunities for existing establishments to expand their product lines.
G. SENIOR HOUSING MARKET ANALYSIS 1. Current Market Trends For the purposes of this analysis, Senior Housing is an umbrella term that applies to the following three product types:
• Assisted Living (AL) – Facilities or parts of facilities offering housing and supportive care to residents that require assistance with activities of daily life such as eating, bathing, dressing, etc.
• Independent Living (IL) – Facilities or parts of facilities that cater towards residents who do not require assistance with activities of daily life but can provide services such a meals, housekeeping, transportation, emergency medical care, and social programming for a fee. Often IL facilities are included in facilities that also provide AL to allow for continuing care.
• Memory Care (MC) – Facilities or part of assisted living facilities offering specialized services to residents with dementia and other related illnesses.
The National Investment Center for Senior housing & Care (NIC) tracks senior housing performance metrics for certain geographies in the Washington, DC market area, including Spotsylvania County, which RKG uses as a proxy to understand how the senior housing market in greater Central Virginia compares to other markets in the broader region. Compared to other geographies in Virginia, Spotsylvania County has one of the highest share of households over the age of 75, the key demographic group for senior housing. Additionally, the overall senior housing occupancy rate is the highest among all peer geographies tracked by NIC. An important metric to understanding senior housing markets is penetration rate – which is calculated by dividing the number of units by the number of households aged 75+. Penetration rates are a useful metric to understand: 1) how saturated the market is for senior housing, and 2) if Senior housing is an established product type in the region as a measure of consumer preferences. Spotsylvania’s penetration rate of 13.5% places it in the middle of the other Northern Virginia geographies, indicating that Senior housing is an established product type in the region, but the market is likely not oversaturated. All the market metrics indicate that Spotsylvania County has solid senior housing fundamentals. 2. Senior housing Trade Area and Competitive Environment According to research from Healthcare Transactions Group, the primary trade area for a Senior housing facility in a rural location is approximately 15 miles, with additional demand likely to emanate from outside of the primary trade area. As such, RKG identified and surveyed the 18 senior housing facilities located within a 15-mile radius of Wilderness Crossing to understand the total number of senior housing beds, and by level of care, currently present in the market today. This analysis found that there are

Wilderness Crossing Market, Economic, and Fiscal Impact Analysis Orange County, Virginia January 2021
Page 2-17
currently 1,523 senior housing beds in the market today, which is a penetration rate of 19.6% of households over the age of 75 within the trade area (Table 2-4/Map 2-7).
Table 2-4: Senior housing Comparisons by Selected Submarkets, 2Q2020 NICMAP
Map 2-7: Map of Senior housing Properties in Trade Area
Source: Care.org, A Place for Mom, REIS

Wilderness Crossing Market, Economic, and Fiscal Impact Analysis Orange County, Virginia January 2021
Page 2-18
3. Senior Housing Recommendations Based on the size and services offered by the facilities within the primary trade area, the minimum number of beds needed to support a new Senior housing facility is approximately 80 beds. As such, RKG ran three scenarios to test whether an 80-bed facility could be supported based on varying market penetration rates. The three scenarios tested were:
• If the Penetration Rate stays at 19.6%,
• The Penetration Rate falls in line with the Spotsylvania County rate of 13.5%, and
• The penetration rate falls in line with the DC Metro area average rate of 13.1% (Figure 2-7). All three scenarios were tested considering projected household growth rate among households aged 75+ between 2020-2030 in the primary trade area. The analysis also assumed 20% of demand would emanate from outside the primary trade area, in line with research findings, and that a facility at the site would face some competition and would capture only 25% of total demand. Under all three scenarios, an 80-bed facility would be supported at Wilderness Crossing. As such, the development and operation of a facility is recommended as a near term opportunity. Figure 2-7: Senior housing Demand Scenarios (2030)
Source: NICMAP, REIS, Cooper Center for Public Service, AEW Research, RKG Associates

Wilderness Crossing Market, Economic, and Fiscal Impact Analysis Orange County, Virginia January 2021
Page 3-1
3 ECONOMIC IMPACT ANALYSIS
A. INTRODUCTION To understand the full impacts associated with the proposed Wilderness Crossing development on Orange County, RKG Associates prepared an economic impact analysis to measure the impacts from construction through full operation of the retail uses at Wilderness Crossing over the first ten years of development. Economic impacts are a measure of employment, earnings, and output associated with commercial activities of employers, workers, and residents within a specific geography. Economic analysis examines impacts associated with the construction of improvements, as well as the operations of businesses, and the support of local businesses from residents in the subject area.
B. METHODOLOGY For this economic impact analysis, RKG obtained information from a variety of sources, including local and national research on construction costs and operational data. These direct numbers were then used to drive a series of simulations using the IMPLAN econometric model. IMPLAN measures the direct, indirect, and induced impacts associated with a specific economic event (e.g., new job creation, a change in wages paid, etc.) or industry investment (e.g., construction of a housing or commercial development). These impacts were measured in two events: the one-time impacts related to the construction of the new development at Wilderness Crossing, and 2) the on-going impacts generated by the operation of the development. The following section details the economic impacts associated with the proposed Wilderness Crossing development. The impacts include both construction as well as permanent operations at buildout. RKG developed its own building construction and real estate market value estimates and the information is the best available at this time. It should be noted that at the time of this analysis, there were no final plan drawings or buildout estimates. As such, RKG has prepared the following development scenario based on its market research. All gross annual business sales estimates were prepared by RKG Associates based on reasonable assumptions about the types of businesses that would locate at the development. The economic impacts were calculated using the IMPLAN V.3.1 model.
C. IMPLAN V 3.1 MODEL IMPLAN V 3.1 is a widely accepted and utilized econometric modeling software that was first developed in 1972 in connection with the Rural Development Act of 1972. At the heart of the model is an input-output dollar flow matrix. For a specified region, the input-output table accounts for all dollar flows between different sectors of the economy. Using this information, IMPLAN models the way a dollar injected into one sector is spent and re-spent in other sectors of the economy, generating waves of economic activity, or so-called “economic multiplier” effects. The model uses national industry data and county-level economic data to generate a series of multipliers, which in turn estimate the total economic implications of economic activity. At the heart of the model is a national input-output dollar flow table called the Social Accounting Matrix (SAM). Unlike other static input-output models, which just measure the purchasing relationships between industry and household sectors, SAM also measures the economic relationships between government, industry, and household sectors, allowing IMPLAN to model transfer

Wilderness Crossing Market, Economic, and Fiscal Impact Analysis Orange County, Virginia January 2021
Page 3-2
payments such as unemployment insurance to estimate the economic impacts. For this analysis, RKG Associates obtained the IMPLAN model data for the Orange County, Virginia economy for the most current data year of 2019. 1. Economic Multipliers and Levels of Impact IMPLAN combines this data to generate a series of type-SAM multipliers for the local economy. The multiplier measures the amount of total economic activity that results from an industry (or household) spending an additional dollar in the local economy. Based on these multipliers, IMPLAN generates a series of tables to show the economic event’s direct, indirect, and induced impacts to gross receipts, or output, within each of the model’s 500 industries. These outputs are described below:
• Direct Impacts - Direct impacts refer to the dollar value of economic activity available to circulate through the economy. In the case of the Wilderness Crossing analysis, the direct impacts are equal to the estimated construction costs and annual gross sales of businesses operating at the development in the future. It should be noted that the model measures impact captured within Orange County and not those that are captured in the rest of the region or the Commonwealth of Virginia. Undoubtedly, some economic impacts are captured by nearby communities due to industry purchasing relationships that extend beyond Orange County. Given that fact, most of economic impacts will be realized in the County and we have restricted the analysis to Orange County.
• Indirect Impacts - The indirect impacts refer to the “inter-industry impacts of the input-output analysis.” In the Wilderness Crossing example, indirect impacts result from spending by employees working at businesses located in the development such as retail tenants, service businesses and restaurants, etc., as well as business spending on goods and services to retail establishments, restaurants, personal service providers, and other firms. These businesses then use the payments they receive to buy equipment and supplies, rent space, pay their employees, etc. These expenditures have an impact on the economy.
• Induced Impacts - The induced impacts refer to the impacts of household spending by the employees generated by the direct and indirect impacts. In other words, induced impacts result from the household spending of employees of business establishments that the new employees patronize (direct) and their suppliers (indirect). The model excludes payments to federal and state taxes and savings based on the geography’s average local tax and savings rates. Thus, only the disposable incomes from local workers are included in the model.
D. CONSTRUCTION PHASE Construction-related economic impacts are driven by projected annual construction spending (both hard & soft costs) on a variety of different buildings. Typically, once construction is completed much of the economic impacts will end. As such, employment, wages, and output will ebb and flow depending on the amount spent in any given year. As stated previously, this analysis assumes a multi-year construction period through the first decade. However, the reader should note that RKG does not project the start of construction until 2023. Table 3-1 breaks out the total construction cost associated with the Wilderness Crossing development, which include building construction of: (1) 740 owner-occupied residential units, (2) 260 apartments, (3) 125,300 SF of retail, restaurants, and service establishment and (4) 30,000 SF in a senior assisted living facility. The single-family development is estimated to start in 2023 with the rental housing starting in 2025 (Figure 3-1). The total construction value is projected at nearly $291 million between 2023 and

Wilderness Crossing Market, Economic, and Fiscal Impact Analysis Orange County, Virginia January 2021
Page 3-3
2030. The largest share of construction spending ($231.5 million/79.6%) is associated with the construction of the single-family homes.
1. Construction Impacts
Table 3-2 shows the output of the IMPLAN model in four categories of impacts: (1) Employment, (2) Labor Income, (3) Value Added and (4) Output.
• Employment - Using the estimated annual value of construction (both hard and soft costs) to drive the IMPLAN model simulation, RKG Associates assumed an industry change (construction spending) in several different construction types to cover all building types anticipated for this project. Approximately $290.8 million in construction spending results in the creation of 2,482 direct jobs and 837 indirect and induced jobs. In total, RKG estimates that 3,319 construction
Table 3-1 Wilderness Crossing Development Program (2020-2030)
Source: RKG Associates, Inc.,2020
Development Type No. of Units No. Bldg SF % of Total Total Const. Value
Ownership Housing Construction Value 740 79.6% 231,534,900$
Rental Housing Construction Value 260 14.9% 43,261,733$
Commercial Construction Value 125,300 3.9% 11,277,000$
Assisted Living Facility 30,000 1.6% 4,742,400$
Total Construction Value 1000 155,300 100.0% 290,816,033$
0
100
200
300
400
500
600
700
800
2020 2021 2022 2023 2024 2025 2026 2027 2028 2029 2030
Cum
ula
tive N
o.
of
Unit
s
Residential Development PhasingCumulative Units Built by Year (2020-2030)
Apartment Units Townhome/Single Family Units
Figure 3-1
Source: RKG Associates, Inc., 2020

Wilderness Crossing Market, Economic, and Fiscal Impact Analysis Orange County, Virginia January 2021
Page 3-4
jobs will be created to develop Wilderness Crossing over the first seven years of construction. It should be noted that the Wilderness Crossing development is projected to develop 375 acres by 203, which is roughly 15% of the property’s total land area (2,542 acres). While hundreds of acres are not likely to be developed due to environmental or open space needs, this multi-phase project could take 30 to 40 years to fully build out.
• Labor Income – Labor income includes all forms of employment income, including employee compensation (wages and benefits) and proprietor income. The direct labor income resulting from the construction is projected at $121.4 million (in 2019 dollars). For all jobs created from these activities (direct, indirect, and induced), total labor income is projected at $151.5 million. While labor income includes more than just worker compensation, the average labor income per direct job equates to nearly $45,660 per year. The actual direct construction jobs equate to nearly $49,000 per year.
• Value Added - The difference between an industry’s or an establishment’s total output and the cost of its intermediate inputs is called value added. It equals gross output (sales or receipts and other operating income, plus inventory change) minus intermediate inputs (consumption of goods and services purchased from other industries or imported). Value added consists of compensation of employees, taxes on production and imports less subsidies. For the Wilderness Crossing project, the value added for construction activities is projected at roughly $217.9 million, with $156.3 million in direct value added.
• Output - Output represents the value of industry production. In IMPLAN these are annual production estimates for the year of the data set and are in producer prices. For manufacturers this would equate to sales plus or minus a change in inventory. For service sectors production equals sales and for retail and wholesale trade, output equals gross margin and not gross sales. The total economic output associated with this project would total $401.6 million, with $290.8 million in direct output.
Table 3-2
Wilderness Crossing
Construction Phase Economic Impacts (2020-2030)
Annual Economic Impacts (in 2019 dollars)
Impact Type Totals
Employment
Direct Effect 2,482
Indirect Effect 513
Induced Effect 324
Total Effect 3,319
Labor Income
Direct Effect $121,392,247
Indirect Effect $20,225,976
Induced Effect $9,927,017
Total Effect $151,545,240
Value Added
Direct Effect $156,306,601
Indirect Effect $36,648,738
Induced Effect $24,967,617
Total Effect $217,922,955
Output
Direct Effect $290,816,034
Indirect Effect $66,746,816
Induced Effect $44,003,914
Total Effect $401,566,765
Source: RKG Associates, Inc. and IMPLAN Model, 2020

Wilderness Crossing Market, Economic, and Fiscal Impact Analysis Orange County, Virginia January 2021
Page 3-5
E. PERMANENT OPERATIONAL PHASE
1. Permanent Operational Impacts Table 3-3 shows the gross annual business sales by business type. After construction is completed, building space will be leased to new or relocating businesses and the economic output they create through their gross sales are captured in these impacts. To drive the IMPLAN Model for permanent operational impacts, RKG projected gross annuals sales for future businesses locating at Wilderness Crossing. Gross annual sales for each business type were estimated based on the type of business and amount of occupied building square feet. The commercial space is not projected to be ready for occupancy until 2026 and the senior assisted living center is projected to be delivered in 2027 (Figure 3-2). The cumulative total sales at the end of 2030 are estimated at $163.5 million and the assisted living center is assumed to be a not-for-profit operation.
Table 3-3 Wilderness Crossing Development Program (2020-2030)
Source: RKG Associates, Inc.,2020
Business Type Building SF Sales Per/SF
Total Business Sales
(2020-2030)
Retail 90,300 350.00$ 110,617,500$
Services 13,000 400.00$ 18,200,000$
Restaurants 22,000 450.00$ 34,650,000$
Cumulative Annual Retail Sales 125,300 163,467,500$
-
20,000
40,000
60,000
80,000
100,000
120,000
140,000
2020 2021 2022 2023 2024 2025 2026 2027 2028 2029 2030
Cum
ula
tive B
uildin
g S
F
Commercial Development PhasingCumulative SQFT Built by Year (2020-2030)
Commercial Assisted Living Facility
Figure 3-2
Source: RKG Associates, Inc., 2020

Wilderness Crossing Market, Economic, and Fiscal Impact Analysis Orange County, Virginia January 2021
Page 3-6
Gross annual sales were broken out into three business types, retail, services, and restaurants totaling 125,300 SF by Year 2030. Annual business revenues equate to the gross sales for such things as retail goods, restaurant sales, and service sales.
• Employment – Total permanent employment associated with over $163.5 million in cumulative annual sales between 2026 and 2030 generates roughly 1,237 new jobs in the Orange County economy. Unlike construction jobs, which are typically temporary, the employment related to permanent operations are related to the ongoing success of the businesses at Wilderness Crossing. Direct employment impacts equal 1,032 jobs (Table 3-4).
• Labor Income – Approximately $33.6 million labor income is generated by the employment levels reported above, equating to labor income of $25,396/year for direct labor and $27,181 for all jobs. As projected, most of these jobs would be in neighborhood-serving retail, service restaurant business. The job totals in Table 3-4 reflect both full-time and part-time employment.
• Value Added – Total value added equates to over $55 million at buildout and stabilized occupancy.
• Output – Total economic output for the Wilderness Crossing employment center will approach nearly $105 million at buildout and full occupancy.
Table 3-4
Wilderness Crossing
Operational Phase Economic Impacts (2020-2030)
Annual Economic Impacts (in 2019 dollars)
Impact Type Totals
Employment
Direct Effect 1,032
Indirect Effect 146
Induced Effect 59
Total Effect 1,237
Labor Income
Direct Effect 26,209,318
Indirect Effect 5,616,804
Induced Effect 1,797,694
Total Effect $33,623,817
Value Added
Direct Effect 40,057,727
Indirect Effect 10,478,574
Induced Effect 4,512,063
Total Effect $55,048,363
Output
Direct Effect 75,090,699
Indirect Effect 21,925,551
Induced Effect 7,954,389
Total Effect $104,970,639
Source: RKG Associates, Inc. and IMPLAN, 2020

Wilderness Crossing Market, Economic, and Fiscal Impact Analysis Orange County, Virginia January 2021
Page 4-1
4 FISCAL IMPACT ANALYSIS
A. INTRODUCTION The following section details the results of a fiscal impact analysis relative to the proposed Wilderness Crossing development. In the course of the work program, RKG Associates interviewed various Orange County department heads and staff. The objective of the interviews was to develop an understanding of how specific departmental budget expenditure or capital project needs would be impacted by the introduction of new households and businesses at the subject property off Route 3 in Orange County. The Orange County Tax Assessor was also consulted regarding local assessment practices. In addition, RKG Associates reviewed the following public data sources to prepare this analysis.
• Orange County Comprehensive Annual Financial Report, FY Ended June 30, 2019,
• Orange County Adopted Budget, Fiscal Year 2021,
• Orange County Public Schools, Five Year Strategic Plan (2018-2023),
• Orange County FY2021-2025 Capital Improvements Plan,
• Orange County 2013 Comprehensive Plan, and
• Germanna Wilderness Area Plan (2015). B. FISCAL IMPACT ANALYSIS 1. Municipal Revenue Projections This section describes the assumptions used to derive municipal revenues associated with the proposed Wilderness Crossing development. RKG Associates measured major revenues streams with direct benefit to Orange County. While there are other sources of municipal revenues generated by this development, they are minor in nature and not consequential in measuring the revenue impact of this development on the County’s fiscal health. The revenues measured include: (1) real property taxes, (2) personal property taxes, (3) local option sales and use and meals taxes, (4) countywide fire & EMT district taxes, and (5) real estate recordation taxes.
a.) Real Estate Tax Revenues The first step of the fiscal impact analysis is to estimate real property taxes that will be generated from the proposed development at the end of 2030. According to the Orange County Tax Assessor’s Office, non-residential properties (for assessment purposes, rental apartments are also considered non-residential) are typically assessed using the income approach, which recognizes the relationship between the property’s value and the income it is expected to earn. Non-income producing residential properties are assessed based on fair market valuation. Project assumptions such as building square footages, unit counts, rents, price points, occupancy and operating expenses were derived from RKG Associates’ local market research. Based on RKG’s assumptions regarding vacancy rates, unit and per square foot rents, operating expense ratios and capitalization rates, the income approach produced market values very similar to the estimated construction costs estimated for the individual development components, with the addition of land value. For uniformity of the revenue projections, RKG has left all assessed value projections based

Wilderness Crossing Market, Economic, and Fiscal Impact Analysis Orange County, Virginia January 2021
Page 4-2
on initial construction cost estimates. All values are reported in 2019 dollars, like the IMPLAN model described in Chapter 3. The Orange County Budget Committee made the decision to recommend lowering the proposed property tax rate to the equalized rate for 2020. The 2020 adopted regular real estate tax rate ($0.61/$100 in assessed value) and the countywide Fire & EMS District Levy ($0.11/$100), when combined, total the previously advertised equalized rate of 72 cents. This resulted in no effective tax rate increase in 2020.1 Real property taxes for the proposed development were based on the projected assessed values, derived from the estimated construction value of each property type, plus the value of the underlying land. The King Family property is roughly 2,542 acres and the County has assessed the combined property at roughly $13.2 million in its current undeveloped state. That equates to an assessed value of roughly $5,196 per acre. As the project develops, the value of the underlying land will increase in value to reflect the new land uses being constructed. Table 4-1 summarizes the total assessed value per year by the major land use category starting in 2023 and ending in 2030. As described in Chapter 3, some uses are not projected to come on-line until later years. Based on RKG’s estimates, the total assessed value is projected at $348.8 million in 2030. The single-family component accounts for most of the development activity during the first decade and represents approximately 78.1% of the total assessed value in 2030 at $272.4 million. This assessed value is derived from roughly 760 new detached and attached housing units over the first 10 years. By the year 2030, roughly $9 million in real estate taxes will be collected from the new development, both residential and commercial. This represents roughly 55.3% of the $16.4 million in total revenues generated by the project during the 2020-2030 projection period (Figure 4-1/Table 4-2). The largest single source will come from new ownership housing, which will account for $6.6 million. b.) Personal Property Taxes Tangible personal property, as defined by state code, is all personal property not otherwise classified as intangible personal property, merchants’ capital, or as short-term rental property (Code of Virginia, §58.1-3500). In general, tangible personal property is a moveable item that is real, material, substantive, and not permanently affixed to any real property. Examples of tangible property include office furniture, computer hardware, specialized tools, machinery, equipment, and vehicles. Orange County taxes personal property differently for residential and commercial taxpayers. Residential personal property is taxed at a rate of $3.50/$100 in assessed value and commercial is taxed at $2.20/$100 in value.
1 Orange County Adopted Budget Fiscal Year 2021, page 9.
55.3%
10.0%
1.9%
6.8%
0.7%
8.5%
16.9%
Municipal Tax RevenuesWilderness Crossing
(2020-2030)
Total: $16.4 million
Real Estate
Fire & EMT
Recordation
Local Opton Sales
Construction Sales
Meals
Personal Property
Figure 4-1
Source: RKG Associates, Inc., 2020

Wilderness Crossing Market, Economic, and Fiscal Impact Analysis Orange County, Virginia January 2021
Page 4-3
Tab
le 4
-1
Tota
l Est
imat
ed A
nnua
l Ass
esse
d V
alue
Wild
erne
ss C
ross
ing
(202
0-20
40)
2020
2021
2022
2023
2024
2025
2026
2027
2028
2029
2030
Und
erly
ing
Land
Val
ue13
,207
,500
$
13,2
07,5
00$
13
,207
,500
$
13,0
49,5
36$
12
,891
,572
$
12,7
33,6
09$
12
,487
,297
$
12,1
75,7
56$
11
,894
,619
$
11,5
73,3
84$
11
,261
,490
$
Build
ing
and
Land
Ass
esse
d V
alue
O
wne
rshi
p H
ousin
g C
onst
ruct
ion
Val
ue-
$
-$
-
$
23,9
26,5
00$
47
,853
,000
$
71,7
79,5
00$
10
3,06
8,00
0$
143,
559,
000
$ 18
4,05
0,00
0$
228,
222,
000
$ 27
2,39
4,00
0$
Re
ntal
Hou
sing
Con
stru
ctio
n V
alue
-$
-
$
-$
-
$
-$
-
$
14,4
20,5
78$
28
,841
,155
$
28,8
41,1
55$
38
,454
,874
$
48,0
68,5
92$
C
omm
erci
al C
onst
ruct
ion
Val
ue-
$
-$
-
$
-$
-
$
-$
2,
819,
250
$
7,
159,
949
$
11
,500
,647
$
12,1
84,8
07$
12
,184
,807
$
A
ssist
ed L
ivin
g Fa
cilit
y-
$
-$
-
$
-$
-
$
-$
-
$
2,47
2,62
9$
4,94
5,25
9$
4,94
5,25
9$
4,94
5,25
9$
Tota
l Ann
ual A
sses
sed
Val
ue w
/Lan
d23
,926
,500
$
47,8
53,0
00$
71
,779
,500
$
120,
307,
828
$ 18
2,03
2,73
3$
229,
337,
061
$ 28
3,80
6,93
9$
337,
592,
658
$
Cum
. Ann
ual A
sses
sed
Val
ue w
/Lan
d13
,207
,500
$
13,2
07,5
00$
13
,207
,500
$
36,9
76,0
36$
60
,744
,572
$
84,5
13,1
09$
13
2,79
5,12
4$
194,
208,
490
$ 24
1,23
1,68
0$
295,
380,
324
$ 34
8,85
4,14
8$
Sour
ce:
RKG
Ass
ocia
tes,
Inc.
, 202
0
Tab
le 4
-2
Mu
nic
ipa
l R
even
ue
Pro
ject
ion
s
Wil
der
nes
s C
ross
ing
(20
20
-20
30
)
Yea
r1
23
45
67
89
10
Rev
enu
es b
y T
yp
e2
02
02
02
12
02
22
02
32
02
42
02
52
02
62
02
72
02
82
02
92
03
0
Real E
state
Taxe
s8
0,5
66
$
8
0,5
66
$
8
0,5
66
$
2
25
,55
4$
3
70
,54
2$
60
3,4
95
$
89
8,0
16
$
1,1
84
,67
2$
1
,53
0,1
57
$
1,8
60
,46
4$
2
,12
8,0
10
$
9,0
42
,60
7$
Cou
ntyw
ide
Fire
& E
MT
Distr
ict Ta
xes
14
,52
8$
1
4,5
28
$
1
4,5
28
$
4
0,6
74
$
6
6,8
19
$
1
08
,82
7$
16
1,9
37
$
21
3,6
29
$
27
5,9
30
$
33
5,4
93
$
38
3,7
40
$
1,6
30
,63
4$
Real E
state
Rec
orda
tion
Taxe
s-
$
-
$
-
$
1
9,8
59
$
1
9,8
59
$
1
9,8
59
$
4
3,2
57
$
5
5,5
09
$
4
5,2
20
$
5
2,8
48
$
5
4,1
13
$
3
10
,52
5$
Loca
l Optio
ns S
ale
s Ta
xes
-$
-
$
-
$
-
$
-
$
-
$
7
9,0
13
$
1
58
,02
5$
23
7,0
38
$
31
6,0
50
$
31
6,0
50
$
1,1
06
,17
5$
Con
stru
ctio
n M
ate
ria
ls -
Loc
al S
ale
s and
Use
Taxe
s (1
%)
-$
-
$
-
$
8
,03
3$
8,0
33
$
8
,03
3$
1
6,7
45
$
2
0,7
72
$
1
5,6
45
$
1
9,3
62
$
1
8,2
48
$
1
14
,87
2$
Loca
l Mea
ls T
axe
s-
$
-
$
-
$
-
$
-
$
-
$
9
9,0
00
$
1
98
,00
0$
29
7,0
00
$
39
6,0
00
$
39
6,0
00
$
1,3
86
,00
0$
Pers
onal P
roper
ty T
axe
s-
$
-
$
-
$
6
0,2
01
$
1
20
,40
2$
18
0,6
03
$
26
3,4
89
$
37
1,7
75
$
48
0,0
61
$
59
2,2
11
$
70
3,3
52
$
2,7
72
,09
5$
Tota
l - A
nnua
l Tax
Reve
nues
95
,09
4$
9
5,0
94
$
9
5,0
94
$
3
54
,32
1$
5
85
,65
5$
92
0,8
18
$
1,5
61
,45
7$
2
,20
2,3
82
$
2,8
81
,05
1$
3
,57
2,4
29
$
3,9
99
,51
3$
1
6,3
62
,90
8$
Sour
ce:
RKG
Ass
ocia
tes, In
c., 2
020
Tota
l Tax
Reve
nues
(20
20
-
20
30
)

Wilderness Crossing Market, Economic, and Fiscal Impact Analysis Orange County, Virginia January 2021
Page 4-4
RKG estimated the total personal property in relationship to the County real property tax base. Over the 2015-2019 period, the county’s average annual personal property tax base ($287 million) equaled roughly 6.7% of the County’s average annual real property tax base of $4.3 billion. For every $1 million in real property value, there is roughly $67,096 in personal property. Based on this dollar relationship, RKG projects that $2.7 million in personal property taxes will be collected from residential and commercial properties at the Wilderness Crossing development, or roughly 17% of total revenues over 10 years. c.) Local Option Sales Tax and Meals Tax Orange County receives a one percent (1%) Local Option Sales Tax which is collected by the Virginia Department of Taxation and remitted to the County in which the sale occurred. For the analysis, the consultants projected sales from two sources. The first source involved the purchase of construction materials related to building the development during the first 10 years. Because Orange County does not possess many businesses selling lumber, hardware, concrete, power tools and other construction-related materials, the revenue stream is quite limited. Many of these purchases are likely to be captured by larger establishments located in Fredericksburg or Spotsylvania County. Consequently, it is estimated that only $114,000 in local option sale tax revenue would be collected on construction purchases. The second source would include those commercial establishments, including restaurants, located in the Wilderness Crossing commercial center. Roughly 125,000 SF of new commercial space is planned by 2030 and the cumulative retail sales is estimated at $163.4 million. A 1% local option sales tax will be levied on retail sales and 4% will be levied on drinking and dining sales. In total, RKG projects local sales and meals tax revenues of approximately $2.5 million during the first 10 years or roughly 15.3% of total revenues. d.) Countywide Fire & EMT District Taxes In March 2020, the Orange County Board of Supervisors adopted a $0.11 Countywide tax on real estate to fund its fire and EMT services. Population growth is pushing the County to move to a professionally staffed fire department, due to a steady attrition in its volunteer fire and rescue force. In 2020, the county was expected to spend approximately $873,390 in support of volunteer fire and rescue operations throughout the county. Meanwhile, it anticipated spending $5.2 million on its professional staff. Of that $6 million total, $1.4 million is recoverable through insurance, leaving the county with a balance of $4.6 million to fund through the new tax.2 However, the $0.11 tax rate is being deducted from the County’s property tax rate of $0.72/per $100 in assessed value, thereby reducing the real property tax rate to $0.61/per thousand. Based on the projected assessed value of real estate at Wilderness Crossing, the new fire and EMT tax would generate $1.6 million in tax revenues by 2030. e.) Real Estate Recordation Taxes Recordation and Transfer Taxes are excise taxes imposed and governed by State and Local Law for the privilege of recording an instrument in the County Land Records (or, in some cases, with the State Department of Assessments and Taxation). Orange County’s recordation tax rate is $0.083/$100 in assessed value. Based on the sale of over $337 million in real property value, the recordation tax would generate over $310,000 by 2030, or 1.9% of all revenues.
2. Municipal Expenditure Projections In addition to municipal revenues, new development also generates public expenditures associated with the cost of providing government services. To fully assess the cost of service associated with the proposed development program, departmental expenses have been estimated for locally funded government services that will be provided by Orange County to the residents, workers, property owners and patrons of the proposed Wilderness Crossing development during the 2020-2030 period.
2 “Supervisors approve fire and EMS levy,” Orange County Review, Jeff Poole, March 19, 2020.
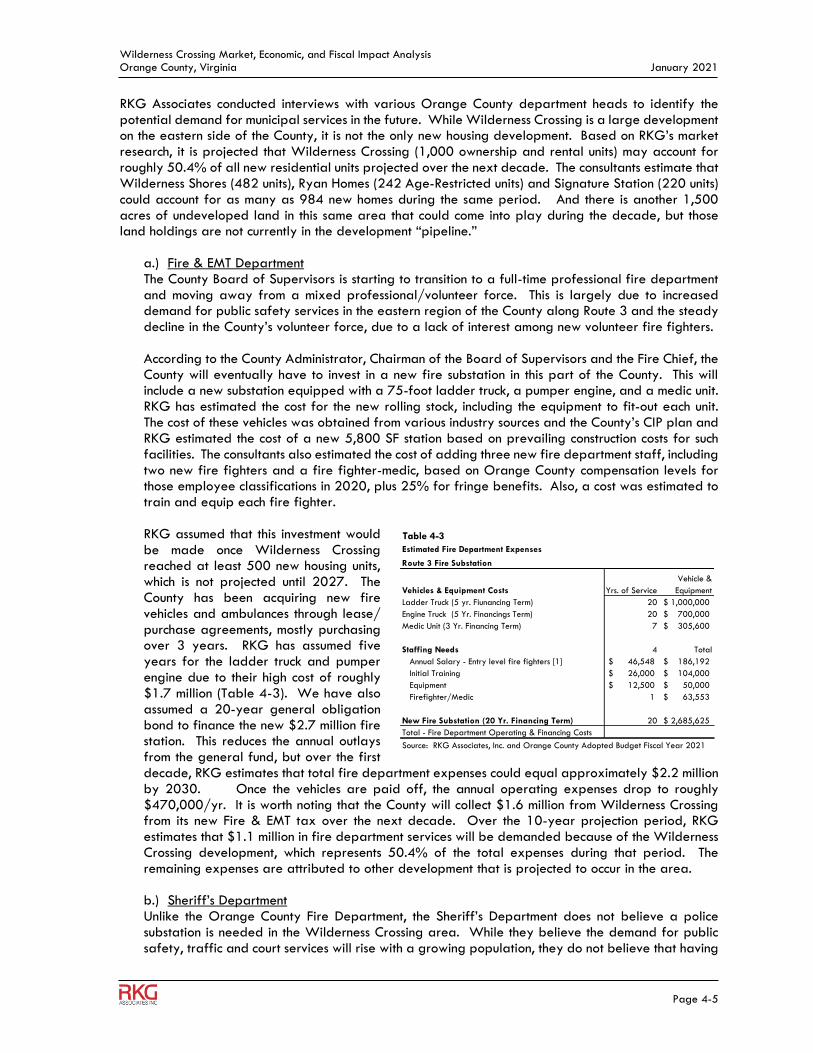
Wilderness Crossing Market, Economic, and Fiscal Impact Analysis Orange County, Virginia January 2021
Page 4-5
RKG Associates conducted interviews with various Orange County department heads to identify the potential demand for municipal services in the future. While Wilderness Crossing is a large development on the eastern side of the County, it is not the only new housing development. Based on RKG’s market research, it is projected that Wilderness Crossing (1,000 ownership and rental units) may account for roughly 50.4% of all new residential units projected over the next decade. The consultants estimate that Wilderness Shores (482 units), Ryan Homes (242 Age-Restricted units) and Signature Station (220 units) could account for as many as 984 new homes during the same period. And there is another 1,500 acres of undeveloped land in this same area that could come into play during the decade, but those land holdings are not currently in the development “pipeline.”
a.) Fire & EMT Department The County Board of Supervisors is starting to transition to a full-time professional fire department and moving away from a mixed professional/volunteer force. This is largely due to increased demand for public safety services in the eastern region of the County along Route 3 and the steady decline in the County’s volunteer force, due to a lack of interest among new volunteer fire fighters. According to the County Administrator, Chairman of the Board of Supervisors and the Fire Chief, the County will eventually have to invest in a new fire substation in this part of the County. This will include a new substation equipped with a 75-foot ladder truck, a pumper engine, and a medic unit. RKG has estimated the cost for the new rolling stock, including the equipment to fit-out each unit. The cost of these vehicles was obtained from various industry sources and the County’s CIP plan and RKG estimated the cost of a new 5,800 SF station based on prevailing construction costs for such facilities. The consultants also estimated the cost of adding three new fire department staff, including two new fire fighters and a fire fighter-medic, based on Orange County compensation levels for those employee classifications in 2020, plus 25% for fringe benefits. Also, a cost was estimated to train and equip each fire fighter. RKG assumed that this investment would be made once Wilderness Crossing reached at least 500 new housing units, which is not projected until 2027. The County has been acquiring new fire vehicles and ambulances through lease/ purchase agreements, mostly purchasing over 3 years. RKG has assumed five years for the ladder truck and pumper engine due to their high cost of roughly $1.7 million (Table 4-3). We have also assumed a 20-year general obligation bond to finance the new $2.7 million fire station. This reduces the annual outlays from the general fund, but over the first decade, RKG estimates that total fire department expenses could equal approximately $2.2 million by 2030. Once the vehicles are paid off, the annual operating expenses drop to roughly $470,000/yr. It is worth noting that the County will collect $1.6 million from Wilderness Crossing from its new Fire & EMT tax over the next decade. Over the 10-year projection period, RKG estimates that $1.1 million in fire department services will be demanded because of the Wilderness Crossing development, which represents 50.4% of the total expenses during that period. The remaining expenses are attributed to other development that is projected to occur in the area. b.) Sheriff’s Department Unlike the Orange County Fire Department, the Sheriff’s Department does not believe a police substation is needed in the Wilderness Crossing area. While they believe the demand for public safety, traffic and court services will rise with a growing population, they do not believe that having
Table 4-3
Estimated Fire Department Expenses
Route 3 Fire Substation
Vehicles & Equipment Costs Yrs. of Service
Vehicle &
Equipment
Ladder Truck (5 yr. Fiunancing Term) 20 1,000,000$
Engine Truck (5 Yr. Financings Term) 20 700,000$
Medic Unit (3 Yr. Financing Term) 7 305,600$
Staffing Needs 4 Total
Annual Salary - Entry level fire fighters [1] 46,548$ 186,192$
Initial Training 26,000$ 104,000$
Equipment 12,500$ 50,000$
Firefighter/Medic 1 63,553$
New Fire Substation (20 Yr. Financing Term) 20 2,685,625$
Total - Fire Department Operating & Financing Costs
Source: RKG Associates, Inc. and Orange County Adopted Budget Fiscal Year 2021

Wilderness Crossing Market, Economic, and Fiscal Impact Analysis Orange County, Virginia January 2021
Page 4-6
a fixed operation center is the most efficient way to serve this area. Having a new station requiring a level of staffing that may not be justifiable and having a fixed base of operation commits staffing to a location that may not need that level of service for a couple decades. However, additional officers with patrol vehicles will be required to respond to increased calls for service for such things as: (1) traffic accidents and violations, (2) domestic calls, (3) burglaries, (4) vandalism, (5) shoplifting, (6) animal control, and similar service calls. The Sheriff’s Department believes that they should be able to provide enhanced services for this area with a modest County investment, particularly during the first decade of the project. The sheriff believes that three officers including a deputy, investigator and an animal control officer might be required once the population exceeds 1,500. The department’s cost to equip each officer, including a vehicle is roughly $120,000. RKG has assumed 25% fringe benefits on top of the annual pay (Table 4-4). While the department’s typical threshold is one new officer with patrol car for every 1,500 in new population, three officers will be required due to additional development activity in this area. RKG estimates that Wilderness Crossing will meet this threshold by 2027. Over the 10-year projection period, RKG estimates that $384,000 in public safety services from the Sheriff’s Department will be demanded. This amount is roughly 50.4% of the full police expenses during this period and the remaining amount is attributed to other developments in the area. c.) Public Education The Orange County Public School District reports that it had an enrollment of 4,738 school-age children in grades K-12 during the 2018-2019 school year. During that same year, Orange County had an estimated 13,543 households, resulting in an average of 0.352 school-age children per household. While enrollment fluctuates slightly up and down each year, RKG used this student multiplier to project future students in Wilderness Crossing households. Based on the number of new housing units constructed at Wilderness Crossing by 2030 (1,000 units), it is estimated that as many as 352 new school-age students could be added to the County’s schools in all grades (Figure 4-2). This would result in a 7.4% increase over 10 years. Roughly 38% (134 students) would be elementary school-age students and 30.6% (108 students) would be high school students, based on current student multipliers by grade (Table 4-5).
Estimated Sheriff's Department Expenses
Staffing and Equipment
Sheriff Staffing Needs
No. of
Officers Annual Pay
Deputy Officer 1 52,873$
Animal Control Officer 1 50,000$
Investigator 1 58,295$
Total Annual Compensation
Vehicles & Equipment Cost
Deputy (Car & Equipment) 53,909$
Animal Control (Car & Equipment) 57,500$
Investigator (Car & Equipment) 47,131$
Total - Sheriff's Office Expenses
Source: RKG Associates, Inc. and Orange Co. Sheriff, 2020
Table 4-4
Kindergarten, 7.7%
Elementary, 37.9%
Middle School, 23.8%
High School, 30.6%
Distribution of School-age ChildrenWilderness Crossing
(2020-2030)
352 Students
Figure 4-2

Wilderness Crossing Market, Economic, and Fiscal Impact Analysis Orange County, Virginia January 2021
Page 4-7
The average local cost of educating each student in the Orange County system was $4,075 in 2018-19, which did not reflect debt service costs. This amount was used to project the local cost of education as more children are added to the system. By 2030, the cumulative education cost will equal roughly $5.4 million, with the peak occurring in 2030 at $1.4 million (Table 4-5). The vast majority of education costs are paid by state and local sources. Education expense account for 55.3% of all expenses over the first decade. Based on a student:teacher ratio of 20.1 students per teacher, Wilderness Crossing will generate demand for 17.5 new teachers.
d.) Planning Services The Planning Department anticipates the need for additional plan review and project management due to increased staff review time and the need to manage the rezoning process. According to the County Administrator, the Department is in the process of retaining an outside consulting firm to support the planning department as it manages this growth. RKG has estimated between $25,000 to $50,000 per year for these services, although this amount was not confirmed at the time of this analysis. At an average of $100/hr. this equates to 20 to 40 hrs. of service per month. Approximately 50% of these costs are attributed to Wilderness Crossing and the balance is attributed to the other development in the area. In total, additional planning services will cost $325,000 and Wilderness Crossing will account for $162,500. e.) Parks & Recreation The Parks & Recreation Department does not anticipate any changes in service levels due to the Wilderness Crossing development nor do they anticipate any capital planning needs or budgetary changes.
f.) Other General Government Expenditures The first step in determining the expenditures associated with all other general government services is to allocate the proportional share of departmental expenses to residential and commercial development. RKG Associates employs a methodology that uses the County’s 2020-21 budget, and the assessed value of taxable property contained in Orange County’s tax assessment roll.
The residential land uses’ proportional share of applicable government expenses is approximately 68%, compared to 6.8% for commercial. The balance of the County’s tax base consists of agricultural lands at 21% and public service at 4% for a total of 100%. While apartments are typically considered commercial properties but will demand municipal services as households, they are included in the residential portion. Departmental expenses shown in Table 4-6 are derived from the County’s budget document and thus are not actual departmental spending amounts. Unfortunately, the expenditure categories in the County’s Comprehensive Annual Financial Report (CAFR) for 2020 is not detailed enough at the department level for purposes of this analysis.
Wilderness Crossing
Projected Education Expenses
(2020-2030)
Year 1 2 3 4 5 6 7 8 9 10
Students
Per HH 2020 2021 2022 2023 2024 2025 2026 2027 2028 2029 2030
Cumulative No. of New Houiing Units - - - 65 130 195 358 546 656 828 1,000
Students Per Household
Kindergarten 0.027 - - - 1.75 3.51 5.26 9.66 14.73 17.70 22.34 26.98
Elementary 0.134 - - - 8.69 17.37 26.06 47.85 72.97 87.67 110.66 133.65
Middle School 0.084 - - - 5.45 10.91 16.36 30.04 45.82 55.05 69.49 83.92
High School 0.108 - - - 7.00 13.99 20.99 38.53 58.77 70.61 89.12 107.63
Total Students per Household 0.352 - - - 22.89 45.78 68.68 126.08 192.30 231.04 291.61 352.19
Cum. Cost of Education (2018 dollars) 4,075$ 93,286$ 186,572$ 279,858$ 513,791$ 783,603$ 941,472$ 1,188,321$ 1,435,171$
No. of New Teachers Required 20.1 1.1 2.3 3.4 6.3 9.6 11.5 14.5 17.5
Source: RKG Associates, Inc. and Orange County Public Schools, Five Year Strategic Plan (2018-2023)
Table 4-5

Wilderness Crossing Market, Economic, and Fiscal Impact Analysis Orange County, Virginia January 2021
Page 4-8
Table 4-6 Orange County Expenditure Estimates
2021 Budget Wilderness Crossing Share
68.6% 6.4% 9.1% 4.2%
Department
FY 21 Adopted
Budget
Residential Tax
Base
Commercial
Tax Base
Residential Tax
Base
Commercial Tax
Base
Total - Municipal Expenditures $ 58,064,694 $ 39,811,012 $ 3,744,459 $ 3,620,247 $ 155,956
General Administration 3,770,648$ 2,585,277$ 243,160$ 235,094$ 10,128$
Board of Supervisors 124,194$ 85,151$ 8,009$ 7,743$ 334$
County Administration 396,265$ 271,692$ 25,554$ 24,707$ 1,064$
Management Services 356,248$ 244,255$ 22,974$ 22,212$ 957$
County Attorney 140,753$ 96,505$ 9,077$ 8,776$ 378$
Human Resources 228,590$ 156,729$ 14,741$ 14,252$ 614$
Independent Auditor 79,700$ 54,645$ 5,140$ 4,969$ 214$
Commissioner of the Revenue 432,362$ 296,441$ 27,882$ 26,957$ 1,161$
General Reassessment -$ -$ -$ -$ -$
Treasurer 443,728$ 304,234$ 28,615$ 27,666$ 1,192$
Finance 326,836$ 224,089$ 21,077$ 20,378$ 878$
Information Technology 833,753$ 571,648$ 53,767$ 51,983$ 2,239$
Geographic Information Systems 95,184$ 65,261$ 6,138$ 5,935$ 256$
Dues 12,085$ 8,286$ 779$ 753$ 32$
Electoral Board 97,186$ 66,634$ 6,267$ 6,059$ 261$
Registrar 203,764$ 139,707$ 13,140$ 12,704$ 547$
Judicial Court 2,181,028$ 1,495,383$ 140,649$ 135,984$ 5,858$
Circuit Court Judge 75,443$ 51,726$ 4,865$ 4,704$ 203$
Circuit Court Jury 85,327$ 58,503$ 5,503$ 5,320$ 229$
General District Court 9,635$ 6,606$ 621$ 601$ 26$
Magistrate 3,000$ 2,057$ 193$ 187$ 8$
Juvenile & Domestic Relations Court 11,300$ 7,748$ 729$ 705$ 30$
Circuit Court Clerk 475,425$ 325,967$ 30,659$ 29,642$ 1,277$
Courts-Sheriff 765,112$ 524,585$ 49,340$ 47,704$ 2,055$
Victim Witness Program 100,695$ 69,040$ 6,494$ 6,278$ 270$
Commonwealth Attorney 643,606$ 441,277$ 41,505$ 40,128$ 1,729$
Commonwealth Attorney Collections 11,485$ 7,874$ 741$ 716$ 31$
Public Safety 9,451,235$ 6,480,069$ 609,488$ 589,270$ 25,385$
Sheriff 3,150,661$ 2,160,194$ 203,179$ 196,439$ 8,462$
Emergency Communications Center 1,465,681$ 1,004,918$ 94,518$ 91,383$ 3,937$
Triad 22,257$ 15,260$ 1,435$ 1,388$ 60$
Jointly Operated Institutions 2,444,892$ 1,676,296$ 157,665$ 152,435$ 6,567$
Probation Service 6,886$ 4,721$ 444$ 429$ 18$
Building Inspection 322,394$ 221,044$ 20,790$ 20,101$ 866$
Animal Control 241,442$ 165,540$ 15,570$ 15,054$ 648$
Animal Shelter 468,150$ 320,979$ 30,190$ 29,188$ 1,257$
Medical Examiner 500$ 343$ 32$ 31$ 1$
Public Works 1,328,372$ 910,774$ 85,664$ 82,822$ 3,568$
Building & Grounds 1,328,372$ 910,774$ 85,664$ 82,822$ 3,568$
Maintenance of Library Interiors -$ -$ -$ -$ -$
Health & Human Services 4,428,663$ 3,036,433$ 285,594$ 276,121$ 11,895$
Local Health Department 306,542$ 210,175$ 19,768$ 19,112$ 823$
Rapp Regional Com. Svc. Board 337,440$ 231,360$ 21,761$ 21,039$ 906$
Welfare & Social Services 9,077$ 6,223$ 585$ 566$ 24$
Child Care 407,250$ 279,224$ 26,263$ 25,391$ 1,094$
Children's Services Act 3,099,989$ 2,125,452$ 199,911$ 193,280$ 8,326$
Other 268,365$ 184,000$ 17,306$ 16,732$ 721$
Education 43,600$ 29,894$ 2,812$ 2,718$ 117$
Germanna Community College 43,600$ 29,894$ 2,812$ 2,718$ 117$
Parks & Recreation 1,475,128$ 1,011,395$ 95,128$ 91,972$ 3,962$
Parks & Recreation 315,420$ 216,262$ 20,341$ 19,666$ 847$
Cultural Enrichment 43,000$ 29,482$ 2,773$ 2,681$ 115$
Orange County Library Imain) 645,181$ 442,357$ 41,606$ 40,226$ 1,733$
Wilderness Branch Library 286,757$ 196,610$ 18,492$ 17,879$ 770$
Gordonsville Branch Library 184,770$ 126,684$ 11,915$ 11,520$ 496$
Community Development 1,920,943$ 1,317,060$ 123,877$ 119,768$ 5,159$
Building Development Services 274,245$ 188,031$ 17,685$ 17,099$ 737$
Planning Services 157,614$ 108,065$ 10,164$ 9,827$ 423$
Planning District Commission 34,447$ 23,618$ 2,221$ 2,148$ 93$
Planning Commission 16,222$ 11,122$ 1,046$ 1,011$ 44$
Board of Zoning Appeals 5,900$ 4,045$ 380$ 368$ 16$
Economic Development 258,170$ 177,010$ 16,649$ 16,097$ 693$
Economic Development Authority Contribution 128,357$ 88,006$ 8,277$ 8,003$ 345$
Tourism 210,218$ 144,132$ 13,556$ 13,107$ 565$
Transfer to Broadband Authority 588,793$ 403,695$ 37,970$ 36,710$ 1,581$
Culpeper Soil & Water Conservation 62,965$ 43,171$ 4,060$ 3,926$ 169$
Virginia Tech Coop. Ext 171,796$ 117,789$ 11,079$ 10,711$ 461$
VA Division of Forestry 12,216$ 8,376$ 788$ 762$ 33$
Non-Departmental Expenses 37,893,740 25,981,161$ 2,443,680$ 2,362,618$ 101,779$
Source: RKG Associates, Inc. and Orange County Adopted Budget, Fiscal Year 2021

Wilderness Crossing Market, Economic, and Fiscal Impact Analysis Orange County, Virginia January 2021
Page 4-9
The departmental expenses shown in Table 4-6 are adjusted to reflect a proportional share and efficiencies associated with the provision of government services to households in Orange County. The projections of municipal costs on a per household basis recognize that there are economies of scale associated with ongoing government operations, and that the introduction of new households into the City will impact certain departments more directly than others. The departments expenditures estimated in the previous section (e.g., Fire & EMT, Sheriff, education, etc.) are most directly impacted and thus have been estimated separately. The remaining department expenses were estimated using a proportional technique. The Wilderness Crossing development residential tax base value at buildout is estimated at 9.1% ($325.4 million) of the County’s 2020 residential assessed value of $3.6 billion. The commercial tax base value ($12.2 million) is only 4.2% of the County’s 2020 commercial assessed value of $292.5 million. Those proportions are then applied to municipal expenditure categories as appropriate. That reduces the County expenditures that just relate proportionally to the Wilderness Crossing impact, as a percentage of the County’s tax base. Finally, RKG determined if the new development would result in increased demand for each municipal service category. As a result, certain categories were not judged to result in increase costs due to the project. This determine was made on an expenditure line-item basis to get to the final increased service demand related to Wilderness Crossing. Based on RKG’s analysis, roughly $2.7 million in general government expenditures would be incurred during the 10-year study period, with $2.2 million driven by residential households. g.) Net Fiscal Impact Results It should be noted that municipal expenditures contained in the analysis are portrayed as being directly related to new development that is planned over the next decade. Of course, this distorts the fact that thousands of existing households and business are currently located in the eastern part of the county and have an unmet need for these services and will benefit from them. With that being said, Wilderness Crossing still is projected to realize a net positive fiscal impact of approximately $6.6 million over the first 10 years (Table 4-7).

Wilderness Crossing Market, Economic, and Fiscal Impact Analysis Orange County, Virginia January 2021
Page 4-10
Net
Fis
cal
Imp
act
An
aly
sis
Wil
dern
ess C
rossin
g
(20
20
-20
30
)
Yea
r1
23
45
67
89
10
Rev
en
ues b
y T
yp
e2
02
02
02
12
02
22
02
32
02
42
02
52
02
62
02
72
02
82
02
92
03
0
Real Est
ate
Taxes
80
,56
6$
8
0,5
66
$
8
0,5
66
$
2
25
,55
4$
3
70
,54
2$
60
3,4
95
$
89
8,0
16
$
1,1
84
,67
2$
1
,53
0,1
57
$
1,8
60
,46
4$
2
,12
8,0
10
$
9,0
42
,60
7$
County
wid
e F
ire &
EM
T D
istr
ict Taxes
14
,52
8$
1
4,5
28
$
1
4,5
28
$
4
0,6
74
$
6
6,8
19
$
1
08
,82
7$
16
1,9
37
$
21
3,6
29
$
27
5,9
30
$
33
5,4
93
$
38
3,7
40
$
1,6
30
,63
4$
Real Est
ate
Reco
rda
tion T
axes
-$
-
$
-
$
1
9,8
59
$
1
9,8
59
$
1
9,8
59
$
4
3,2
57
$
5
5,5
09
$
4
5,2
20
$
5
2,8
48
$
5
4,1
13
$
3
10
,52
5$
Loca
l O
ptions
Sale
s Taxes
-$
-
$
-
$
-
$
-
$
-
$
7
9,0
13
$
1
58
,02
5$
23
7,0
38
$
31
6,0
50
$
31
6,0
50
$
1,1
06
,17
5$
Const
ruct
ion M
ate
ria
ls -
Loca
l Sale
s and U
se T
axes
(1%
)-
$
-
$
-
$
8
,03
3$
8,0
33
$
8
,03
3$
1
6,7
45
$
2
0,7
72
$
1
5,6
45
$
1
9,3
62
$
1
8,2
48
$
1
14
,87
2$
Loca
l M
eals
Taxes
-$
-
$
-
$
-
$
-
$
-
$
9
9,0
00
$
1
98
,00
0$
29
7,0
00
$
39
6,0
00
$
39
6,0
00
$
1,3
86
,00
0$
Pers
onal Pro
pert
y T
axes
-$
-
$
-
$
6
0,2
01
$
1
20
,40
2$
18
0,6
03
$
26
3,4
89
$
37
1,7
75
$
48
0,0
61
$
59
2,2
11
$
70
3,3
52
$
2,7
72
,09
5$
Tota
l -
Annual Tax R
evenues
95
,09
4$
9
5,0
94
$
9
5,0
94
$
3
54
,32
1$
5
85
,65
5$
92
0,8
18
$
1,5
61
,45
7$
2
,20
2,3
82
$
2,8
81
,05
1$
3
,57
2,4
29
$
3,9
99
,51
3$
1
6,3
62
,90
8$
Ex
pen
dit
ure
s b
y T
yp
e
E
duca
tion
-$
-
$
-
$
9
3,2
86
$
1
86
,57
2$
27
9,8
58
$
51
3,7
91
$
78
3,6
03
$
94
1,4
72
$
1,1
88
,32
1$
1
,43
5,1
71
$
5,4
22
,07
5$
F
ire &
EM
T-
$
-
$
-
$
-
$
-
$
-
$
-
$
-
$
7
8,3
83
$
5
43
,87
8$
46
6,2
57
$
1,0
88
,51
9$
C
ounty
Sheriff
-$
-
$
-
$
-
$
-
$
-
$
-
$
-
$
1
81
,45
2$
10
1,5
42
$
10
1,5
42
$
38
4,5
36
$
P
lannin
g D
epa
rtm
ent
-$
1
2,5
00
$
1
2,5
00
$
2
5,0
00
$
2
5,0
00
$
2
5,0
00
$
1
2,5
00
$
1
2,5
00
$
1
2,5
00
$
1
2,5
00
$
1
2,5
00
$
1
62
,50
0$
Oth
er
Genera
l G
overn
ment Expenditure
s
R
esidentia
l-
$
-
$
-
$
4
1,4
56
$
8
2,9
12
$
1
24
,36
8$
20
3,5
66
$
30
2,9
92
$
37
7,4
32
$
47
0,6
24
$
56
3,8
15
$
2,1
67
,16
5$
C
om
merc
ial
-$
-
$
-
$
-
$
-
$
-
$
3
6,0
84
$
9
1,6
42
$
1
47
,19
9$
15
5,9
56
$
15
5,9
56
$
58
6,8
37
$
Tota
l -
Annual Expenditure
s-
$
1
2,5
00
$
1
2,5
00
$
1
59
,74
2$
2
94
,48
4$
42
9,2
26
$
76
5,9
41
$
1,1
90
,73
7$
1
,73
8,4
39
$
2,4
72
,82
2$
2
,73
5,2
42
$
9,8
11
,63
2$
Net
Fis
cal
Imp
act
(G
ap
/Su
rplu
s)
95
,09
4$
82
,59
4$
82
,59
4$
19
4,5
79
$
29
1,1
71
$
49
1,5
92
$
79
5,5
16
$
1,0
11
,64
5$
1
,14
2,6
12
$
1,0
99
,60
7$
1
,26
4,2
72
$
6,5
51
,27
5$
Sourc
e: R
KG
Ass
oci
ate
s, Inc.
, 20
20
Tota
l Tax
Revenues
(20
20
-
20
30
)
Tab
le 4
-7


![Fiscal Impact Analysis for Permanent Rule Amendment and ... · [1] Fiscal Impact Analysis for Permanent Rule Amendment and Adoptions with Substantial Economic Impact Agency: North](https://static.fdocuments.net/doc/165x107/5f0471517e708231d40dfd61/fiscal-impact-analysis-for-permanent-rule-amendment-and-1-fiscal-impact-analysis.jpg)

