Market efficiency and learning in an artificial stock ... · PDF fileMarket efficiency and...
21
Market efficiency and learning in an artificial stock market: A perspective from Neo-Austrian economics Harald A. Benink a,b, ⁎, José Luis Gordillo c , Juan Pablo Pardo d , Christopher R. Stephens e a Department of Economics & CentER, Tilburg University, P.O. Box 90153, 5000 LE Tilburg, The Netherlands b Financial Markets Group, London School of Economics, Houghton Street, London WC2A 2AE, UK c Dept. de Supercomputo, DGSCA, Universidad Nacional Autónoma de México, A. Postal 70-543, México D.F. 04510, Mexico d Science Studies Unit, University of Edinburgh, 21 Buccleuch Place, George Square, Edinburgh EH8 9LN, U.K. e C 3 — Centro de Ciencias de la Complejidad, Instituto de Ciencias Nucleares, Universidad Nacional Autónoma de México, A. Postal 70-543 México D.F. 04510, Mexico article info abstract Article history: Received 21 November 2009 Accepted 26 February 2010 Available online 6 March 2010 An agent-based artificial financial market (AFM) is used to study market efficiency and learning in the context of the Neo-Austrian economic paradigm. Efficiency is defined in terms of the “excess” profits associated with different trading strategies, where excess is defined relative to a dynamic buy and hold benchmark in order to make a clean separation between trading gains and market gains. We define an Inefficiency matrix that takes into account the difference in excess profits of one trading strategy versus another (signal) relative to the standard error of those profits (noise) and use this statistical measure to gauge the degree of market efficiency. A one-parameter family of trading strategies is considered, the value of the parameter measuring the relative informational advantage of one strategy versus another. Efficiency is then investigated in terms of the composition of the market defined in terms of the relative proportions of traders using a particular strategy and the parameter values associated with the strategies. We show that markets are more efficient when informational advantages are small (small signal) and when there are many coexisting signals. Learning is introduced by considering “copycat” traders that learn the relative values of the different strategies in the market and copy the most successful one. We show how such learning leads to a more informationally efficient market but can also lead to a less efficient market as measured in terms of excess profits. It is also shown how the presence of exogeneous information shocks that change trader expectations increases efficiency and complicates the inference problem of copycats. © 2010 Elsevier B.V. All rights reserved. Keywords: Market efficiency Learning Artificial stock market Neo-Austrian economics 1. Introduction In recent years it has become ever more popular to consider financial markets from other than a neoclassical rational expectations point of view. The latter considers financial markets to be in continuous equilibrium with informationally efficient prices. Empiricists have questioned the validity of this model, pointing to evidence of inefficiencies. Alternative views have been presented to better match the empirical evidence. One with a distinguished history, that will be the focus of this paper, is the Neo- Austrian theory of financial markets. Based on a recent rereading of the ideas of Friedrich Hayek and the Neo-Austrian theory of market processes (see, e.g., Hayek (1937, 1945, 1948, 1978), Littlechild (1982), Rizzo (1990), Kirzner (1992, 1997)), Benink and Bossaerts (2001) presented the first formal application of Neo-Austrian theory to financial markets. In the Neo-Austrian interpretation financial markets are continuously evolving from one inefficiency to another, never attaining the perfect, efficient equilibrium, yet strongly attracted towards it. Creative Journal of Empirical Finance 17 (2010) 668–688 ⁎ Corresponding author. Department of Economics & CentER, Tilburg University, P.O. Box 90153, 5000 LE Tilburg, The Netherlands. E-mail address: [email protected] (H.A. Benink). 0927-5398/$ – see front matter © 2010 Elsevier B.V. All rights reserved. doi:10.1016/j.jempfin.2010.02.004 Contents lists available at ScienceDirect Journal of Empirical Finance journal homepage: www.elsevier.com/locate/jempfin
-
Upload
nguyencong -
Category
Documents
-
view
214 -
download
0
Transcript of Market efficiency and learning in an artificial stock ... · PDF fileMarket efficiency and...

Journal of Empirical Finance 17 (2010) 668–688
Contents lists available at ScienceDirect
Journal of Empirical Finance
j ourna l homepage: www.e lsev ie r.com/ locate / jempf in
Market efficiency and learning in an artificial stock market: A perspectivefrom Neo-Austrian economics
Harald A. Benink a,b,⁎, José Luis Gordillo c, Juan Pablo Pardo d, Christopher R. Stephens e
a Department of Economics & CentER, Tilburg University, P.O. Box 90153, 5000 LE Tilburg, The Netherlandsb Financial Markets Group, London School of Economics, Houghton Street, London WC2A 2AE, UKc Dept. de Supercomputo, DGSCA, Universidad Nacional Autónoma de México, A. Postal 70-543, México D.F. 04510, Mexicod Science Studies Unit, University of Edinburgh, 21 Buccleuch Place, George Square, Edinburgh EH8 9LN, U.K.e C3 — Centro de Ciencias de la Complejidad, Instituto de Ciencias Nucleares, Universidad Nacional Autónoma de México, A. Postal 70-543 México D.F. 04510, Mexico
a r t i c l e i n f o
⁎ Corresponding author. Department of EconomicsE-mail address: [email protected] (H.A. Benink).
0927-5398/$ – see front matter © 2010 Elsevier B.V.doi:10.1016/j.jempfin.2010.02.004
a b s t r a c t
Article history:Received 21 November 2009Accepted 26 February 2010Available online 6 March 2010
An agent-based artificial financial market (AFM) is used to studymarket efficiency and learningin the context of the Neo-Austrian economic paradigm. Efficiency is defined in terms of the“excess” profits associated with different trading strategies, where excess is defined relative toa dynamic buy and hold benchmark in order to make a clean separation between trading gainsand market gains. We define an Inefficiency matrix that takes into account the difference inexcess profits of one trading strategy versus another (signal) relative to the standard error ofthose profits (noise) and use this statistical measure to gauge the degree of market efficiency. Aone-parameter family of trading strategies is considered, the value of the parameter measuringthe relative informational advantage of one strategy versus another. Efficiency is theninvestigated in terms of the composition of the market defined in terms of the relativeproportions of traders using a particular strategy and the parameter values associated with thestrategies. We show that markets are more efficient when informational advantages are small(small signal) and when there are many coexisting signals. Learning is introduced byconsidering “copycat” traders that learn the relative values of the different strategies in themarket and copy the most successful one. We show how such learning leads to a moreinformationally efficient market but can also lead to a less efficient market as measured interms of excess profits. It is also shown how the presence of exogeneous information shocksthat change trader expectations increases efficiency and complicates the inference problem ofcopycats.
© 2010 Elsevier B.V. All rights reserved.
Keywords:Market efficiencyLearningArtificial stock marketNeo-Austrian economics
1. Introduction
In recent years it has become ever more popular to consider financial markets from other than a neoclassical rationalexpectations point of view. The latter considers financial markets to be in continuous equilibrium with informationally efficientprices. Empiricists have questioned the validity of this model, pointing to evidence of inefficiencies. Alternative views have beenpresented to better match the empirical evidence. One with a distinguished history, that will be the focus of this paper, is the Neo-Austrian theory of financial markets.
Basedon a recent rereadingof the ideas of FriedrichHayek and theNeo-Austrian theory ofmarket processes (see, e.g., Hayek (1937,1945, 1948, 1978), Littlechild (1982), Rizzo (1990), Kirzner (1992, 1997)), Benink and Bossaerts (2001) presented the first formalapplication of Neo-Austrian theory to financial markets. In the Neo-Austrian interpretation financial markets are continuouslyevolving from one inefficiency to another, never attaining the perfect, efficient equilibrium, yet strongly attracted towards it. Creative
& CentER, Tilburg University, P.O. Box 90153, 5000 LE Tilburg, The Netherlands.
All rights reserved.

669H.A. Benink et al. / Journal of Empirical Finance 17 (2010) 668–688
investors track and exploit profit opportunities generated by continuous shocks in a never-ending cycle. The result would be a stableprocesswith pronounced regularities. According to Neo-Austrian theory, a competitivemarket provides a systematic set of forces, putin motion by entrepreneurial alertness (i.e. eagerness to make money), which tend to reduce the extent of ignorance among marketparticipants.
The resulting knowledge is not perfect; neither is ignorance necessarily invincible. Equilibrium–read: market efficiency–isnever attained, yet themarket does exhibit powerful tendencies towards it. The fact that equilibrium is never attained is attributedto an erratically changing world where traders realize that their knowledge is imperfect. At the same time, the changes are neverso extreme as to frustrate the emergence of powerful and pervasive economic regularities. Although traders can exhibit fullyrational behaviour, in the sense that they try to optimize their financial position andwealth, themarket process is not generating arational expectations equilibrium (REE) and informationally efficient prices. Rational behaviour does not necessarily implyrational expectations.1
Imperfect knowledge is a key characteristic of Neo-Austrian thinking. According to Hayek, the problem of economic choice andultimately the analysis of economic behaviour in neoclassical theory is oversimplified, because it has been reduced to optimalbehaviour under constraints that agents are supposed to be very familiar with. These constraints concern: (1) preferences,(2) production and market technology, and (3) resources. In contrast, the Neo-Austrian view stresses that fundamentaluncertainty and ignorance exist regarding these constraints. This uncertainty and ignorance is claimed to lead to disequilibrium,and disequilibrium itself generates further uncertainty and ignorance regarding the constraints. Disequilibrium thereby becomesself-enforcing and permanent.
However, alert participants in the market process, whom the Neo-Austrians define as entrepreneurs, try to get a–necessarilyincomplete–picture of the nature of the disequilibrium in the marketplace, because disequilibrium generates profit opportunities.The actions of these entrepreneurs produce the very signals that are needed to reduce disequilibrium. What renders the marketprocess a systematic process of coordination is the circumstance that each gap in market coordination expresses itself as a pureprofit opportunity. The profit-grasping actions of successful entrepreneurs dispel the ignorance which was responsible for theprofit opportunities, and thus generate a tendency towards coordination among market decisions. However, due to continuouschange in the constraints, equilibrium is never reached.
In their paper Benink and Bossaerts (2001) construct an example of an economy with a continuously inefficient financialmarket. They adjust the memory of investors' trading rules in order to generate a market process that can be characterized asstable, cycling from one inefficiency to another. Despite the stability (stationarity), rational, risk-averse investors are unable toexploit all inefficiencies because they cannot make reliable inferences about them. This would be the case, for instance, if thememory of the return process is sufficiently long for statistics not to display their usual distributional properties needed toconstruct confidence intervals. Based on an analysis of average price changes, an investor will with high likelihood rejectefficiency, yet the sign of the average is unreliable in predicting the sign in independent future replication. As a consequence,classical statistics cannot reliably assess the inefficiencies.
As a follow-up to Benink and Bossaerts, this paper places more emphasis on, and studies in detail, the learning processes anddynamics of a Neo-Austrian inefficient financial market. As mentioned above, the neoclassical rational expectations point of viewconsiders financial markets to be in continuous equilibrium with informationally efficient prices. Pesaran (1989) notes that theidea of a REE involves much more than the familiar concept of the equilibrium of demand and supply. A REE can be characterizedby three main features: (1) all markets clear at equilibrium prices, (2) every agent knows the relationship between equilibriumprices and private information of all other agents, and (3) the information contained in equilibrium prices is fully exploited by allagents inmaking inferences about the private information of others. Thus, in a REE prices perform a dual role— apart from clearingthemarkets they also reveal to every agent the private information of all the other agents. In effect, the concept of the REE requiresthat everybody knows (in a probabilistic sense) everything about the way the market economy functions. But as Hayek (1937)puts it:
1 Not(adjustm
2 For3 The
Lo (199
“The statement that, if people know everything, they are in equilibrium is true simply because that is how we defineequilibrium. The assumption of a perfect market in that sense is just another way of saying that equilibrium exists, butdoes not get us any nearer an explanation of when and how such a state will come about. It is clear that if we want to makethe assertion that under certain conditions people will approach that state we must explain by what process they willacquire the necessary knowledge”.
The preceding implies that, for the REE to have any operational meaning, it is necessary that the processes by means of whichpeople learn from experience and acquire the common knowledge necessary for the achievement of the REE, are specified fullyand explicitly.2
In this paper we use an agent-based artificial financial market (AFM) to generate simulations of inefficiencies and learning andinvestigate to what extent a Neo-Austrian interpretation of the resulting market dynamics is the most natural.3 Agent-based
e that in the Neo-Austrian view the failure of markets to reach the informationally efficient equilibrium ought not to be attributed to costs of any natureent costs, information costs, trading costs, etc). As mentioned, the non-convergence has its origin in limitations of knowledge.
a recent discussion of these issues, see Pesaran (2006).results of AFMs in the past have mainly been analysed using an “evolutionary” as opposed to neoclassical view of markets (see, for instance, Farmer and9) and Farmer (1998)).

670 H.A. Benink et al. / Journal of Empirical Finance 17 (2010) 668–688
models are intermediate between empirical and analytic studies; the former offering grave problems in terms of inference, whilethe latter, perforce, come armedwith a large number of model assumptions. Moreover, the complexity of the AFM can be tuned, soas to offer a more transparent model versus a more realistic one where it is difficult to understand the relations between inputsand outputs when market parameters are changed. The AFMwe deal with is deliberately kept simple as our primary concern is tobe able to intuitively understand how the behaviour of the AFM changes while changing parameters of the AFM (such as thetrading strategies).4
The most well known AFM is the Santa Fe model (Palmer, Arthur, Holland, LeBaron and Tayler (1994), Arthur, Holland,LeBaron, Palmer and Tayler (1997), LeBaron (1999, 2000, 2001)). In this paper we use an alternative model–the so-called NeuralNetworks Chaos and Prediction Model (NNCP) (Gordillo and Stephens (2001a,b, 2003))–whose design was motivated by thedesire to study relatively neglected elements, such as the effect of organizational structure on market dynamics and the role ofmarket makers and information, all of which are important in the formation of market microstructure (see, for example O'Hara(1997)). Although capable of simulating more “realistic” dynamical scenarios, in this paper we use the NNCP in the context of amore transparent model, in which traders are associated with trading strategies chosen from a single one-parameter family, theparameter representing a trading bias linked to the informational advantage of the trader, zero bias representing noise traders. Theresulting AFM, presented in Section 2, can effectively be parameterized by three principle degrees of freedom: (1) the proportionof traders of a given type, (2) the number of different trader groups or strategies, and (3) the similarity between different tradergroups — measured by distance in bias between two agents or groups. Learning is introduced in Section 2.1 via the notion of“copycat” agents that observe the market, infer what is the most successful strategy and then copy it.
We use this AFM to investigate notions of efficiency and learning and examine to what extent the results are more naturallyinterpretable in a Neo-Austrian rather than a neo-classical framework. AFMs have been used, for example, by Chen and Yeh(2002), to consider efficiency as an emergent phenomenon. There however, efficiency was judged purely from the statisticalproperties of the returns series. However, as will be further discussed in Section 3, predictability of the time series is notnecessarily inconsistent with market efficiency. We therefore consider efficiency from the empirical point of view of whether ornot traders can make excess returns systematically, defining a notion of excess profit that distinguishes betweenmarket gains andtrading gains. To further distinguish between intelligent trading and “luck” we consider, following Benink, Gordillo, Pardo andStephens (2004) and Stephens, Benink, Gordillo and Pardo (2007), relative excess returns, Iij, between trading strategies i and j,measured relative to the variance of these excess returns. In Section 3, we introduce an Inefficiency Matrix, with matrix elements Iij,which summarizes statistically the relevant relative inefficiencies in the market.
With these tools in hand, in Sections 4.1 and 4.2, we investigate both efficient and inefficient markets in the absence oflearning, showing in particular, in Section 4.1, under what conditions a market may be inefficient, yet still be observed to beefficient. This possibility is due to the statistical inference problem that traders face in the light of noisy market data. InSection 4.3 we show, paradoxically, that learning can lead to a more inefficient market in terms of excess profits, even thoughinformationally the market was more efficient; and then, in Section 4.4, we study how the arrival of new information affectsinefficiency and learning. Finally, in Section 5, we discuss the results in the framework of the Neo-Austrian paradigm and drawsome final conclusions.
2. Description of the model
For the purposes of the present investigation we consider a simplified form of the NNCP where a simulation is carried out for aprescribed number of ticks on a single risky asset. An agent can divide his/her wealth between this risky asset and a riskless asset(“cash”). At each tick an agent takes a position (buy/sell/neutral). Shares are bought in fixed size lots of one share.
Resources are finite and hence traders have portfolio limits associated with either zero cash or zero stock. Short selling is notpermitted. Although the NNCP can consider different market clearing mechanisms, here we will consider only a discrete doubleauction market where the auctions are carried out at fixed, periodic intervals. After each tick (auction) price is updatedexogenously via a supply/demand type law as in Eq. (1).5
4 In abased estylizedthe dire
5 PricStephen
pðt + 1Þ = pðtÞ½1 + ηðBðtÞ−OðtÞÞ� ð1Þ
In this equation, which is common tomany AFMs, p(t) is price at tick t and B(t) and O(t) are the aggregate demand and supply at t,while η is a tuning parameter. Large values of η lead to large price oscillationswhile small values lead to slow price adjustments. NotethatD(t)=(B(t)−O(t)) depends not only on the positions taken by the agents but also on themechanism used tomatch their trades,e.g. atwhat price two contrary tradeswill bematched. It is important to note that implementing the price dynamics via Eq. (1) is donefor reasonsof simplicity. The overall qualititative results of our studyneither depend sensitively on the tuningparameterηnor, indeed,on whether Eq. (1) is used at all, as using a simple limit order book system leads to analogous results.
n extensive overview article on agent-based computational finance LeBaron (2006) argues that financial markets are particularly well suited for agent-xplorations. In his concluding remarks, he states that “it will be interesting to see if, sometime in the future, financial economists eventually replace thetheories of equilibrium market dynamics with a more realistic picture of the continuing struggle of learning and adapting agents who push markets inction of efficiency, even though they never quite reach this goal”.e can also be updated endogenously as in the case of a market with market makers (see Gordillo and Stephens (2001a and 2001b) or Gordillo ands (2003)).

671H.A. Benink et al. / Journal of Empirical Finance 17 (2010) 668–688
The wealth of an agent i at time t is given by Wi(t)=(Ei(t)+Hi(t)p(t)) , where Ei(t) and Hi(t) are the amount of cash andnumber of shares that the agent possesses at time t.
2.1. Double auction
Themarket clearingmechanismwe use for the present simulations is a simple discrete double auction, where at every tick eachtrader places a limit order to buy or sell at a given price and with an associated volume, each trader being able to value the assetindependently but with prices that are not too different. Only crossed limit orders result in trades. In this model price changes areinduced only via the disequilibrium between supply and demand as measured by Eq. (1). Specifically, a single auction is associatedwith the following steps:
1. At time t, the tth auction, one lists all the positions associated with the limit orders placed by the agents with their associatedvolume and price. The agents' bids and offers are obtained at time t by selecting them from a Gaussian probability distributionwithmean p̄̄=p(t) the price at the beginning of the tth auction, which, of course, is the same as the price at the end of the (t−1)thauction.
2. A bid and an offer can be matched only if they overlap, i.e. pb(t)Npo(t), corresponding to crossed limit orders. To specify thesequence of trades associated with an auction one must specify an order in which the crossed orders are matched. For thepresent paper we used: “best bid/offer”, where the highest bid and the lowest offer are matched at their midpoint successivelyuntil there are no overlapping bids and offers.
3. Price is updated via Eq. (1) using only those bids and offers that have not achieved a match and that have overlap, i.e. pbNp(t)and pobp(t).
Once again, we emphasize that our results are not dependent on any of the details of how precisely the double auction isorganized.
2.2. Trading strategies
Although the NNCP market can accommodate many different strategy types we will illustrate our results in the context of amarket with relatively few types of traders, as all that we wish to demonstrate can be observed in this simple setting. Essentially,we will consider a one-parameter family of traders described by a “bias”, d (d∈ [0,1]), where the position probabilities are:
6 Themarketsense odifferen
PðcÞ = 2d3
; PðnÞ = 13; PðvÞ = 2ð1−dÞ
3ð2Þ
c represents Buy, v Sell and n Hold. For example, when d=1/2 the corresponding probabilities are 1/3, 1/3, 1/3. This limit
wherecorresponds to that of a liquidity or noise trader. An alternative, or complementary, interpretation is that it corresponds to a traderor investor that believes (correctly or incorrectly) that the market is efficient, having no statistical bias in favour of one positionversus another. In contrast, a trader with d=1 has probabilities 2/3, 1/3, 0 and corresponds to a trader with a strong belief that themarket will rise. Similarly, a trader with d=0 has a strong preponderance to sell, corresponding to a trader with a strong beliefthat the market will fall. We will denote a trading strategy from the above one-parameter family by the pair (100d,100(1−d)).Thus, an uninformed, or liquidity, trader is denoted by (50,50) and a maximally biased one, on the long side, by (100,0).One could also imaginea biased trader tohave a superior understandingof theunderlyingmarket dynamics—knowing that all elsebeing equal a preponderance to buy/sell will lead to excess demand/supply, which in its turn will lead to a price increase/decrease,whichwill lead to a higher valued portfolio. In this sensewe can think of these traders as being informed relative to their noise tradingcounterparts. It is important to realize that such considerations, such as the rationality of a trader, or what led a trader to adopt aparticular strategy (e.g. risk preferences, utility function, information set etc.), are extraneous to our discussion in this paper, as ourmodel is completely specified by the traders' strategies and a market clearing mechanism. The presence of traders with a bias maycreate an excess demand (supply in the case of a sell bias). This excess demand thus drives the price via the price evolution Eq. (1). Theactual excess demanddepends on the actual composition of thepopulation and the distribution of biases. Additionally, in the presenceof learning it may also depend on the efficiency of the learning and how easily information may be inferred from the market.6
2.3. Learning mechanism
In order to introduce the concept of learning we consider “copycat” traders Gordillo and Stephens (2001a,b). Copycats observethe success of different strategies in the market and copy the most successful one, updating their expectations periodically in thepresence of new information. The copying process may be deterministic or probabilistic and the definition of success varied. Forexample, a copycat might copy that trader that has the portfolio with highest observed Sharpe ratio, or the trader with highest
fact that the price depends on aggregate supply and demand has nothing to do with information, rather it is only a result of the discrete double auctionmechanism that we have in place. The demand and supply of a given agent are specified probabilistically, but this is not the same as “random” in thef an unbiased distribution. The price does not contain explicitly information beyond that implicit in the bias of the strategies, because there are manyt possible information sets that are consistent with these trading strategies.
672 H.A. Benink et al. / Journal of Empirical Finance 17 (2010) 668–688
daily returns over a certain period. Obviously, as we shall see, copycats face a difficult inference problem, having to distinguishbetween the best strategy and the best observed strategy. Wewill assume that there are no costs incurred in acquiring informationfor the copycats or, for that matter, any other trader.
We will consider a probabilistic copying mechanism whereby a copycat copies a strategy i with probability7
7 In tprincipadepend
PiðtÞ = μ iðtÞ= ∑i
μ iðtÞ ð3Þ
μi(t) is a measure of the success of strategy i at time t. Note that μ may well depend on other parameters or timescales. An
whereinteresting one is the period of time over which success is measured. For instance, one copycat might look at the portfolio returnsover the last 50 ticks, whereas another might consider returns over the last 50 days. Given that the copying process is stochastic itmay be that the copycat does not copy the most successful strategy. The more successful a strategy is relative to others however,the more likely it is that this is the strategy copied. The stochastic nature of the copying process is used to reflect the inefficienciesinherent in the learning process. This probabilistic selection process is carried out periodically, for example, every 100 ticks, thuspermitting the copycats to incorporate new information into their analysis.Copycats naturally try to copy informed traders to find the optimal strategy. This activates a learning process. However,complete learning is by nomeans guaranteed in the sense that they do not necessarily identify the best strategy. The quality of thelearning depends on the signal to noise ratio, which in its turn depends on the trading parameters, such as trader biases, and thenumber of traders with a particular strategy.
Note that the learning might be incomplete even in the case where there is only one other strategy to learn if the learning isinefficient (if the update frequency for learning is high however the learning will tend to be more complete). We do not require thearrival of newexogeneous information–“external shocks”–to observe incomplete learningand thepermanence of inefficiencies. Aswewill see, this will occur, for instance, when we have a wide variety of strategies that are quite similar with agents spread uniformlyamong them. It is important to emphasize here the diversity that these different types of informed trader bring to the market. Eventhough they all (potentially) receive the same information their response to it, as in a real market, can be markedly different.
3. Measures of efficiency and inefficiency
The efficient markets hypothesis is strongly linked to the idea that security prices fully reflect (publicly) available information. In thismanifestation its confirmationor negationhas beenhighly controversial due to the existence of the joint-hypothesis problem, formulatedby Fama in his seminal 1970, 1991 overviewpapers on efficient capitalmarkets,wherein efficiency is determined onlywithin the contextof a particular asset-pricing model. A common corollary of the efficient markets hypothesis (that by some has been taken to be itsdefinition) is that in an efficient market it is impossible to make excess profits in a systematic fashion, or that excess returns areunpredictable. However, Pesaran and Timmermann (1995) note that predictability of excess returns does not imply stock marketinefficiency, and can be interpreted only in conjunction with, and in relation to, an intertemporal equilibrium model of the economy.Inevitably, all theoretical attempts at interpretation of excess return predictability will be model-dependent, and hence inconclusive.Furthermore, as Balvers, Cosimano andMcDonald (1990) have pointed out it is possible to formulate an equilibriummodel that leads topredictable returns.
A way to avoid the pitfalls of the joint-hypothesis problem is to take a completely empirical approach; defining inefficiencywith respect to some measure that is not dependent on the existence of some underlying model, such as an asset-pricing model.Thus, one evaluates the economic significance of stock market predictability by seeing if the associated information could havebeen exploited successfully in investment strategies, thus leading to systematic excess returns. Of course, this begs the question ofhow do we define systematic and excess? — excess relative to what? In the literature it is common to measure excess relative tosome “fixed” benchmark such as the riskfree interest rate or to an index portfolio (the logical extreme of that being the marketportfolio). One of the chief drawbacks of such measures is that they permit the possibility that uninformed traders acquire excessprofits even when the market is efficient. Thus, as emphasized by Bagehot (1971), it is important to distinguish between tradinggains and market gains. Additionally, in reference to fixed benchmarks the discussion of systematic does not naturally arise.
In order to eliminate these defects we choose as benchmark (Benink et al (2004), Stephens et al (2007)) a “moving target”where excess profit during timestep t is related to the increase in the market value of an active trading portfolio in the timestep t,relative to the increase in the market value of a buy and hold portfolio in the same timestep. More concretely, we define the“excess” profit of a trader j using a trading strategy i in the time interval t−1 to t to be
eijðt; t−1Þ = ðδVactiveði; j; tÞ−δVBHði; j; tÞÞ ð4ÞδVactive(i, j, t) is the increase in portfolio value between t and t−1 for trader j by trading using a trading strategy i, while
whereδVBH(i, j, t) is the samequantity but using as trading strategy Buy andHold. eij(t, t−1) can also bewritten as eij(t, t−1)=δnij(t)δp(t),where δnij(t) is the change inportfolioholdings over the timestep δt=t−(t−1)of the traderusing strategy i and δp(t) is the change inasset price over this timestep.
he Evolutionary Computation literature this is known as “roulette wheel selection”. There are many other potential selection mechanisms that differlly in the degree of selection pressure, i.e. the sensitivity of the choice probability to relative trading performance. None of our results qualitativelyon this choice of selection mechanism.

673H.A. Benink et al. / Journal of Empirical Finance 17 (2010) 668–688
The excess profit earned between times t′ and t is
8 In tabsolut
9 Thethe samtest fortrader g10 The(2007))
Eijðt; t′Þ = ∑n= t
n= t′ + 1eijðn;n−1Þ ð5Þ
The average excess profits associated with a particular trading strategy, Ei(t, t′), are found by summing over all those tradersutilizing the strategy and dividing by the number of such traders In this case Ei(t, t′) represents the excess profits earned between tand t′ by a “representative” trader of the class i.
The timestep in the above may, of course, be chosen arbitrarily. In the simulations in this paper we will consider it to be themost fine-grained possible — a “tick”. In this case the maximum possible excess profit over a time interval, t′ to t, for a fixed,constant transaction volume V per trade, is that associated with “perfect foresight”. The chief advantage of having excess profitsmeasured at such high frequency is that statistical inference is enhanced due to the greater sampling. Of course, this presumes thatthe traders trade frequently.
As excess profit is a stochastic variable there is always a non-zero probability that, over a given time interval, a trader makes aprofit just by chance. Hence, it is natural to refer the magnitude of any excess profits (“signal”) to their degree of variance(“noise”), measured, for example, in units of the standard deviation. Additionally, it is natural to compare the excess profits of onetrader, or group of traders, to those of another. In other words “relative” excess profits are the most important.8 To take intoaccount both these factors we introduce the Relative Inefficiency (Benink et al (2004), Stephens et al (2007)), Iij, between twostrategies or trader groups i and j evolving from time t to time t′ as
Iijðt; t′Þ =ðEiðt; t′Þ−Ejðt; t′ÞÞ
σ2i ðt; t′ÞNi
+σ2j ðt; t′ÞNj
� �12
ð6Þ
σi(t, t′) and Ni are the variance in the excess profits of the representative agent of the strategy i and the number of traders
whereassociated with the strategy i respectively. We define Iij(t, t′) as the “relative” inefficiency between the trading strategies, or tradergroups, i and j. Dividing by the standard error, σerr, means the resultantmeasure gives us ameasure of the statistical confidencewecan have in the relative excess returns of the two strategies.9 A reasonable criterion for concluding that two strategies are relativelyinefficient over a given time interval is that Iij(t, t′)Nnσerr over that time interval, where n is a measure of the confidence intervalwe require. A reasonable value of n is n=2 though, of course, we may require a stricter criterion.The relative inefficiencies of a market, m, evolving from time t to time t′ can be described via the Inefficiency Matrix10, Im, withmatrix elements Iij(t, t′). An associated single inefficiency measure for the whole market is
Imðt; t′Þ = 1N′
ð12Trð−ðImÞ2ÞÞ
12 ð7Þ
the trace is over all strategies or trader groups and the normalization factor N′=N(N−1)/2, where N is the number of
wherestrategies or trader groups in the market. Note that this definition of inefficiency is totally endogeneous, making no referencewhatsoever to any external benchmark.It is important to emphasize that in a real financial market the question of whether a market is efficient or not is really anempirical one, as we do not have a valid underlying theory that can demonstrably prove a market to be efficient or not. Moreover,it is one that can only be answered statistically given that the evolution of a market is stochastic. In that sense the empiricalquestion boils down to one of: can one infer that a financial market is efficient from a set of data. The luxury of an artificial market isthat we can create an efficient or inefficient market and then vary the parameters of the market in order to study when, and underwhat conditions, it is possible or not to infer efficiency from observing the market. Additionally, in distinction to a real financialmarket we may obtain better statistics by “repeating history”, by rerunning the market over again.
4. Principal results
4.1. What does an efficient market look like?
Before presenting simulations of inefficiencies in the Neo-Austrian context we need to understand what an efficient marketlooks like as, even in the Neo-Austrian paradigm, there are strong tendencies directing the market towards it. We do not at this
he context of entire markets it has been suggested by Lo and MacKinlay (1999) that “relative” efficiency of markets is a more useful notion than that ofe efficiency.statistical meaning of Eq. (6) is that the numerator is the difference between two means where the null hypothesis is that both means are sampled frome underlying distribution. The denominator is the standard deviation of the sampling distribution of sample mean differences. Thus Eq. (6) is a statisticalwhether the two means were sampled from the same distribution. The interpretation in the present case is that the excess profits of the two differentroups had different origins.extension of the Inefficiency Matrix to multiple assets of different type (dividend paying stocks, bonds, derivatives etc.) can be found in Stephens et al.

Fig. 1. Histogram of excess profits for 100 (90,10) traders.
674 H.A. Benink et al. / Journal of Empirical Finance 17 (2010) 668–688
point consider a general form of efficiency but rather restrict ourselves to some simple, intuitive examples, in particular examiningefficiency in the context of a homogeneous market.
In Figs. 1 and 2 we see the distribution of excess profits for a group of 100 traders after 3001 auctions. In Fig. 2 the traders use a(50,50) strategy, i.e. they are liquidity traders, whereas in Fig. 1 they are informed (90,10) traders. In both cases the originaldistribution at t=0was a single peak of 100 traders at the origin. The efficient market dynamics here is such that the initial peakeddistribution spreads uniformly and symmetrically on average. Note that due to our choice of benchmark the losses of the traders tothe left of the origin and the profits of the traders to the right sum to zero at all times. The variance of the distribution increaseswith time as σ2(t)=A(n)t, where A(n) is a constant that measures the market liquidity — the less liquid the market the morevolatile, and therefore the greater the dispersion. The dependence on the liquidity can be seen in Figs. 1 and 2, where after 3001auctions we see that the dispersion for 100 (90,10) agents is substantially greater than that of 100 (50,50) agents. Of course, theprice behaviour in both cases is very different. In the first case, due to the large excess demand, price increases very rapidly,whereas in the latter it is a randomwalk around the initial price. Both markets however are efficient according to our excess profitcriterion, in that no trader or group of traders is making systematic excess profits at the expense of any other group. This, in fact,can be further confirmed by considering the behaviour of any particular trader or group of traders and observing that the evolutionof their excess profits is a random walk of mean zero.
Thus, we see that the hallmark of an efficient market is that no subgroup of traders make systematic excess profits at theexpense of any other. This is manifest in the present graphs by the fact that the distribution is unimodal and symmetrical. In terms
Fig. 2. Histogram of excess profits for 100 (50,50) traders.

Fig. 3. Graph of Iij(t, 0) for a fixed subgroup of 50 (50, 50) traders in an homogeneous market.
675H.A. Benink et al. / Journal of Empirical Finance 17 (2010) 668–688
of the InefficiencyMatrix we can check that any chosen group of traders is not making systematic excess profits by considering thematrix element Iij, where i refers to the group of traders of interest and j refers to the rest.
In Fig. 3 note that the scale of Iij(t, 0) for amarket of 100 (50, 50) traders is about the order of two or less. In fact, taking an averageover 10 different experiments leads to a resultant curve that leads to consistency of the null hypothesis that themarket is efficient.Wecan also see that the volatility of the curve diminishes as a function of time. This is a direct consequence of our definition of theInefficiencyMatrix. For an efficient market the numerator gives zero on average, while the denominator increases linearly with time.The interpretation of this fact is simply that as time passes Iij, being a statistical measure, allows us to infer with a higher degree ofconfidence that themarket is efficient. This also allows us to see that even ifwedecided that excess profits (or in this case losses)werebeingmade, say over thefirst 1500 ticks,wemay conclude that they arenot systematic in that after this time there arenoexcess profits(or losses).
It is worth emphasizing again here why we are using a dynamic Buy and Hold benchmark. In a market of (90,10) traders allagents will make large profits relative to a static benchmark, such as a risk free interest rate. In this sense the market is veryinefficient as in this scenario there is no mean reversion of the price so the market can continuously go up. However, no trader inthemarket is making systematic excess profits relative to any other. This aspect is mademanifest by using a dynamic Buy and Holdbenchmark and hence the market is seen to be efficient. However, in distinction to the case of a market with (50,50) traders the(90,10) market does not correspond to a rational expectations equilibium in that there is a strong, continuous excess demand. Inboth cases however traders may be acting perfectly rationally with respect to optimizing their own utilities.
Fig. 4. Histogram of excess profits for 50 (50,50) and 50 (90,10) traders after 101 ticks.
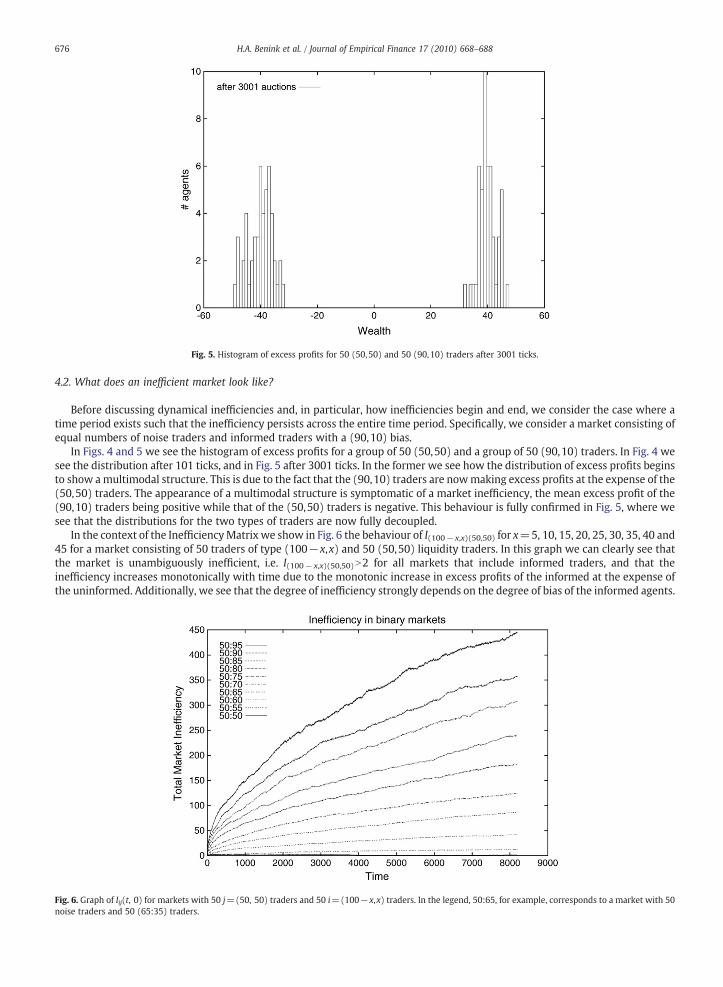
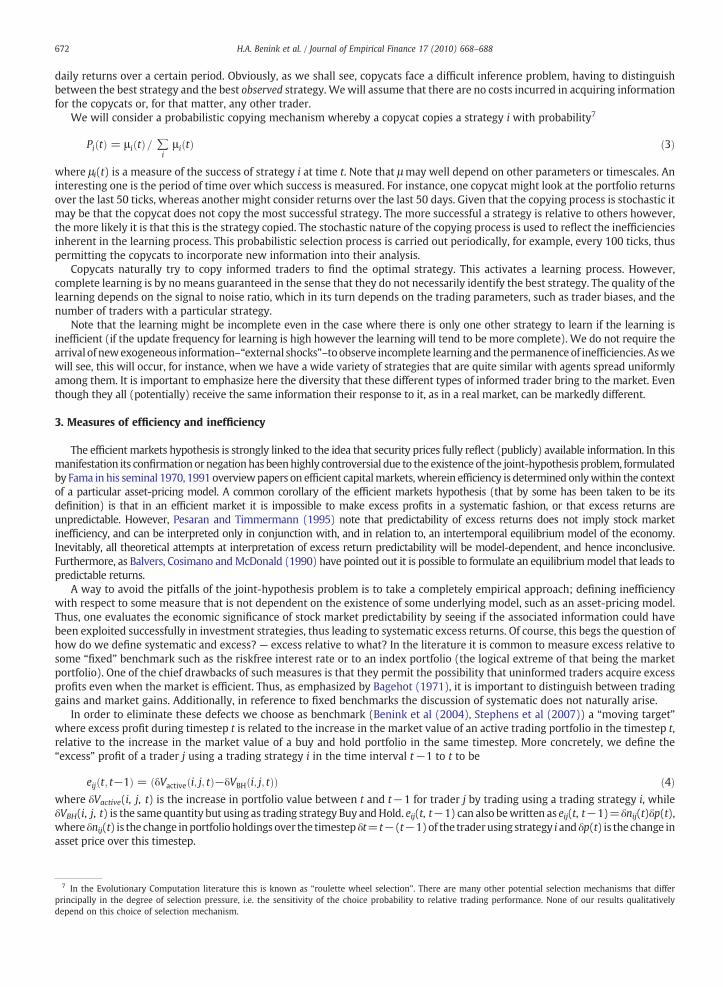
Fig. 5. Histogram of excess profits for 50 (50,50) and 50 (90,10) traders after 3001 ticks.
676 H.A. Benink et al. / Journal of Empirical Finance 17 (2010) 668–688
4.2. What does an inefficient market look like?
Before discussing dynamical inefficiencies and, in particular, how inefficiencies begin and end, we consider the case where atime period exists such that the inefficiency persists across the entire time period. Specifically, we consider a market consisting ofequal numbers of noise traders and informed traders with a (90,10) bias.
In Figs. 4 and 5 we see the histogram of excess profits for a group of 50 (50,50) and a group of 50 (90,10) traders. In Fig. 4 wesee the distribution after 101 ticks, and in Fig. 5 after 3001 ticks. In the former we see how the distribution of excess profits beginsto show amultimodal structure. This is due to the fact that the (90,10) traders are nowmaking excess profits at the expense of the(50,50) traders. The appearance of a multimodal structure is symptomatic of a market inefficiency, the mean excess profit of the(90,10) traders being positive while that of the (50,50) traders is negative. This behaviour is fully confirmed in Fig. 5, where wesee that the distributions for the two types of traders are now fully decoupled.
In the context of the InefficiencyMatrix we show in Fig. 6 the behaviour of I(100− x,x)(50,50) for x=5, 10, 15, 20, 25, 30, 35, 40 and45 for a market consisting of 50 traders of type (100−x,x) and 50 (50,50) liquidity traders. In this graph we can clearly see thatthe market is unambiguously inefficient, i.e. I(100− x,x)(50,50)N2 for all markets that include informed traders, and that theinefficiency increases monotonically with time due to the monotonic increase in excess profits of the informed at the expense ofthe uninformed. Additionally, we see that the degree of inefficiency strongly depends on the degree of bias of the informed agents.
Fig. 6. Graph of Iij(t, 0) for markets with 50 j=(50, 50) traders and 50 i=(100−x,x) traders. In the legend, 50:65, for example, corresponds to a market with 50noise traders and 50 (65:35) traders.

677H.A. Benink et al. / Journal of Empirical Finance 17 (2010) 668–688
The higher the bias the higher the excess demand and therefore the higher the average price increase between auctions. This inturn leads to higher excess profits for those traders that have a bias to buy. For larger biases the inefficiency increasesapproximately as t1/2. This can simply be deduced from the fact that for a completely biased agent excess profit increases as twhilethe volatility in excess profits also increases as t.
Eventually the curves in Fig. 6 begin to flatten out. This is a simple consequence of the existence of portfolio limits. As cash isused up exponentially by the informed as a function of time (due to the exponential increase in the price of the stock when bothinformed and uninformed agents are present), whereas the stock of the informed is used up only linearly (only one unit of stockcan change hands every auction) the informed are the first ones to decouple from the market as they have insufficient cash to payfor more stock and for that reason the rate of increase of the inefficiency goes to zero as trading diminishes and the inefficiencyitself becomes constant. The stronger the bias of the informed the quicker they decouple.
4.2.1. How does strategy diversity affect market efficiency?Previously we introduced efficiency in the context of an homogeneous market while subsequently introducing the idea of
inefficiency in the context of a market with only two types of strategy. In this sense onemay think of the resultant market as being
Fig. 7. Graph of I(t, 0) as a function of the proportion of informed to uninformed (Fig. 7a) above) and of the proportion of maximum inefficiency as a function ofinformed bias (Fig. 7b) below).

678 H.A. Benink et al. / Journal of Empirical Finance 17 (2010) 668–688
only minimally inhomogeneous (though, as we will see, this is erroneous) and naturally ask what happens in a moreheterogeneous market. Hence, in this section we consider markets with more strategy diversity. Of course, there are differentmetrics for measuring diversity available to us. In the simplified one-parameter model under consideration, for N strategies, adetailed analysis of inefficiency naturally takes place in X1=[−1, 1] by considering the distribution of the N biases in this space,i.e. the distribution of points on this interval. Of course, simpler summarymeasures, such as just counting the number of strategiesirrespective of their associated biases, can be useful. For instance, the average bias for a given set and the associated variancewouldbe useful summary measures.
Intuitively, there are three basic degrees of freedom associated with the bias distributions: i) the proportion of tradersassociated with a given bias; ii) the number of different groups of traders; iii) the similarity between the strategies of differenttrader groups — measured in the present context by “distance” in bias between two agents or groups. It is thus of interest to askhow easy or difficult is it to infer inefficiency as a function of these components.
First, we examine inefficiency as a function of the proportion of traders. In Fig. 7a and bwe see themarket inefficiency at a givenfixed time as a function of the proportion of informed traders in a binary market consisting of 100 traders, where the curvesrepresent averages over 10 experiments. The different curves correspond to different biases for the informed agents. Theassociated biases for the curves are 0 (i.e. (50,50) traders) on the bottom curve to 49 (i.e. (99,1) traders), on the top. Interestingly,we see that there always exists a maximum in the curve that corresponds to the proportion of informed to uninformed that yieldsmaximum inefficiency for a given bias. We can see how the location of the maximum depends on the trader bias in Fig. 7b, wherethe curve has the form Y=59.7+20.17exp((55.0−X)/6.07). There are two distinct effects at play in determining themaximum ofthe curve. One is that an inefficiency can arise only if an informed trader has an uninformed trader to profit from. This naively wouldlead one to believe that amarket of equal numbers of informed and uninformedwould be themost inefficient, as in this case for everyinformed there is an uninformed to exploit. However, onemust also take into account that the inefficiency depends on themagnitudeof the profits made by the informed. This in turn depends on how rapidly the asset price changes. The more informed there are, themore buy–sell disequilibrium there is, and the faster the price rises. So one effect favours equal proportions and the other an allinformed market. The above graphs are a compromise between these two effects. In Fig. 7b we see that the lower the bias of theinformed the larger the proportion of informed at maximum inefficiency.
We now consider how inefficiency depends on the number of and distance between trader groups, in the present circumstancesmeasured by the difference in bias between the two groups. We consider a market of 50 liquidity traders and 50 informed traders oftype (50+x, 50−x), where x=0,1, 2, 3, 4 and 5. In other words, we are considering the case of relatively weak biases, which can beinterpreted as meaning that trader expectations are similar. In Fig. 8 we see a comparison of the inefficiency in these 6 markets as afunction of time. Note that using our efficiency criterion of IijN2 themarketswith x=1, 2 and 3 are indistinguishable from an efficientmarket over the timescale considered of 8000 ticks. For x=4 the market would not be considered inefficient until after about 4000ticks and the x=5 market until after 2000 ticks. The important point to emphasize here is that all these markets are theoreticallyinefficient in the sense that they are composed of inhomogeneous trader groups one having a more advantageous strategy than theother. This advantage is an intrinsic elementof themarket. However, aswehave remarked, observationally, inefficiency is an inferenceproblem. Here we see that thesemarkets are observationally indistinguishable from efficient markets over certain time scales due tothe fact that the informed strategies are not sufficiently superior to the uninformed strategy to lead to any observable inefficiency overthe relevant timescale. In Fig. 9we see a graph of inefficiency as a function of liquidity and the relativeheterogeneity of the strategies inthemarket.Weproxy liquidity by countinghowmanyoperations there are in a single auction. Themoreoperations there are themore
Fig. 8. Graph of the total inefficiency for six binary markets with small bias as a function of time.

Fig. 9. Graph of inefficiency as a function of liquidity and average distance between strategies.
679H.A. Benink et al. / Journal of Empirical Finance 17 (2010) 668–688
liquid themarket. This in its turn is related to the average bias of the strategies in themarket. If the average bias of the strategies is highthen the number of operations at a given auction will be small, as there will be very few sellers. As a measure of heterogeneity weconsider the average distance between the strategies in themarket, using the bias parameter d. Themore similar are the strategies theless the average distance between them. Thus, the average bias among the traders is related to the liquidity, while the variance isrelated to the degree of heterogeneity of the trading strategies.
The graph is an average over the results of ten experiments, where each experiment consisted of 100 traders divided into tengroups of ten, where their biases were selected at random from the interval d [0.5,1]. Notice that, for a given liquidity, theinefficiency increases as the average distance between strategies increases. This is because, for a fixed mean bias, higher varianceimplies the presence of more profit making opportunities. For instance, two ways of achieving an average bias of 20 with twoagents is to have an uninformed (50,50) agent with zero bias and another informed agent with bias 40 corresponding to a (90,10)agent, versus two agents with the same bias of 20, i.e., (70,30) agents. In the first case the informed can exploit the noise trader,whereas in the latter, as both agents are the same, one cannot systematically exploit the other. Secondly, note that for a fixedaverage distance between strategies, inefficiency increases as liquidity (average number of operations per tick) decreases. This isbecause less liquidity is associated with a higher average bias which in its turn means that the excess demand is higher, whichpromotes larger profits for the informed. The reasonwhy there is a flat region in the graph is because it is not possible to have botha high average bias and a high average distance between strategies at the same time.We can conclude then that there is nomarketinefficiency without having heterogenous trading strategies as a profitable trading strategy necessarily requires the presence of acorresponding unprofitable (and therefore different) strategy. However, we see that the degree of inefficiency depends ininteresting and subtle ways on the distinct measures of this heterogeneity.
4.3. Inefficiency and learning: A Neo-Austrian interpretation
4.3.1. The Neo-Austrian paradigmAt the beginning of this paper we discussed the Neo-Austrian interpretation of financial markets which implies that financial
markets are continuously evolving from one inefficiency to another, never attaining the perfect, efficient equilibrium, yet stronglyattracted towards it. Creative investors track and exploit profit opportunities generated by continuous shocks in a never-endingcycle. These alert participants in the market process, who are defined as “entrepreneurs” by the Neo-Austrians and as “informedtraders” and “copycats” in our AFM, try to get a–necessarily incomplete–picture of the nature of the disequilibrium in themarketplace, because disequilibrium generates profit opportunities. The actions of these entrepreneurs produce the very signalsthat are needed to reduce disequilibrium. What renders the market process a systematic process of coordination is thecircumstance that each gap in market coordination expresses itself as a pure profit opportunity. The profit-grasping actions ofsuccessful entrepreneurs dispel the ignorance which was responsible for the profit opportunities, and thus generate a tendencytowards coordination amongmarket decisions. However, due to continuous change in the constraints of the underlying economy,equilibrium is never reached.

Fig. 10. Histogram of excess profits for 35 (50,50), 60 (90,10) agents and 5 copycat agents after 101 ticks.
680 H.A. Benink et al. / Journal of Empirical Finance 17 (2010) 668–688
In the following sectionwewill study learning processes in an inefficient financial market from a Neo-Austrian point of view. Atthis point, we do not yet include changes in the constraints so that we can analyze learning processes that are uninterrupted.However, in Section 4.4 we will study learning processes that are interrupted by exogeneous information shocks.
4.3.2. Distribution of excess profits in the presence of learningIf we introduce learning via copycat agents then we may investigate how learning affects the existence and evolution of
inefficiencies. In Figs. 10–11we see the evolution of the excess profits associatedwith a group of 35 (50,50), 60 (90,10) agents and5 copycat agents. The initial strategy of the 5 copycats is (50,50), so they begin as liquidity traders. They observe the market for700 ticks then copy a strategy via roulette wheel selection. After 101 ticks, in Fig. 10, we already see a decoupling between the(90,10) agents and the rest. At this moment the copycats have not updated their expectations and hence make excess losses justthe same as the (50,50) traders. In Fig. 11 we see the situation after 801 ticks, seeing the 5 copycat traders begin to decouple fromthe group of liquidity traders. The alert copycats have detected the existence of traders with systematic excess profits and are nowcopying them, whereupon they begin to reduce their excess losses at the expense of the liquidity traders. Eventually, the copycatsbegin to make net excess profits rather than losses the profits being at the expense of the uninformed. The natural Neo-Austrianinterpretation here is that the informed are entrepreneurs that are exploiting a profit making opportunity. The copycats are otheralert entrepreneurs that respond to the signal of the original informed traders. This signal identification is prone to error due to theuncertainty associated with statistically inferring what is the optimal strategy to use, i.e. entrepreneurs can make mistakes. The
Fig. 11. Histogram of excess profits for 35 (50,50), 60 (90,10) agents and 5 copycat agents after 801 ticks.

Fig. 12. Relative inefficiency of biased agents of type (90,10), uninformed agents and copycats.
681H.A. Benink et al. / Journal of Empirical Finance 17 (2010) 668–688
alert copycat entrepreneurs through their profit seeking behaviour increase market coordination by increasing the number ofinformed traders. If the market consisted only of informed and copycats (who were initially uninformed) then, depending on thecompleteness of the learning process, in principle, complete market coordination could take place, though the resulting“equilibrium” does not necessarily have to be associated with an equilibrium price, i.e. the market does not necessarily have toclear.
4.3.3. Inefficiency in the presence of learningWe now consider in Figs. 12 and 13 the Inefficiency Matrix for informed agents with bias d, uninformed agents and copycats.
There are 3 matrix elements and therefore 3 curves. In these experiments learning events take place every 1600 ticks. We showfirst in Fig. 12 the results for d=0.9. From this graph we can see that the copycats after the first learning event also make excessprofits at the expense of the uninformed. We may ask why they do not earn as much as the informed given that they learn soquickly? The answer to this question is that they do, but the reason why the relative inefficiency between informed and copycatsdecreases after learning is that the variance associated with the excess profits of the copycats is much higher.
It is interesting to note the reason for this: learning is imperfect, hence after the learning event some copycats have determinedcorrectly the optimal strategy while others have not and remain uninformed. This result is consistent with the Neo-Austrian insight ofimperfect knowledgewhere entrepreneurs (“copycats”) try to get a “necessarily incomplete” picture of the nature of the disequilibrium
Fig. 13. Relative inefficiency of informed agents of type (55,45), uninformed and copycats.

Table 1Initial numbers of different trader types for different experiments.
Low–low Low–medium Low–high
Uninformed 150 70 30Informed 30 30 30Copycats 20 100 140
682 H.A. Benink et al. / Journal of Empirical Finance 17 (2010) 668–688
in the marketplace. Thus, within one group of traders we have a situation, such as seen in Figs. 10–11, where the distribution ismultimodal. The variance associated with such a distribution is obviously very large compared to a unimodal distribution and will keepincreasing until learning is sufficiently complete. Intuitively, the decrease in inefficiency is due to the fact that it is nowharder to infer if ornot the copycats have a strategywhich leads to excess profits, as at any given time somehave learned theoptimal strategy andothers not.
In Fig. 13 we see the same 3 matrix elements as in the previous figure but now for a much smaller bias, d=0.55. Notice nowthat the inefficiency of the informed relative to the copycats is less than that between the informed and uninformed after the firstlearning event, showing that some of the copycats have learned the optimal distribution. However, unlike the case with biasd=0.9 the curve does not drop suddenly. The reason for this is that: as the bias is so weak, even though some copycats learn theoptimal strategy they do not have that much more excess profit. Hence, the distribution associated with the copycats, althoughmultimodal, remains much more compact than in the case of a large bias. Hence, the variance is much smaller.
We may also investigate how the addition of copycats leads to more or less efficiency for the entire market. We have seen inFig. 7, in the case of different proportions of informed and uninformed agents, that increasing the number of informed agents canlead to a more or less efficient market depending on the net number of informed after the increase. With this in mind we considerthree different regimes involving copycat learning in markets with 200 agents. The proportions of informed, uninformed andcopycat traders in each regime are shown in Table 1. The proportions have been chosen so that for the “low–low” regime, even inthe presence of perfect learning the proportion of informedwould be to the left of themaximum in Fig. 7a. Similarly, once again forperfect learning, the “low–high” regime is such that the proportion of informed after learning is to the right of the maximum inFig. 7a. Finally, the regime “low–medium” is such that after perfect learning the proportion of informed corresponds to the regimeof maximum inefficiency in Fig. 7a. In Figs. 14 and 15 we see the total market inefficiency for these markets. For bias d=0.9 we seethe characteristic decrease in inefficiency after the first learning event seen in Fig. 12 due to the high variance of the associatedmultimodal distribution. This decrease is much less notable for the “low–low” market as the rate at which the two peaks of thedistribution separate is much smaller in this case. Note that, as expected, asymptotically at least, the “low–medium”market is themost inefficient, followed by the “low–high” with the “low–low” market being the most efficient.
4.3.4. Inference and copycatsIn this section we will further explore the difficulties that copycats face in trying to infer from the market which are the most
useful strategies to copy. However, before presenting the experiments with their results, we will discuss some aspects of the copycat'sadaptation process. As it has been mentioned previously, in order to adapt their strategies to the market's conditions, copycats must“play” a roulette formed from, say, the profits of each strategy in the market (Eq. 3). It is useful to recognize the stochastic effects of thisgame, in particular those produced by the composition of themarket. We can illustrate this by thinking of a market where the copycats
Fig. 14. Total market inefficiency in experiments where the proportion of informed agents changes due to copycat learning. Bias of informed agents is 75.

Fig. 15. Total market inefficiency in experiments where the proportion of informed agents changes due to copycat learning. Bias of informed agents is 90.
683H.A. Benink et al. / Journal of Empirical Finance 17 (2010) 668–688
copy via roulette wheel selection the most popular strategy. In this case the probability to copy a strategy i is
wherestrate
Table 2Percent
Inform
Exp
Low–
Low–
Low–
PiðtÞ = siðtÞ= ∑m
j=1sjðtÞ; ð8Þ
si is the number of agents with strategy i. One question we can answer is the expected number of copycats that will adopt
wherestrategy i at time t. Let C be the number of copycat agents, I the initial number of agents with strategy i and N the total number ofagents (i.e. N=∑ j=1m sj(t)). When t=1 (the first adaptation) it follows that
Xið1Þ = CPið1Þ = IC =N; ð9Þ
Xi(t) is the average number of copycats that adopt strategy i at time t. Now, when t=2, the number of agents withgy i is I+Xi(1), and in general, after K learning events, one has
XiðKÞ = CPiðK−1Þ = IC =N + IC2=N2 + … + ICn
=Nn = I ∑K
j=1Cj
=Nj ð10Þ
Therefore
XiðKÞK→∞ = IC = ðN−CÞ: ð11Þ
is the expected maximum number of copycats that will copy the most popular strategy and reflects the fact that there is
whichincomplete learning even after an infinite amount of time. Empirical curves give asymptotic values that are in good agreementwith those of Eq. (11), especially for weak biases. More generally, it gives a lower bound for the number of correct copycats.Returning to the problem of learning: The objective of a copycat is to acquire the optimal strategy (i.e. the strategy thatmaximizes profits constrained to existing market conditions); conversely, the objective of the biased traders is to create an excessdemand. This excess demand thus drives the price via the price evolution Eq. (1) along with the profits of informed agents.Additionally, both the excess demand and the profits of the informed traders depend on the composition of the entire populationas well as on the distribution of biases. In this scenario, copycats try to copy informed traders to find the optimal strategy. Thisactivates the learning process. However, complete learning is by no means guaranteed in the sense that they do not necessarilyidentify the best strategy. The quality of the learning depends on the signal to noise ratio (i.e. the size of the different regions in the
age of copycats that have learned the optimal strategy after each learning event (“exp”).
ed bias=75 Informed bias=90
1 2 3 4 5 Exp 1 2 3 4 5
low 50 49 62 55 55 Low–low 50 50 55 80 75medium 40 70 82 84 85 Low–medium 59 83 83 90 93high 39 61 75 76 75 Low–high 44 74 78 77 78

Table 3Ratio of informed to uninformed after each learning event (“exp”).
Exp 1 2 3 4 5
Informed bias=75Low–low 40/160 40/160 42/158 41/159 41/159Low–medium 70/130 100/100 111/89 112/88 116/84Low–high 84/116 116/84 135/65 137/63 135/65
Informed bias=90Low–low 40/160 40/160 41/159 46/154 45/155Low–medium 89/111 113/87 114/88 121/79 123/77Low–high 92/108 134/66 140/60 137/63 138/62
684 H.A. Benink et al. / Journal of Empirical Finance 17 (2010) 668–688
roulette), which in its turn depends on the agent biases and the market composition. Note that learning might be incomplete evenin the case where there is only one other strategy to learn.
This can be amply illustrated by returning to the experiments associated with Table 1. Table 2 gives results for the quality oflearning by showing after each learning event (denoted by “exp”) the percentage of copycats that have correctly learned theoptimal (i.e. informed) strategy. Finally, Table 3 shows after each learning event the relative numbers of informed to uninformedtraders.
Table 2 clearly show that, for a given regime type, learning is more efficient the stronger the informed bias. For example, for“low–low” markets, after 5 learning events the percentage of informed copycats is 75% for bias d=0.9 and 55% for bias d=0.75.This is, of course, intuitively interpretable in that in the former there is a stronger information signal than in the latter. Interpretingthe results from the point of view of the different regimes, we see that for “low–low” markets, for a bias of 0.75, the number ofcopycats that learn the informed strategy is barely more than it would be had they picked randomly between the two strategies.This plainly shows the inference problems the copycats face — and this is in the case of a large bias and where 15% of the marketstarted off informed! Interestingly, the highest learning percentages are associated with the “low–medium” regime as in this casethe large number of copycats is such that even if the initial learning is random, 50% of the copycats will learn the optimal strategyand they in turn will provide a good information signal for the other copycats to follow in subsequent learning events. Notice thatboth the “low–medium” and “low–high” regimes lead to very large increases in the percentage of informed copycats after thesecond learning event due to the aforementioned effect of copycats who have chosen the optimal informed strategy, by chance orby learning, providing a further signal for other copycats to detect. However, in the case of “low–high”, the asymptotic percentageis smaller than for “low–medium”, due to the fact that the smaller number of uninformed means that the excess profits of theinformed are less, as there is less opportunity to exploit the uninformed.
As a further illustration of the incompleteness of learning consider Figs. 16 and 17, where we show the number of copycats thatlearn the correct strategy in three different experiments. In the first case (Experiment A), the market is composed of 20 traders ofeach of the following strategies: (50,50), (60,40), (70,30), (80,20), (90,10), 100 (99,01) agents, and 100 copycats. In ExperimentB the market is formed by 100 uninformed agents (i.e. with a (50,50) strategy), 100 (60,40) agents and 100 copycats. Finally,Experiment C was composed of 100 (50,50) agents, 100 (99,01) agents and 100 copycats. The roulette at time twas built using Ei
Fig. 16. Incompleteness of learning: number of copycats that learn the optimal strategy in experiments with different market compositions and daily learning.

Fig. 17. Incompleteness of learning: number of copycats that learn the optimal strategy in experiments with different market compositions and learning every50 days.
685H.A. Benink et al. / Journal of Empirical Finance 17 (2010) 668–688
(t, 0), that is, the profits calculated since the beginning of the experiment. We show two sets of results — one where the copycatsupdate their learning every day, and another where they update every 50 days.
In Experiment A, the optimal strategy is (99,01). However, the presence of other strategies with lesser yields confuses thecopycats in such a way that only about 70% of them present successful learning, i.e. that identify the optimal strategy, (the averagedue purely to the composition of the market is 50% in all cases; this can be derived through simple probabilistic arguments withthe use of the roulette). In Experiment B we can observe that the interaction of the (50,50) and (60,40) strategies generates only arelatively small signal, hence explaining why the number of copycats that learn the best strategy is only slightly bigger than theaverage that would arise purely due to the market's composition. Experiment C shows the imperfection of the learning process,even in amarket with a very large difference in biases, i.e. that due to the stochastic nature of the roulette wheel complete learningcannot take place. We see in general then that the efficiency of learning depends on the market biases and the diversity ofstrategies in the market, as well as the stochastic nature of the roulette wheel selection.
4.4. Efficiency and learning in the presence of exogeneous information shocks
An important element in both neoclassical and Neo-Austrian thinking is the arrival of new information. In the neoclassicalparadigm this new information is random and alters trader expectations accordingly. Here we model the arrival of newinformation via an information “shock” wherein the perceptions and expectations of some, or all, of the market participants arechanged. Specifically, we consider markets with uninformed traders, two types of informed trader with strategies (90,10) or(55,45) and copycats. In the following experiments the traders change their perception of the market after an information shock.The uninformed remain uninformed. However, the informed, due to the shock, change their perceptions by, after a shock, choosingrandomly with probability 1/2 one of the two informed strategies. Despite the shocks the optimal strategy throughout is to choosethe informed strategy with maximum bias. What changes are the perceptions of the informed as to what trading bias they shouldimplement. However, given that it is probability 1/2 for the informed to change bias themarket statistically remains homogeneousin that, on average, after any given shock, there are the same number of informed with bias (90,10) as with (55,45).
Taking this into account, after a shock, a copycat must re-learn the correct strategy under the new market conditions. Aninteresting problem is determining how much endogeneous information a copycat needs to learn the best strategy, given thedynamic conditions of the market. In the examples presented earlier on learning, each copycat used all the history of the traders'profits to make a decision, i.e. each agent had long-term memory. We may pose the question: Will the same information be asuseful in a system with changing perceptions? In Figs. 18 and 19 we show the results of two experiments that shed some light onthis question. In Experiment D the copycats try to copy a strategy using only the information generated by the market after eachshock. Thus, they have only “short-term” memory as they do not keep in their memory any information prior to the shock. Incontrast, Experiment E depicts the case in which copycats have long-term memory, preserving the entire information of themarket's history without distinguishing data obtained before and after shocks. In Figs. 18 and 19 are the results associated with100 uninformed, 100 (90,10), 100 (55,45) and 100 copycats.
We can see in this figure that the learning process where traders only use as their learning information set market informationfrom the last shock until the present moment is more efficient, as after each shock the number of copycats that have learnedcorrectly increases to the same value. In contrast, for copycats with long-termmemory the learning process deteriorates due to thefact that after a shock the copycats may keep copying those informed who were most successful before the shock, i.e. those with

Fig. 18. Learning in markets with exogeneous information shocks: copycats with long-term memory.
686 H.A. Benink et al. / Journal of Empirical Finance 17 (2010) 668–688
bias (90,10), but who after the shock are sub-optimal, with bias (55,45). The results in this section are connected to the kinds ofconstant gain learning used in macroeconomics (Sargent (1999)).
5. A Neo-Austrian analysis of the results
Although the results of our simulations stand on their own, independent of interpretational frameworks, as our chief goal wasto examine the Neo-Austrian paradigm using an AFM, and as all the relevant elements are now in place, it behooves us to re-examine what we have found in that light.
In the simulations we have bit by bit built up the key ingredients of Neo-Austrian theory. Of course, they are also key elementsin real markets. In Section 2.2, we see, in a simplified setting, all the key elements of the Neo-Austrian point of view in play. Themarket contains entrepreneurs (informed traders) who, in the absence of uncertainties associated with exogeneous information,are making excess returns by exploiting their uninformed counterparts. The resulting market is inefficient. The market alsocontains other entrepreneurs (copycats), alert to the existence of any possible profit making opportunity (inefficiency). The keyproblem for these entrepreneurs is to identify the right opportunity by being able to infer correctly the right strategy to copy, i.e. toavoid mistakes and identify the correct “signal”. This in turn depends on the “signal to noise ratio” characteristic of the inefficiencywhich, in its turn, depends, in this model, on the trader biases and the composition of the market, as well as the adaptationfrequency of the copycats, i.e. how frequently they revise their expectations. Copycat learning leads to more coordination between
Fig. 19. Learning in markets with exogeneous information shocks: copycats with short-term memory.

687H.A. Benink et al. / Journal of Empirical Finance 17 (2010) 668–688
copycat entrepreneurs and informed entrepreneurs. However, as we showed previously, in distinction to a strict Neo-Austrianinterpretation, this coordination may lead to a more inefficient market, depending on the relative proportions of uninformed,informed and copycats. In this sense our simulations, although generally in accord with the Neo-Austrian point of view, offers aricher interpretation of the learning process experienced by entrepreneurs. If all market participants, besides the informed, arepotential entrepreneurs then learning can lead inexorably towards “equilibrium”–meaning an efficient (in our simple model–homogeneous, in that all traders have the same (informed) expectations) market but not necessarily with an equilibrium price.How close this state can be approached depends on the quality and completeness of the learning process. Generically, completelearning will not be achieved.
So, alert entrepreneurs (informed) can exploit, or even create, inefficiencies (“disequilibrium”), which creates signals (profitmaking opportunities) that other entrepreneurs (copycats) identify and try to exploit, potentially leading to a situation of moremarket coordination and less disequilibrium. Arrival of new (unanticipated) information leads to a change in expectations and thischange has a degree of uncertainty associated with it. The relative success of different informed entrepreneurs can change due tochanged expectations even though the optimal strategy (the strategy with maximum bias available) does not. In this newenvironment other alert (copycat) entrepreneurs are faced with the task of identifying anew the optimal strategy to copy. Now,the potential to make mistakes depends crucially on the information set that the copycats use for their decision making. This is animportant new source of potential error.
In between information shocks the market is inefficient, as there is always a set of informed traders exploiting the uninformed.However, averaging over shocks the market becomes more and more efficient, as traders that were making excess profits duringone period can be making excess losses in another. Copycats who base their decisions on time periods that include shocks face theprospect of misidentifying the optimal strategy by copying the strategy of an informed trader who was optimal before the shockbut suboptimal afterwards. On the contrary, copycats who base their decisions on short timescales run the risk of not havingsufficient data to statistically identify with sufficient confidence the optimal strategy. The optimal dataset for a copycat to use isthat from the last information shock to the present time. If shocks arrive too frequently however, there is not enough time for acopycat entrepreneur to gather enough information to reliably infer what is the optimal strategy in that period or, even if a correctidentification is made, there is not enough time to exploit the information. Thus, tendencies towards efficiency can be quitecomplex, depending on many factors, even in our simple model.
6. Conclusions
The main goal of this paper was to study Neo-Austrian ideas about market efficiency and learning, usually expressed inqualitative language, in the formal setting of an agent-based AFMmarket— the NNCP. Unlike a real market, the luxury of an AFM isthat we can create an efficient or inefficient market and then vary the parameters of the market in order to study when, and underwhat conditions, it is possible to infer efficiency from observing the market.
To avoid the joint-hypothesis problem we used a purely empirical quantitative measure of efficiency, defining an inefficientmarket in terms of whether or not there exist traders making systematic, excess profits. To distinguish between trading gains andmarket gains excess was defined relative to a dynamic buy and hold benchmark. As excess profit is a stochastic variable it is mostnaturally measured in units of the standard deviation of the excess profits. In this way one can not only distinguish betweentraders profiting from an active trading strategy as opposed to those profiting purely from market gains, but one can alsodistinguish between those traders who have a “lucky” trading strategy versus an “intelligent” one. We used the concept of anInefficiency Matrix which summarizes the relative inefficiencies between the different trading strategies in the market.
Using the Inefficiency Matrix as the principle measure, we performed a series of simulations in the context of a transparentmodel where the traders used trading strategies taken from a one-parameter family associated with a trading “bias”, zero biascorresponding to noise or liquidity traders. Learning was introduced using the concept of a copycat trader who observes themarket, statistically estimates which is the most successful strategy and then copies it.
It is important to emphasize that all these elements have been used in previous studies, in Gordillo and Stephens (2001a,b,2003), without any reference to the Neo-Austrian paradigm. In other words, our model was not designed with the Neo-Austrianviewpoint in mind. Rather, our motivation was to use a previously designed model to see to what extent its results were mostnaturally interpreted in the Neo-Austrian as opposed to the neoclassical framework.
Two important observations gleaned from these simulations are: Firstly, that market inefficiency, as we have defined it,perforce requires the presence of heterogeneity, i.e. distinct trading strategies. Markets where all participants utilise the sametrading strategy are incapable of exhibiting inefficiencies. Secondly, that efficient learning in the context of the copycat paradigmrequires that the different trading strategies be readily distinguishable in terms of their relative performance, as, otherwise, agentscan easily make mistakes in the learning process as to what is the optimal strategy to follow. Allied to this is the fact that thelearning process itself can naturally lead to a greater convergence of trading strategies, as copycats switch to the more successfulones. This negative feedback process is, in fact, the market becoming more efficient.
The results of this paper are in general consistent with the Neo-Austrian interpretation of markets as opposed to the neoclassicalrational expectations point of view that considers financial markets to be in continuous equilibrium with informationally efficientprices. The results, in fact, lend substantial insight into and enrich many of the key elements of Neo-Austrian theory which, asmentioned, is a predominantly qualitative theory. For instance,we saw that the existenceof alert entrepreneurs (copycats) could evenlead to an increase in inefficiency rather thanadecrease, dependingon theproportion of informed touninformedagents in themarket.Interestingly, and contrary to other alternative theories explaining inefficientfinancialmarkets, in theNeo-Austrian view the failure of

688 H.A. Benink et al. / Journal of Empirical Finance 17 (2010) 668–688
markets to reach the informationally efficient equilibrium ought not to be attributed to costs of any nature (adjustment costs,information costs, trading costs, etc). This description fits very well the results of the simulations of Section 4.4, where “creativeinvestors” (informed traders and copycats) track and exploit profit opportunities generated by exogeneous information shocks.
With their emphasis on imperfect knowledge the Neo-Austrians put themselves at the heart of the famous debate on risk anduncertainty (see, e.g., Knight (1921)). Neoclassical financial economists believe that uncertainty can be reduced to “objective” risk,depending on knowledge of the objective probability distribution implied by the true model of the economy that economic agentsknow or are capable of learning. However, Neo-Austrians tend to emphasize that economic agents have to cope with imperfectknowledge and fundamental uncertainty. Just as post-Keynesian economists, they claim that neoclassical theory fails to specify howagents will be able to overcome fully this uncertainty, i.e. that it can be reduced to the “objective” probability distribution implyingrational expectations and efficientmarkets. Contrary to post-Keynesians, however, Neo-Austrians claim that alertmarket participantshave powerful incentives to learn about the true nature of uncertainty and related disequilibrium, because disequilibrium generatesprofit opportunities. Thus, the market process is viewed as a stabilizing process with a powerful tendency towards equilibrium andefficiency. With their trust in the market process Neo-Austrian economists are intellectually close to their neoclassical colleagues,although theyarrive at this result froma ratherdifferentperspective on theunderlyingeconomic reality.Webelieve that our results onlearning and inference for copycat entrepreneurs perfectly illustrate this point of view.
Due to their flexibility and adjustable complexity, we believe that AFMs are an ideal vehicle for addressing some of the deepestand most difficult questions about efficiency and rational expectations. Further, by using a purely empirical measure ofinefficiency, as we have done here, complications due to the joint-hypothesis problem can be avoided. We believe that combiningthe two gives a powerful framework within which other fruitful studies may be carried out.
Acknowledgments
The authors thank Peter Bossaerts, Blake LeBaron, Marco Pagano and Christian Rieck for helpful comments as well asparticipants at the EFA 2004 meeting and the CCFEA seminar at the University of Essex. HB acknowledges financial support fromERIM, Erasmus University Rotterdam. CRS, JLG and JPP acknowledge support from DGAPA grants IN100201 and IN120509. Theauthors wish to thank the Departamento de Supercomputo, DGSCA, UNAM for support on this project.
References
Arthur, W.B., Holland, J.H., LeBaron, B., Palmer, R., Tayler, P., 1997. Asset pricing under endogeneous expectation in an artificial stock market. In: Arthur, W.B.,Durlauf, S., Lane, D. (Eds.), The Economy as an Evolving Complex System II. Addison-Wesley, Reading MA, pp. 15–44.
Bagehot, W., 1971. The only game in town [pseud] Financial Analyst's Journal 27, 12–14.Balvers, R.J., Cosimano, T.F., McDonald, B., 1990. Predicting stock returns in an efficient market. Journal of Finance 45, 1109–1128.Benink, H.A., Bossaerts, P., 2001. An exploration of Neo-Austrian theory applied to financial markets. Journal of Finance 56, 1011–1027.Benink, H.A., J.L. Gordillo, J.P. Pardo and C.R. Stephens, “A Study of Neo-Austrian Economics Using an Artificial Stock Market” (March 2004). EFA 2004 Maastricht
Meetings Paper No. 3218. Available at SSRN: http://ssrn.com/abstract=567125.Chen, S., Yeh, C., 2002. On the emergent properties of artificial stock markets: the efficient market hypothesis and the rational expectations hypothesis. Journal of
Economic Behavior and Organization 49, 217–239.Fama, E.F., 1970. Efficient capital markets: a review of theory and empirical work. Journal of Finance 25, 383–417.Fama, E.F., 1991. Efficient capital markets: II. Journal of Finance 46, 1575–1617.Farmer, J.D. (1998), Market Force, Ecology and Evolution, Santa Fe Working Paper 98-12-117E, Santa Fe Institute.Farmer, J.D., Lo, A., 1999. Frontiers of science: evolution and efficient markets. Proceedings of the National Academy of Sciences 96, 9991–9992.Gordillo, J.L., Stephens, C.R., 2001a. Analysis of financial markets with the artificial agent-based model— NNCP. Proceedings of ENC01. INEGI, Mexico, pp. 251–263.Gordillo, J.L., Stephens, C.R., 2001b. Adaptation and learning in an artificial stock market. Proceedings of GECCO2001 Late Breaking Papers, San Francisco, USA.Gordillo, J.L., Stephens, C.R., 2003. Analysis of financial markets using artificial intelligence techniques. Computación y Sistemas 6, 253–273.Hayek, F.A., 1937. Economics and knowledge. Economica 4, 33–54.Hayek, F.A., 1945. The use of knowledge in society. American Economic Review 35, 519–530.Hayek, F.A., 1948. The meaning of competition. In: Hayek, F.A. (Ed.), Individualism and Economic Order. The University of Chicago Press, Chicago.Hayek, F.A., 1978. Competition as a discovery procedure. In: Hayek, F.A. (Ed.), New Studies in Philosophy, Politics, Economics and the History of Ideas. Routledge &
Kegan Paul, London/Henley.Kirzner, I.M., 1992. The Meaning of Market Process: Essays in the Development of Modern Austrian Economics. Routledge, London and New York.Kirzner, I.M., 1997. Entrepreneurial discovery and the competitive market process—an Austrian approach. Journal of Economic Literature 35, 60–85.Knight, F.K., 1921. Risk, Uncertainty and Profit. University of Chicago Press, Chicago.LeBaron, B., 1999. Building Financial Markets with Artificial Agents: Desired Goals and Present Techniques, Computational Markets. MIT Press.LeBaron, B., 2000. Agent-based computational finance: suggested readings and early research. Journal of Economic Dynamics and Control 24, 679–702.LeBaron, B., 2001. Evolution and time horizons in an agent-based stock market. Macroeconomic Dynamics 5, 225–254.LeBaron, B., 2006. Agent-based computational finance. In: Tesfatsion, L., Judd, K.L. (Eds.), Handbook of Computational Economics, 2. Chapter 24.Littlechild, S.C., 1982. Equilibrium and the market process. In: Kirzner, I.M. (Ed.), Method, Process, and Austrian Economics (Essays in Honor of Ludwig vonMises).
Lexington Books, Lexington/Toronto.Lo, A., MacKinlay, C., 1999. A Random Walk down Wall Street. Princeton University Press, Princeton NJ.O'Hara, M., 1997. Market Microstructure Theory. Blackwell Publishers Inc, Malden MA.Palmer, R.G., Arthur, W.B., Holland, J.H., Lebaron, B., Tayler, P., 1994. Artificial economic life: a simple model of a stock market. Physica, D 73.Pesaran, M.H., 1989. The Limits to Rational Expectations. Basil Blackwell, Oxford.Pesaran, M.H. (2006), Market Efficiency Today, Working Paper No. 2006/01, Center for Financial Studies, Johann Wolfgang Goethe University, Frankfurt/Main.Pesaran, M.H., Timmermann, A., 1995. Predictability of stock returns: robustness and economic significance. Journal of Finance 50, 1201–1228.Rizzo, M.J., 1990. Hayek's four tendencies toward equilibrium. Cultural Dynamics 3, 12–31.Sargent, T., 1999. The Conquest of American Inflation. Princeton University Press, Princeton, NJ.Stephens, Christopher R., Benink, H.A., Gordillo, Jose Luis and Pardo-Guerra, Juan Pablo, “A New Measure of Market Inefficiency” (August 24, 2007). Available at
SSRN: http://ssrn.com/abstract=1009669.