Market Concentration and Farm-Retail Price Asymmetry in the U.S. Fluid Milk Market Brian W. Gould...
37
Market Concentration and Market Concentration and Farm-Retail Price Asymmetry Farm-Retail Price Asymmetry in the U.S. Fluid Milk Market in the U.S. Fluid Milk Market Brian W. Gould Joseph Schoen Kyle Stiegert Send comments to [email protected] Applied Economics Workshop Applied Economics Workshop October 19, 2005 October 19, 2005
-
Upload
helen-clarke -
Category
Documents
-
view
213 -
download
0
Transcript of Market Concentration and Farm-Retail Price Asymmetry in the U.S. Fluid Milk Market Brian W. Gould...

Market Concentration and Market Concentration and Farm-Retail Price Asymmetry Farm-Retail Price Asymmetry in the U.S. Fluid Milk Marketin the U.S. Fluid Milk Market
Brian W. GouldJoseph SchoenKyle Stiegert
Send comments to [email protected]
Applied Economics WorkshopApplied Economics WorkshopOctober 19, 2005October 19, 2005
OverviewOverview
IntroductionIntroduction US Fluid Milk Prices: Farm and RetailUS Fluid Milk Prices: Farm and Retail Overview of Food Retailer ConcentrationOverview of Food Retailer Concentration Previous Evidence of Milk Price AsymmetryPrevious Evidence of Milk Price Asymmetry
Overview of the Econometric Model of Price Overview of the Econometric Model of Price TransmissionTransmission
Use of Non-Reversible FunctionsUse of Non-Reversible Functions Panel Data with AR errorsPanel Data with AR errors
Overview of Market Level DataOverview of Market Level Data Preliminary Results (“Farm” Price Change)Preliminary Results (“Farm” Price Change) Conclusions/Next Steps Conclusions/Next Steps

Why has the pricing of fluid milk become a major Why has the pricing of fluid milk become a major concern to the point that a Government Accountability concern to the point that a Government Accountability Office (2004) inquiry was undertaken in 2004?Office (2004) inquiry was undertaken in 2004?
Asymmetric Price Transmission

Average U.S. Announced Coop Class I Price Month-to-Month Percent Change: Jan. 1980-Sept. 2005
-40
-30
-20
-10
0
10
20
30
40
% C
hang
e
Announced Coop Price is the price cooperatives charge processors for fluid milk. It is set on a monthly basis and can be considered a major cost factor determining the retail cost of fluid milk.
Decade Avg* S.D. Min Max 1980's 0.90 1.45 -4.55 5.16 1990's 3.31 5.19 -27.53 13.09 2000's 4.27 7.15 -18.20 34.00*Average of absolute percent changes
"Trend" is expected to continue
Fluid milk price volatility has dramatically increased in Fluid milk price volatility has dramatically increased in recent historyrecent history

Comparison of Whole Milk Price Indexand Announced U.S. Coop Class I Prices
1.00
1.13
1.25
1.38
1.50
1.63
1.75
1.88
2.00
2.13
2.25
Jan-80
Jan-82
Jan-84
Jan-86
Jan-88
Jan-90
Jan-92
Jan-94
Jan-96
Jan-98
Jan-00
Jan-02
Jan-04
Coop Price
85
100
115
130
145
160
175
190
205Price Index
Coop Price ($/Gal)
Retail Whole Price Index (82-84=100)

Average Monthly Ratio of Retail Whole MilkPrices and Announced Coop Class I Price
140
150
160
170
180
190
200
210
220
230
240
Jan-80
Jan-82
Jan-84
Jan-86
Jan-88
Jan-90
Jan-92
Jan-94
Jan-96
Jan-98
Jan-00
Jan-02
Jan-04
Ratio*100
Years Avg. Std.Dev.81-85 147.8 5.286-90 163.0 8.091-95 188.6 8.396-00 193.4 14.301-05 201.8 16.0
ln(Ratio) = 4.634 + 0.113 ln(Trend) (0.022) (0.005)
Adj. R2 = 0.669
Retail-farm price spread continues its upward trendRetail-farm price spread continues its upward trend
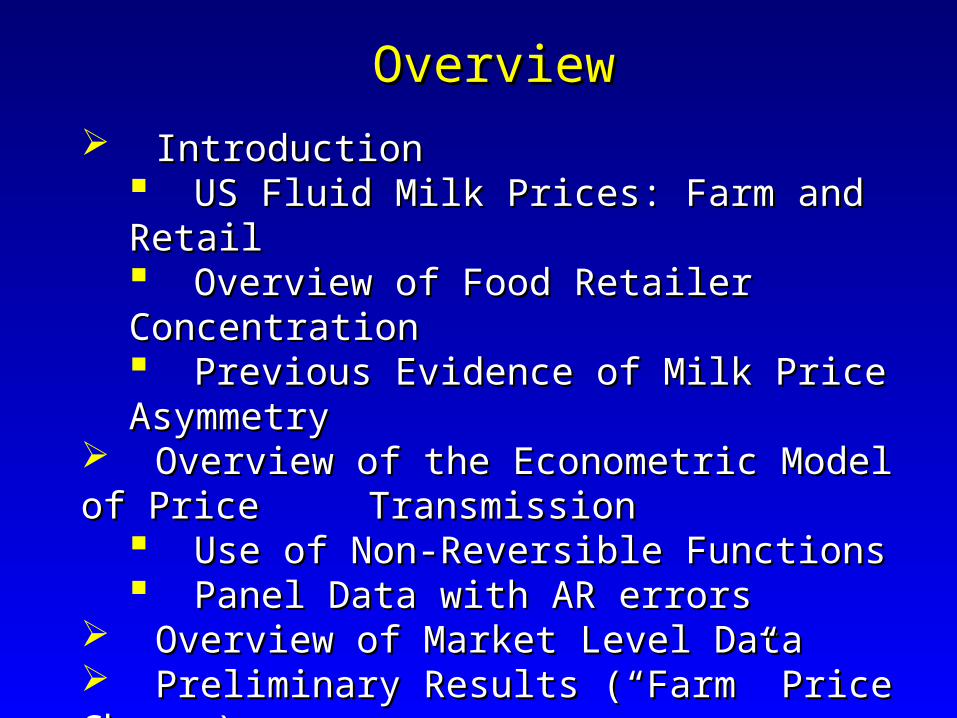
Asymmetric Price Transmission Increased food retailing concentration over the last 3 Increased food retailing concentration over the last 3
decadesdecades A measure of concentration: Herfindahl-Hirschman Index
(HHI)
where si is the value of sales by the ith firm and S is the total value of market sales in a particular market U.S. Dept. of Justice Guidelines wrt HHI:
1000-1800: “Moderately Concentrated” >1800: “Concentrated” Mergers adding ≥ 100 to HHI in “concentrated”
markets “raise antitrust concerns”
2
1
100N
i
i
sHHI
S

1000
1200
1400
1600
1800
2000
2200
2400
2600
1997 1998 1999 2000 2001 2002 2003 2004
HHI
ATL CHI DAL SAL SEA TAM DOJ
Retail Grocery Sector HHI Retail Grocery Sector HHI Values: Selected CitiesValues: Selected Cities

Evidence of asymmetric cost pass-through for fluid Evidence of asymmetric cost pass-through for fluid milk retailers milk retailers
Kinnucan and Forker (1987)Kinnucan and Forker (1987): Annual U.S. : Annual U.S. Aggregate Data for Major Dairy ProductsAggregate Data for Major Dairy Products Hansen et. al. (1994)Hansen et. al. (1994): Annual U.S. Aggregate Fluid : Annual U.S. Aggregate Fluid
Milk DataMilk Data Romain et. al. (2002)Romain et. al. (2002): Aggregate Monthly New : Aggregate Monthly New York State Fluid Milk DataYork State Fluid Milk Data GAO (2004)GAO (2004):: Meta analysis of fluid milk pricingMeta analysis of fluid milk pricing
Estimates of price transmission of farm price Estimates of price transmission of farm price increases were greater than for decreasesincreases were greater than for decreases
Capps and Sherwell (2005)Capps and Sherwell (2005): Monthly Sales Data : Monthly Sales Data for 2% and Whole Milk, 7 US Citiesfor 2% and Whole Milk, 7 US Cities
AsymmetricAsymmetric Price Transmission Price Transmission

Why should we be concerned with the characteristic of Why should we be concerned with the characteristic of the price transmission process for fluid milk?the price transmission process for fluid milk?
Relationship between farm and retail prices Relationship between farm and retail prices provide insights into marketing efficiencyprovide insights into marketing efficiency
Asymmetric price transmission may indicate possible Asymmetric price transmission may indicate possible market failure or abuse of market powermarket failure or abuse of market powerHigher market power can increase asymmetry (Carman Higher market power can increase asymmetry (Carman and Sexton, 2005; Sexton, Xia and Carman, 2004)and Sexton, 2005; Sexton, Xia and Carman, 2004)
Implications as to consumer and producer welfareImplications as to consumer and producer welfare Higher than “normal” retail pricesHigher than “normal” retail prices Cotteril(2003): $1.00 more due to market power in NECotteril(2003): $1.00 more due to market power in NE
Continued trend of variability of farm milk pricesContinued trend of variability of farm milk prices Continuation of concentration in food retailingContinuation of concentration in food retailing
Asymmetric Price TransmissionAsymmetric Price Transmission

Asymmetric Price Transmission w/Asymmetric Price Transmission w/Monopoly and Concave DemandMonopoly and Concave Demand
MC”
MCP’
P”P
MC’
DMR
P
Q
MC″-MC = MC-MC′ but P″ – P > P – P′→ Cost increases are passed on to retail prices more completely than cost decreases
Under oligopoly, firms price between MR and D
More competitive → less asymmetric

Research QuestionsResearch Questions
Is there evidence of asymmetric farm-retail price Is there evidence of asymmetric farm-retail price transmission in the US fluid milk sector?transmission in the US fluid milk sector?
What is the role of imperfect competition?What is the role of imperfect competition? To what extent does spatial as opposed to To what extent does spatial as opposed to market market concentration explain asymmetric price concentration explain asymmetric price transmission (Azzam, 1999)?transmission (Azzam, 1999)?
Does the magnitude of asymmetry vary with market Does the magnitude of asymmetry vary with market and spatial concentration and spatial concentration across citiesacross cities??
What is the role of price variability in the degree of What is the role of price variability in the degree of asymmetry?asymmetry?
Implications of increased farm price variabilityImplications of increased farm price variability

Econometric ModelEconometric Model
Based on the model originally developed by Based on the model originally developed by Wolframm(1971) and extended by Houck (1977)Wolframm(1971) and extended by Houck (1977)
Approach has been used extensively in analyses of Approach has been used extensively in analyses of agricultural commodity price transmissionagricultural commodity price transmission
PorkPork: Boyd and Brorsen (1988): Boyd and Brorsen (1988) Fed CattleFed Cattle: Bailey and Brorsen (1989): Bailey and Brorsen (1989) PeanutsPeanuts: Zhang, Fletcher and Carley (1995): Zhang, Fletcher and Carley (1995) WheatWheat: Mohanty, Peterson and Kruse (1995): Mohanty, Peterson and Kruse (1995) ApplesApples: Willett, Hansmire and Bernard (1997) : Willett, Hansmire and Bernard (1997) Rice, Beans, TomatoesRice, Beans, Tomatoes: Aguiar and Santana : Aguiar and Santana
(2002)(2002)

Econometric ModelEconometric Model
Houck (1977) approaches used in the analysis of Houck (1977) approaches used in the analysis of fluid milk price asymmetryfluid milk price asymmetry
Kinucan and Forker (1987) Kinucan and Forker (1987) Romain, Doyon and Frigon (2002)Romain, Doyon and Frigon (2002)Capps and Sherwell (2005)Capps and Sherwell (2005)Carman and Sexton (2005)Carman and Sexton (2005)

Econometric ModelEconometric Model
We improve upon previous researchWe improve upon previous researchMore current data encompassing periods of More current data encompassing periods of dramatic farm (Coop Class I) price increases and dramatic farm (Coop Class I) price increases and decreasesdecreases
April 2003: $13.74April 2003: $13.74June 2004: $25.16June 2004: $25.16
Incorporate explicit measures of concentration as Incorporate explicit measures of concentration as explanatory variablesexplanatory variables
CR2, CR4 (% of total retail sales accounted for CR2, CR4 (% of total retail sales accounted for 2 and 4 largest firms, respectively)2 and 4 largest firms, respectively)Herfindahl-Hirschman Index (HHI)Herfindahl-Hirschman Index (HHI)Spatial Concentration (Supermarkets/1,000 pop.)Spatial Concentration (Supermarkets/1,000 pop.)
83.1% 83.1% ↑↑

Econometric ModelEconometric Model
We improve upon previous researchWe improve upon previous researchIncorporate a variety of definitions of our dependent Incorporate a variety of definitions of our dependent
variable to examine asymmetry to examine variable to examine asymmetry to examine robustness of our conclusionsrobustness of our conclusions
Change in retail price (reported here)Change in retail price (reported here)Change in farm-retail marginChange in farm-retail marginPercent change in farm-retail marginPercent change in farm-retail margin
Given our use of city/retail firm data can examine Given our use of city/retail firm data can examine differences across city and/or firmsdifferences across city and/or firms
Incorporate alternative methods for accounting for Incorporate alternative methods for accounting for panel nature of our dataset (Fixed Effects used panel nature of our dataset (Fixed Effects used here)here)

Econometric ModelEconometric Model
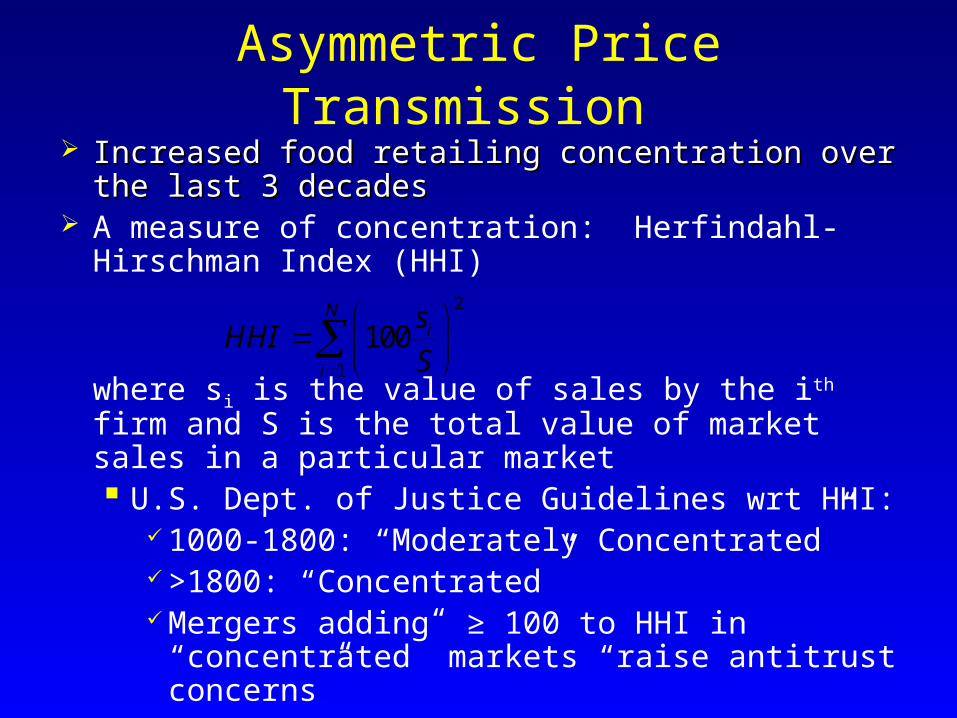
Basic Houck modelBasic Houck model RPt ≡ retail price in the tth period WPt ≡ wholesale price in the tth period (COOP price) ΔWPIt ≡ change in wholesale price if there is an increase from t-1 to t ΔWPDt ≡ change in wholesale price if there is a decrease from t-1 to t WPIt ≡ sum of period to period increases in wholesale price WPDt ≡ sum of period to period decreases in wholesale price Trend ≡ trend variable
Econometric ModelEconometric Model
Basic Houck modelBasic Houck model
Nonreversibility (asymmetry) occurs if β1 ≠ β2
The value of RP at any point t is:
Substituting this into the basic model
t t-1RP RP -RP = β + β WP + β WPt 0 1 Ij 2 Dj
WP WP -WP if WP >WP ,0 otherwiseIi i i-1 i i-1WP WP -WP if WP <WP ,0 otherwiseDi i i-1 i i-1
0 01 1
t t
t j t jj j
RP RP RP RP RP RP
t 0
t tRP RP -RP = β t+ β WP + β WP + εt0 0 1 Ij 2 Dj t
j=1 j=1

Econometric ModelEconometric Model
Basic Houck modelBasic Houck modelt t
RP = β t + β WP + β WP + εt0 0 1 Ij 2 Dj tj=1 j=1
= β t+ β WP + β WP + ε0 1 It 2 Dt t
> 0 < 0
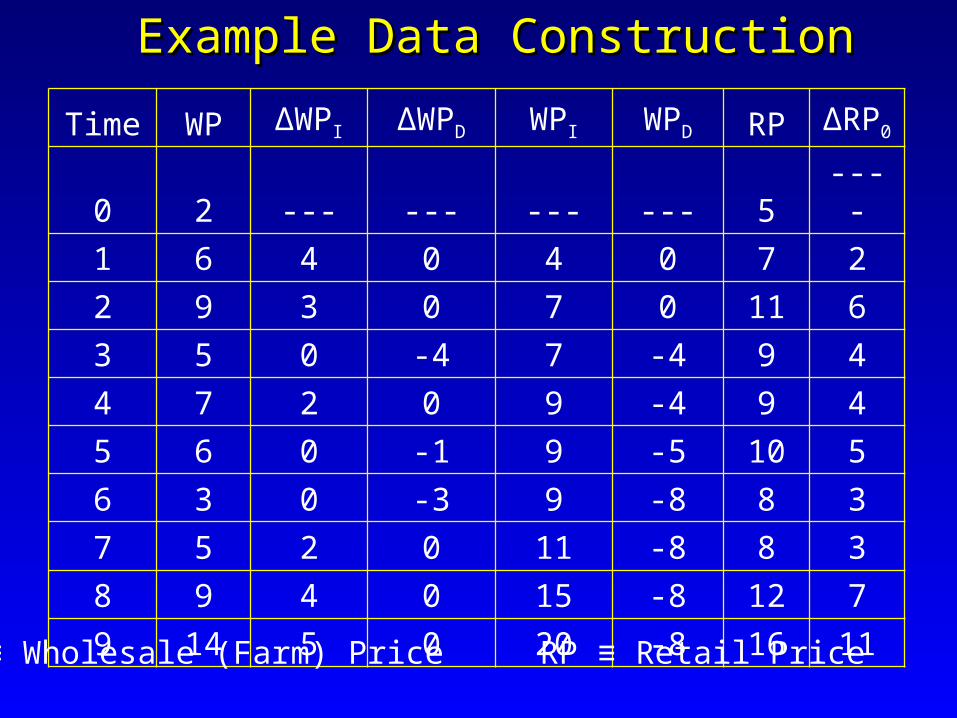
Example Data ConstructionExample Data Construction
Time WP ∆WPI ∆WPD WPI WPD RP ΔRP0
0 2 --- --- --- --- 5 ----
1 6 4 0 4 0 7 2
2 9 3 0 7 0 11 6
3 5 0 -4 7 -4 9 4
4 7 2 0 9 -4 9 4
5 6 0 -1 9 -5 10 5
6 3 0 -3 9 -8 8 3
7 5 2 0 11 -8 8 3
8 9 4 0 15 -8 12 7
9 14 5 0 20 -8 16 11
WP ≡ Wholesale (Farm) Price RP ≡ Retail Price

Econometric ModelEconometric Model
Our empirical modelOur empirical modelAnalysis of Analysis of Private Label Whole MilkPrivate Label Whole Milk eliminates eliminates
Brand effect differences across firm/cityBrand effect differences across firm/city Milk quality effects (fat content) across firm/cityMilk quality effects (fat content) across firm/city
Test for asymmetry wrt both farm price and Test for asymmetry wrt both farm price and marketing cost changes (only farm price discussed)marketing cost changes (only farm price discussed) Incorporate Almon lag structure for marketing cost Incorporate Almon lag structure for marketing cost
and coop price variables (displayed and coop price variables (displayed ββ’s derived ’s derived from estimated Almon lag coefficients)from estimated Almon lag coefficients)
AR(1) error structure (city/firm-specific AR(1) error structure (city/firm-specific ρρ’s)’s) Test for long-run and short-run asymmetryTest for long-run and short-run asymmetry

Econometric ModelEconometric Model
Our empirical modelOur empirical model
t t ≡ time period, j ≡ city/firm, T ≡ total no. of months, J ≡ total no. ≡ time period, j ≡ city/firm, T ≡ total no. of months, J ≡ total no. city/firms, N & P refer to pos/neg changes, MC ≡ marketing cost city/firms, N & P refer to pos/neg changes, MC ≡ marketing cost index, COOP index, COOP ≡ cooperative Class I price, MONTH ≡ monthly ≡ cooperative Class I price, MONTH ≡ monthly DV’s variables, CITY_FIRM ≡ city/firm DV’s, NE_COMP ≡ DV’s variables, CITY_FIRM ≡ city/firm DV’s, NE_COMP ≡ Northeast Dairy Compact DV, Q ≡ volume of milk sales by firmNortheast Dairy Compact DV, Q ≡ volume of milk sales by firm
1 2 1P N P1 2i t-i,j 3i t-i,j 4i t-i,j
2 N5i t-i,j 6 tj 7 tj 8 tj
i itj itj
m m nRP =β Trend + β MC + β MC + β COOPt0j tj
i=0 i=0 i=0n
+ β COOP + β Q β HHI + β NE_COMPi=020 J
+ β Month + β City_Firm + (t = 1......T, j = 1......J)20+i tji=9 i=1
Number of Lags

Hypothesis TestsHypothesis Tests
Long-run farm price transmission asymmetry (H.1)
Short-run farm price transmission asymmetry requires at least one of the following to occur (H.2)
Incomplete transmission of farm price changes (H.3)
Speed of Adjustment joint test (H.4)
1 24 5
0 00
n n
i ii i
1 14 5
0 01 (increase) and/or 1 (decrease)
n n
i ii i
4 5 1 20 0
0 for z= 0,1,..., max n ,n -1z z
i ii i
4 5 1 20 for i = (0,1,...,max[n ,n ])i i
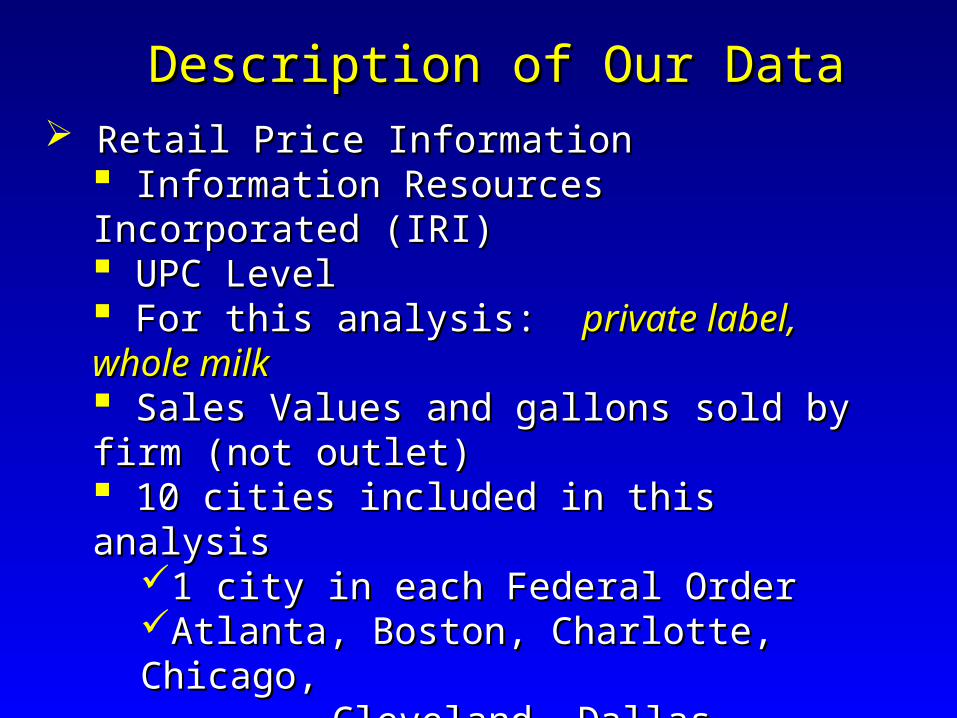
Description of Our DataDescription of Our Data Retail Price InformationRetail Price Information
Information Resources Incorporated (IRI)Information Resources Incorporated (IRI) UPC LevelUPC Level For this analysis: For this analysis: private label, whole milkprivate label, whole milk Sales Values and gallons sold by firm (not outlet) Sales Values and gallons sold by firm (not outlet) 10 cities included in this analysis10 cities included in this analysis
1 city in each Federal Order1 city in each Federal OrderAtlanta, Boston, Charlotte, Chicago, Atlanta, Boston, Charlotte, Chicago,
Cleveland, Dallas, Kansas City, Cleveland, Dallas, Kansas City, Phoenix,Phoenix,
Salt Lake City, Seattle, TampaSalt Lake City, Seattle, Tampa Monthly (weekly): March 1997-Dec. 2004 (94 Monthly (weekly): March 1997-Dec. 2004 (94 months)months) Data for “Key Players” (firms) in each cityData for “Key Players” (firms) in each city
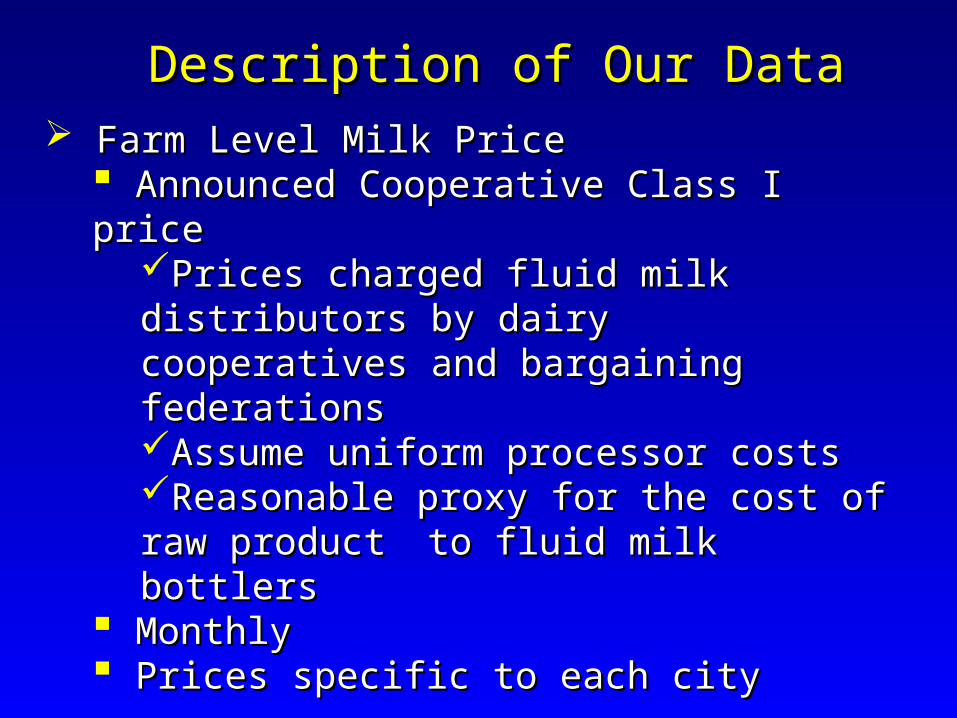
Description of Our DataDescription of Our Data Farm Level Milk PriceFarm Level Milk Price
Announced Cooperative Class I price Announced Cooperative Class I price Prices charged fluid milk distributors by dairy Prices charged fluid milk distributors by dairy
cooperatives and bargaining cooperatives and bargaining federations federations Assume uniform processor costsAssume uniform processor costsReasonable proxy for the cost of raw product Reasonable proxy for the cost of raw product
to fluid milk bottlersto fluid milk bottlers MonthlyMonthly Prices specific to each cityPrices specific to each city

Description of Our DataDescription of Our Data Marketing Cost IndexMarketing Cost Index
Based on Romain, Doyon and Frigon (2002)Based on Romain, Doyon and Frigon (2002) 54% Processing54% Processing
26% processing labor26% processing labor 24% packaging costs24% packaging costs 4% energy4% energy
36% Retail36% Retail 31% retail labor31% retail labor 5% energy5% energy
10% Transportation10% Transportation BLS data used for all componentsBLS data used for all components Aggregated using Tornquist-Theil Index with budget Aggregated using Tornquist-Theil Index with budget
shares assigned as aboveshares assigned as above

Description of Our DataDescription of Our Data Market Concentration MeasuresMarket Concentration Measures
Obtained from bi-annual Obtained from bi-annual Market ScopeMarket Scope publicationpublication Complete census of value of sales in major Complete census of value of sales in major markets across the U.S. for all firms markets across the U.S. for all firms Markets defined to match IRI dataMarkets defined to match IRI data Values are interpolated between publication Values are interpolated between publication periodsperiods

Description of Our DataDescription of Our Data Food retailers in each city included in our analysisFood retailers in each city included in our analysis
City Retailers Mean HHI
Atlanta 3 1934
Boston 4 1620
Charlotte 4 1879
Chicago 2 1972
Dallas 5 1352
Kansas City 1 1255
Phoenix 3 1754
Salt Lake City 2 1432
Seattle 2 1554
Tampa Bay 5 2320
Above DOJLimit

Preliminary Econometric Model ResultsPreliminary Econometric Model Results
The above assumed a one-way fixed effects modelThe above assumed a one-way fixed effects model Tested using F-test proposed by Baltiga (1995)
H0: Pooled Data
F-Stat of 71.8 → reject H0 → Fixed Effects
Lag length for MC and COOP determined using AIC criterion
→ All lags for MC removed → Two lag periods for COOP price change
2 2FE pooled
2FE
(R -R )/(J-1)F(J-1,JT-J-K)=
(1-R )/(JT-J-K)

Preliminary Econometric Model ResultsPreliminary Econometric Model Results
Summary of AR(1) Results: 31 Summary of AR(1) Results: 31 ρρ values valuesEstimated via Cochrane-Orcutt procedure
0
1
2
3
4
5
6
7
8
9
10
0.2<ρ≤0.3 0.3<ρ≤0.4 0.4<ρ≤0.5 0.5<ρ≤0.6 0.6<ρ≤0.7 0.7<ρ≤0.8
All ρ’s significantly different from 0

Preliminary Econometric Model ResultsPreliminary Econometric Model Results
Summary of Results: Fixed Effect Coefficients Summary of Results: Fixed Effect Coefficients (City/Firms)(City/Firms)
City Retail Firm NumberAtlanta 11 13 22
Boston 3 16 18 19
Charlotte 2 5 7 22
Chicago 4 9
Dallas 1 11 12 14 20
Kansas City 8
Phoenix 1 6 16
Salt Lake 1 17
Seattle 1 16
Tampa Bay 1 10 13 21 22
Indicatesstat. sign.
15 outof 31

Preliminary Econometric Model ResultsPreliminary Econometric Model Results
Summary of Results: Misc. CoefficientsSummary of Results: Misc. Coefficients
Variable Coefficient S.E.
Q -0.00992* 0.00079
HHI 0.11827* 0.04230
NE_COMP -0.01531 0.03360
*significant at least the 0.05 level

Preliminary Econometric Model ResultsPreliminary Econometric Model Results
Summary of Results: Cumulative Change Variables, Summary of Results: Cumulative Change Variables, MC and COOPMC and COOP
Variable Coeff. S.D. Variable Coeff. S.D.
MC0P -0.00187 0.00218 MC0
N -0.00501* 0.00213
COOP0P 0.73112* 0.04670 COOP0
N -0.20482* 0.03995
COOP1P 0.04981 0.05853 COOP1
N -0.26976* 0.04099
COOP2P -0.02904 0.05236 COOP2
N -0.17158* 0.03587
*significant at least at the 0.05 level

Preliminary Econometric Model ResultsPreliminary Econometric Model Results
Summary of Results: Hypothesis TestsSummary of Results: Hypothesis Tests
Null Hypothesis Value S.D.
Long-run farm price transmission symmetry 0.1057* 0.0317
Short run price transmission symmetry after current month
0.5263* 0.0640
Short run price transmission symmetry with additional month
0.3063* 0.0686
**significant at the 0.001 level
1 10 04 5H2: 0i ii i
40 50H2: 0
2 20 04 5H1 0i ii i

Preliminary Econometric Model ResultsPreliminary Econometric Model Results
Summary of Results: Hypothesis TestsSummary of Results: Hypothesis Tests
Price Transmission Characteristic Value S.D.
Positive change in coop price completely transmitted
-0.2481* 0.0394
Negative change in coop price completely transmitted
0.3538* 0.0379
Price Transmission Elasticity (Postive, εP) 0.3820* 0.0200
Price Transmission Elasticity (Negative, εN) 0.3283* 0.0192
εP- εP 0.0537* 0.0161
**significant at the 0.001 level
2 20 04 4H3: 1 1 0i ii i
2 20 05 5H3: 1 1 0i ii i

Next StepsNext Steps Extend method by which market concentration Extend method by which market concentration incorporated into the modelincorporated into the model
Change functional form to allow market Change functional form to allow market concentration measures to impact hypothesis concentration measures to impact hypothesis tests wrt price asymmetrytests wrt price asymmetry
Current model does not allow for thisCurrent model does not allow for this Modify HHI to account for population differences Modify HHI to account for population differences
across cityacross cityMore fully explore the time series aspects of the dataMore fully explore the time series aspects of the data
Co-integration-type model (Error Correction Co-integration-type model (Error Correction Model, Capps and Sherwell, 2005)Model, Capps and Sherwell, 2005)

The End!The End!