Market and Pro-Forma Analysis - Granicus
132
Market and Pro-Forma Analysis Bay Area Economics
Transcript of Market and Pro-Forma Analysis - Granicus

Market and Pro-Forma Analysis
Bay Area Economics

Northeast Corridor Market and Pro-Forma Analysis
Submitted to: City of Sacramento
Submitted by: Bay Area Economics
March 2007

Table of Contents Executive Summary ....................................................................................................................... iii Section I – Market Analysis ............................................................................................................ 1 Introduction ..................................................................................................................................... 2 Neighborhood Context .................................................................................................................... 7 Demographic and Employment Trends......................................................................................... 15 Existing Real Estate Conditions .................................................................................................... 28 Neighborhood Retail Sales Leakage/Injection .............................................................................. 47 Projected Increase in Land Use Demand....................................................................................... 51 Market Study Conclusions ............................................................................................................ 56 Section II – Pro-Forma Analysis ................................................................................................... 64 Comparable Projects in Sacramento.............................................................................................. 65 Pro-Forma Analysis of Mixed Use Projects .................................................................................. 72 Results ........................................................................................................................................... 85 Conclusions ................................................................................................................................... 88 Funding Opportunities................................................................................................................. 106 Pro-Forma Analysis Conclusions ................................................................................................ 108 Appendix A: North Sacramento Census Block Groups ............................................................. 110 Appendix B: Existing Zoning, Globe Station............................................................................. 111 Appendix C: Existing Zoning, Arden/Del Paso Station ............................................................. 112 Appendix D: Existing Zoning, Royal Oaks Station ................................................................... 113
i

List of Figures and Tables Figure 1: Northeast Corridor Study Area ....................................................................................... 5 Figure 2: North Sacramento Study Geography .............................................................................. 6 Figure 3: Existing Zoning, Northeast Corridor Study Area ......................................................... 14 Table 1: Population and Household Trends ................................................................................. 19 Table 2: Age Distribution, 2005................................................................................................... 20 Table 3: Household Income Distribution, 2005 ........................................................................... 21 Table 4: Household Size and Tenure, 2000.................................................................................. 22 Table 5: Housing Stock Characteristics, 2005.............................................................................. 23 Table 6: Population and Household Projections, 2005 to 2025.................................................... 24 Table 7: Employment Trends and Projections ............................................................................. 27 Table 8: Northeast Corridor Area Commercial Real Estate Conditions (February 2006)............ 31 Table 9: Northeast Corridor Study Area Property Sales, July 2005 – July 2006 ......................... 37 Table 10: Multifamily Project Summary for Northwest Sacramento, 2005 to Present ................ 38 Table 11: Multifamily Residential Rental Market Conditions, Study Area, February 2006........ 39 Figure 4: Opportunity Sites, Globe Station Area ......................................................................... 41 Figure 5: Opportunity Sites, Arden/Del Paso Station Area.......................................................... 42 Figure 6: Opportunity Sites, Royal Oaks Station Area ................................................................ 43 Table 12: Current Development Applications, Study Area.......................................................... 46 Table 13: Study Area Retail Leakage Analysis, 2005.................................................................. 50 Table 14: Study Area Projected Increase in Neighborhood-Serving Retail Demand, 2005-2025 54 Table 15: Study Area Projected Increase in Land Use Demand, 2005-2025 ............................... 55 Table 16: Summary of Station Area Development Opportunities................................................ 63 Figure 7: Sites for Catalytic TOD Prototypes ............................................................................... 78 Figure 8: Plan drawing of catalytic site in the Globe Station vicinity.......................................... 79 Figure 9: Section drawing of the prototype project in the Globe Station vicinity........................ 80 Figure 10: Plan drawing of catalytic site in the Arden-Del Paso Station vicinity ........................ 81 Figure 11: Section drawing of the prototype project in the Arden-Del Paso Station vicinity. ..... 82 Figure 12: Plan drawing of catalytic site in the Royal Oaks Station vicinity............................... 83 Figure 13: Section drawing of the prototype project in the Royal Oaks Station vicinity............. 84 Table 17: Summary of Development Prototypes and Pro Formas ............................................... 89 Table 18a: Globe Station Development Prototype and Pro Forma .............................................. 90 Table 18b: Estimated Development Cost, Globe Station Site....................................................... 91 Table 18c: Estimated Operating Income, Globe Station Site ........................................................ 92 Table 18d: Estimated Sale Proceeds, Globe Station Site .............................................................. 93 Table 18e: Development Assumptions, Globe Station Site .......................................................... 94 Table 19a: Arden-Del Paso Station Development Prototype and Pro Forma ............................... 95 Table 19b: Estimated Development Cost, Arden-Del Paso Station Site ....................................... 96 Table 19c: Estimated Operating Income, Arden-Del Paso Station Site ........................................ 97 Table 19d: Estimated Land Residual Value, Arden-Del Paso Station Site ................................... 98 Table 19e: Development Assumptions, Arden-Del Paso Station Site........................................... 99 Table 20a: Royal Oaks Station Development Prototype and Pro Forma .................................... 100 Table 20b: Estimated Development Cost, Royal Oaks Station Site............................................ 101 Table 20c: Estimated Sale Proceeds, Royal Oaks Station Site.................................................... 102 Table 20d: Development Assumptions, Royal Oaks Station Site ............................................... 103 Table 21: Development Impact Fees ........................................................................................... 104 Table 22: Cost Inputs for Pro-Formas ......................................................................................... 105
ii

Executive Summary
iii

This report analyzes the feasibility of transit-oriented development (TOD) in the area surrounding Sacramento Regional Transit’s (Sacramento RT) Globe, Arden/Del Paso, and Royal Oaks light rail stations. The report has two sections – Section I is a market study which evaluates the demand for residential, retail, office and TOD in the area through 2025. Section II is a pro-forma analysis of three mixed-use, prototype projects which represent the kind of project that the City might want to encourage to revitalize this area. Section I – Market Analysis The analysis defined the “Northeast Corridor Study Area” based on the outline of five U.S. Census Block Groups, and used this geography to obtain demographic and economic data. The Study Area is bounded by rail lines to the east and west, State Route 160 to the south, and El Camino Avenue to the north. The Study Area is further sub-divided into three station areas, around the Globe, Arden/Del Paso and Royal Oaks light rail stations, and each station area has a slightly different character. Despite a significant increase in ridership, overall station usage remains relatively low at all three light rail stations. Any increase in ridership at the three stations along the Northeast Corridor will not act by itself as a catalyst for TOD in the station areas. The experience with retail development around stations in other transit systems has shown that transit patrons alone are not sufficient in number to support any significant amount of retail. Rather, intensified land uses in the vicinity of the station geared towards capitalizing on access to light rail will generate increased transit usage and also provide a market for retail. Neighborhood Context The Northeast Corridor Study Area is characterized by a wide array of land uses, including light industrial centers, residential neighborhoods, commercial corridors and a great deal of under-utilized land. The majority of the Study Area is part of the North Sacramento Redevelopment Project Area formed in 1992.
1 That same year, the Artist Live Work Ordinance passed, making it
legal for artists to live and work in commercial spaces,2 and arts-related development continues to
occur in the Study Area. New Faze Development has acquired at least six Del Paso Boulevard properties within the Study Area and relocated its own office space to Del Paso Boulevard from a suburban location. The company is planning at least two mixed-use projects in the area. Much of the retail located within the Study Area consists of local-serving “mom and pop” stores, while national chains seek locations across Business 80 in the Arden Fair area. However, the commercial corridors in the Study Area have been undergoing modest but steady transformation. Formation of a Property-Based Business Improvement District (PBID) along Del Paso Boulevard
1 SHRA North Sacramento Five-Year Implementation Plan
2 www.surrealestates.org and www.sacforart.com
iv

should support further revitalization. Redevelopment and New Development SHRA has recently completed eleven live/work artist units in the Dixieanne Neighborhood, and also partnered with the Sacramento Mutual Housing Association (SMHA) on the construction of the 21-unit Victory Townhomes development and the rehabilitation of the 56 apartments at Evergreen Estates. SHRA established several housing stock improvement programs within the North Sacramento Redevelopment Area, such as the Single Family Rehabilitation Loan and Retrofit Grant Program, the Multifamily Rehabilitation Loan Program and the Boarded and Vacant Program. SHRA also provides loans and grants for commercial rehabilitation projects. The highly utilized exterior rebate program provides grants for façade improvements to businesses. SHRA dedicated over $5 million towards the Del Paso Boulevard Streetscape Master Plan, which provides street improvements to enhance walkability and attract consumers to shops along the commercial strip between Arden Way and El Camino Avenue. The project is scheduled to complete by mid-2007. New projects approved for the Study Area include a site for a Starbucks and an additional retail store at the intersection of Rio Linda Boulevard and El Camino Avenue, and 6,000 square feet of commercial space at 100 Arden Way. Another proposed project at 965 El Camino is a Petrovich Development Company venture that has been discussed as a potential ground lease to a fast food establishment, though this plan has been met with considerable opposition. In addition, there are several commercial rehabilitation proposals that focus on office and professional spaces. Existing Land Use Conditions The Study Area consists of residential, commercial and light-industrial land uses, with a significant number of vacant and under-utilized parcels. Retail and office uses, are located along the commercial corridors of Del Paso Boulevard, El Camino Avenue to the west of Del Paso Boulevard, and interspersed along the northern half of Arden Way. These commercial areas have many vacant and under-utilized sites, particularly along Del Paso Boulevard south of Arden Way. The northern half of the Study Area, located north of Arden Way, consists of residential lots that are generally small and interspersed with commercial uses. There are more multifamily developments in this portion of the Study Area, and the houses and apartment complexes are generally older, with some in need of rehabilitation. Two currently proposed Signature Properties residential projects, consisting of 80 single-family detached homes, will improve the diversity of the housing stock available in this portion of the Study Area. There are a few parks located within this area. Dixieanne Park contains a lighted baseball field, but is currently fenced off. Signature Properties has offered to assist in re-planning the park including a playground, a skateboard park, a picnic area and a green area.
3 A “tot lot” at Dixieanne Avenue and Beaumont
Street provides a playground facility for young children. Redwood Park also could offer park
3 McCarthy, Mike. “Transit Village Planned for Swanston Neighborhood.” Sacramento Business Journal.
August 11, 2006.
v

facilities and a lighted baseball field to residents in the northwest corner of the Study Area. However, this park is also fenced off. The southeast corner of the Study Area contains a large office park. Large, well-maintained homes on single-family lots characterize the Woodlake Neighborhood in the south. Multifamily residences in this portion of the Study Area are concentrated close to Del Paso Boulevard, near the mobile home park bordered by Del Paso Boulevard and State Route 160. Woodlake Park, just south of the Arden/Del Paso Station, covers more than seven acres of grounds and includes the Sacramento Police and Sheriff Memorial. Industrial and commercial uses are dispersed west of Del Paso Boulevard. Large swaths of vacant or under-utilized industrial land are in the southwest portion of the Study Area. Demographic and Employment Trends The study compares demographic and employment conditions in the Study Area with those in surrounding areas, specifically North Sacramento and Sacramento County. Regional Trends in Urban Living. Researchers have found that households attracted to urban infill housing products tend be young singles, childless couples, empty nesters and the elderly. Like many areas in California, the Sacramento Region will continue to have disproportionate growth in smaller non-family households and family households without children. SACOG projects that the Region’s average household size will decrease between 2005 and 2020. SACOG also anticipates that persons 65 years and older will grow from 11 percent of the Region’s population in 2000 to 20 percent in 2030.
4 As these demographic patterns shift, demand for
compact urban housing types will increase, especially housing near workplaces offering amenities and character.
Local Demographic Trends. Although the Study Area is largely built out, its population grew more rapidly than the County overall between 2000 and 2005. Within the Study Area, there are proportionately fewer family households, smaller household sizes, greater proportions of seniors 65 years of age and older and smaller proportions of children. These demographic characteristics all suggest solid demand for multifamily housing. Median household incomes in the area are relatively low, as is the percentage of households owning their own homes. This trend may change, as households priced out of other more expensive areas of Sacramento seek opportunities to buy homes that are more affordable. Workforce housing for singles and couples, seniors and other small households who are attracted to a close-in location within the Sacramento area but priced out of areas such as Midtown and Downtown is likely to be a strong market niche for the Study Area. For those households with members who work in the Downtown area, the light rail stations will provide a convenient and inexpensive commute option. Employment Trends. Like the population projections, the employment projections for the Study Area reflect the fact that the Study Area does not have large amounts of properly zoned and
4 Projections of Employment, Population, Households, and Household Incomes in the SACOG Region for
2000 – 2005, Center for Continuing Study of the California Economy, DB Consulting, SACOG, September 2005.
vi

readily developable land to accommodate increases in employment. Although SACOG expects significant employment growth in the Manufacturing sector for North Sacramento, Manufacturing development would not likely contribute to making the Study Area more attractive for transit-oriented development. Existing Real Estate Conditions Most retail stores in the Study Area cater primarily to the everyday shopping needs of the local community, while more specialized national retailers choose sites on the east side of Business 80 in the Arden Fair Mall area. The tenants targeted to fill the available spaces for rent include salons, restaurants and local-serving retail stores. High traffic counts along Del Paso Boulevard are an asset for businesses, nevertheless there are many vacant storefronts. Local developers are planning a variety of office and mixed-use projects along Del Paso Boulevard in the near future. There are not many office buildings in the area available for lease, and brokers claim that office tenants are easy to find. As new office construction increases along Del Paso Boulevard, the competitive conditions may change. Still, many office users in the area have been priced out of Downtown Sacramento’s Class A office space and were in search of more affordable markets near Downtown. Between July 2005 and July 2006, there were 46 single-family home transactions within the Study Area, excluding sales in the Woodlake Neighborhood. Generally, the homes in this area are older, in fair to poor condition, with smaller living areas and fairly large lots. The median sales price was $268,500 for homes with a median of two bedrooms, 1,082 square feet of living space, and a 6,534 square foot lot. The SurrealEstates units, subsidized with sweat-equity, sold between $120,210 and $225,000 for artist live/work units with three bedrooms plus a detached studio. The market-value of these units is estimated at around $300,000. Condominium and townhome sales prices in the surrounding area - Natomas, Carmichael, Sacramento and Fair Oaks - ranged from $146,900 to $419,990 per unit, or $167 to $343 per square foot of living area. The market for condominiums and townhomes has slowed since the first quarter of 2006, but smaller for-sale units persist as a key development opportunity within the Study Area because they offer market-rate ownership housing at an achievable price. A small unit selling at $150,000 can be purchased by a household earning approximately $45,000 per year. For comparison, the 2006 median household income in the City of Sacramento is $43,480.
5
(In the Study Area, however, it is $28,137, which would qualify for a mortgage of just $89,000.) While condominium conversions offer the lowest cost housing, it should be noted that a barrier to conversions in the Study Area and its surroundings is the City of Sacramento’s condominium conversion ordinance of 1980, which has precluded any conversions to date. There are three large apartment complexes within the Study Area: the new Victory Townhomes and refurbished Evergreen Estates, and also Woodlake Close, near Woodlake Elementary. All three of the complexes are in excellent condition. However, the remaining multifamily units in the Study Area are limited to small apartment complexes in poor condition.
5 Claritas, October 2006.
vii

Potential Development Sites Throughout the Study Area there are vacant land parcels, lots for sale, and under-utilized lots that present development opportunities. However, many of the vacant sites along the commercial strips of Del Paso Boulevard, Arden Way, and El Camino Avenue do not show any signs of development. Globe Station. There are several vacant, under-utilized, and for-sale parcels along Del Paso Boulevard within the Globe Station area. As many of these parcels are adjacent to one another, this area may present an opportunity for parcel assemblage that could enable a large-sized project to be developed along a major commercial corridor. Arden/Del Paso. Parking lots and a car dealership along Arden Way represent highly under-utilized land close to the Arden/Del Paso light rail station. The vacant and under-utilized parcels along this section of Del Paso Boulevard are more dispersed and, as a result, are more conducive to smaller infill development efforts. Royal Oaks. The greatest opportunity site near the Royal Oaks Station is the vacant 3.5 acre office site on the southeast corner of Royal Oaks Drive and Arden Way. While other smaller parcels across Arden Way are vacant or under-utilized, this site could leverage the nearby Lumberjack project and increase the number of employees and potential transit riders to the area without necessarily requiring a significant amount of new construction. Planned and Proposed Projects In general, the planned and proposed projects submitted to the City for review are smaller infill projects that will have limited impact on the overall supply of available commercial or residential space. Larger-scale projects are in the early planning process but only a few projects have been formally submitted to the City. While there seem to be a number of commercial and mixed-use projects in discussion, not many formal project proposals or plans have been submitted for approval. One of the projects is planned on the Sacramento RT-owned Lumberjack site near Royal Oaks Station. A team comprised of New Faze Development and Fulcrum properties has preliminary plans for 107 residential units over retail at this location. Another New Faze project proposed at 2001 Del Paso Boulevard consists of approximately 4,250 square feet of retail space, 13,300 square feet of office space, and 27 condominium units. In addition to these two sites, there are plans for development throughout the Study Area. Except for the Lumberjack site, most of the developer interest is centered around Del Paso Boulevard. Two commercial developments within the Study Area are currently in the planning review process. One project will be located along El Camino Avenue at Erickson Street, in the northeast section of the Study Area. This retail site was discussed as a potential ground lease to a fast food establishment. The second Study Area project is the proposed three-storey office and retail building at 503 Arden Way, planned by Friedlander of LIMN. This site is already pre-leasing, as noted in Table 8. Another development site currently seeking a tenant is on Arden Way, just to the west of Del Paso Boulevard. Currently, there are limited details available for anticipated
viii

tenants at this 6,000 square foot retail project at 100 Arden Way. A fourth project that is under construction just to the northwest of the Study Area, at the intersection of Rio Linda Boulevard and El Camino Avenue, is a 4,425-square-foot commercial building with a drive-through Starbucks and space for an additional retail store. The drive-though indicates limited attention to its proximity to transit stations. There are three single-family residential units proposed which – while they are small - they do represent market-driven housing projects without subsidy. Signature Properties is also in the process of applying to build 80 market rate, two-storey, detached, three and four bedroom, single-family homes within the Study Area. These housing units will reportedly be priced in the mid-$200,000 range. A fourth project is in the very early stages of planning, but City sources suggest that this development could involve construction of a three to four-storey multifamily structure in the vicinity of the Globe station. This represents a significant shift considering the limited private investment in the Study Area. The lower price-point of the planned Signature Properties residential development, compared to areas such as Midtown and Downtown, indicates that this area of Sacramento may be well positioned to provide opportunities for home ownership to the City’s workforce population, especially those working in or near Downtown, for whom light rail access would be convenient. Neighborhood Retail Sales Leakage/Injection The Study Area should provide sufficient retail supply to satisfy the demand for convenience retail goods, to ensure that these items are located within an easy distance of most market area residents. Eating and drinking places and food and beverage stores make up the bulk of convenience retail. Certain health and personal care stores can also fall into the convenience retail category. If the estimated consumer expenditures are greater than the actual retail sales for a given retail sector, then there is a leakage in that sector. In other words, retail dollars that could be captured locally are spent outside of the area because they are not sufficiently available within the Study Area. The Study Area demonstrates retail leakage for eating and drinking places, food and beverage stores, and health and personal care stores totaling $4.2 million. Conversely, the data suggest that people living outside the Study Area are coming into the Study Area to purchase products in the motor vehicles and parts category, in which supply exceeds Study Area demand by over $48 million. In order to encourage development that would generate foot traffic within the Study Area and enhance the attractiveness of the area for residential uses in particular, the City should focus on drawing additional convenience and pedestrian-friendly, neighborhood-serving businesses to the area. The data suggest that the area is currently lacking eating and drinking places, food and beverage stores and health and personal care stores. In addition, the retail leakage analysis shows that a portion of local demand for conventional grocery store goods is currently lost to outlets outside the area. While the nearby Costco makes the attraction of another large supermarket within the Study Area a challenge, the large number of rooftops in the 1.5-mile radius combined with the grocery store retail leakage data for the Study Area indicates a potential for a grocery store within the Study Area, if it can be located to have good access and visibility to residents of the larger 1.5-mile area, ideally along either Del Paso Boulevard, Arden Way, or El Camino
ix

Avenue. Projected Increase in Land Use Demand The analysis presents two estimates of anticipated increases in demand for retail, office and housing within the Study Area through 2025. The low estimate is based on current SACOG projections for the Study Area. This low estimate is extremely conservative as it does not take into consideration recent development trends. The high estimate is based on the current SACOG estimated growth rates for Sacramento County as a whole through 2025, and applies those growth rates to the 2005 Study Area estimate. The high estimate suggests that with the removal of barriers to development within the Study Area, the station areas can grow in a manner that parallels the rest of the County. For an area such as the Study Area, which must overcome existing barriers to development and must rely on substantial redevelopment in order to accommodate growth, achieving a growth rate that mirrors the overall County growth rate would be a significant accomplishment. However, with development efforts focused on transit stations throughout the RT system, it is important to highlight that land use demand across the City and region is finite and if one station captures more than its “fair share” of development, it may come at the expense of development in another station area. The conservative estimate of housing demand is 65 units through 2025, and the more generous estimate - assuming that the Study Area will grow at the same rates as the County of Sacramento – is 520 units through 2025. Already, the 214 units planned and proposed by Signature Properties and New Faze Development exceed the low estimate, highlighting the rapidly changing development environment within this area. Based on the focus being brought to this area by the City, Bay Area Economics believes that the actual demand is likely to be close to the high end of the projections. Achieving the high-end projection will depend on successfully redeveloping under-utilized sites for housing, supported by comprehensive efforts to make the neighborhood more attractive through public improvements, attracting new retail, and addressing concerns for public safety. A previous BAE report
6 analyzed the market around the adjacent Swanston Station, using a Study
Area very similar to the one defined for this study. For the combined Swanston and Northeast Corridor Study Areas, the residential demand growth is estimated at 68 units conservatively, or 536 units at the high end.
7
Based on SACOG office employment projections, the low and high numbers for office space demand over the next two decades are 28,000 and 146,000 square feet, respectively. Due to nearby areas with more competitive sites, such as the large vacancy on the USAA office campus to the east, the Study Area will probably experience more modest growth in office demand, with most of the demand being for small professional office spaces. It is likely that actual demand will be closer to the lower end of the potential demand range given above.
6 “Draft Swanston Study Area Market Analysis”, Bay Area Economics, February 2006.
7 Combining the Study Areas adds very few units, since they overlap quite substantially. In addition, the
eastern section of the Swanston Study Area - which is not part of the Northeast Line Study Area - is primarily commercial, and adds very little to the residential demand.
x

The projected increase in retail demand focuses on the neighborhood-serving retail. Overall, the projected increase in demand for neighborhood-serving retail space that the Study Area residents will be able to support through 2025 ranges between 17,000 and 30,000 square feet. These projections do not include additional retail demand from office workers in the area, which may support a small addition of 1,900 square feet of retail space. Should the area successfully evolve into a destination with a vibrant mix of retail, office, and housing development along with the over-riding arts district theme, it may become attractive for additional destination retail and destination restaurants which would capitalize on demand from outside the study area and allow additional expansion. The combined demand for retail land-uses in the Northeast Study Area and the adjacent Swanston Study Area previously discussed is not much greater than the demand for the Northeast area alone, due to the overlaps of the two study areas. The exception to this is the office sector, where a significant amount of additional office development is projected for the portion of the Swanston area that is not also in the Northeast Study Area. Market Analysis Conclusions The market study shows that small for-sale residential units present the best near-term, transit-oriented development opportunity, with short-term development focused on the Globe Station area. Increasing the number of residents within the Study Area will also contribute to the area’s potential for attracting retailers and restaurants. While the short-term outlook for new construction of commercial space and multifamily rental properties is constrained by infrastructure and market barriers, the presence of under-utilized and vacant land, especially along Del Paso Boulevard, does offer the long-term possibility to stimulate increased development activities through public investment. By including for-sale residential units as part of a mixed-use development, pedestrian activity and transit use will contribute to the area’s vitality and potentially help attract local-serving retail and restaurants. Over time, establishing more of an identity for the different station areas through new residential development and revitalized neighborhood commercial activity will attract professional office users and specialty retail and restaurants that attract demand from people living outside the Study Area. As a result, new developments should consider including flexible space on the ground floor that can accommodate both retail and office users, allowing the project to evolve along with the market. Due to the availability of parcels near Globe Station, in addition to planned projects to the north and south of this area, the first efforts should concentrate on revitalizing this area. Revitalization of the Globe Station area could stimulate an interest in subsequent projects at the Arden/Del Paso Station, although consideration must be given to the large road and intersection which are not currently friendly to pedestrian use. Short-term investment at the Royal Oaks station should focus on improving pedestrian friendliness for residents of the existing neighborhoods, and the situation re-evaluated after the project at the Lumberjack site is completed.
xi

Section II - Pro-Forma Analysis The pro-forma analysis evaluated the feasibility of developing mixed-use, transit-oriented development projects in the vicinity of the Northeast Corridor light rail stations in the City of Sacramento. The purpose of this analysis is to provide planners and policy-makers with an assessment of the likely financial feasibility of constructing similar new development projects within the Northeast Corridor under current economic conditions. The catalytic prototypes and the accompanying financial calculations are meant to be illustrative of what could occur in these areas and provide a gauge of how much public investment may be needed in order to encourage desired types of new development in the Northeast Corridor. Comparable Projects in Midtown Sacramento The analysis began with a study of comparable projects in Midtown Sacramento, where several three- to five-storey mixed-use and high density projects have been built in the last five years. The projects evaluated were the Fremont Building at 16th and P, 1801 L Street, the St. Anton Building at 21st and L, Carson Development’s building at 19th and O, the Fremont Mews at 14th and P, and the building which was moved to 17th and N. The study collected data on the characteristics of these projects, such as the site size, number of residential units, amount of commercial space and type of construction used. It also collected information on the costs of development and any public investment received, the lease rates of the units, and how quickly they have been filled. The financial information collected for these projects informed the numbers used in the pro-forma analysis for Northeast Corridor project prototypes. Of all the projects studied, the St. Anton Building is probably the one most similar to what might be built along the Northeast light rail line. It is on a relatively small site – just over a half-acre – and is primarily residential (65 units) with 3,000 square feet of retail space on the ground floor. Pro-forma Analysis The pro-forma analysis evaluated the financial feasibility of prototype mixed-use, transit-oriented projects in the vicinity of the Northeast light rail stations. For each prototype, the pro-forma is divided into three sections: first a calculation of development costs, then a calculation of operating income and/or sale revenue, and finally the evaluation of whether the project is profitable, based on a target return for a rental project, or profit for a for-sale project. The pro-formas used a “land residual” format, which calculates the development costs and returns of a project, then determines the residual amount of money available for land purchase. The City requested that the study also estimate the costs of land acquisition, demolition and off-site improvements. These estimates were provided for each site. The cost numbers used in the pro-forma were obtained from interviews with the developers of the Sacramento projects described above, and also other local developers, including SHRA. Lease and sale rates were based on the numbers obtained in the market analysis (Section I, above). Target returns and profits were also obtained from developers or from bankers. Numbers for off-site improvements were obtained from Nolte Associates.
xii

Sites and Prototypes According to the recommendations from the Market Analysis section of the study, the analysis defined three different prototype catalytic projects, one near each of the three stations. The project near the Globe station is on a half-acre site, and includes retail on the ground floor with residential units above and townhouses along the alley. The townhouses each have a garage, and the flats have either podium or surface parking. The residential density is 57 units per acre. All of the residential and commercial units are assumed to be for-sale, since the kind of local, residential developer most likely to take this project on is accustomed to a for-sale model. The site near the Arden-Del Paso station is a half-block north of the station along Del Paso Boulevard, since no appropriate vacant or underutilized sites were available close to the station along Arden Way. It is a half-acre site, and the prototype project has two storeys of office over one storey of retail, with surface parking behind the building. The analysis assumes that the developer of this project would be an owner-investor and offer the completed space for lease. The site near the Royal Oaks station is almost an acre, and the prototype is designed to be entirely residential, with 36 units and a density of 41 units per acre. 28 of the nits are townhouses, and of those, six facing the street are live-work. There are also has eight flats over podium parking. The analysis assumed that all the units were for-sale. Results The pro-formas assumed that all projects were market rate, since the purpose of the undertaking is economic development rather than affordable housing. In addition, they calculated only the costs associated with on-site development; any off-site requirements would add cost. The pro-forma for the prototype near the Globe station showed development costs, not including land, of $7.8 million, or $246 per square foot of building. The sale proceeds for the retail and residential portions totaled $6.3 million, and the project resulted in a net loss of $1.5 million. In addition, the costs of purchasing land, demolition and off-site improvements for this site were roughly estimated at $0.5 million. For the prototype near the Arden-Del Paso station, development costs, not including land, totaled $4.3 million, or $180 per square foot. The costs of this project were lower than those for the other two projects, since they did not include developer profit at sale. The actual return on investment (ROI) generated by the operation of the project at market rents was 8.9 percent. At the target ROI of 14 percent, the project had a $1.5 million gap between the actual development cost and the target development cost. In addition, the costs of purchasing land, demolition and off-site improvements for this site were roughly estimated at $0.6 million. For the prototype near the Royal Oaks station, development costs, not including land, totaled $8.6 million, or $220 per square foot. The sale proceeds totaled $8.0 million, and the project resulted in a net loss of $0.6 million. In addition, the costs of purchasing land, demolition and off-site improvements for this site were roughly estimated at $1.0 million.
xiii

The analyses showed that residential projects are more feasible than commercial ones in the Northeast Corridor area. There was still a gap in the residential project, but several “what-if” analyses showed that this project could break even (not including land) if townhouses could be built at 40 units per acre, or single family detached units at 33 units per acre. It also showed that townhouses are more profitable than stacked flats, since costs are lower and sale prices are higher. In general, though, the analysis suggested that the City would need to provide some kind of incentive for almost any project, and particularly for projects with commercial components. Funding Opportunities There are many ways that the City or Redevelopment Agency can provide incentives and assistance for catalytic, transit-oriented projects. These generally involve
• improving efficiency by assembling sites so that a more cost-effective design can be achieved
• decreasing risk and processing time by selling the developer land which has been prepared and/or entitled for the project
• reducing cost by demolishing existing structures and selling the property to the developer at the fair market value of the land only
• providing off-site improvements • assisting projects which do not operate profitably in the early years • evaluating regulatory barriers to infill development, and removing them wherever
possible. Pro-Forma Analysis Conclusions The pro-forma analysis showed that a mixed-use project in the Northeast Corridor is likely to require some form of public investment in order to be financially feasible. Residential projects are the closest to achieving profitability under current conditions, and a relatively high density project of townhouses could be profitable at market rates. Retail and office projects are less feasible, due to the relatively low market rents in the area. Since retail and mixed-use retail/residential projects are desirable near Globe Station in the short term and near Arden-Del Paso in the longer term, the City and/or the Redevelopment Agency will need to consider how best to facilitate this kind of project and will need to strategically consider its use of limited resources in order to draw the desired development. Based on the information obtained from both the market analysis and the pro-formas, BAE recommends that the City begin with a project with a large for-sale residential component at a site near the Globe station or on Del Paso Boulevard near the Arden Way station. Due to the possibility of a residential project at the Lumberjack site, additional construction near the Royal Oaks station should be delayed until the market impact of this project can be evaluated. The pro-formas show that a for-sale residential project can be profitable, and also that the specific design can have a significant effect on the profitability. With a small amount of retail and/or office space at the ground floor, and an optimal design of the residential component, this could be achieved. The market analysis also showed demand for a commercial building with retail on the ground floor and offices above, however, a project like this would require support from the City or the
xiv

Agency until market rents provide an appropriate return. While construction costs for a restaurant are higher than for other commercial space, rents are also higher, and this would be a use particularly well suited to TOD. The use and design of subsequent projects could be considered once it is seen how this initial retail/residential or retail/office project and others currently in the planning stage are implemented and received in the marketplace.
xv

Section I – Market Analysis
1

Introduction
This section of the report provides an overview of market opportunities surrounding Sacramento Regional Transit’s (Sacramento RT) Globe, Arden/Del Paso, and Royal Oaks light rail stations. The main body of this market study describes existing market conditions within the station areas and potential market opportunities for TOD near these stations. This analysis builds on the market analysis that BAE completed for the Swanston light rail station area in spring of 2006. In order to best inform the analysis of market trends in the three station areas and to address the geographic constraints related to data availability, this report defines a larger study area - the Northeast Corridor Study Area – that includes all three stations and surrounding areas, as described below. Analysis for this report relied on data collected from the U.S. Census, Claritas, Inc., Sacramento Housing and Redevelopment Agency (SHRA), Sacramento Area Council of Governments (SACOG), Sacramento RT, First American Real Estate Solutions (FARES), the City of Sacramento Planning Department, as well as site tours and primary research conducted by BAE. Study Area Definitions Northeast Corridor Study Area The Northeast Corridor Study Area (Study Area) encompasses the Globe, Arden/Del Paso, and Royal Oaks transit station areas as well as a larger surrounding area. The Globe station is located along Del Paso Boulevard, just north of the State Route 160 ramp. The Arden/Del Paso light rail station is located on Arden Way at the intersection with Del Paso Boulevard. The Royal Oaks Station is located on Arden Way directly east of Royal Oaks Drive. Since the stations are all in such close proximity, an analysis of the TOD potential for each location should consider developments around the other RT stops and opportunities for convergence of public and private efforts at all three stations. The Study Area expands further beyond the stations to include a region from which pedestrian-oriented development could draw. The Study Area also corresponds to Census Block Group boundaries, in order to make use of available demographic data for the area. The Study Area is comprised of five U.S. Census Block Groups: Block Groups 1, 3, 4, 5, and 6 of Census Tract 69. It is necessary that the Study Area be based on Census boundaries in order to obtain usable demographic and economic data for the study. As illustrated in Figure 1, the Study Area is bounded by rail lines to the east and west, State Route 160 to the south, and El Camino Avenue to the north. People living in the Study Area (in addition to future residents) generate demand for local neighborhood goods and are potential customers for new neighborhood-serving retail that could be located at or near the stations. Overall, the Northeast Corridor Study Area is also representative of the prevailing demographic and economic characteristics that influence real estate conditions surrounding the three light rail station areas. The Study Area geography includes the Woodlake neighborhood, which is significantly different from the rest of the Study Area. This neighborhood is characterized by large single-family homes and, as a result, likely higher income levels. The neighborhood falls within Census Block Groups 6 and 3 of Tract 69. The decision was to include Block Group 3, which includes the eastern portion of the Woodlake neighborhood, because to exclude Block Group 3 would have excluded
2

the Erickson Industrial Park and other land just southeast of the Royal Oaks Station. While including this geography within the Study Area probably biases the reported Northeast Corridor Study Area income levels above what is found in the rest of the Study Area, it is important to also highlight that this part of the city possesses the potential to attract higher-income households. North Sacramento The North Sacramento geography serves as a benchmark for purposes of comparison with the Study Area. Economic and demographic trends within this region provide context to identify the unique characteristics within the Northeast Corridor Study Area. In defining this region, this study attempts to maintain consistency with SHRA North Sacramento Redevelopment Area and the SACOG Regional Analysis District (RAD) 8 definitions, thus providing access to information for this geography from both organizations. However, while SHRA’s North Sacramento Redevelopment Area excludes the Woodlake Neighborhood and areas east of the rail line, the geographic definition and analysis presented in this report encompasses this area. Furthermore, the Census Block Groups used for the data analysis, including information from SACOG, extend slightly further east than the RAD 8 boundaries. Figure 2 shows the North Sacramento geography used in this report, and Appendix A provides the Census geographies that comprise the North Sacramento study area. Light Rail Station Descriptions Globe Station Globe Station stands between Globe Street and Baxter Street on Del Paso Boulevard and is the first light rail station north of the American River, as light rail trains leave downtown Sacramento. The station offers pedestrian shelters and information kiosks. The Globe Station serves smaller retail, office, and mixed-use buildings on Del Paso Boulevard, along with apartments and single-family homes to the south and industrial buildings to the north. Appendix B provides a land use map of the Globe Station area. A quarter-mile radius delineates the area around the station most suitable for transit-oriented development. For 2005, Sacramento RT reported 290 average daily weekday boardings (the number of people getting on the trains), at this station. This is an increase from the reported 156 daily boardings in 2000. Arden/Del Paso Station Located directly southeast of the Arden Way and Del Paso Boulevard intersection, the Arden/Del Paso light rail station has a bus transfer area, pedestrian shelters, and a small park and ride lot for approximately 45 cars. The light rail station serves the surrounding residential neighborhoods to the south and north of the station along with retail and small office properties located on Del Paso Boulevard and Arden Way. RT owns the 25,000 square foot park and ride lot to the south of the Arden/Del Paso Station platform. Street access to this site is limited, but it may provide an opportunity for a small retail vendor to locate at this station. Appendix C is a detailed land use map of the Arden/Del Paso station area. This map also illustrates a quarter-mile radius around the station to highlight the area most appropriate for TOD efforts. Ridership levels at this station for 2005 averaged 1,547 daily weekday boardings, the highest ridership levels of the three stations examined in this study and an increase of over 50 percent from 2000 levels of 756 daily boardings.
3

Royal Oaks Station The Royal Oaks Station is located on Arden Way directly east of Royal Oaks Drive. A substantial quantity of office space is located just to the south of the station. Amenities at this station include pedestrian shelters and telephones. The map in Appendix D indicates the land uses around the Royal Oaks station, and also shows the quarter-mile radius most suitable for TOD projects. Between 2000 and 2005, daily weekday boardings increased 85 percent from 282 to 524 at Royal Oaks. Despite the significant boost in ridership, overall station usage remains relatively low. Any increase in ridership at the three stations along the Northeast Corridor will not act by itself as a catalyst for TOD in the station areas. The experience with retail development around stations in other transit systems has shown that transit patrons alone are not sufficient in number to support any significant amount of retail. As summarized in the Urban Land Institute publication “Ten Principles for Successful Development Around Transit,” transit ridership can enhance retail demand, but there must be sufficient demand to support planned retail without the transit component.
8 This means that demand from surrounding residential uses and, to a lesser extent,
demand from the daytime population of surrounding commercial development must support retail uses. Intensified land uses in the vicinity of the station geared towards capitalizing on access to light rail will generate increased transit usage and help support retail.
8 Dunphy, Robert and Deborah Myerson, and Michael Pawlukiewicz, “Ten Principles for Successful
Development Around Transit.” Urban Land Institute, 2003. Page 14.
4

§̈¦80
UV160
UV160
UV160
Del Paso
Arden
El Camino
Exposition
Gro
ve
Leisure
Rio Linda
Roy
al O
a ks
Nor
woo
d
Northgate
Canterb ury
Arden
Can
terb
ury
Altos
Eleanor
Traction
Fee
El Monte
Cla
y
Taft
Calvados
Expo
Col
fax
Amer
ican
Levee
Tribute
Arden
Oxf
ord
Ever
gree
n
Frienza
Lexi
ngto
n
Bay
Globe
Wilson
Har
vard
Eric
kson
LampasasPlaza
Lochbrae
Gro
ve
Boxw
ood
Peralta
Silica
Haggin
Lathrop
Harding
Southgate
Woodlake
Baxter
Response
Land
Blackwood
Can
talie
r
Oak m
o nt
RedwoodCleveland
Em
pres
s Gre
en
Commerce
Exit
Ellen
SantiagoA
com
a
Railr
oad
Jefferson
Bea
umon
t
Glenrose
Lea
Bowles
Gibson
Garden
Gary
Helena
Leitch
Fairf
ield
Blum
enfe
ld
Fern
ley
Dal
e
Heritage
Forr
est
Bars
tow
River Park
Columbus
Selm
a
Cannon
Olivera
Man
ning
Media
Cam
brid
ge
Darina
Alic
e
Americana
Nor
woo
d
Jo
hnston
Dean
Stanford
Berggren
Shobar
Barrette
Edge
wat
er
York
Slobe
Leisur e
Joellis
Haw
thor
ne
Browning
Merle
Bottom Li
ne
Dixieanne
Frontage
Acade
my
Royal Oaks
Wes
tern
Winnipeg
Dal
e
Dixieanne
Santiago
Selm
a
Colfax
Redwood
Edge
wat
er
Cant alier
Forr
estArden
Santiago
Fairf
i el d
Fairf
ield
Forrest
Edgewater
Southgate
Taft
Dale
Green
Beau
mon
t
American RiverAmerican River
Drain PoolDrain Pool
Natomas Main DrainNatomas Main Drain
Bushy LakeBushy Lake
Figure 1: Northeast Corridor Study Area
®0 0.5 10.25 Miles

Ib
IbIbIbIb
§̈¦80
Globe Station
Arden - Del Paso Station
Royal Oaks StationSwanston Station
§̈¦80
UV160
Rio Linda
American RiverAmerican River
Figure 2: North Sacramento Study Area
® 0 2 41 Miles

Neighborhood Context
The Northeast Corridor Study Area is characterized by a wide array of land uses. The Study Area includes light industrial centers, residential neighborhoods, commercial corridors and a great deal of under-utilized land. One local real estate broker described the area as “just a hodge-podge of different land uses all within close proximity of each other.” Moreover, the Northeast Corridor Study Area contains distinct sub-geographies that are physically separated from one another. Arden Way, Del Paso Boulevard, and Royal Oaks Drive divide the more affluent Woodlake Neighborhood from the rest of the Northeast Corridor Study Area. Fences and hedges further separate this neighborhood from surrounding areas by limiting pedestrian access. The Northeast Corridor Study Area is part of the North Sacramento Redevelopment Project Area that Sacramento Housing and Redevelopment Agency (SHRA) formed in 1992 to combat “higher unemployment, lower household income and a badly deteriorated building stock.”
9 That same
year, the Artist Live Work Ordinance passed, making it legal for artists to live and work in commercial spaces.
10 Both events have shaped the development of the Study Area.
Several art-related facilities are located within the Northeast Corridor Study Area, mostly concentrated along Arden Way and Del Paso Boulevard south of El Camino Avenue. Following is a list of venues which participate in the Second Saturday Art Walk that takes place in Sacramento:
Twisted Metal MASSA PEAL
Woodlake Artist Group at Entoria Wine
Tasting Salon
Plantation Restaurant
Casa Bella Galleria
Building on the Boulevard Supper Club
Doiron Gallery
Artisan Gallery
Sol Collective, Arts and Cultural Center
Phantom Galleries (various locations)
9 SHRA North Sacramento 5-year Implementation Plan
10 www.surrealestates.org and www.sacforart.com
7

While extremely preliminary, the local artist organization, SurrealEstates, further lists three additional upcoming art venues in the Northeast Corridor Study Area on their website, including the Dana Cultural Center, Memorial Amphitheatre, and the Digital Hotel. Details regarding locations and timing are not available. If these projects progress to implementation, they could further bolster the area’s image as an arts district. The history of the artist community in this neighborhood extends back over three decades with the establishment of the Acme Gallery at 2030 Del Paso Boulevard in 1974. Due to the Artist Live Work Ordinance, the 1990s witnessed a surge of artist activity in the area and the 49 blocks of Arden Way and Del Paso Boulevard were designated one of America’s 100 Arts Districts.
11
However, crime and perceptions of high crime rates have hindered the arts-based neighborhood revitalization efforts. Many galleries and arts-related organizations have either moved or closed in recent years. The Michael Himovitz Gallery closed in 2001, the Horse Cow Gallery has also closed its doors, and the Center for Contemporary Art relocated to a midtown location.
12
Arts-related development still continues to occur in the Study Area. Daniel Friedlander, LIMN furniture store and warehouse owner, is part of a movement to preserve and re-use the many unique, abandoned art-deco buildings along Del Paso Boulevard. Friedlander purchased the Building on the Boulevard, previously occupied by the Michael Himovitz Gallery, and plans to convert it into a mixed-use building with high-end retail, restaurants and service providers. He is also close to completing renovation of the abandoned Arden Motel as either offices or a boutique hotel called the Greens A To Z. With the hotel, the complex would become an attractive recreational destination that may include high-end salon services, a wine bar, and other similar amenities. The Greens complex already hosts the Supper Club, an upscale restaurant serving six-course menus once a week. Plans to renovate and convert the former Horse Cow Gallery into a LIMN outlet store are underway. Friedlander also owns a half-acre lot adjacent to the LIMN store, along Arden Way, where he plans to build a three-storey office and retail building. Fellow Del Paso Boulevard developer, Allen Warren of New Faze Development, has also invested significant resources into the area. New Faze Development has acquired at least six Del Paso Boulevard properties within the Northeast Corridor Study Area and relocated its own office space to Del Paso Boulevard from a suburban location. A 2005 Sacramento Bee article reported that New Faze is in the initial planning phase of two mixed-use projects within the area likely to result in 70,000 square feet of commercial space and approximately 200 market rate condominiums.
13 Recently, New Faze released early plans for a six-storey project with
approximately 4,250 square feet of retail, 13,300 square feet of office, and 27 condominium units at 2001 Del Paso Boulevard.
14 Furthermore, in June of 2006, New Faze announced the creation
of New Faze Investment Fund I. The fund combines $53 million from the California Public Employees’ Retirement System (CalPERS) with $17 million from private investors, including New Faze Development, Weyerhaeuser Realty Investors, and MacFarlane Partners. The fund’s
11
Ibid. 12
Vellinga, Mary Lynne “Believing in the Boulevard.” The Sacramento Bee. October 11, 2005; p. A1. 13
Ibid. 14
“Developers Creating A Renaissance on Del Paso Boulevard.” Comstock’s. June 2006. P. 30-31.
8

goal is to develop 2,000 houses, condominiums and residential lots, primarily in northern and central California.
15
Generally, much of the retail located within the Study Area consists of local-serving “mom and pop” stores, while national chains seek locations across Business 80 in the Arden Fair area. However, the commercial corridors in the Northeast Corridor Study Area have been undergoing steady and constant transformation. As one local commercial real estate broker stated, “the area has been in a turn-around phase,” with many changes planned along the commercial corridors. Recently, the area along Del Paso Boulevard approved a Property-Based Business Improvement District (PBID) to address safety and beautification issues along the commercial strip as well as to provide marketing and promotion services for the area. SHRA Redevelopment Efforts Eleven live/work artist units were completed in October 2006 in the Dixieanne Neighborhood, at the intersection of Oakmont and Calvados streets. The project, named SurrealEstates, consists of eleven self-built, affordable, three-bedroom, single-family units with detached studio spaces.
16 This redevelopment investment project has
received over $700,000 in funding assistance from SHRA between 2002 and 2006.
17
SHRA also partnered with the Sacramento Mutual Housing Association (SMHA) on the construction of the 21-unit Victory Townhomes development and the rehabilitation of the 56 apartments comprising Evergreen Estates. These projects, completed in 2003, have altered the appearance of the Dixieanne and Lexington Streets intersection. Both developments share a children’s playground and a 5,500 square foot community center, located along Dixieanne Avenue between Green and Evergreen Streets. The community center includes a computer lab, meeting space, and counseling rooms for service providers. The Townhomes filled a lot left vacant after SHRA tore down a severely blighted apartment complex. The joint townhome and garden apartment community serves families earning sixty percent or less of the Sacramento MSA
18 (Metropolitan Statistical Area) median family income. While this project is on the eastern
edge of the Northeast Corridor Study Area and closer to the Swanston Station than the three stations studied in this report, SHRA is in the early stages of exploring further opportunities to improve multifamily housing options in the Northeast Corridor Study Area as well. In order to address the plethora of vacant lots and deteriorated housing in the area, SHRA established several programs within the North Sacramento Redevelopment Area, such as the Single Family Rehabilitation Loan and Retrofit Grant Program, the Multifamily Rehabilitation Loan Program, and the Boarded and Vacant Program. The dollar amounts reported here are earmarked by the Agency in the North Sacramento Redevelopment Area Five-Year
15 McCarthy, Mike. “New Faze Joins $73M Urban Housing Fund.” Sacramento Business Journal. June 13,
2006. 16
www.surrealestates.org. 17
Katherine Klein, SHRA, comments on 11 October 2006. 18
The Sacramento MSA, as defined by the U.S. Census Bureau, consists of Sacramento, El Dorado, Placer, and Yolo Counties.
9

Implementation Plan; however, these allocations have not been approved by City Council to date and are subject to change. The Single Family Rehabilitation Loan and Retrofit Grant (improving accessibility) Program earmarks approximately $500,000 in redevelopment funds over five years, while the Multifamily Rehabilitation Program (grants) provides the same amount over that period. Both programs are geared towards the improvement of the area’s housing stock. Since 2000, 22 projects, totaling over $241,500 in single-family rehabilitation loans and retrofit grants, have been undertaken in the North Sacramento Redevelopment Area. Over the same period, SHRA has also provided 14 loans to first-time home-buyers in North Sacramento, amounting to over $133,800. From 2005 to 2009, SHRA preliminarily plans to spend $500,000 to support this program in North Sacramento. The Boarded and Vacant Program, strives to improve the region’s housing stock by preliminarily designating $500,000 to assist developers in the purchase and rehabilitation of boarded and vacant properties. Over the past few years, there was only one home in the Study Area funded by the Boarded and Vacant program. The Vacant Lot Infill Program, created in 2002, provides development assistance for the construction of single-family homes on vacant lots that are then sold to low- and moderate-income buyers. Three homes in the Study Area were constructed with funding assistance from this program. However, according to SHRA, the vacant lot infill program has seen less activity over the past two years due to a lack of available sites. These programs all contribute to a notable increase in rehabilitation and investment activities within the Northeast Corridor Study Area. SHRA also dedicated an allocation of over $5 million towards the completion of Phases I and II of the Del Paso Boulevard Streetscape Master Plan. Phase I includes new medians, lighting, landscaping and public art. Phase II includes enhancements to improve pedestrian access and walkability, and attract consumers to shops along the commercial strip, specifically, bus stop relocations, bulb-outs, diagonal parking, and a reduction to two lanes between Arden Way and El Camino Avenue. Phase I is nearly complete, and Phase II will be completed by mid-2007. SHRA also provides loans and grants for exterior and interior commercial rehabilitation projects. The highly utilized exterior rebate program provides grants for façade improvements to businesses. With this program, SHRA will match up to $50,000 in renovation expenses. Since 2000, the Agency has provided almost $678,000 in commercial rehabilitation rebates and $340,000 in loans to 19 projects within the Northeast Corridor Study Area. Developers invested almost $1,874,000 of their own money on these commercial revitalization projects. Over the same time frame and just outside the Study Area boundaries, SHRA and developers invested another $1,226,000 of funds on four projects through the exterior rebate program. As a testament to the success of these efforts, several new commercial buildings, including a site for a Starbucks and an additional retail store at the intersection of Rio Linda Boulevard and El Camino Avenue, and 6,000 square feet of commercial space at 100 Arden Way, are currently approved. Another recently proposed project at 965 El Camino is a Petrovich Development Company venture that may house a restaurant. In addition, there are several commercial rehabilitation proposals that focus on office and professional spaces. The Arden Motel Project and the Sacramento Employment and Training Agency’s 2002 conversion of a vacant warehouse space into an office space at 925 Del Paso Boulevard are two examples of the commercial rehabilitation taking place in the area.
10

Existing Land Use Conditions The following section discusses the various land uses within the Study Area and around the three light rail stations, highlighting problems and potential development opportunities within the Study Area. The analysis is based on land use maps from the City of Sacramento, from the first quarter of 2006. Information gathered through a windshield survey bolsters the land use data. Northeast Corridor Study Area The Study Area consists of residential, commercial and light-industrial land uses, with a significant supply of vacant and under-utilized parcels. Figure 3 displays the current zoning within the Study Area. Del Paso Boulevard, El Camino Avenue, and Arden Way Commercial Corridors: Retail and office uses, with General Commercial zoning (C-2), are located along the commercial corridors of Del Paso Boulevard, El Camino Avenue to the west of Del Paso Boulevard, and interspersed along the northern half of Arden Way. These commercial areas are plagued with vacant and under-utilized sites, with a significant concentration of vacant parcels along Del Paso Boulevard to the south of Arden Way. North: The northern half of the Study Area, located north of Arden Way, consists of residential lots that are generally small in size, and interspersed with commercial uses. There is a greater occurrence of multifamily developments in this portion of the Study Area as compared to the southern portion of the Study Area. Furthermore, the houses and apartment complexes found here are generally older, with some in need of rehabilitation. Two currently proposed Signature Properties residential projects, consisting of 80 single-family detached homes, will improve the diversity of the housing stock available in this portion of the Study Area. There are a few parks located within this area. Dixieanne Park, located at the intersection of Dixieanne Avenue and Erickson Street, contains a lighted baseball field. However, this fenced-off park is an under-utilized neighborhood asset that requires greater attention in order to increase resident activity. Signature Properties, which has proposed a single-family residential project near the park, has offered to assist in re-planning the park and initial plans include a children’s playground, a skateboard park, a picnic area, and a green area.
19 A “tot lot” at Dixieanne Avenue and Beaumont
Street provides a playground facility for young children. Redwood Park also could offer park facilities and a lighted baseball field to residents in the northwest corner of the Study Area. However, this park is fenced off with barbed wire and signs indicate that the park is closed and available for use by permit only. South: The southeast corner of the Study Area contains a large office park with sizable buildings and extensive surface parking. Large homes on single-family lots characterize the Woodlake Neighborhood, located south of Arden Way, west of Royal Oaks Drive, and east of Del Paso Boulevard. These homes are in good condition, with many retaining their historic architecture. Multifamily residences in this portion of the Study Area are concentrated close to Del Paso Boulevard, near the mobile home park bordered by Del Paso Boulevard and State Route 160. Woodlake Park, just south of the Arden/Del Paso Station, covers more than seven acres of grounds. Park amenities include a lighted tennis court, a baseball field, a club-house, children’s
19 McCarthy, Mike. “Transit Village Planned for Swanston Neighborhood.” Sacramento Business Journal.
August 11, 2006.
11

playgrounds, and the Sacramento Police and Sheriff Memorial. Industrial and commercial uses are dispersed west of Del Paso Boulevard. Large swaths of vacant or under-utilized industrial land can be found in the southwest portion of the Study Area, bordered by Del Paso Boulevard to the east, Arden Way to the north, State Route 160 to the south, and the railroad to the west. Station Area Land Uses Globe Station: Appendix B contains a map of the current zoning in the area around Globe Station. The circle around the station represents a quarter-mile radius from the light rail stop, which highlights the area most suitable for transit-oriented development. Along Del Paso Boulevard, in the vicinity of Globe Station, neighborhood commercial and office land uses dominate the landscape. There are many vacant buildings as well as vacant and under-utilized lots. Residences at various densities are located to the south of Del Paso Boulevard. A medium-density mobile home park is located at the convergence of State Route 160 and Del Paso Boulevard. Medium to high-density multifamily housing is found near the mobile home park and abutting the commercial lots of Del Paso Boulevard. The larger low-density homes of the Woodlake Neighborhood begin at the southwestern edge of the Globe Station area. North of Del Paso Boulevard’s commercial corridor, land is zoned for light industrial, neighborhood commercial, and office uses. A survey of this area revealed a significant amount of under-utilized and vacant land. Arden/Del Paso Station: Appendix C shows current zoning for the Arden/Del Paso Station area. Like the Globe Station area, Del Paso Boulevard contains neighborhood commercial and office uses in the Arden/Del Paso Station area. While vacant buildings and land do exist north of Arden Way, there are not as many as found south of Arden Way. Woodlake Park is located just south of the station, with only a small RT parking lot separating the two. Also just to the south of the station is a National Guard building as well as a City-owned building currently leased to the North Sacramento Chamber of Commerce. Beyond the park to the south and southeast is the residential Woodlake Neighborhood. To the north of the station, along Arden Way, are a discount glass and screen shop and a used auto dealer, as well as some older office space. At the corner of Arden Way and Del Paso Boulevard is a vacant lot that may present environmental hurdles to development due to its previous use as a gas station. Beyond the commercial uses to the north of the Arden/Del Paso station are smaller low-density residential homes. These homes are generally older and in need of various degrees of rehabilitation. The medium-density Gibson Oaks multifamily housing complex is located at the far northern portion of the Arden/Del Paso Station area. Royal Oaks Station: Appendix D illustrates the zoning designations for the lots around Royal Oaks Station. The Royal Oaks Station area consists of two different halves, split by Arden Way. South of Arden Way, a large office park dominates the landscape while north of Arden Way, the neighborhood primarily contains single-family housing.
12

The large office park to the southeast of the station has Office Building (OB) zoning. Lots are zoned light industrial north of the office park and east of the station. The light industrial zoning carries across Arden Way to the eastern portion of the station area. Low-density housing dominates the landscape north of Arden Way and southwest of the station area. In addition, a few neighborhood commercial uses are scattered along the northern half of Arden Way, such as Geneva’s Big Burgers, a Circle 6 Food Store, and the Royal Oaks Food Mart. There are also several motor vehicle sales lots along Arden Way, including a Harley-Davidson dealership. A mixed-use development that incorporates commercial space, condos, and apartments is currently proposed at the former Lumberjack location.
20
20
The Planned and Proposed Projects section of this report provides further details regarding this project.
13

ÆbÆbÆb
ÆbGlobe
Swanston
Royal OaksArden-Del Paso
Study Area Boundary
ZoningHeavy Industrial
Light Industrial
Neighborhood Commercial/Office
Low Density Residential
Medium Density Residential
Medium-High Density Residential
Moderate-Intensity Office
Office Building
Open Space
Public/Quasi-Public
Figure 3: Existing Zoning, Northeast Corridor Study Area
®0 0.5 10.25 Miles
Demographic and Employment Trends
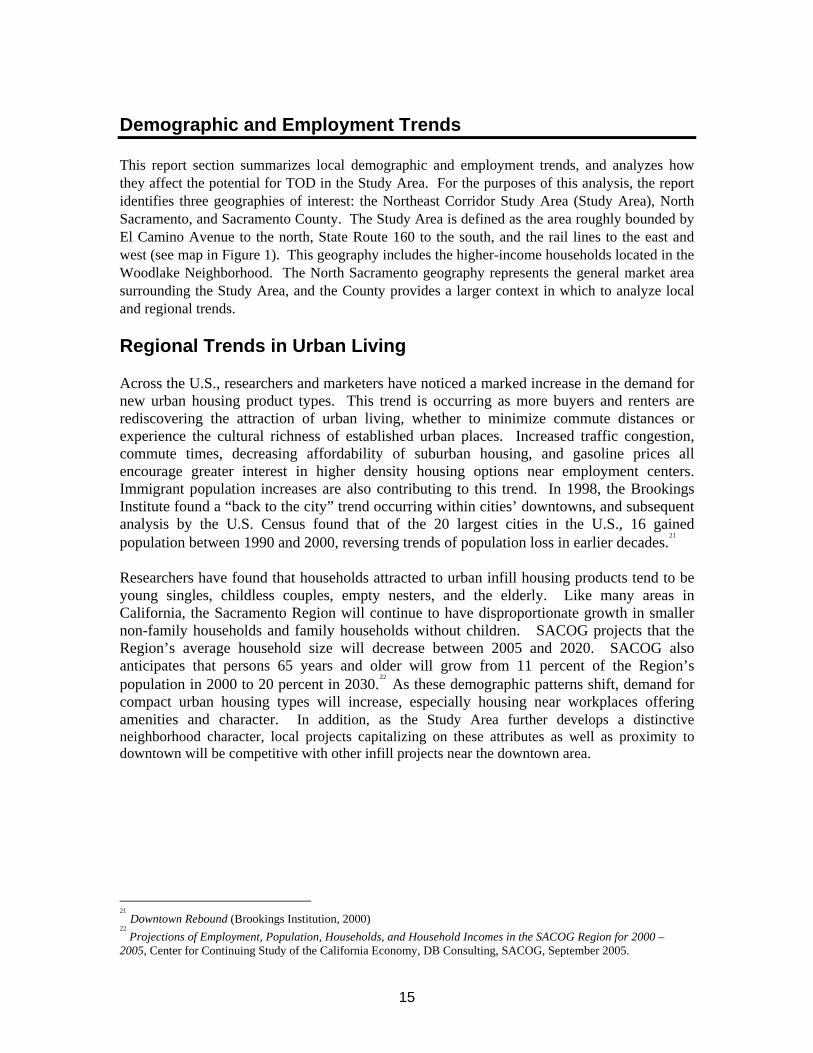
This report section summarizes local demographic and employment trends, and analyzes how they affect the potential for TOD in the Study Area. For the purposes of this analysis, the report identifies three geographies of interest: the Northeast Corridor Study Area (Study Area), North Sacramento, and Sacramento County. The Study Area is defined as the area roughly bounded by El Camino Avenue to the north, State Route 160 to the south, and the rail lines to the east and west (see map in Figure 1). This geography includes the higher-income households located in the Woodlake Neighborhood. The North Sacramento geography represents the general market area surrounding the Study Area, and the County provides a larger context in which to analyze local and regional trends. Regional Trends in Urban Living Across the U.S., researchers and marketers have noticed a marked increase in the demand for new urban housing product types. This trend is occurring as more buyers and renters are rediscovering the attraction of urban living, whether to minimize commute distances or experience the cultural richness of established urban places. Increased traffic congestion, commute times, decreasing affordability of suburban housing, and gasoline prices all encourage greater interest in higher density housing options near employment centers. Immigrant population increases are also contributing to this trend. In 1998, the Brookings Institute found a “back to the city” trend occurring within cities’ downtowns, and subsequent analysis by the U.S. Census found that of the 20 largest cities in the U.S., 16 gained population between 1990 and 2000, reversing trends of population loss in earlier decades.21
Researchers have found that households attracted to urban infill housing products tend to be young singles, childless couples, empty nesters, and the elderly. Like many areas in California, the Sacramento Region will continue to have disproportionate growth in smaller non-family households and family households without children. SACOG projects that the Region’s average household size will decrease between 2005 and 2020. SACOG also anticipates that persons 65 years and older will grow from 11 percent of the Region’s population in 2000 to 20 percent in 2030.22
As these demographic patterns shift, demand for compact urban housing types will increase, especially housing near workplaces offering amenities and character. In addition, as the Study Area further develops a distinctive neighborhood character, local projects capitalizing on these attributes as well as proximity to downtown will be competitive with other infill projects near the downtown area.
21 Downtown Rebound (Brookings Institution, 2000)
22 Projections of Employment, Population, Households, and Household Incomes in the SACOG Region for 2000 –
2005, Center for Continuing Study of the California Economy, DB Consulting, SACOG, September 2005.
15

Local Demographic Trends Population and Household Trends Table 1 summarizes population and household trends for the Study Area, North Sacramento, and Sacramento County. As shown, the Study Area has steadily increased in terms of population and number of households, with an estimated 5,275 residents living in 2,289 households in 2005. The Sacramento region overall grew steadily during this period as well. North Sacramento grew by six percent and Sacramento County by four percent from 2000 to 2005. Household growth rates in the three geographies exceed their respective population growth rates. Between 2000 and 2005, the number of households in the Study Area rose by nine percent, compared to twenty percent in North Sacramento and nine percent in Sacramento County. Household Type Table 1 also displays data for household type. The Study Area contains slightly lower proportions of families compared to North Sacramento and Sacramento County. Approximately 48 percent of Study Area households are family households compared to 65 percent for both North Sacramento and Sacramento County overall. This is clearly reflected in average household sizes, as the average household size in the Study Area is approximately 2.3 persons per household compared to 3.1 persons per household in North Sacramento and 2.7 persons per household in Sacramento County. The smaller household sizes in the Study Area are explained by the lower proportion of children and higher proportion of seniors living in the Study Area (see following paragraph). Age Distribution As shown in Table 2, the Study Area has a higher median age than both North Sacramento and Sacramento County. At 36.6 years, the median age in the Study Area is over seven years greater than the rest of North Sacramento. Furthermore, the Study Area contains the highest percent of persons 65 years and older, with approximately 12.7 percent. This is compared to North Sacramento where persons 65 years and older represent approximately eight percent of the population, and in Sacramento County, where they account for nearly eleven percent. The Study Area also has lower concentrations of children than the other areas. In the Study Area, residents up to the age of 20 represent only 27 percent of the total 2005 population, compared to 37 percent in North Sacramento, and 31 percent in the County. Household Income Distribution As shown in Table 3, despite the inclusion of the high-income households of Woodlake Neighborhood, median household income for the Study Area, at $28,137 in 2005, is significantly lower than income levels in North Sacramento and the County overall. North Sacramento’s median household income is over $4,100 higher than the median for the Study Area. The County median household income of $50,087 exceeds the Study Area and North Sacramento median incomes by nearly $22,000, and $17,800, respectively. Within the Study Area, only 8.8 percent of households have incomes over $100,000 per year. This compares to five percent in North Sacramento, and 17.6 in the County. Moreover, nearly 46 percent of households in the Study Area earn less than $25,000 annually, compared to 39 percent
16

in North Sacramento and 22.4 percent in Sacramento County. The estimated median income in the Study Area may be slightly understated as the Census and Claritas, Inc. do not report income generated in the informal economy, which is often more prevalent in lower income communities. Household Size Table 4 provides information on overall tenure patterns, along with the household size distribution for owner and renter households in 2000. Within the Study Area, household sizes are relatively small. In 2005, approximately 82 percent of households contained three or fewer persons. These proportions compare to 67 percent of North Sacramento households and 74 percent of Sacramento County households with three or fewer persons. As stated earlier, SACOG projects that smaller non-family/empty-nester households will become a larger share of the total household population over the next 20 years. The result will be increasing demand for smaller units close to community amenities such as shopping and cultural events. Household Tenure As might be expected from the smaller households and lower incomes prevalent in the Study Area, the area has a higher proportion of renter households than the County overall. As shown in Table 1, approximately 60 percent of Study Area households are renters compared to 41 percent of County households. Moreover, the share of renter households in the Study Area has been steady between 2000 and 2005. This percentage will likely decrease with more for-sale housing planned for the area. Housing Stock Characteristics Table 5 details the 2005 housing stock characteristics in the three study areas. The 1,234 detached, single-family homes in the Study Area comprise 49.4 percent of the total housing stock in the area. This figure compares to 60 percent in North Sacramento and 63 percent in the County. The Study Area also contains a smaller share of large multifamily complexes, which represent 2.4 percent of total area housing units, as compared to North Sacramento and Sacramento County, which have 7.4 and 7.8 percent of total units in large multifamily complexes, respectively. The Study Area does possess higher concentrations of smaller apartment complexes and mobile homes. Apartment complexes with 10 to 19 units represent 9.7 percent of the housing units in the Study Area, compared to 4.1 percent in North Sacramento and 3.8 in the County. The 215 mobile home units in the Study Area amount to 8.6 percent of the housing stock. This number compares to 3.5 percent of units in North Sacramento and three percent in Sacramento County. Projected Population and Household Growth As shown in Table 6, population projections anticipate a far lower growth rate for the Study Area from 2005 through 2025 as compared to North Sacramento and Sacramento County. While SACOG estimates a 2.1 percent increase in the Study Area population during this time period, North Sacramento and Sacramento County will experience 9.3 and almost 20 percent growth, respectively. Furthermore, household projections for the Study Area anticipate only a 2.6 percent increase over the twenty years, compared to 10.5 percent in North Sacramento and almost 21 percent in the County. The approximately 5.5 percent growth in single-family households represents the greatest increase projected for the Study Area. However, single-family household growth in
17

North Sacramento and the County are still anticipated to be higher than in the Study Area, with 12 and 20 percent increases, respectively. Multifamily and mobile home units are projected to remain stable at 2005 levels through 2025. There are 1,000 multifamily units and 258 mobile homes in the Study Area in 2005. In North Sacramento, multifamily units will grow by 9.4 percent and mobile homes will only increase by one unit. Projections for Sacramento County estimate a 23 percent increase in multifamily units and 2.5 percent increase in mobile home units. It should be noted that SACOG bases its projections on existing land use plans and available vacant land and does not account for recent development applications. Under existing zoning designations, the Study Area is not expected to grow and will remain single-family in nature with limited room to expand. Thus, the zero projected growth in multifamily housing in the Study Area is less a reflection of demand but more of governmental constraints that limit higher density residential development. SACOG is likely to adjust its projections after completion of this planning process to reflect changes to zoning. Assuming that updated zoning for the Study Area will support more housing than current zoning does, SACOG would likely allocate more of its projected regional multifamily housing demand to the Study Area. Summary Although the Study Area is largely built out in terms of land zoned for residential use, the number of households grew more rapidly than the County overall between 2000 and 2005. Within the Study Area, there are proportionately fewer family households, smaller household sizes, greater proportions of seniors 65 years of age and older, and smaller proportions of children. These demographic characteristics all suggest solid demand for multifamily housing. Currently, household incomes in the area are relatively low and this area has also maintained a low percentage of households owning their own homes. These trends will likely reverse to some extent, as households priced out of other more expensive areas of Sacramento seek opportunities to buy homes that are more affordable. Workforce housing for singles and couples, seniors, and other small households who are priced out of areas such as Midtown and Downtown is likely to be a strong market niche for the Northeast Corridor Study Area. For those households with members who work in the Downtown area, the light rail station will provide a convenient and inexpensive commute option.
18

Table 1: Population and Household Trends
Percent ChangeNE Corridor Study Area 2000 2005 (a) 2000-2005
Population 4,867 5,275 8.4%Households 2,148 2,289 6.6%Household Population (b) 4,867 5,275 8.4%Average Household Size 2.27 2.30 1.7%
Household Type Families 48.7% 48.0% Non Families 51.3% 52.0%
Tenure Owner 39.8% 39.8% Renter 60.2% 60.2%
North Sacramento
Population 67,437 76,777 13.8%Households 22,432 24,945 11.2%Household Population (b) 66,990 76,314 13.9%Average Household Size 2.99 3.06 2.4%
Household Type Families 64.5% 65.2% Non Families 35.5% 34.8%
Tenure Owner 43.3% 43.3% Renter 56.7% 56.7%
Sacramento County
Population 1,223,499 1,362,572 11.4%Households 453,602 502,756 10.8%Household Population (b) 1,198,004 1,336,585 11.6%Average Household Size 2.64 2.66 0.7%
Household Type Families 65.6% 65.2% Non Families 34.4% 34.8%
Tenure Owner 58.2% 58.6% Renter 41.8% 41.4%
Notes:(a) All 2000 figures for all geographies are from the 2000 U.S. Census.North Sacramento and Sacramento County 2005 Population and Household figures are from Claritas.NE Corridor Study Area 2005 Population and Household figures are from Claritas. 2005 Average Household size, Household type and tenure figures for all geographies are from Claritas.

Table 2: Age Distribution, 2005
Age Number Percent Number Percent Number Percent
Under 15 1,112 21.1% 21,144 27.5% 300,145 22.0%15 to 20 330 6.3% 7,436 9.7% 118,809 8.7%21 to 24 218 4.1% 4,673 6.1% 76,753 5.6%25 to 34 848 16.1% 11,778 15.3% 199,956 14.7%35 to 44 833 15.8% 10,763 14.0% 206,420 15.1%45 to 54 700 13.3% 9,034 11.8% 187,850 13.8%55 to 64 562 10.7% 5,559 7.2% 124,301 9.1%65 to 74 340 6.4% 3,302 4.3% 76,071 5.6%75+ 332 6.3% 3,088 4.0% 72,267 5.3%
Total 5,275 100.00% 76,777 100.00% 1,362,572 100.00%
Median Age 36.6 29.2 34.3
Notes:Household totals are from SACOG. Percent distributions and median age are from Claritas. Numbers per age cohort are adjusted.
Sources: SACOG, 2006; Claritas, 2006; Bay Area Economics, 2006
NE Corridor Study Area North Sacramento Sacramento County

Table 3: Household Income Distribution, 2005
Estimated Income Number Percent Number Percent Number Percent
Less than $15,000 695 30.4% 5,562 22.3% 60,711 12.1%$15,000 to $24,999 354 15.5% 4,127 16.5% 52,047 10.4%$25,000 to $34,999 278 12.1% 3,807 15.3% 55,899 11.1%$35,000 to $49,999 351 15.3% 4,589 18.4% 82,335 16.4%$50,000 to $74,999 276 12.1% 4,000 16.0% 100,875 20.1%$75,000 to $99,999 152 6.6% 1,591 6.4% 62,302 12.4%$100,000 to $149,999 124 5.4% 908 3.6% 60,194 12.0%$150,000 to $249,999 40 1.7% 258 1.0% 21,703 4.3%$250,000 to $499,999 17 0.7% 83 0.3% 4,918 1.0%$500,000 and over 2 0.1% 20 0.1% 1,772 0.4%$250,000 and over 19 0.8% 103 0.4% 6,690 1.3%
Total 2,289 100.00% 24,945 100.00% 502,756 100.00%
Median Household Income
Notes: Household totals are from SACOG. Percent distributions and median income are from Claritas. Numbers per income cohortare adjusted.
Sources: SACOG, 2006; Claritas, 2006; Bay Area Economics, 2006.
Sacramento County
$28,137 $32,262 $50,087
NE Corridor Study Area North Sacramento

Table 4: Household Size, 2005
Household Size Number Percent Number Percent Number Percent
1-Person Household 898 39.2% 6,408 25.7% 134,542 26.8%2-Person Household 673 29.4% 6,338 25.4% 156,177 31.1%3-Person Household 310 13.5% 3,940 15.8% 81,965 16.3%4-Person Household 187 8.2% 3,206 12.9% 67,515 13.4%5-Person Household 108 4.7% 2,106 8.4% 33,356 6.6%6-Person Household 62 2.7% 1,236 5.0% 15,479 3.1%7-or More Persons 51 2.2% 1,711 6.9% 13,722 2.7%
Total: 2,289 100.0% 24,945 100.0% 502,756 100.0%
Average Household Size 2.3 3.0 2.6
Notes: Household totals are from SACOG. Percent distributions are from Claritas. Numbers per size cohort are adjusted.
Sources: Census, 2000; Bay Area Economics, 2006
NE Corridor Study Area North Sacramento Sacramento County

Table 5: Housing Stock Characteristics, 2005
Units in Structure Number Percent Number Percent Number Percent
1 Unit Detached 1,234 49.4% 15,960 59.9% 331,008 63.0%1 Unit Attached 157 6.3% 1,054 4.0% 34,958 6.7%2 Units 82 3.3% 780 2.9% 12,459 2.4%3 -4 Units 149 6.0% 1,741 6.5% 26,979 5.1%5 - 9 Units 182 7.3% 1,636 6.1% 26,559 5.1%10 - 19 Units 243 9.7% 1,085 4.1% 20,080 3.8%20 - 49 Units 138 5.5% 1,306 4.9% 15,280 2.9%50+ Units 59 2.4% 1,962 7.4% 41,013 7.8%Mobile Home 215 8.6% 925 3.5% 15,788 3.0%Other 40 1.6% 197 0.7% 1,018 0.2%
Total Housing Units 2,500 100.0% 26,646 100.0% 525,142 100.0%
Sources: Claritas, 2006; Bay Area Economics, 2006.
Sacramento CountyNE Corridor Study Area North Sacramento

Table 6: Population and Household Projections, 2005 to 2025
Percent Change2005 2010 2015 2020 2025 2005-2025
Population 4,871 4,908 4,955 4,994 4,974 2.1%
Households 2,383 2,399 2,424 2,444 2,445 2.6%Single-family 1,125 1,141 1,166 1,186 1,187 5.5%Multifamily 1,000 1,000 1,000 1,000 1,000 0.0%Mobile Home 258 258 258 258 258 0.0%
Percent Change2005 2010 2015 2020 2025 2005-2025
Population 71,064 74,362 77,312 78,184 77,680 9.3%
Households 26,736 28,086 29,087 29,490 29,543 10.5%Single-family 15,727 16,303 17,255 17,594 17,643 12.2%Multifamily 9,463 10,237 10,286 10,349 10,353 9.4%Mobile Home 1,546 1,546 1,546 1,547 1,547 0.1%
Percent Change2005 2010 2015 2020 2025 2005-2025
Population 1,270,826 1,372,628 1,456,613 1,502,118 1,522,249 19.8%
Households 492,865 533,421 567,152 585,606 595,296 20.8%Single-family 329,351 353,262 376,166 389,873 396,482 20.4%Multifamily 149,627 166,073 176,817 181,518 184,573 23.4%Mobile Home 13,887 14,086 14,169 14,215 14,241 2.5%
Sources: SACOG, 2006; Bay Area Economics, 2006
NE Corridor Study Area
Sacramento County
North Sacramento

Employment Trends Table 7 documents 2005 through 2025 employment projections for the Study Area, North Sacramento, and Sacramento County.
23 SACOG projections estimate substantially lower
employment growth rates in the Study Area and North Sacramento than in the rest of the County over the 2005 to 2025 period. Local Employment SACOG estimates that in 2005, Office and “Other” categories account for 42 and 31 percent of employment, respectively, in the Study Area.
24 In North Sacramento, the “Other” category
represents 37 percent of total employment while Office employment is 29 percent. In Sacramento County, Office employment comprises the highest share of total employment, at 34 percent, while “Other” employment represents 25 percent. Retail employment accounts for the third highest concentration in all three geographies, accounting for 22 percent of jobs in the Study Area, 18 percent in North Sacramento and 19 percent in Sacramento County. In 2005, Medical and Manufacturing jobs represent the least significant employment sectors in the Study Area, each comprising only a one percent share of total employment. In North Sacramento, however, four percent of jobs are in the Medical category and seven percent are in Manufacturing. Countywide, nine percent of jobs are in the Medical category and seven percent are in Manufacturing. One large employer in the area is the U.S. Postal Service. The U.S. Postal Service distribution center and office park is located directly southeast of the Royal Oaks Station. Also noteworthy, though outside the Northeast Corridor Study Area, the USAA campus is located directly east of the Study Area and just north of Arden Way. With offices across the country, USAA provides insurance and financial products to members of the United States military community. USAA has recently reduced its work force at its location near Swanston Station and has indicated interest in leasing one of its two office buildings.
25 This space differs from other office sites within the
study area and will not likely compete for the same tenants. However, if a large office tenant were seeking space in the North Sacramento area, they would likely be drawn to the USAA site over other options in the Study Area. Projected Employment Growth SACOG projects a seven percent increase in total employment between 2005 and 2025 within the Study Area.
26 This figure is nearly five percentage points lower than the increase projected for
the North Sacramento area. Growth rates in both these geographies fall well short of the projected 25 percent increase for Sacramento County. This is partially attributable to the lack of available vacant land, combined with more competitive office and light manufacturing markets
23
SACOG baseline 2005 employment estimates based on InfoUSA 2004 employment data and official planning documents. 24
“Other” employment includes transportation, construction, utilities, and other non-land use based employment not captured through manufacturing, retail, office, medical, or education. 25
Current estimates likely include the recent consolidation of USAA operations in the Market Area. 26
SACOG projections through 2025 assume a constant share of regional employment growth based on 2005 shares of regional employment.
25

elsewhere in the Sacramento Region, including Downtown Sacramento, North Natomas, Roseville and Folsom. SACOG expects Office employment to increase by only 100 jobs through 2025. While the second-highest projected rate of employment increase within the Study Area will be in the Medical category, Medical job growth amounts to only 18 jobs from 2005 to 2025. More significantly, SACOG anticipates that Manufacturing will increase by 175 percent, or 70 jobs, within the Study Area, and that Retail employment will grow by approximately 46 jobs over the same period. The greatest employment increase for North Sacramento is expected in Manufacturing jobs, both in terms of percentage increase and absolute numbers. In Sacramento County, the Office sector exhibits the highest projected growth. Summary Like the population projections, the employment projections for the Northeast Corridor Study Area reflect the fact that the Study Area does not have large amounts of properly zoned and readily developable land to accommodate increases in employment. Although SACOG expects significant employment growth in the Manufacturing sector for North Sacramento, Manufacturing development would not likely contribute to making the Study Area more attractive for residential, retail, and office uses that would be more transit supportive and amenable to TOD developments.
26

Table 7: Employment Trends and Projections, 2005 to 2025.
Percent Change No. of New Jobs2005 2010 2015 2020 2025 2005-2025 2005-2025
Employment 3,483 3,612 3,663 3,692 3,717 6.7% 234Retail 770 782 792 805 816 6.0% 46Office 1,468 1,568 1,568 1,568 1,568 6.8% 100Medical 44 44 54 59 62 40.9% 18Educational 98 98 98 98 98 0.0% 0Manufacturing 40 57 88 99 110 175.0% 70Other 1,063 1,063 1,063 1,063 1,063 0.0% 0
Percent Change No. of New Jobs2005 2010 2015 2020 2025 2005-2025 2005-2025
Employment 48,135 49,928 52,396 53,361 53,640 11.4% 5,505Retail 8,822 8,986 9,041 9,085 9,118 3.4% 296Office 14,109 14,239 14,270 14,301 14,351 1.7% 242Medical 2,078 2,088 2,118 2,143 2,151 3.5% 73Educational 1,746 1,764 1,781 1,796 1,803 3.3% 57Manufacturing 3,397 4,160 5,283 5,954 6,037 77.7% 2,640Other 17,983 18,691 19,903 20,082 20,180 12.2% 2,197
Percent Change No. of New Jobs2005 2010 2015 2020 2025 2005-2025 2005-2025
Employment 554,278 601,655 649,423 679,173 695,365 25.5% 141,087Retail 105,342 114,793 122,511 127,194 129,882 23.3% 24,540Office 189,291 207,972 231,108 248,045 256,996 35.8% 67,705Medical 52,060 53,619 54,909 56,039 56,863 9.2% 4,803Educational 32,837 34,645 36,479 37,745 38,413 17.0% 5,576Manufacturing 37,929 45,098 48,232 50,307 51,002 34.5% 13,073Other 136,819 145,528 156,184 159,843 162,209 18.6% 25,390
Sources: SACOG, 2006; Bay Area Economics, 2006.
NE Corridor Study Area
Sacramento County
North Sacramento

Existing Real Estate Conditions
This portion of the study examines the existing real estate conditions within the Study Area. This involved a survey of available properties for sale or for lease within the Study Area. However, due to the relatively small size of the Study Area, this analysis utilizes market data from the Study Area itself as well as adjacent neighborhoods as an indicator for the general market conditions within the Study Area. Upon completing a windshield survey of the Study Area and surrounding neighborhoods, BAE contacted representatives of available property to inquire about the specific advertised buildings and also about the market trends in general. Further, BAE reviewed available real estate reports summarizing market trends in the local and regional office, retail, and for-sale housing market. Finally, BAE analyzed recent property sales in the Study Area as a means to review the competitive supply and to estimate pricing for new development in the area. Overall, this section focuses on the existing conditions for available land, office space, retail space, single-family homes and apartments. However, as in many areas across the Sacramento Region, real estate speculation, fueled by new development activity within the Study Area, will likely raise property sales prices over time. Commercial A windshield survey and subsequent research identified several available commercial sites along Del Paso Boulevard. Details acquired for eight locations revealed three sites available for lease, three sites for sale, and two that are listed for lease or for sale. Most of these properties are zoned commercial (C2) and could be filled by a range of tenants. While some sites target specific tenants, others, such as the former Senator Rollerdome building at 1031 Del Paso Boulevard, have entertained both lease and sale offers from a myriad of tenant types. Table 8 provides a summary of the current commercial real estate conditions in the Study Area. Retail Market According to several local commercial real estate brokers, most retail stores in the area serve the local community, while national retailers choose sites on the east side of Business 80. Types of tenants targeted to fill the available spaces for rent include salons, restaurants and local-serving retail stores. Currently, within the Study Area, monthly rents for street-facing retail space range from $0.50 to $3.50 per square foot, NNN,
27 with
new construction and restaurant space commanding the highest premiums. The retail spaces for sale range in asking prices from $115 to $283 per square foot, while space sold between September 2005 and August 2006 ranges from $94 to $240 per square foot. Among the
27
Under triple net (NNN) lease terms, the tenant typically pays insurance, common area maintenance, utilities, property taxes, and an assortment of other property owner costs pass-through charges that are in addition to their rent.
28

sold properties, the high rate of $240 per square foot was for a fully equipped and recently updated medical office. The remaining three commercial properties sold for an average of approximately $120 per square foot. Vacant land for commercial construction sold for $18 per square foot. A couple of real estate brokers indicated that the retail spaces they represent in this area have been easy to fill due to the high traffic counts along Del Paso Boulevard. However, a significant number of vacant storefronts along Del Paso may attest to the fact that the area is still in a turn-around phase. In addition, according to the CB Richard Ellis’ “MarketView Sacramento Retail” report for the second quarter of 2006, vacancy rates for available retail are very low within the Sacramento Region, estimated at five percent. Typically, a healthy retail market possesses a ten percent vacancy rate, with a healthy balance between supply and demand. The report indicated that the South Natomas area, which includes the Study Area, exhibited a 1.0 percent vacancy rate. Testimonies from local brokers also indicate that retail vacancies are lower in the Study Area than the overall region. Across I-80, the Arden/Watt/Howe regional retail area also had a low 3.6 percent retail vacancy rate during the same quarter. Office Market Local developers are planning a variety of office and mixed-use projects along Del Paso Boulevard in the near future. However, specifics were available for only three office locations in
the Study Area. One of these locations, Del Paso Plaza at 2111 Del Paso Boulevard, a project by Feliciano Enterprise LLC, is a mixed-use project that is slated for completion in the summer of 2007. Currently, within the Study Area, office space is leasing at an average of $1.60 per square foot with NNN lease-terms for new Class A space,
28 and at an
average $1.02 per square foot with gross or full service lease terms for older spaces.
Cornish and Carey’s “Sacramento Market Summary” for the second quarter of 2006 reports a seven percent vacancy rate for office space in North Sacramento,
29 compared with 15 percent for
the entire metropolitan area. According to local real estate professionals, there are not many office buildings in the area available for lease. Brokers for the office spaces claim that finding tenants is not a challenge as there is not a great deal of available space and competition for potential tenants. As new office construction increases along Del Paso Boulevard, the competitive conditions may change. Still, many office users in the area have been priced out of Downtown Sacramento’s Class A office space and were in search of more affordable markets
28 Under triple net (NNN) lease terms, the tenant typically pays insurance, common area maintenance, utilities, property
taxes, and an assortment of other property owner costs pass-through charges that are in addition to their rent. Gross lease terms normally split property expenses, with the property owner paying for common area maintenance, insurance, and taxes, but not utilities, security, etc. Under full service lease terms, the property owner pays all property expenses and the tenant only pays rent. 29
Does not include Northgate, North Natomas, or South Natomas areas.
29

near Downtown. In the overall Sacramento Metropolitan area, vacancy rates for Class A office space are generally higher than Class B. Colliers International’s “Sacramento Office Quarterly Report” for the second quarter of 2006 reported a 15.5 percent vacancy rate for Class A office space and 13.4 percent for Class B. This indicates continued local demand for somewhat older and more utilitarian office spaces - such as those available in the Study Area - as an affordable alternative to Class A offices.
30

Table 8: Northeast Corridor Study Area Commercial Real Estate Conditions (August 2006)
Asking AskingTotal Vacant Lease Rate Sales Rate Terms of Length Prior
Location Square Feet Square Feet $/sq ft $/sq ft Lease of Vacancy Tenants
Available Vacant Retail Space
1616 Del Paso Blvd 20,000 1,100 $1.50 NNN N/A N/A Restaurant only. Part of The Greens A-Z. Other tenants include the Supper Club and The ActorsWorkshop.
1715 Del Paso Blvd 6,500 6,500 $0.75 $119.23 NNN N/A Aardvark Parking located in rear. Across the street from Appliance a restaurant. For sale and lease.
2111 Del Paso Blvd 7,910 2,300 $2.25 NNN N/A N/A Restaurant space only. Part of Del Paso Plaza.7,910 1,300 $1.25 NNN N/A N/A Street retail space.7,910 350 $0.75 NNN N/A N/A Foot, hair or nail salon.
100 Arden Way 6,000 6,000 $3.50 NNN N/A N/A Freestanding retail pad with 22,000 sf lot.
1309 Del Paso Blvd 2,300 2,300 $282.61 N/A N/A N/A 7,500 sf lot plus additional 7,500 sf lot next door.
1011 Del Paso Blvd 2,073 2,073 $217.08 N/A N/A Silk Bar & Café Restaurant space. Large patio. Directly next to Globe station.
1031 Del Paso Blvd 11,275 11,275 $0.50 $114.67 NNN N/A Senator Black Sea Gallery Furniture seems to have acquiredRollerdome this space according to City officials. The property is
still listed as available. For sale and lease.
2419 Del Paso Blvd 50,646 0 $118.47 N/A N/A N/A Rite-Aid and Kragen Auto Parts guaranteed tenantsthrough 2013
Available Vacant Office Space2111 Del Paso Blvd 7,910 3,960 $1.20 NNN N/A N/A Del Paso Plaza, Class A office space.
2100 Del Paso Blvd 1,100 1,100 $1.27 Full Service N/A N/A Additional 1,800 sf of basement storage.
451 Arden Way 2,100 2,100 $250.00 N/A N/A N/A Includes 300 sf detached storage. Renovated in 2004. Class B office building with Art Deco façade.
continued next pageNotes: Some available properties are not entirely within the Study Area geography and expand to the 95815 ZIP Code.
Sources: Loopnet.com, 2006; Respective owners and property managers, 2006; Bay Area Economics, 2006.
Comments

Table 8: North East Corridor Study Area Commercial Real Estate Conditions (August 2006), cont.
Asking Asking/SoldTotal Vacant Lease Rate Sales Rate Terms of Length Prior
Location Square Feet Square Feet $/sq ft $/sq ft Lease of Vacancy Tenants Comments
Available Vacant Space for Office or Retail503 Arden Way 20,573 8,590 $2.00 NNN N/A N/A New building due to be completed in 2007. Includes
street retail and creative office style lofts.
2110 Del Paso Blvd 2,416 2,416 $1.03 Full Service N/A N/A Listed as office that can also be used as retail.
1709 Del Paso Blvd 1,500 1,500 $0.75 Gross N/A Recording Studio Listed as retail that can also be used for office.
Sold Space for Office or Retail2224 Beaumont Street 5,150 N/A N/A $94.17 N/A Sold 12/05 N/A 8-unit commercial building with rear parking lot
1124 Del Paso Boulevard 19,000 N/A N/A $131.58 N/A Sold 10/05 N/A Recently remodeled, 0.75 acre lot. 2211 - 2217 Del Paso Boulevard 10,250 N/A N/A $143.90 N/A Sold 10/05 N/A 4 retail spaces, 6 residential units, 0.75 acre lot 646 El Camino Avenue 2,900 N/A N/A $241.03 N/A Sold 11/05 N/A Dental office with 10 offices, 0.17 acre lot
2202 Beaumont Street 6,375 N/A N/A $18.04 N/A Sold 11/05 N/A Land only
Available Vacant Industrial Space
2323-2329 Lexington St 16,360 0 $87.10 N/A N/A N/A For investment. Currently occupied by construction,motor parts warehouse, and funeral chapel.
2275 Dale Ave 3,600 3,600 $172.22 N/A N/A N/A Garage style industrial with 0.4 acre lot.
1041 Fee Dr. 21,262 21,262 $87.01 N/A N/A N/A 15 percent office space. 0.84 acre lot.
Available Vacant Land
AskingLocation Site Size Zoning Sales Price Comments
100 Arden Way 22,000 sq ft Retail $650,000 Southeast corner of Arden and Colfax.1241 Diamond Ave 2 Acres Multifamily $799,000 Previously approved for 30 unit townhouse.
Notes: Some available properties are not entirely within the Study Area geography and expand to the 95815 ZIP Code.
Sources: Loopnet.com, 2006; Respective owners and property managers, 2006; Bay Area Economics, 2006.

Residential SACOG estimates 2,838 occupied housing units, or households, within the Study Area in 2005. Single-family homes comprise 47 percent of the housing stock, while multifamily units represent 42 percent of all housing units in the area. Mobile homes comprise the remaining 11 percent of residential units. Compared to the larger North Sacramento area, as well as Sacramento County, the Study Area is the only geography with a housing stock nearly evenly divided between multifamily and single-family units. As with many areas in Sacramento, Study Area home prices have appreciated over the past few years. In a previous study of the Swanston Station Area, BAE found that single-family home prices jumped from an average price of $84,000 per unit in 2000 to $257,000 a unit in 2005.
30 Recent market data indicate a slight cooling of the residential market
but previous year gains continue to point to for-sale housing as a strong local development opportunity. For-Sale Housing First American Real Estate Solutions (FARES) provided property transfer records for the Study Area and surrounding area from July 2005 through July 2006. During this period, there were enough single-family home transactions within the Study Area, excluding sales in the Woodlake Neighborhood, to provide a representative data sample. This analysis expanded the area to the 95815 ZIP Code in order to gather more information on the sale of multifamily units. Table 9 summarizes the residential sales data. Single-Family Residential. Between July 2005 and July 2006, there were 46 single-family home transactions within the Study Area, excluding sales in the Woodlake Neighborhood. Generally, the homes in this area are older, in fair to poor condition, with smaller living areas and fairly large lots. The median sales price was $268,500 for homes with a median of two bedrooms, 1,082 square feet of living space, and a 6,534 square foot lot. The 11-unit SurrealEstates project offers artist live/work units with three bedrooms and a detached artist studio priced between $120,210 and $225,000. These prices are subsidized with sweat-equity from the artist-homeowners. The market value of these units is estimated at around $300,000. Multifamily Residential. The analysis reviewed sales of multifamily rental properties and individual condominium sales. Due to a lack of multifamily property transactions within the Study Area, the analysis expanded the data gathering effort beyond the Study Area to the 95815 ZIP Code, which encompasses the area roughly bordered by the American River to the south,
30 Figures for 2000 are from the Swanston Station Executive Summary prepared by BAE for the Sacramento
RT Northeast Corridor study. Average sales price of homes in 2005 based on 12 sales reported by FARES in the vicinity of the Swanston Transit Station between February 2005 and February 2006.
33

Arcade Creek to the north, the Union Pacific Railroad to the west, and Ethan Way to the east. Rental Property Sales. Eight apartment complexes sold between July 2005 and July 2006 within the 95815 ZIP Code. These complexes ranged between eight and 50 units, selling for as low as $660,000 to as high as $3 million. The weighted average complex sales price of $1,969,00 translates to an average price of $74,500 per unit. During the July 2005 to July 2006 time period, there were 11 duplex, 14 quadruplex, and no triplex sales in this larger geography. These transactions refer to the sale of the entire building and not just individual units associated with it. The average price per duplex and quadruplex unit was $157,136 and $109,929 respectively. Most of the units sold in the ZIP Code were older buildings constructed in the mid-50’s and early 60’s. New for-sale duplex and triplex units would likely command significantly higher prices. New Owner-Occupied Condominium and Townhome Sales. Table 10 shows condominium and townhome sales prices in the Sacramento area, based on information from the Hanley Wood
31 and
Sperry Van Ness.32
Condominium and townhome sales prices in this larger region ranged from $146,900 to $419,990 per unit, or $167 to $343 per square foot of living area (See Table 10). Three of the projects listed are known to be condominium conversions: Alder Grove in Sacramento, Parkview Townhomes in Carmichael and Rollingwood Condominiums in Fair Oaks. These projects covered the low end of the price range, ranging from $146,900 to $255,400 per unit, or $167 to $245 per square foot. It should be noted that the vast majority of reported condominium sales were in North Natomas, a more expensive residential market. Thus, new condominiums in the Study Area would likely command slightly lower prices than those found in North Natomas, which may also result in greater market demand for such units. The most directly comparable project is the Parkview Townhomes in Carmichael. These units are selling at $202 to $221 per square foot, and units in the Study Area would need to be priced below this to compete. According to Sperry Van Ness,
33
a market study they conducted for a potential new condominium project on Norwood Avenue south of Del Paso Heights found that new condominiums in this area could sell for $260 to $275 per square foot. Based on these prices, small condominium units in the study area could be expected to command approximately $250/square foot for high-quality, new construction, and approximately $200/square foot for conversions. Per square foot prices are lower for larger units. The market for condominiums and townhomes is slowing down: between June 2005 and June 2006, the typical condominium development averaged six unit sales per month, compared to 14 sales per month in calendar year 2005. Still, for-sale condominiums persist as a key development opportunity within the Study Area because they offer market-rate ownership housing at an achievable price. A condominium or condominium conversion selling at $150,000 can be purchased by a household earning approximately $45,000 per year. For comparison, the 2006
31
Hanley Wood Market Intelligence, “Project Summary Report”, Northwest Condominium and Townhome Market, Sacramento area, June 2005 to June 2006. 32
Conversation with David Harrison, Senior Advisor, Sperry Van Ness commercial real-estate advisors, October 2006. 33
Ibid.
34

median household income in the City of Sacramento is $43,480.34
(In the Study Area, however, it is $28,137, which would qualify for a mortgage of just $89,000.) Condominiums offer entry-level buyers a more affordable alternative to single-family homes priced over $300,000. While condominium conversions offer the lowest cost housing, it should be noted that a barrier to conversions in the Study Area is the City of Sacramento’s condominium conversion ordinance of 1980. This ordinance has been difficult to interpret, and no condominium conversions have occurred within the City since it was adopted.
35 In addition, it has requirements for parking,
water metering and providing affordable units which to date have not been achievable.36
As a result, the condominium housing which is being made available through conversions in the surrounding areas may be precluded in the Study Area. Multifamily Rental Housing Due to the limited supply of large apartment complexes or other available rental units within the Study Area, the analysis expanded its geographic scope to include nearby neighborhoods. Table 11 lists the apartment complexes and rental residential market conditions for the Study Area. In addition to the new Victory Townhomes and refurbished Evergreen Estates, the windshield survey located one other large apartment complex within the Study Area, Woodlake Close. Woodlake Close is located along Royal Oaks Drive near Woodlake Elementary. All three of the complexes are in excellent condition and offer numerous unit and on-site amenities. The Townhomes and Evergreen Estates share a community center, computer lab, and children’s playground. The Woodlake Close complex includes a swimming pool, and a small fitness room for resident use. Rents at Woodlake Close range from $925 per month for a one-bedroom unit, to $1,050 for a two-bedroom apartment. The other two complexes are comprised of subsidized units rented to families earning sixty percent or less of Sacramento County median family income. In 2003, the year Victory Townhomes opened, the estimated market-rate rent for the Townhomes was between $1,200 and $1,400 per month for the three and four bedroom units.
37 This compares
to an overall weighted average monthly rent of $680 for a one-bedroom apartment and $910 for a two-bedroom unit in the Study Area. There are three medium-sized apartment complexes that reported vacancies in the Study Area. All three complexes are in fair condition with one operating as an assisted living facility. Rents for medium-sized projects were lower ranging from $500 to $750 per month. These units are an important affordable housing source. Beyond the above options, the remaining multifamily units in the Study Area are limited to small apartment complexes that are in poor condition. Many of these apartments are located in the northern half of the Study Area, including several complexes along Boxwood Street. In the northwest section of the Study Area, the older Gibson Oaks is the dominant multifamily housing complex. In the southern portion of the Study Area, these multifamily units can be found along Lochbrae Road, including single-family homes converted to multifamily units that range in
34
Claritas, October 2006. 35
James Robinson, Regional Transit, conversation October 2006. 36
Davis Harrison, Sperry Van Ness, conversation October 2006. 37
Wiener, Jocelyn. “North Sac Opens Low-cost Housing.” The Sacramento Bee. July 3, 2003.
35

condition from poor to fair. In addition, Woodlake Manor is a larger complex located at Lochbrae Road and Canterbury Road that is in relatively poor condition.
36

Table 9: Northeast Corridor Study Area Property Sales (July 2005 to July 2006)
Median MedianMedian Living Area Median # Lot Size Number of
Single-Family Sales Price (square feet) of Bedrooms (square feet) Sales
Single-Family $268,500 1,082 2.0 6,534 46
MedianLiving Area Median # Median
Median Per Unit of Bedrooms Lot Size Number of AverageMultifamily Sales Price (square feet) Per Unit (square feet) Sales Price Per Unit
Duplex $319,500 641 1.0 6,098 11 $157,136Triplex N/A N/A N/A N/A N/A N/AQuadruplex $445,000 486 1.0 7,405 14 $109,929
Multifamily, 5+ Units Sales Price Units Price Per Unit
1239 Arcade Blvd $1,370,000 N/A N/A2663 Altos Ave $1,675,000 32 $52,3441015 Arcade Blvd $1,500,000 20 $75,0002671 Fairfield St $3,000,000 50 $60,0002620 Connie Dr. $1,025,000 10 $102,500733 Dixieanne Ave $1,950,000 30 $65,0002423 Boxwood St $740,000 10 $74,0002335 Boxwood St. $660,000 8 $82,500
Weighted Average $1,968,938 23 $74,500
Notes: Single-family housing data represents transactions within the Study Area geography, excluding the Woodlake neighborhood. All other transactions took place in the 95815 ZIP Code.Reported median figures calculated separately for each category.
Sources: First American Real Estate Solutions, Inc., August 2006; Bay Area Economics, 2006.

Table 10: New Condominium and Townhomes Sales, Northwest Sacramento, June 2005 - June 2006
Project/Builder Location Type Unsold Units Base Price Range Finished Square Feet Price Per Square Foot
Westlake Villas/ Natomas Condo 0 $288,400 - $395-625 840 - 1,382 $286 - $343Meer Capital Partners
Amara/ Natomas Condo 0 $205,900 - $325,900 763 - 1,338 $244 - $270Pacific West Builders
Parkplace at Regency Park/ Natomas Condo 38 $221,990 - $354,990 763 - 1,464 $242 - $291U.S. Home Corporation
Hampton Village/ Natomas Condo 208 $249,000 - $344,000 1,089 - 1,964 $175 - $229KB Home
Carriage Lane/ Natomas Condo 98 $287,990 - $351,990 1,156 -1,650 $213 - $249D.R. Horton
Villa Maison/ Natomas Condo 181 $299,990 - $399,990 1,293 - 1,650 $232 - $242D.R. Horton
Serenade at Regency Park/ Natomas Condo 125 $270,000 - $310,000 1,254 - 1,453 $213 - $217Warmington Homes California
Garden Villas/ Natomas Condo 63 $254,900 1,000 $255Palace Development
Alder Grove/ Sacramento Condo conversion 0 $146,900 - $187,900 880 - 1,025 $167 - $183Alder Grove LLC
Discovery Collection/ Natomas Townhomes 115 $284,990 - $359,990 1,027 - 1,837 $196 - $277Beazer Homes
Landing Collection/ Natomas Townhomes 35 $309,990 - $419,990 964 - 1,871 $224 - $321Beazer Homes
Parkview Townhomes/ Carmichael Condo conversion 21 of 34 $209,900 - $279,900 950 - 1,350 $202 - $221Parkview Townhomes LLC
Rollingwood Condominiums/ Fair Oaks Condo conversion $149,900 - $255,400 680 - 1234 $192 - $245Rollingwood Condominium Homes, LLC
Sources: Hanley Wood, LLC, 2006; Sperry Van Ness, 2006; Bay Area Economics, 2006.

Table 11: Northeast Corridor Study Area Multifamily Residential Market Conditions (August 2006)
Name Total Number Unit Size of Apartment Year Number of Units Unit (square Monthly
Address Complex Built of Units Available Type Quantity foot) Rent
2059 Royal Oaks Woodlake Close 1987 76 N/A 1-Bedroom 14 850 $925 Close to Royal Oaks station, markets RT stop as an2-Bedroom/ 62 1,000 $1,050 amenity. One of the newer complexes in the area
2-Bath and in the best neighborhood.
3024 Howe Ave. Olive Orchard 1985 15 N/A 1-Bedroom 7 600 $595 About 2% of the tenants live 5 minutesApartments 2-Bedroom/ 8 750 $775 from their work. The manager believes rents for the
1-Bath complex reflect the medium range of the local rentalmarket. North of Swanston Station, near Marconi.
1611 Cormorant Way Ashley Place n. avail. 48 4 Studio 8 520 $520 The apartment complex does provide affordable housing.Apartments 1-Bedroom 8 755 $755 Strong mix of tenants with most demanding 2-bedroom units.
2-Bedroom/ 32 1,000 $1,0001-Bath
2453 Rio Linda Blvd. Palm Lake 1951 40 13 1-Bedroom 28 500 $675 Manager tries to keep the quality of Palm Lake ApartmentsApartments 2-Bedroom/ 12 600 $775 higher than the neighboring apartments, and charges $100
1-Bath more than his competitors accordingly. Recently installed new windows. Vacancy can range from 10%-50% and always has units available. Mostly families.
733 Dixieanne Ave. Fountain 1971 30 0 1-Bedroom 30 550 $575 The complex was renovated Q1, 2005. It is currentlyGardens on the market, priced at $2,460,000 ($82,000/unit)
2228 Royale Rd. Arden Fair 1990 111 N/A Studio 4 500 $595 The units in greatest demand are the twoApartments 1-Bedroom 49 725 $675 bedroom apartments. The tenant composition is mixed.
Rents reflect the medium range of the local rental2-Bedroom/ 25 820 $705 market.
1-Bath (small)
2-Bedroom/ 25 900 $7551-Bath (large)
2 bedroom/ 8 975 $9002-Bath
Sources: Respective Owners & Property Managers, Bay Area Economics 2006
Comments

Potential Development Sites Throughout the Study Area there are vacant land parcels, lots for sale, and under-utilized lots that present development opportunities. However, many of the vacant sites along the commercial strips of Del Paso Boulevard, Arden Way, and El Camino Avenue do not display any signs of development. A local real estate professional confirmed that some owners are still holding onto the lots and are not ready to sell them. However, a survey of the area revealed several lots along Del Paso Boulevard displaying “for sale” signs. Opportunity Sites As the focus of this study is transit-oriented, mixed-use developments near the light rail stations, this section of the report concentrates on opportunity sites in the vicinity of the stations. This listing of opportunity sites does not investigate environmental barriers to development. Globe Station Through the windshield survey, BAE identified a concentration of vacant and under-utilized sites in the area of Globe Station. Figure 4 highlights the many vacant, under-utilized, and for-sale parcels along Del Paso Boulevard within the Globe Station area. As many of these parcels are adjacent to one another, this area may present an opportunity for parcel assemblage that could enable a large-sized project to be developed along a major commercial corridor. Arden/Del Paso Figure 5 displays the opportunity sites in the vicinity of the Arden/Del Paso Station. Parking lots and a car dealership along Arden Way represent highly under-utilized land close to the light rail station. While vacant and under-utilized parcels continue to plague Del Paso Boulevard in this area, they are more dispersed and, as a result, are more conducive to smaller infill development efforts. Royal Oaks As Figure 6 shows, the greatest opportunity site near the Royal Oaks Station is the currently vacant office building on the southeast corner of Royal Oaks Drive and Arden Way (2005 Evergreen Street). This 150,000 square-foot building was formerly occupied by Teale Data Center and has been vacant for over five years.
38 According to economic development staff with
the City of Sacramento, the owner, JB Company, is in the final stages of leasing 85,000 square feet of the building to a State agency. While other smaller parcels across Arden Way are vacant or under-utilized, the large office building has the ability to capture momentum from the nearby Lumberjack project and increase the number of employees and potential transit riders to the area without necessarily requiring a significant amount of new construction.
38
Based on information from City of Sacramento staff.
40

Figure 4: Globe Station Area Opportunity Sites
Legend Vacant
Underutilized
For Sale
Planned or Proposed project
Transit Station

SurrealEstates
Figure 5: Arden/Del Paso Station Area Opportunity Sites
Legend Vacant
Underutilized
For Sale
Planned or Proposed project
Transit Station

Lumberjack Site
Figure 6: Royal Oaks Station Area Opportunity Sites
Legend Vacant
Underutilized
For Sale
Planned or Proposed project
Transit Station
Planned and Proposed Projects The following section investigates current planned and proposed projects in and near the Study Area. Planned and proposed development provides insight into the future competitive supply and potential changes in local real estate market conditions. Table 12 summarizes the planned and proposed developments for the Study Area and adjacent areas. In general, the planned and proposed projects submitted to the City for review are smaller infill projects that will have limited impact on the overall supply of available commercial or residential space. Larger-scale projects are in the early planning process but only a few projects have been formally submitted to the City. Commercial As stated above, there are several commercial and mixed-use projects in the early planning and discussion phases.
39 While there seems to be a great deal of activity, not many formal project
proposals or plans have been submitted for approval. One of the projects is planned on the Sacramento RT-owned Lumberjack site near Royal Oaks Station. A team comprised of New Faze Development and Fulcrum properties has preliminary plans for 107 residential units over retail at this location. Another New Faze project proposed at 2001 Del Paso Boulevard consists of approximately 4,250 square feet of retail space, 13,300 square feet of office space, and 27 condominium units. In addition to these two sites, there are plans for development throughout the Study Area. However, most of the developer interest, with the exception of the Lumberjack site project, is centered around Del Paso Boulevard, which will impact the Globe and Arden/Del Paso station areas more directly than the Royal Oaks station area. Two commercial developments within the Study Area are currently in the planning review process. One project will be located along El Camino Avenue at Erickson Street, in the northeast section of the Study Area. This retail site was discussed as a potential ground lease to a fast food establishment, though this plan has been met with considerable opposition. The second Study Area project is the proposed three-storey office and retail building at 503 Arden Way, planned by Friedlander of LIMN. This site is already pre-leasing, as noted in Table 8. Another development site currently seeking a tenant is on Arden Way, just west of Del Paso Boulevard. Currently, there are limited details available for anticipated tenants at this 6,000 square foot retail project at 100 Arden Way. Construction has begun on a fourth project that will be located just to the northwest of the Study Area, at the intersection of Rio Linda Boulevard and El Camino Avenue. This project will be a 4,425-square-foot commercial building with a drive-through Starbucks and space for an additional retail store. The drive-though indicates limited attention to its proximity to transit stations, since TOD projects ideally emphasize pedestrian access. Residential There are three single-family residential units proposed in addition to the recently completed SurrealEstates project. One of these homes is within the Study Area boundaries, while two are to the north and northwest, across El Camino Avenue and Del Paso Boulevard. While small residential projects, they represent market-driven housing projects without subsidy. Signature Properties has also secured approval to build 80 market rate, two-storey, detached, three and four bedroom, single-family homes within the Study Area. These housing units will reportedly be
39
Based on discussion with the SHRA North Sacramento Redevelopment Planner.
44

priced in the mid-$200,000 range. A fourth project is in the very early stages of planning, but City sources suggest that this development could involve construction of a three to four-storey multifamily structure in the vicinity of the Globe. This represents a significant shift, considering the limited private investment in the Study Area.
When the single family projects are added to the 27 condominium units in the New Faze application for 2001 Del Paso Boulevard, a total of 110 residential units are already underway. The projects still on the drawing board are currently programmed to add over 200 more units. The activity shows that the Study Area has been recognized as having significant potential for residential development. The lower price-point of the planned Signature Properties residential development, compared to areas such as Midtown and Downtown, indicates that this area of Sacramento may be well positioned to provide opportunities for home ownership to the City’s workforce population, especially those working in or near Downtown, for whom light rail access would be convenient. However, it is likely that if all these projects are built, the large number of units will take several years to absorb.
45

Table 12: Current Development Applications in the Northeast Corridor Study Area and Vicinity
Location Type Status Comments
Within the Study Area503 Arden Way Office/Retail Under Review Friedlander: New 23,668 square foot, 3-storey office and commercial
mixed-use building.
100 Arden Way Commercial Approved 6,000 square feet of new retail space. Targeting food users
965 El Camino Ave. Commercial Under Review Petrovich Development Company: Ground lease to food vendor.
2001 Del Paso Blvd. Mixed-use Under Review 50,580 square feet with 27 residential units, office, and retail.
670 Dixianne Ave. Residential Completed October 2006 11-unit artist live-work project.
900 El Camino Av. Residential Approved Signature Properties: 60 new single-family units .
2320 Evergreen St. Residential Approved Signature Properties: 20 new single-family units .
2300 Evergreen St. Residential Under Review Demolition and new single-family residential construction.
2635 Selma St. Residential Under Review New single-family residential.
Near the Study Area2465 Rio Linda Blvd. Commercial Under Construction 4,425 square feet of Multi-Tenant retail with drive through facility.
635 Santiago Ave. Residential Under Review New single-family residential unit.
Sources: City of Sacramento Development Services Department, Planning Division, 2006; Bay Area Economics, 2006.

Neighborhood Retail Sales Leakage/Injection
This portion of the study examines the existing balance of retail supply and demand, to determine whether there are opportunities for additional neighborhood services and amenities in the Study Area for transit users, residential, and office uses. This portion of the analysis uses data from Claritas Inc., a private demographic vendor, and MuniServices, the City’s sales tax consultant, to determine the existing expenditure leakages or injections for distinct retail sectors within the Study Area. If the estimated consumer expenditures are greater than the actual retail sales for a given retail sector, then there is a leakage in that sector. In other words, retail dollars that could be captured locally are being spent outside the area because they are not sufficiently available within the Study Area. In order to maintain the confidentiality of specific stores in the Study Area, no sales tax figures are disclosed in the Existing Retail Sales portion of this analysis. Table 13 shows the retail leakage calculations for the Study Area, using demand estimates and actual retail sales figures for 2005. Existing Retail Sales. MuniServices estimates that in 2005, the Study Area generated approximately $1.3 million in sales tax revenues for the City. The majority of this revenue came from miscellaneous vehicle sales, auto part sales, wholesale building materials, and used car sales. The Study Area contains several used car lots, as well as service and repair shops. There are also recreational vehicle sales lots that fall into the miscellaneous vehicles category. MuniServices estimates that several retail categories in the Study Area do not contribute any sales tax revenues for the City. These sectors include stores specializing in recreation products, electronic equipment, and apparel sales. Although some of these products are sold in the area, they are not the primary good that determines the category of the retail venue in which they are sold. It should be noted that MuniServices does not report sales tax data that would reveal confidential business income information. If there are fewer than four businesses in a particular retail category (for example, liquor stores and gasoline stations in the Study Area), this data would be reported under “Miscellaneous” rather than broken out by category. Since the Study Area abuts the Arden Fair area, BAE does not recommend additional stores located within the Study Area that provide apparel, electronic equipment, or recreation products to local residents. The Arden Fair retail area draws significant retail demand from surrounding communities throughout the region and has a distinct competitive advantage due to its existing critical mass of regional and destination retail stores. In addition, Costco and REI are located directly south of the Study Area, further reducing retail opportunities for sporting goods and major retail purchases. Retail in the Study Area should focus on convenience and neighborhood goods that serve residents, employees and transit patrons in the immediate area. Estimated Expenditures. Claritas provides estimates of consumer demand for households located within the Study Area, using expenditure estimates derived from the Bureau of Labor Statistics’ Consumer Expenditures Survey (CEX). According to Claritas estimates, the highest estimated consumer expenditures (demand) in the Study Area are associated with motor vehicle and parts dealers, food and beverage stores, general merchandise, and eating and drinking places.
47

Study Area households have minimal demand for sporting goods, hobby, books, and music stores; miscellaneous store retailers; clothing and clothing accessories; and furniture and appliances. The column titled “Estimated Consumer Expenditures” in Table 13 shows these figures. Leakage/Injection. The Study Area retail supply should satisfy the demand for convenience retail goods, to ensure that these items are located within an easy distance of most market area residents. Eating and drinking places and food and beverage stores make up the bulk of convenience retail. Certain health and personal care stores can also fall into the convenience retail category. As shown in Table 13, the Study Area demonstrates retail leakage for food and beverage stores, health and personal care stores, and eating and drinking places, totaling $4.2 million. Conversely, the data suggest that people living outside the Study Area are coming into the Study Area to purchase products in the motor vehicles and parts category, in which the Study Area supply exceeds demand by over $48 million. In order to encourage development that would generate foot traffic within the Study Area and enhance the attractiveness of the area for residential uses in particular, the City should focus on drawing additional convenience and pedestrian-friendly, neighborhood-serving businesses to the area. The data suggest that the area is currently lacking food and beverage stores, health and personal care stores, as well as restaurants. With an estimated leakage of $1.5 million annually, eating and drinking places represent the greatest loss of local expenditures in the Study Area. Using an estimated median sales figure of $307 per square foot,
40 the Study Area could
potentially support approximately 5,000 square feet of additional restaurant space. In addition, the retail leakage analysis shows that $1.4 million of local demand for conventional grocery store goods is currently lost to outlets outside the area. Based on SACOG minor zone projections for 2005, there are an estimated 8,400 homes and 23,900 residents within a 1.5-mile radius of the intersection of Del Paso Boulevard and Arden Way. A radius of 1.5 miles is considered the standard market area for a supermarket, and a conventional supermarket store such as Safeway typically requires 10,000 to 15,000 people within its trade area for adequate market support. Although Costco, located just south of State Route 160, likely captures a large share of local grocery demand, the less-traditional grocery model requires bulk purchases and will not meet the needs of all shoppers. There are also many smaller convenience and ethnic food markets throughout the 1.5-mile area. While the nearby Costco makes the attraction of another large supermarket within the Study Area a challenge, the large number of rooftops in the 1.5-mile radius combined with the grocery store retail leakage data for the Study Area indicates a potential for a grocery store within the Study Area, if it can be located to have good access and visibility to residents of the larger 1.5-mile area, ideally on either El Camino Avenue, Arden Way, or Del Paso Boulevard. There also seems to be a need for additional drug store space, and this use is generally transit friendly, in that shoppers do not often leave a drug store with multiple heavy parcels. However, based on the retail leakage analysis, there is only enough unmet demand in the Study Area to
40 Based on Urban Land Institute’s Dollars and Cents of Shopping Centers: 2004 reported median sales per
square foot of restaurant tenants in neighborhood shopping centers in the western U.S.
48
support a health and personal services store of approximately 2,000 square feet.41
This is not sufficient to attract a national chain drugstore, especially with the competing Rite-Aid on the edge of the Study Area at Del Paso Boulevard and El Camino.
41
Based on Urban Land Institute’s Dollars and Cents of Shopping Centers: 2004 reported median sales per square foot of $596 per square foot for drugstores/pharmacy tenants in neighborhood shopping centers in the western U.S.
49

Table 13: Northeast Corridor Study Area Retail Leakage Analysis, 2005
Estimated ActualRetail Consumer Expenditures Retail Sales Retail Sales
Category (Demand) (Supply) (Leakage)/Injection
Motor Vehicle & Parts Dealers (a) $13,094,102 $61,194,400 $48,100,298Furniture & Appliances $2,828,561 $12,047,700 $9,219,139Building Material, Garden Equip Stores $5,084,805 $2,733,800 ($2,351,005)Food & Beverage Stores (b) $9,195,464 $7,824,651 ($1,370,813)Health & Personal Care Stores (c) $3,235,172 $1,868,429 ($1,366,743)Gasoline Stations $6,034,846 $0 ($6,034,846)Clothing & Clothing Accessories Stores $2,791,227 $0 ($2,791,227)Sporting Gds, Hobby, Book, Music Stores $1,178,522 $0 ($1,178,522)General Merchandise Stores $7,913,433 $0 ($7,913,433)Miscellaneous Store Retailers $1,615,957 $7,497,900 $5,881,943Non-Store Retailers $3,493,078 $0 ($3,493,078)Eating & Drinking Places $7,087,928 $5,576,200 ($1,511,728)
Notes:(a) Includes auto and other motor vehicles.(b) Actual retail sales figures for food and beverage stores are based on the assumption that taxable sales represent 43 percent of total food store sales.(c) Actual retail sales figures for drug stores are based on the assumption that taxable sales represent 70 percent of total drug store sales.
Sources: Thompson Associates, 2001; City of Sacramento, 2006; Claritas, 2006; Bay Area Economics, 2006.

Projected Increase in Land Use Demand
Tables 14 and 15 report high and low estimates of anticipated increases in demand for retail, office and housing within the Study Area through 2025. The low estimate is based on current SACOG projections for the Study Area as reported in Tables 6 and 7 of this analysis. This low estimate is extremely conservative as it does not take into consideration recent development trends. The high estimate is based on the current SACOG estimated population, office employment and household growth rates for Sacramento County as a whole through 2025, and applies those growth rates to the 2005 Study Area. The high estimate suggests that with the removal of barriers to development within the Study Area, the station areas can grow in a manner that parallels the rest of the County. The high estimates provide a reasonable indicator of the enhanced growth potential of the area, assuming that efforts are made to address the area’s historical challenges to development. Although it is possible that some locations within the County will exceed the average growth rate, this will likely occur in greenfield areas where there are no significant physical or economic barriers to growth and ample vacant land. For an area such as the Study Area, that must overcome existing barriers to development and that must rely on substantial redevelopment in order to accommodate growth, achieving a growth rate that mirrors the overall County growth rate would be a significant accomplishment. It should be understood that certain policy decisions could result in a station area capturing more than the high end projection reported here. However, with development efforts focused on transit stations throughout the City, it is important to highlight that land use demand across the City and region is finite and if one station captures more than its “fair share” of development, it may come at the expense of development in another station area. Projected Increase in Residential Demand The conservative estimate of housing demand is 65 units through 2025, and the more aggressive estimate - assuming that the Study Area will grow at the same rates as the County of Sacramento – is 520 units through 2025. The analysis uses a vacancy adjustment of five percent. Already, the 110 units planned in the Study Area by Signature Properties, New Faze Development and private individuals exceed the low estimate, highlighting the rapidly changing development environment within this area. Based on the focus being brought to this area by the City, Bay Area Economics believes that the actual demand is likely to be close to the high end of the projections. Achieving the high-end projection will depend on successful redevelopment of under-utilized sites for housing, supported by comprehensive efforts to make the neighborhood more attractive through public improvements, attracting new retail and addressing concerns for public safety. Projected Increase in Office Demand Based on SACOG office employment projections, office space demand over the next two decades ranges from 28,000 to 146,000 square feet. These figures are calculated using an estimate of 250 square feet of space for each additional employee, and include a ten percent vacancy adjustment. Due to nearby areas with more competitive sites, such as the USAA site, the Study Area will probably experience more modest growth, concentrated in small professional office spaces, likely in quantities closer to the lower end of the potential demand range.
51

Projected Increase in Neighborhood-Serving Retail Demand Table 14 reports high and low estimates of the increase in neighborhood retail demand within the Study Area through 2025. The projected increase in demand focuses on the neighborhood-serving retail sectors of food and beverage stores, health and personal care stores, eating and drinking places, and a portion of miscellaneous store retailers that include florists and other specialty shops oriented towards local consumers. As described in the previous section, due to the proximity to the Arden Fair Mall area and other major retail venues, new retail opportunities in the Study Area are generally limited to local-serving outlets. The current per capita demand is calculated using the expenditures reported in Table 13 and the SACOG estimate of Study Area population in 2005. The low estimates of projected retail demand are calculated using current SACOG population projections for the Study Area, as reported in Table 6. These conservative figures represent the potential increase in consumer demand without any significant changes occurring in the Study Area. The high estimates use the more generous assumption that the Study Area will grow at the same pace as the rest of Sacramento County. Since the retail demand is based on population projections, it shows the same wide range as the housing demand. While eating and drinking places, food and beverage stores, and health and personal care stores comprise the current unmet demand for neighborhood retail in the Study Area, significant increases in demand are anticipated for food and beverage stores and eating and drinking places. The anticipated increase in demand for food and beverage stores through 2025 ranges from $194,000 to $1,819,000. The demand increase for eating and drinking places through 2025 is between $150,000 and $1,402,000. As with housing demand, Bay Area Economics believes that the actual demand is likely to be closer to the high end of the projections, due to the attention being paid to this area by the City. Overall, the projected increase in demand ranges from $430,000 to $4,021,000 while current unmet demand equals $4,249,000. These retail demand estimates are then converted into square feet using the median sales per square foot figure - $357 per square foot - reported by the Urban Land Institute for neighborhood shopping center tenants in the western region of the United States.
42 Adjustments for non-retail stores, such as dry-cleaners and other service providers, and a
vacancy allowance results in a final estimate of 17,000 to 30,000 square feet of additional neighborhood retail space that the Study Area residents will be able to support through 2025. These projections do not include additional retail demand from office workers in the area. Reliable data sources are difficult to obtain regarding office worker spending patterns, due to high variability in spending related to the type of retail stores available near the office location. However, a typical figure used is five dollars per office employee, per day. A high estimate of new office jobs can be generated by increasing current Study Area office jobs of 1,470 as reported in Table 7, by the County’s projected office employment growth rate through 2025 of 36 percent. Thus the potential 530 new office employees would demand approximately $662,500 of retail sales which could support an estimated 1,900 square feet of retail space. This additional demand is not substantial.
42
Urban Land Institute. Dollars and Cents of Shopping Centers: 2004.
52

The City should focus on drawing additional neighborhood-serving businesses to the Study Area. Such retail outlets encourage foot traffic and would supply the current and future neighborhood residents, transit patrons and workers with necessary services and goods. Since the location formerly considered for Raley’s grocery store at El Camino and Erickson is now being developed as housing by Signature Properties , there are not many locations in the Study Area suitable for a large grocery retailer. However, North Sacramento remains under-served by grocery stores, and a location close to the Study Area has the potential to capture demand from the larger region while remaining within a walkable distance. Increasing population in the Study Area will also increase the demand for food and beverage sales within the neighborhood, so that a smaller grocery store serving local residents’ everyday needs is another potential option for the Study Area. Such a retail outlet should be bolstered by other complementary stores, such as a florist and a dry cleaner, to further enhance the products and services available to the neighborhood. As the Study Area resident and employee populations increase, restaurants and other food and beverage establishments are likely to emerge to serve them. While these retailers should be encouraged to locate in the Study Area, they are not likely to require efforts on the part of the City to attract them to these locations. The new Starbucks currently under construction at 2456 Rio Linda Boulevard and another new food vendor at 965 El Camino Avenue underscores the competitive nature of this retail sector and its ability to respond to changing consumer demand. Note that the retail demand projected is specifically for neighborhood convenience retail. To the extent that over the long term this area is able to create a destination, it will support additional commercial space in the categories of community and regional retail which draw people from surrounding areas. Examples might include destination restaurants and specialty retail such as furniture or art furniture. Projected Increase in Land-Use Demand for Combined Northeast and Swanston Study Areas A previous BAE report analyzed the market around the adjacent Swanston Station, using a Study Area which overlaps substantially with the one defined for this study
43. For the combined
Swanston and Northeast Corridor Study Areas, the residential demand growth is estimated at 68 units conservatively, or 536 units at the high end.
44 The combined demand for retail land-uses in
the two Study Areas is also only slightly higher than the demand for the Northeast area alone. The exception to this is the office sector, where a significant amount of additional office development is projected for the eastern portion of the Swanston area, which is not also in the Northeast Study Area.
43
“Draft Swanston Study Area Market Analysis”, Bay Area Economics, February 2006. 44
Combining the Study Areas adds very few units, since they overlap quite substantially. In addition, the eastern section of the Swanston Study Area - which is not part of the Northeast Line Study Area - is primarily commercial, and adds very little to the residential demand.
53

Table 14: Study Area Projected Increase in Neighborhood-Serving Retail Demand, 2005-2025
Additional Retail Additional RetailEstimated Per Capita Demand 2025 Demand 2025
Expenditures 2005 (a) (low estimate) (b) (high estimate) (c)
Food & Beverage Stores $1,888 $194,443 $1,819,251Health & Personal Care Stores $664 $68,410 $640,054Miscellaneous Store Retailers (d) $166 $17,085 $159,852Eating & Drinking Places $1,455 $149,878 $1,402,291
Total Projected Demand Increase $4,173 $429,816 $4,021,448Current unmet neighborhood retail demand $4,249,284 $4,249,284
TOTAL ADDITIONAL NEIGHBORHOOD RETAIL DEMAND $4,679,100 $8,270,732
Additional Supportable Square Feet @ $357 annual sales/square foot (e) 13,107 23,167w/ 14% non-retail adjustment (square feet) (f) 15,240 26,939w/ 10% vacancy adjustment (square feet) (g) 16,934 29,932
Notes:Does not include additional retail demand generated by new office workers in the Study Area, community or regional retail if the Study Area becomes a regional destination, or potential demand for a grocery store to serve the larger trade area.(a) Calculated based on 2005 estimated consumer expenditures reported in Table 13 and SACOG 2005 Study Area population estimatesreported in Table 6.(b) Based on SACOG projected Study Area population increase through 2025 as reported in Table 6.(c) Based on SACOG Study Area 2005 estimate and projected population percentage increase for Sacramento County through 2025.(d) Assumes 50% of Miscellaneous Retail demand is for neighborhood serving stores such as florists and other convenienceretailers(e) Based on ULI Dollars and Cents of Shopping Centers: 2004 median sales per square foot of all neighborhood shopping center tenants in the western U.S.(f) Adjustment to account for an additional 14 percent for non-retail outlets (business and personal services).(g) Adjustment to account for a ten percent vacancy allowance.
Sources: Claritas, 2006; SACOG, 2006; ULI Dollars and Cents of Shopping Centers: 2004; Bay Area Economics, 2006.

Table 15: Northeast Corridor Study Area Projected Increase in Land Use Demand, 2005-2025
Additional Land Use Additional Land UseDemand 2025 Demand 2025
(low estimate) (a) (high estimate) (b)
Neighborhood Retail (square feet) (c) 16,934 29,932
Office (square feet) (c) 27,778 145,853
Housing (units) (e) 65 521
Notes:(a) Based on SACOG projected Study Area population, office employment and household increases through 2025as reported in Tables 6 and 7.(b) Based on SACOG Study Area 2005 estimate and projected percentage increases for Sacramento County through 2025 for population, office employment, and households as reported in Tables 6 and 7.(c) See Table 14 for detailed calculations. Does not include additional retail demand generated by new officeworkers in the Study Area, community or regional retail if area becomes a regional destination, or potential demandfor a grocery store to serve the larger trade area.(d) Calculated using 250 square feet for each additional office worker with an added vacancy adjustment of ten percent.(e) Calculated using household projections reported in Table 6 with an added vacancy adjustment of five percent.
Sources: Claritas, 2006; SACOG, 2006; ULI Dollars and Cents of Shopping Centers, 2004; Bay Area Economics, 2006.

Market Study Conclusions
The Northeast Corridor Study Area presents strong opportunities for redevelopment and infill projects. All three station areas - Globe, Arden/Del Paso, and Royal Oaks - possess vacant and under-utilized parcels that are well suited for transit-oriented development. Overall, the Study Area has potential to capture a strong increase in housing demand with more moderate demand for office and retail space. As the purpose of this report is to provide background for potential policy decisions to promote TOD in the Study Area, this study addresses the overall market trends for residential, office, and retail, with focused analysis of the challenges and potential development opportunities at each of the three immediate station areas along Del Paso Boulevard and Arden Way. Table 16 presents a summary of transit-oriented development opportunities at each of the three station areas for both the near-term (three to five years) and the long-term (over five years). Residential Overall, within the Study Area, housing will likely lead development efforts, with retail and office projects following once the area increases in population and vitality. Already, private investors have demonstrated significant commitment and developed property in the study area. Additionally, Signature Properties is planning a residential project in the area. SHRA has led successful redevelopment efforts to rehabilitate area housing and invest in local infrastructure and streetscape improvements. Additional efforts to promote arts in the redevelopment of the area can only inject further interest among potential homebuyers by creating a vibrant atmosphere with the type of cultural amenities desired by urban residents. These efforts, combined with rising home prices in surrounding areas, can catalyze new residential development within the Study Area. If the Study Area is able to grow at a rate that parallels the rest of the County through 2025, the projected number of new housing units over that time period would be about 520 units. This would represent about a 22 percent increase over the number of existing households. Specifically, local and regional demand for entry-level housing indicates an opportunity for condominium construction. Condominium construction can vary in density but projects should be dense enough to offer units at a lower price than suburban houses. Developers nationwide have indicated their reluctance to build attached housing due to the need to establish homeowner’s associations to address common area maintenance issues, and the construction defect liabilities that accompany building this type of housing. However, the Sacramento area has seen a significant increase in the construction of attached housing, which has gone from less than one percent to over 25 per cent of all new home sales in the area since 2002.
45 The 107
planned units on the Lumberjack site at the Royal Oaks station shows the market potential for this type of development near transit facilities. Multifamily Rental Housing The Study Area demonstrates limited demand for additional market rate rental housing. Currently, existing market rents are around $1.00 per square foot, which do not justify new
45
“Earlybird Economic Forecast ‘07”, The Gregory Group, October 2006.
56

multifamily construction without subsidies. In addition, rents have remained relatively constant over the past five years. Considering prevailing rents for well-maintained properties, new rental housing would not generate sufficient income to justify construction. Subsidized affordable housing – either new or rehabilitated - presents the most feasible rental housing opportunity under current conditions. Low market rents significantly reduce the near-term potential of multifamily rental projects at all three station areas. However, as development activity increases in the Study Area, increased residential demand may shift market conditions in favor of new market rate apartment projects. Such high-density projects could present an excellent TOD opportunity at all three station areas. Already rental units comprise a portion of the mixed-use project planned at the former Lumberjack site near the Royal Oaks Station. A multifamily project in the vicinity of Globe Station is also in the very preliminary planning stages. For-Sale Housing The for-sale residential market has experienced a dramatic upward shift over the past five years, leading to renewed development interest in an area historically absent of private investment. Buyers’ pursuit of more affordable housing markets has led to renewed interest in North Sacramento and specifically the Study Area. There are a number of planned and proposed for-sale residential projects within the Study Area. They present a reversal of over two decades of disinvestment in the area. Combined with declining affordability of single-family homes, local and regional demographic shifts spawn demand for smaller, more urban housing products. The increasing share of non-family households and family households without children in the region is generating renewed market interest in urban housing with easy access to employment centers and local retail amenities. With an already low percentage of family households, the Study Area’s demographics indicate that the area is already proving appealing to urban dwellers such as singles and couples without children who should be attracted to the close-in location, and light rail access to downtown. Still, the Study Area continues to face barriers in regard to limited local retail amenities. As additional redevelopment and other public and private investments continue to improve the area, it will become more appealing to non-family households and family households without children. In turn, adding more quality housing units will help to increase Study Area expendable incomes, making the area more attractive for neighborhood-serving retailers. Considering existing and future market characteristics in the residential neighborhoods of the Study Area, for-sale residential densities should be at least 15 to 25 dwelling units per acre, comparable to the Metro Square Project at I Street and 26th Street in midtown Sacramento. A mixture of small-lot detached (e.g., zero lot line), townhome, and high-density condominium housing presents the best near term opportunities for residential development. It is likely that this housing would be more “workforce” oriented as compared to the luxury high-rise residential projects currently slated for downtown Sacramento. This means that the housing in the Study Area would likely appeal to those prospective buyers who find the luxury downtown units above the price range they can afford. This finding is similar to the residential recommendations reported in the Market Analysis Implementation Strategy: 2004-2009, for the North Sacramento
57

Redevelopment Project Area.46
In contrast, near the transit stations themselves, high-density condominium projects are the most suitable for TOD, with 50 to 100 units per acre, comparable to buildings such as the Fremont Mews or the Fremont Building in Sacramento. Such high-density housing units could be part of a mixed-use development or a stand-alone project. Placing high-density housing near the transit stations increases the likelihood of residents using transit to commute to work. In addition, high-density housing would add households and pedestrian activity to the Study Area, increasing the potential for attracting retail and restaurants to the commercial corridors. The strong market trends in for-sale residential housing suggest that high-density condominium construction is the most viable TOD opportunity in the near-term for all three station areas. The larger (as compared to rental housing) revenue potential increases the likelihood of private investment and the willingness of developers to work collaboratively with the City to address existing market barriers. In the long-term, if regional housing pressures continue to increase while barriers to development at each of the station areas are addressed, all three stations will continue to exhibit strong development potential for this type of project. Office While local office vacancy rates are relatively low, office lease rates for new space also remain relatively low, at an average of $1.60 per square foot per month. Lease rates are well below rates necessary to justify stand-alone new office construction. Still, low office vacancy rates demonstrate potential demand for small-scale professional offices as part of mixed-use developments. These spaces must remain affordable compared to the region overall, as the Study Area has few competitive market advantages to attract office tenants. Study Area office space would not be able to compete if priced similar to Downtown, Midtown, and East Sacramento office markets. Thus, new office development should focus on smaller professional tenants and non-profit organizations interested in locating near the light rail stations and/or Del Paso Boulevard who have been priced out of Class A office space in other regional sub-markets. The Study Area demonstrates little ability to compete for large office tenants. Such tenants are likely to consider the vacant USAA office space at the nearby Swanston Station that has only recently been put on the market along with the vacant former State of California Teale Data Center building at the Royal Oaks Station. However, the large size of these office spaces will require a specific type of office tenant that will not compete with the smaller office spaces mentioned above. Again, the Market Analysis Implementation Strategy for the North Sacramento Redevelopment Project Area similarly noted a potential demand in “small to medium-scale floor space-type tenants” with little projected new office construction and an emphasis on maintaining low rents to compete with other office markets.
47 Through 2025, the total projected demand for
new office space in the Study Area ranges from 28,000 to 146,000 square feet. While limited opportunities for new office construction exist in the short-term due to a soft office real estate market throughout the region, in the long-term the Study Area could position itself as a niche market for creative, professional offices. Such office users could include designers,
46 Sacramento Housing and Redevelopment Agency. Market Analysis and Implementation Strategy: 2004-
2009, for the North Sacramento Redevelopment Project Area. November 2004. Page IV-5. 47
Ibid. Page IV-3.
58

architect firms and other creative businesses. To achieve this long-term goal, new developments should include flexible ground floor space that could accommodate either retail or offices, allowing the building tenants to shift with market demand. All three station areas present immediate barriers to office development. More development in the vicinity of Globe Station would be required in order to create the vibrant urban atmosphere that would attract more professional offices to the Area. Arden/Del Paso Station possesses few vacant lots, thus limiting the extent of potential infill developments in the short-term. The current large office building vacancy at Royal Oaks Station, along with the large office vacancy at the USAA campus just outside the Study Area, will probably need to be addressed before much additional office development occurs in the area. In the long-term, assuming current barriers are addressed all three station areas, office development could thrive within any of these areas. Both Globe and Arden/Del Paso Stations could potentially provide proximity to vibrant commercial corridors while Royal Oaks possess much under-utilized land within the existing office park that could attract certain office users. Retail The reported retail leakage in the Study Area, combined with the high traffic counts along Del Paso Boulevard and Arden Way, indicate that these commercial corridors could be competitive locations for retailers. Based on the retail leakage analysis alone, the Study Area shows current opportunities for approximately 5,000 square feet of restaurant space, approximately 3,000 square feet of food store space, and 2,000 square feet of health and personal services space. In addition, the high traffic counts on Arden Way and Del Paso may encourage retailers to develop larger stores that would benefit not only from neighborhood demand, but also drive-by traffic. Furthermore, through 2025 the demand for additional retail space in the Study Area is expected to be between 17,000 and 30,000 square feet. This does not include retail space, such as a supermarket, that could potentially be built within the Study Area to serve residents of a larger surrounding trade area. Over the long term, if the Northeast Corridor area successfully redevelops into a vibrant mixed-use area with a strong identity and sense of place, it could become attractive to specialty retailers and destination restaurants that would draw customers not only from the Study Area, but from outside of the study area. This could increase potential demand for retail development beyond the high end projection above. Retail is the only land use in which one station area exhibits a stronger development potential than the others. The area surrounding Globe Station presents a greater opportunity for creating a vibrant and attractive destination in the long-run. Globe Station has the potential to benefit from projects planned further north along Del Paso Boulevard. In addition, with proper planning, this station area could capitalize on the redevelopment plans proposed at the Railyards, which would be located just one light rail stop south of Globe Station. Due to the situation of the light rail station in the median of Del Paso Boulevard, and the traffic-calming measures being implemented further north, the Globe station area has a much better pedestrian “feel” than the other two station areas. This characteristic is important from a market perspective as it increases the capacity for creating a vibrant, pedestrian-friendly commercial corridor.
59

The intersection of Del Paso Boulevard and Arden Way inhibits retail development to some extent at the Arden/Del Paso Station. The traffic and wide streets at this intersection limit the ability of pedestrians to move safely and easily between residences, the station and/or businesses on opposite sides of the street. The retail that is attracted to this busy, auto-oriented intersection is more likely to include auto-oriented tenants, such as drive-through restaurants, rather than the urban and pedestrian-oriented tenants desirable for TOD. The office park at Royal Oaks reduces the potential vitality in that station area. While the Lumberjack project may improve this situation, the existing residential neighborhood separates this area from the other commercial activities near Del Paso Boulevard and breaks the continuity of the commercial district. Station Area TOD Opportunities The three station areas present different barriers and opportunities for transit-oriented development. The sense of “place” is an important component of TOD projects; the creation of desirable, pedestrian-friendly neighborhoods contributes significantly to transit usage and to the success of translating a TOD project into a catalyst for neighborhood revitalization. Globe Station: Globe Station offers the largest number of usable vacant and under-utilized sites for redevelopment, with a unique opportunity for parcel assemblage, allowing for a larger place-making effort to potentially occur. The ability to acquire lots from current owners may dictate the time-frame of development in this station area. However, development projects occurring further north along Del Paso Boulevard, and Globe Station’s proximity to the possible Railyards project, may increase private sector interest in re-establishing this station area as a vibrant commercial corridor. As a result, the prospects of this station area are promising. The area surrounding Globe Station presents a pedestrian-friendly scale, although attention will need to be paid to calming exit traffic from Highway 160 south of the station. In general, BAE believes that Globe Station provides the strongest near-term opportunity for creating a vibrant neighborhood atmosphere. As a result, BAE recommends that near-term public efforts focus on revitalizing the Globe Station area. By improving the vitality of this area, the City will create a strong momentum that both public and private endeavors can capitalize upon and this will leverage the considerable public investments in streetscape improvements and property acquisition that have already taken place. The strongest short-term development opportunity at this location is for-sale residential units. Some neighborhood-serving retail - particularly restaurant – and a small amount of small office space may also be supportable in mixed-use buildings in the short term. In the long term, as the residential population increases, there may be a larger market for retail and small offices. The market for large office spaces is unlikely to be a factor in this area until existing large office vacancies are filled. Arden/Del Paso Station: The busy intersection near the Arden/Del Paso station inhibits pedestrian activity, reducing the possible benefits of TOD in the station area. In addition, a lack
60

of easily-assembled vacant lots hinders the ability to build a large place-making project. A third obstacle is the mismatched scale of the existing small buildings near the Arden/Del Paso Station compared to the wide road, which gives the space an uneasy feel not conducive to street life, and tends to isolate the two sides of the street from each other. The wide intersection may also prevent any TOD project that does occur near the station from creating positive influences on properties fronting on the other portions of the Arden Way and Del Paso Boulevard intersection. As development activities along Del Paso Boulevard increase, both north and south of the station, it is likely to stimulate interest in redeveloping lots near Arden/Del Paso Station with TOD projects. In the long-term, it is possible that TOD incorporating residential, retail and/or office uses will replace the existing used auto lot as well as other non-transit-oriented uses located directly across from the light-rail station. Woodlake Park offers an attractive neighborhood amenity that future development should capitalize upon. In order to incorporate the existing park into any place-making efforts around the Arden/Del Paso Station, the park should be kept visible and safe by avoiding building structures that would cut it off from the station and street. As a result of the above-noted hurdles to redeveloping parcels near Arden/Del Paso Station, attracting private investment to this station area could depend on the successful completion of development projects along Del Paso Boulevard, closer to Globe Station. Therefore, it is BAE’s recommendation that the City focus on redevelopment efforts near Arden/Del Paso Station only after Del Paso Boulevard in the Globe Station area has been established as a vibrant commercial corridor. Royal Oaks Station: One of the greatest challenges facing commercial development in the Royal Oaks Station area is the residential neighborhood separating this station from Del Paso Boulevard, which prevents redevelopment activities around Arden/Del Paso from impacting the Royal Oaks Station area. The existing office park also inhibits the vitality of the station area, especially with a vacant lot and office building directly abutting the station. However, TOD plans for the Swanston Station, located less than a half-mile from Royal Oaks, as well as the potential redevelopment of the Lumberjack site with a TOD mixed-use project could have significant positive impacts on the Royal Oaks Station area. Further, while the existing neighborhoods prevent development activities near Del Paso Boulevard from connecting to the Royal Oaks Station area, the neighborhoods themselves are significant TOD assets. A TOD project that connects the two neighborhoods across Arden Way and improves the walkability of the area will significantly improve the residential potential of the entire area while promoting walking and transit usage among current and future residents, including improving the ability of children to walk to the elementary school located on Royal Oaks Drive. While extensive commercial redevelopment in the Royal Oaks Station area may be too isolated to be successful in the short term, the area is well-suited to further residential development. Consequently, BAE recommends high-density residential development for the Royal Oaks station area in the short term, and commercial development only after significant TOD and place-making success has been achieved at Globe and then at Arden/Del Paso. This will also allow further progress on the former Lumberjack site as well as Swanston Station TOD plans, creating further
61

opportunities for redevelopment projects at Royal Oaks Station. Short-term efforts could also be focused on improving walkability for the existing residents, with sidewalk and street improvements for better pedestrian connectivity between the neighborhoods and school. It is also important to note the potential relocation of the RT bus transfer station to the Swanston Station area. Such a move could result in significant additional traffic along Arden Way, complicating the potential of improving walkability and connectivity between the neighborhoods to the north and south of the street. Summary Overall, for-sale condos present the best near-term, transit-oriented development opportunity, with short-term development focused on the Globe Station area. Increasing the number of residents within the Study Area will contribute to the area’s potential for attracting retailers and restaurants. While the short-term outlook for new construction of commercial space and multifamily rental properties is constrained by infrastructure and market barriers, the presence of under-utilized and vacant land, especially along Del Paso Boulevard, does offer the long-term possibility to stimulate increased development activities through public investment. By including for-sale residential units as part of a mixed-use development, pedestrian activity and transit use will contribute to the area’s vitality and potentially help attract local-serving retail and restaurants. Over time, establishing more of an identity for the different station areas through new residential development and revitalized commercial activity will attract professional office users. As a result, current new developments should consider including flexible space on the ground floor that can accommodate either retail or office users, allowing the project to evolve along with the market. Due to the availability of parcels near Globe Station, in addition to planned projects to the north and south of this area, current efforts should concentrate on building up this area. Revitalization of the Globe Station area could stimulate an interest in subsequent projects at the Arden/Del Paso Station, although consideration must be given to the large road and intersection which are not currently friendly to pedestrian use. Short-term investment at the Royal Oaks station should focus on improving pedestrian friendliness for residents of the existing neighborhoods, and the situation re-evaluated after the mixed-use project at the Lumberjack site is completed.
62
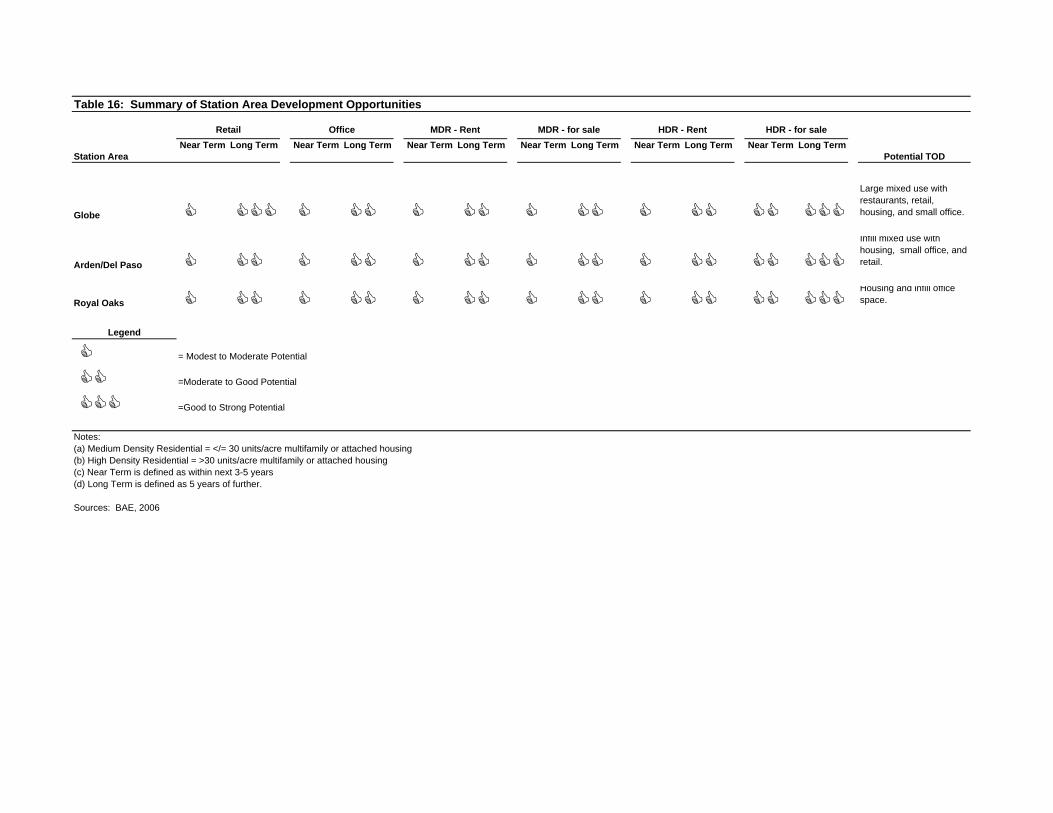
Table 16: Summary of Station Area Development Opportunities
Station AreaNear Term Long Term Near Term Long Term Near Term Long Term Near Term Long Term Near Term Long Term Near Term Long Term
Potential TOD
Globe
Large mixed use with restaurants, retail, housing, and small office.
Arden/Del Paso
Infill mixed use with housing, small office, and retail.
Royal OaksHousing and infill office space.
Legend
= Modest to Moderate Potential
=Moderate to Good Potential
=Good to Strong Potential
Notes: (a) Medium Density Residential = </= 30 units/acre multifamily or attached housing (b) High Density Residential = >30 units/acre multifamily or attached housing(c) Near Term is defined as within next 3-5 years(d) Long Term is defined as 5 years of further.
Sources: BAE, 2006
HDR - Rent HDR - for saleRetail Office MDR - Rent MDR - for sale

Section II – Pro-Forma Analysis
64

Comparable Projects in Sacramento
BAE surveyed the developers of recent mixed-use projects in Sacramento comparable to those being considered for the stations on the Northeast Corridor. The projects all contain rental residential units, and many have small amounts of retail or office space on the ground floor. Densities range from 25 to over 100 units per acre, and building heights are three to five storeys. These surveys provide information regarding development costs and an insight into the market conditions in Sacramento. The information obtained is used as input to the pro-formas in the following section, which determine the cost and feasibility of mixed-use development at the Northeast Corridor stations. Fremont Building at 16th & P48
Project Description Developer: Partnership headed by SKK Developments
Location: 1501 16th Street at P Street, Sacramento
Uses and density: The Fremont Building is 99,400 square feet on a 0.88 acre site (FAR = 2.6)
49. It is four
storeys high, scaling down to three storeys adjacent to the existing residential uses on O and P Streets to the east
50. It includes 69 rental units (78 dwelling units/acre)
- 11 of which have affordability requirements – in studio, one-bedroom and two-bedroom configurations. The building has 12,000 square feet of retail on the ground floor. Tenants include Starbuck’s, Togo’s/Baskin Robbins, Huki Lau Island Grill, Supercuts and Nishiki Sushi.
Construction: Three storeys of woodframe over concrete podium51
with ground-level parking tucked underneath.
Parking: 69 spaces, 8 bicycle spaces
Date completed: June 2001
Financing Total development cost: $9,803,85352
Sources of funding: $7,200,000 Permanent Bank Loan
$570,000 CADA Land Acquisition Loan $793,853 Developer Equity
$1,240,000 Sacramento Housing and Redevelopment Agency (SHRA) Loan $9,803,853 Total
CADA loan was paid off in Fall 2006.
48
Photo: www.cadanet.org 49
Capitol Area Development Authority website, www.cadanet.org, August 2006. 50
Leonard Development Company website, leonarddevelopment.com, August 2006. 51
Conversation with Sotiris Kolokotronis, SKK Developments, December 2006. 52
Capitol Area Development Authority website, www.cadanet.org, August 2006
65

Current rents: $1,200 to $1,900 for studios, 1 bedrooms and 2 bedrooms ranging from 490 to 1130 square feet
53. Studios average approximately $2.65/square foot, 2 bed/1 bath average
$1.25/square foot and 2 bed/2 bath range from $1.25 to $1.65/square foot. Parking is an additional $145/month for a covered spot, or $125/month for an open spot.
Current occupancy: 100% in August 200654
1801 L Street55 Project Description Developer: 18th & L Street Developers, LLC (SKK Developments)
Location: L Street between 18th and 19th Streets
Uses and density: The project is a four-storey complex on a formerly blighted site, with four levels of apartments over below-grade parking, with storefront retail and live/work units. The building is 161,556 square feet on 2.09 acres (1.8 FAR, 84 units/acre). It has 176 apartments – 38 of which have affordable requirements - and 9,600 square feet of retail on the ground floor. The apartments range from 420 to 1,100 square feet, with the seven penthouse units going up to 1,920 square feet. An inner courtyard includes a pool and a stage for performances.
Construction: Almost four full levels of woodframe construction over concrete podium, with subterranean parking.
56
Tenants: As of the beginning of August 2006, the retail spaces were fully leased and not yet occupied.
Parking: 163 underground spaces
Date completed: scheduled for completion August 2006.
Financing Total development cost: $41.4 million, not including return on owner’s equity
Hard costs: $27.2 million
Soft costs: $11.7 million
Sources of funding: The project received a $5 million loan from the City.
Current rents: $875 to $2,000 for market-rate apartments, $3,000 to $4,000 for seven penthouse units. Affordable units range from $550 to $710
57. Parking is an additional $125/month.
Absorption rate: As of the beginning of August, 61 (35%) of the apartments were pre-leased, and all the retail space was leased.
53
www.apartmentguide.com, August 2006. 54
Fremont Building Rental Office, (916) 551-1494, August 2006. 55
Photo: www.downtownsac.org 56
Conversation with Sotiris Kolokotronis, SKK Developments, December 2006. 57
1801 L Street Leasing Office (916) 447-1801 www.1801L.com, August 2006.
66

St. Anton Building58
Project Description Developer: St. Anton Partners
Location: 2210 L Street (21st and L Streets)
Uses & density: The St. Anton Building is a five-storey structure with 65 apartments and 3,000 square feet of ground-floor retail along 21st and L Streets. Seventeen of the apartments have affordability requirements. The building is on 0.6 acres, and has a zero lot-line on all four sides. The total building area is 89,860 square feet. DU/acre = 108, FAR = 3.4.
Construction type: 4-storey woodframe over concrete podium
Tenants: Stone Grill & Vintage Café, not yet open as of August 2006
Parking: 68 spaces in a secure garage on the first floor. The parking garage entrance is on the alley.
Date completed: April 2006 Financing Total development cost: $10.5 million
Hard cost: $160/square foot of net rentable area
According to the developers, the cost numbers are artificially low because the owner-builders did not take a construction or management fee. A more accurate number for comparison would be $12 million.
Sources of funding: Discount on the price of the land, $200,000 loan from SHRA for the purchase of the land from them, $885,000 loan from the City.
Current rents59
: Market rents range from $925 to $2,195 for units ranging from 530 to 1,290 square feet. Affordable rates cover 50% and 80% of median income, and range from $532 to $1,154. Parking is an additional $125.
Occupancy: Three months after opening, 63 of the 65 units were leased. 19th & O Project Description
60
Developer: Carson Development Company
Location: 19th & O Streets
Uses & density: This project has seven loft apartments and 5,000 square feet of retail space on the ground floor in a three-storey building. The building is 12,000 square foot building on a 0.29 acre site (FAR = 0.95, DU/acre = 24). The apartments are one- and two-bedroom.
All of the residential units are occupied as of December 2006, but the retail space has not leased
58
Photo: www.forum.skyscraperpage.com 59
St Anton Building Rental Office, 916-444-0006, August 2006. 60
Conversations with Johan Otto, Carson Development Company, August and December 2006.
67

well, and only about 30% is occupied, at least part of it used as office space. In retrospect, the developer believes that this location - halfway between the Safeway project and Capitol Avenue – is not suitable for retail, and would have been more appropriately developed entirely for residential use. Other commentators have said that the design and aesthetics of the building do not make it attractive to the “hip” tenants that are generally the market for mixed-use, urban buildings.
Parking: 15 surface spaces
Date completed: February 2005. Financing Total development cost: $2.2 million
Funding sources: no public funding was used.
Current rents: not available
Absorption rate/current occupancy: all residential units occupied, approximately 30% of commercial as of December 2006.
Fremont Mews61
Project Description Developer: Rembold Properties, LLC
Location: 1400 P Street between 14th and 15th Streets, ½ a block from a light-rail station and close to the State of California’s East End Office complex.
Uses and density: The Fremont Mews is two three-storey buildings totaling 90,900 square feet on 2.2 acres (FAR = 0.9)
62. A 19,000 square foot community garden with 50 plots is on the northeast
corner of 14th and Q Streets. The project includes 119 apartments (54 units/acre) ranging from 500 to 1,300 square feet, 48 of which have affordability requirements.
Parking: 128 spaces partially below street level with keyless entry
61
Photos: www.fremontmews.com, www.cadanet.org 62
Capitol Area Development Authority, www.cadanet.org, August 2006
68

Date completed: October 2005
Financing Building hard costs: $16.0 million, or $176/square foot
Parking hard costs: $1.56 million or $12,200 per space
Total hard costs: $17.56 million
Soft costs: $8.64 million
Total project costs: $26.2 million
Public subsidies: Bonds $14,000,000Tax Credits $3,776,000Agency Loan $2,000,000Agency Grant $500,000CADA Loan $900,000CADA Grant $400,000
+ landProject return: According to the developer, projects with affordable units are evaluated only in terms of being able to service debt and eventually pay back deferred developer fee. Since Fremont Mews has only had a few months of operations since retiring the construction debt, it is not yet clear what the true net operating income will be.
Current rents63
: $900 to $1,450 for market-rate units ranging from 500 to 1,000 square feet, four loft units lease at $2,095 for 1,300 square feet. Affordable units rent for $554 to $855. Parking is an additional $95/month.
Current occupancy: fully leased 17th & N64
Project Description Developer: Hank Fisher Properties and Herb Krumpe
Location: Southwest corner of 17th and N Streets, Downtown Sacramento
Uses and density: The project consists of two buildings with a total of 14,600 square feet on 0.29 acres (FAR = 1.2). The primary goal of this development was to move a 1939 apartment building originally located at 1311 15th Street, in order to vacate that site for the State of California's East End
Office Project. The relocated building has eight units and the new building has ten, bringing the total density to 62 units per acre. The units are all one-bedroom or one-bedroom lofts, and they range in size from 700 to 1,100 square feet. Rents are lower in the relocated building than in the
63
Fremont Mews Rental Office 916-446-4466, August 2006 64
Photo: www.hankfisherproperties.com
69

new one. The buildings each contain two storeys over seven individual parking garages and they are connected by a “bridge" at the second and third floors.
Parking: 14 spaces in first-floor parking garages
Date completed: February 2001 Financing Estimated Development costs: $1,800,000
65
Sources of funding: $1,400,000 Permanent Financing $440,000 East End Mitigation Fund (State of California) 1,840,000 Total
Current rents66
: In the new building, one-bedroom units rent for $1,040 to $1,100, and the four loft apartments at approximately $1,400. In the older building, one-bedroom units rent for approximately $750. Parking is an additional $125/month.
Current occupancy: The buildings are fully leased and, according to the manager, they “stay full”. Conclusion The summary on the following page collects information on all the projects for purposes of comparison. The projects studied range in density from 24 to 108 units per acre. Project sites are generally relatively small, ranging from 0.29 acres to just over two acres. Floor to area ratios (FAR) range from 0.9 to 3.4. Most of the projects are apartments over retail, and those which received public funding include affordable units. The affordable units range from 16 to 40 percent of the total number of apartments in the project. All the buildings are truly mixed in terms of unit sizes, prices and positioning. Most of the units range between 450 and 1,100 square feet and rent from approximately $800 to $2,000 per month. The loft units are positioned as the high-end units, with sizes up to 1,900 square feet, and rents as high as $3,000 at 1801 L Street. Counter-intuitively, the studio apartments have a higher rental rate in terms of dollars per square foot than the loft units do. Because of their small sizes – typically around 500 square feet – the studios rent at or over $2.00 per square foot. In general, as the apartment sizes go up, per square foot rents go down, dropping to $1.30 per square foot for two-bedrooms and lofts in some cases. The buildings offered practically every form of parking, from surface parking with or without cover, through individual garages, to podium and underground parking. Most of the projects charged $125 per month for parking, with other rates being $95 or $145.
65
Capitol Area Development Authority, www.cadanet.org, August 2006 66
Conversation with Jewel Simon, manager, 916-447-1441, August 2006.
70

Fremont Building
1801 L St St. Anton Building
19th & O Fremont Mews
17th & N
Acres 0.88 2.09 0.6 0.29 2.2 0.29 Construction type
Woodframe over podium
Woodframe over podium
Woodframe over podium
Woodframe Woodframe not available
# storeys 3 and 4 4 5 3 3 park+2 Development cost
$9.8 million $41.4 million $10.5 million $2.2 million $26.2 million $1.8 million
Public financing
CADA loan SHRA loan
SHRA loan Land discount,
SHRA loan City loan
None Bonds, tax credits,
Agency grant & loan CADA grant
and loan, CADA land
grant
State grant for site
clean-up
Res. units 69 176 65 7 119 18 % affordable 16% 22% 26% 0 40% 0 Commercial 12,000 sq.ft. 9,600 sq.ft. 3,000 sq.ft. 5,000 sq.ft. 0 0 FAR 2.6 1.8 3.4 0.95 0.9 1.2 DU/acre 78 84 108 24 54 62 Parking Surface
69 car 8 bicycle
Undergrd 163 spaces
First floor 68 spaces
Surface 15 spaces
Undergrnd 128 spaces
First floor 14 spaces
Rent ($/sq.ft., monthly)
$2.65 studio $1.25-$1.65
2bed
$2.10 studio $1.85 2bed $1.60 loft
$1.80 studio $1.75 1bed $1.30-$1.90
2bed
not available $2.00 studio $1.90 1bed
$1.50 2B/1B $1.70 2B/2B
$1.60 loft $2.25live/wk
$1.40 std $1.30 loft
Parking rent $125, $145 $125 $125 not available $95 $125 Note: Development costs for 1801 L Street and the St. Anton Building do not include owner’s return on equity.
71

Pro-Forma Analysis of Mixed Use Projects
BAE used market and development cost data collected for the Northeast Corridor Study Area, North Sacramento and the dense, mixed-use projects in Mid-town Sacramento as inputs to prepare financial feasibility pro-formas for three prototype catalytic TOD sites defined within the Northeast Corridor area. The pro-forma for each prototype detail the total cost of building a project, and estimates the annual return that can be expected, given the income and expenses from operating the project. In the case of a for-sale project, return is based on the profit at the time of sale. There are various ways to do the analysis – in this case, we entered all development costs, income and expenses, and sale prices, and used those to calculate the amount of budget left over to cover the cost of the land (“land residual”). BAE consulted with local developers, real estate brokers and bankers to obtain inputs for the costs and returns. Once the pro-formas were completed, they were reviewed by three local developers, and their feedback in terms of both numbers and logistical recommendations have been included in this report. The City of Sacramento does not require that residential projects in the Study Area include affordable units, in order to encourage infill development.
67 Since the goal of these projects is
economic development rather than affordable housing, the pro-formas assume that all units will be market rate. Cost of Construction The team surveyed developers of recent projects in Sacramento in order to determine current hard and soft costs for mixed use and high-intensity projects. Developers provided the costs of construction for their projects, and in some cases provided information to update these numbers for 2007 construction. Building hard costs are the cost of actual construction, including site infrastructure, building, site finishing and landscaping. All buildings were assumed to be three-storey woodframe, with a construction cost of approximately $120 per square foot. Where there is an interface between different uses – for example, between ground-floor retail and the flats above it – code requires sound and fire isolation that adds approximately 20 percent to the cost. Stacked flats require the same isolation between units, so cost was added for these also. For commercial uses, the construction is plain vanilla shell, and ductwork, finishing and fittings will be extra. Garage parking in townhouses is accounted for in the construction cost, although the cost is based on the square footage of the living space. Garage space in ground-floor retail is calculated as part of the structure, based on square footage. Surface parking is estimated at $4,000 per space. Site improvements are estimated at $10 per square foot of the entire site, and each site is allocated a fixed landscaping allowance of $100,000. Building soft costs include service fees for professionals such as architects and engineers, City permit fees, loan charges and insurance. Architecture was assumed to add an amount equal to 7.5 percent of the hard costs, and engineering 2.5 percent. The cost for architecture is slightly higher
67
Conversation with Desmond Parrington, City of Sacramento Planning Division, 15 November 2006.
72

than the five percent typically allocated for larger, single-use projects. Construction defect liability insurance for relatively small projects like these was estimated at $10,000 per unit for townhouses, and $25,000 per unit for flats. This assumes that the townhouses are built “wall-to-wall”, with no shared walls, and only the roof owned in common. Development impact fees range from $8.35 to $10.65 per square foot. In general, residential projects pay higher impact fees due to the park fee, school impact fees and sanitation fees. Leasing commissions were estimated at 2.5 percent of the first year’s rent. Construction loan costs were based on an interest rate of 9.25 percent, one point in fees, and a loan-to-cost ratio of 0.80. Fees for the conversion to a permanent loan were estimated at one percent, and interim taxes were estimated at 1.2 percent of the hard and soft costs. In addition, developer overhead was estimated at five percent and a project contingency of 10 percent was used. A relatively low developer profit of 15 percent was added to the bottom line. Income and Expenses The study estimated lease and sale rates for office, retail and residential space using current rates in the study area as a lower bound, and numbers from comparable new projects as an upper bound. Office lease rates in the study area and surroundings range from $0.75 to $1.20 per square foot NNN for existing buildings, and new space is asking $1.20 to $2.00 NNN, with the higher asking price for loft-style space (see Table 8 in the Market Analysis). Broker reports show office lease rates in the area averaging $1.85 NNN
68 in CB Richard Ellis’ “Point West” geography, and $1.40
full service69
in Cornish & Carey’s “North Sacramento” geography. Both these geographies include the study area, but Point West also includes Arden Way east of Interstate 80, which is likely to inflate the numbers. The average lease rate for Sacramento area suburban office space is $1.69 full-service.
70 Based on these numbers, an office lease rate of $1.50 NNN is likely to be
reasonable for the small professional spaces that will be found in new mixed-use projects in the study area. Retail lease rates in the study area and surroundings range from $0.50 to $0.75 NNN per square foot for existing buildings, and new space is asking $0.75 to $2.25 NNN, depending on the use (see Table 8 in the Market Analysis). According to CB Richard Ellis, in the Sacramento area in general, shop space in older shopping centers in established areas averaged $2.00 to $2.75 per square foot, and in new anchored centers, it averaged $2.75 to $3.25 per square foot
71. In the
“South Natomas” geography, which includes the study area, average retail asking rates were $2.14 per square foot. Based on these numbers, the analysis used a retail lease rate of $2.00 per square foot in the pro-formas. Vacancies were estimated at a relatively conservative 10 percent, in order to evaluate the feasibility of a commercial project in a soft market.
68
CB Richard Ellis, “Sacramento Office MarketView”, Second Quarter 2006. 69
Cornish & Carey Commercial, “Sacramento Market Summary”, Second Quarter 2006. 70
CB Richard Ellis, “Sacramento Office MarketView”, Second Quarter 2006. 71
CB Richard Ellis, “Sacramento Retail MarketView”, Second Quarter 2006.
73

Unrecoverable expenses for commercial space are those expenses which remain in the spreadsheet after accounting for expenses such as utilities, maintenance and taxes which can be passed onto the tenant. For retail space, the study used five percent of effective gross income, based on the 2004 “Dollars and Cents of Neighborhood Shopping Centers” from the Urban Land Institute. For office space, the study used 8.7 percent, based on 2005 numbers from the “Experience Exchange Report” published by the Building Owners and Managers Association.. Apartment lease rates were not used in the analysis, since all residential units were analyzed as for-sale units. However, the following are the estimated rates. Apartment rents in the study area are $1.05 to $1.10 per square foot, and in the surrounding areas, rates range from $1.00 to $1.05 per square foot (see Table 11 in the Market Analysis). Most of the complexes surveyed are in moderate condition. These rates represent the lower end of potential lease rates on the Northeast Corridor. Lease rates in the new, mostly mixed-use apartment buildings surveyed in downtown and midtown Sacramento average $2.15 per square foot for studios, $1.85 per square foot for one-bedroom units, and $1.60 per square foot for two-bedroom units. On a per square foot basis, loft units did not command a premium; they leased for rates comparable to the one- or two-bedroom units. These rates represent the upper end of potential lease rates on the Northeast Corridor. Lease rates for new construction in the study area are likely to be intermediate between these two values, namely $1.65 per square foot for studios, $1.45 per square foot for one-bedroom units, and $1.30 per square foot for two-bedroom units. Apartment parking in the new developments in Sacramento ranges from $95 to $145 per space per month. Since all residential units in the analysis are for-sale, no parking rental revenues are assigned in this study. Residential sale prices in the Study Area averaged $265/square foot (see Table 9) for single-family detached units. New condominiums in the Sacramento area averaged $249/square foot, and condominium conversions in the Sacramento area averaged $202/square foot (see Table 10). Based on these numbers, the analysis estimated sale prices for attached units in the Study Area as $250/square foot for studio units, $235 for one-bedroom units and $220/square foot for two-bedroom units in a townhouse format. Condominium (flat) prices were estimated at 90 percent of the townhouse values. Additional Cost The pro-formas were developed to address only the cost of on-site construction, and after reviewing the numbers, the County asked for an additional estimate of land, demolition and off-site utility costs. These numbers can vary widely, since they depend on the condition of the specific site. BAE provided some numbers for illustration purposes only, using the following estimates:
Land cost – BAE used an average $20 per square foot for the price of bare land, based on sales data collected in the Market Analysis (Table 8). The actual price to purchase a site would be much higher if it had existing structures on it.
Demolition cost – Based on a recent commercial demolition project on Del Paso Boulevard, SHRA esimated a demolition costs of $4/per square foot for commercial projects. Demolition costs for residential buildings would be considerably less. The study multiplied the SHRA number by the estimated square footage of structures on each prototype sites. Again, this cost for an actual project would vary, depending on what was on the site.
74

Off-site improvements – the infrastructure consultant, Nolte Associates, provided an estimated cost for the improvements necessary for each project to develop today. This included the surface improvements beyond those that will ultimately be provided by the City, any utilities needed immediately for development that would not be able to wait until the master infrastructure is in place. The following are the rough estimates for each prototype site: • Globe site - The site would replace the 20 foot alley in the back. The existing utilities
for the site appear adequate. The watermain in the alley would be replaced in the master plan; however, since a 12 inch main is located in Southgate adjacent to the site, it would be adequate for current fire flow needs. Calculations are as follows; Alley : 20 feet x $20 per foot x 90 linear feet = $36,000 Engineering/Permits/Contingencies = 60% additional Total = $60,000
• Arden/Del Paso site - The site would replace the 20 foot alley in the back. The existing utilities for this site appear adequate. Alley : 20 feet x $20 per foot x 150 linear feet = $60,000 Engineering/Permits/Contingencies = 60% additional Total = $96,000
• Royal Oaks site - The site would add no improvements to Arden, but would improve the alley behind the site with 20 feet of paving. The existing utilities for this site appear adequate. Alley : 20 feet x $20 per foot x 275 linear feet = $110,000 Engineering/Permits/Contingencies = 60% additional Total = $176,000
Sites and Prototypes One site was chosen at each station to be used to analyze the feasibility of a TOD development project. Sites were chosen firstly based on their proximity to the stations, since TOD projects must be easily visible and accessible from the transit station. The other criteria were that the site be currently vacant or under-utilized, and that it be feasible to acquire the necessary parcels. Figure 1 shows the sites selected for prototype catalytic projects at the three stations. At the Globe station, the catalytic site is comprised of the two parcels formerly occupied by Noble Auto, next to the carwash and Mexican bakery, at 1212 Del Paso Boulevard. At the Del Paso/Arden Station, the team decided not to try to address development potential in the immediate vicinity of the station since fractionalized ownership makes parcel assemblage difficult. Rather, the analysis evaluated the site at 1525 Del Paso Blvd, which is immediately north of Casa Bella Furniture and was previously approved for the Drive-Thru Joe's Coffee Shop. For the Royal Oaks Station, the analysis focused on the half-block on the north side of Arden Way between Empress and Beaumont Streets. Following the site selection process, MIG created illustrative prototype developments for each of the three sites, and these are shown in Figures 2 through 7. The Market Analysis informed the uses in each site design, and each project has a different mix of uses, in order to understand the feasibility of retail, office and residential uses in this area. Following is a summary of the Market Analysis findings for each station area as well as a description of the prototype development designed for each site.
75

Globe Station Site The Market Analysis found that the Globe Station area’s pedestrian-friendly scale gives it a strong near-term potential for creating a vibrant neighborhood atmosphere. As a result, sites in the vicinity of this station present strong opportunities for developing for-sale residential projects as well as some neighborhood-serving retail and a small amount of office space as part of mixed-use buildings in the short-term. Over time, as the residential population increases, the market for retail and small office spaces is likely to grow as well. Based on these determinations, the prototype for the Globe Station site consists of a three-storey mixed-use building facing Del Paso Boulevard as well as seven, two-storey townhouses in the back of the 0.47 acre site. The total building square footage on the site would amount to approximately 31,576 square feet, resulting in an estimated Floor Area Ratio (FAR) of 1.54. The mixed-use building would provide approximately 7,680 leasable square feet of retail space on the ground floor. The building’s top two stories would contain 20 condominium flats ranging from 710 to 1,000 square feet. The townhouses would each be approximately 1,000 square feet. One parking space would be provided on-site for each of the residential units - primarily garage parking for the townhouses and surface parking for the flats - and on-street parking would accommodate the needs of the retail space tenants. The project has a density of 57 dwelling units per acre, in addition to the retail. The most likely developer for this project is a residential development company accustomed to for-sale projects. As a result, the pro-forma assumes that both the residential and retail components would be sold. Arden/Del Paso Station Site In the Market Analysis, BAE determined that the lack of easily-assembled lots, the heavy traffic at the intersection of Arden Way and Del Paso Boulevard, and the mismatch in scale between the small buildings and the wide road at the Arden/Del Paso Station, all inhibit the short-term potential of the area in the immediate vicinity of the station. The Market Analysis further recommended that the City focus on redevelopment efforts near Arden/Del Paso Station only after Del Paso Boulevard has been established as a vibrant commercial corridor. The proposed prototype for the site at 1525 Del Paso Boulevard envisions a mixed-use commercial building, consisting of 7,500 leasable square feet of retail on the ground floor and two floors of office space totaling between 15,000 square feet of leasable space. The total building square footage on this 0.52 acre site would be approximately 24,000 square feet, generating an FAR of 1.06. The site would also provide approximately 45 parking spaces for office users (three spaces per thousand square feet of office), while on-street parking would serve the needs of the retail space. Royal Oaks Station Site In the Market Analysis, BAE recommended that transit-oriented development efforts in the vicinity of the Royal Oaks Station focus on residential uses in order to take advantage of the existing neighborhood and residential assets of the area. Attention should also be given to improving the walkability and connectivity of the area around the station in order to improve the residential potential of sites near Royal Oaks Station. BAE also concluded that any potential for commercial uses near Royal Oaks would likely only be realized in the long-term.
76

As a result of these findings, MIG designed a site plan consisting of six for-sale live/work lofts, 22 for-sale townhouses and eight condominium units or apartments for rent on this 0.88 acre site. The residential density is 41 units per acre. The live/work units are approximately 1,200 square feet each, with a single-car garage which can be optionally converted to living space for an additional fee. This arrangement makes the units marketable to suburban buyers accustomed to a garage, and allows for a transition over time if they realize that the car is not necessary. If the owner does convert the garage, a surface parking space would be provided on-site. The townhouses are 1,200 square feet with garage space for either one or two vehicles. The condominiums/apartments are 650 square feet with one podium parking space per unit. The total building square footage on this site would be approximately 40,900, resulting in an estimated FAR of 1.07. The pro-forma assumed that all units were for sale.
77

Peralta Ave
Wilson Ave
Haggin Ave
Harding Ave
Cleveland Ave
East
Lev
ee R
d
Santiago Ave
Col
fax
St
Dal
e A
veBay Dr
Edge
wat
er R
d
Redwood Ave
Stanford Ave
Col
fax
St
Commerce Cir
Lath
rop
Way
Globe Ave
Baxter Ave
Slobe Ave
Expo Park
Calvados Ave
Fee Dr
Plaza Ave
Lexi
ngto
n St
Lexi
ngto
n St
Eric
kson
St
Woodlake Dr
Blackwood St
Roya
l Oak
s D
r
Empr
ess
St
Beau
mon
t St
Lampasas Ave
Santiago Ave
Ellen
St
Bowles St
Can
talie
r St
Oak
mon
t St
Darina Ave
Frienza Ave
Gre
en S
t
Fair
field
St
Boxw
ood
St
Selm
a St
Cam
brid
ge S
t
El Camino Ave
Del Pa
so B
lvd
Highway 160
Rio Li
nda
Blvd
Lampasas Ave
Arden Way
Dixieanne Ave
Santiago St
Evergreen St
Leisure Lane
Ever
gree
n St
Ever
gree
n St
Exposition Blvd
Trib
ute
Rd
Joellis Way
Lampasas Ave
Del Paso Blvd
Del Paso Blvd
Del Pa
so Blvd
Gre
en S
t
Dal
e A
ve
Dal
e Av
e
Oak
mon
t St
Cam
brid
ge S
t
Garden StFo
rres
t St
Redwood Ave
Tractio
n Ave
Altos A
ve
Media Pl
Canterbury Rd
Edge
wat
er R
d
Fern
ley
Ave
Gro
ve A
ve
Haw
thor
ne S
t
Gibson St
Lochbrae Rd
Dean Rd
El Monte Ave
Bars
tow
St
Aco
ma
St
Arden Way
Leitch Ave
Nor
woo
d A
ve
Railr
oad
Dr
Norwood BP
Can
terb
ury
Rd
Oxf
ord
St
El Camino Ave
Col
fax
St
Southgate Rd
Johnston Rd
Can
talie
r St
Olivera W
ay
Cap
ital C
ity F
reew
ay
RoyalOaks
Globe
Arden/Del Paso
Opportunity SitesNORTHEAST LINE LIGHT RAIL STATIONS PLAN
Major Highway/Freeway
Major Road/Arterial
RT Light Rail Route
Railroad
Quarter Mile Radius
Light Rail Station
Bridge
LEGENDLEGEND
Existing Open Space
Opportunity Site
WoodlakeNeighborhood
DixieanneNeighborhood
EriksonIndustrial Park
Old North Sacramento
DRAFT - For Discussion Purposes OnlySource Data: C
ity of Sacramento
0' 300' 600' 1200'


40'Proposed Mixed Use
Development
100' ROW
34'Light Rail
ed with Two Travel LanesTurning Lane/Median
11' Travel Lane
10'Side-walk
6'Walk
10'Walk
5'Planter
20'Alley
35'Residential Development
Townhomes
60'ParkingArea
7'Parking
Commercial
Condos/Apartments
Condos/Apartments
heast) Proposed Catalytic Site at Globe (Looking Northeast)
Corridor
Townhomes


7'Sidewalk
11'TravelLane
7'ParkingLane
5'Planter
5'Roof
55'Proposed Mixed Use
Development
10'Walkway
60'ParkingArea
2.5'Parking
Strip
17.5'DiagonalParking
20'Alley
Proposed Catalytic Site at Arden/Del Paso (Looking Northeast)
Commercial
Commercial/Office


ROWHOUSE
Proposed Royal Oaks Catalytic Site - Section 1
18'Apartments/
Condos
22'Alley
45'Live Work Lofts
11'Sidewalk
5'Path
20'Alley
5' 50'Townhome
Arden Way
Live WorkLofts
TownhomesApartments/
Condos
Solar Panels
35' 10'35' 15'

Results
Tables 1 through 6 show the pro-formas for the prototypes on each of the catalytic sites. Table 1 is a top-level summary of the pro-formas for all three projects. Tables 2a-e contain the full pro-forma for the Globe catalytic site; Table 2a is a summary and Tables 2b-e provide the detailed calculations. Similarly, Tables 3a-e contain the pro-forma for the Arden-Del Paso catalytic site, and Tables 4a-d for the Royal Oaks site. Table 5 is a list of City impact fees for each site, and Table 6 contains the cost data that were collected and used as input to the analysis. Globe Site Tables 1 and 2a summarize the pro-forma for the catalytic site in the vicinity of the Globe Station. Tables 2b-d contain the development costs, operating income and sale proceeds, and Table 2e contains the development assumptions used for the pro-forma. This is a half-acre site, and the prototype has 20 for-sale flats over retail along the street, and seven townhouses along the alley. The pro-forma assumes that this entire project – residential and retail – will be sold at completion. This is due to the fact that the local residential developers who are most likely to do the project are accustomed to for-sale projects, and do not have a model for renting the retail section. The development costs for the project, not including land, total $7.8 million, or $246 per square foot of building. This assumes that the developer makes a 15 percent profit on the development cost, which may be low given the inherent risk of a project in this area. The sale proceeds for the retail and residential portions total $6.3 million, and the project results in a net loss of $1.5 million. Construction costs for this project assume only a vanilla shell for the retail portion, so the costs of finishing the units and making tenant improvements are additional and would either be paid by the tenant or amortized by the developer in the form of an increase lease amount over the term of the lease. It is possible that higher prices could be obtained for the residential units in this project. The townhouse sale prices were estimated at $220 per square foot, and the flats at $212 and $198 for one- or two-bedroom units, respectively. In addition, the construction costs are higher for the stacked flats than the townhouses, since the former require fire and sound isolation between the different floors of the building, and liability insurance is also higher on airspace condominiums than on townhouses. If the front building could be constructed so that the residential units were townhouses with a cut-out in front for the retail, the construction costs would decrease and selling prices would increase. When the pro-forma is re-run with the assumption that all the units in the front building are townhouses rather than stacked flats, the gap drops to $0.4 million. Technically, this is not an entirely accurate reflection, since the majority of the flats are small one-bedroom units, while townhouses in this configuration would probably need to be larger. However, it does illustrate the change. Increasing the height of the building to four storeys does not improve the pro-forma, since the
85

cost of construction increases, while the sale prices do not. The additional illustrative cost for land acquisition (excluding the cost of structures), demolition and infrastructure totals $0.5 million. Arden-Del Paso Site Tables 1 and 3a summarize the pro-forma for the catalytic site in the vicinity of the Arden-Del Paso Station, and Tables3b-e provide the detailed calculations. This is a half-acre site, and the prototype has two storeys of offices over one storey of retail, with surface parking behind the building. Since this is a commercial building, the pro-forma assumes that it will be held by the developer at completion, and the units rented rather than sold. The development costs for the project, not including land, total $4.3 million, or $180 per square foot. The costs of this project are lower than those for the other two projects, since they do not include developer profit at sale. The actual return on investment (ROI) generated by the operation of the project at market rents is 8.9 percent. At the target ROI of 14 percent, the project has a $1.5 million gap between the actual development cost and the target development cost. A sensitivity analysis showed that this project could achieve a 14 percent ROI if rents increase by approximately 50 percent, to $3.00 for retail/restaurant space, and $2.40 for office space. However, this does not include funds for the land purchase. These retail rates are possible, particularly if restaurant tenants are obtained, but the office rent is higher than the current average full-service lease rate for Class A Sacramento suburban offices, and is unlikely to occur for some time. The additional illustrative cost for land acquisition (excluding the cost of structures), demolition and infrastructure totals $0.6 million. Royal Oaks Site Tables 1 and 4a summarize the pro-forma for the catalytic site in the vicinity of the Royal Oaks Station and Tables4b-d provide the detailed calculations. This site is almost 1 acre, and the prototype is entirely residential, with a total of 36 units: 28 townhouses with garages and eight stacked flats over podium parking. The pro-forma assumes that all units will be for-sale. The development costs for the project, not including land, total $8.6 million, or $220 per square foot. This assumes that the developer makes a 15 percent profit on the development cost, which - again - may be low given the inherent risk of a project in this area. The sale proceeds total $8.0 million, and the project results in a net loss of $0.6 million. As at the Globe site, the stacked flat configuration is more expensive to build and less valuable at sale than the townhouses. The profitability of this project could be improved by making all the units townhouses, and if 36 1,200 square foot townhouses are built, the project shows a $0.3 million residual to pay for the land. The pro-forma breaks even (without land) with approximately 35 units of 1,200 square foot townhouses, or 40 units per acre. If the pro-forma is re-run with the assumption that all 36 units are built as 1,200 square foot
86

detached single-family units that sell at the area’s average price of $265 per square foot, then the project generates a $2.1 million surplus that could both pay for the land and include some remaining profit. Since this density may be somewhat high for detached units, lower densities were evaluated. The break-even point for the pro-forma (without land) was approximately 29 units, or 33 units per acre. The additional illustrative cost for land acquisition (excluding the cost of structures), demolition and infrastructure totals $1.0 million.
87

Conclusions
None of the prototypes analyzed was profitable, even without including land cost. The two projects with commercial portions have larger gaps than the purely residential prototype, suggesting that if the City wants retail projects in the area, it will need to provide assistance, at least in the short term. However, the analysis showed that the specific design can have a significant effect on profitability. Among for-sale residential units, townhouses are more profitable than stacked flats, since the flats have higher construction costs, and lower per-square-foot sale prices. According to one of the developers surveyed, high density single-family detached units are their most profitable product in downtown/midtown Sacramento, and they build up to three storeys. However, these units cannot achieve densities much higher than 30 units per acre. The profitability of the projects could also be improved if parcels can be assembled to provide larger sites, which allow more efficient design and therefore lower costs. One prototype that the analysis did not investigate, was a high-density, mostly rental residential project such as the St Anton Building at 21st and L Streets. This project is on a relatively small site of 0.6 acres, and has a modest 3,000 square feet of retail - including a restaurant - at the street level, and 65 residential units. Development cost for the entire project was $10.5 million, or $12 million if developer fees are included. It differs from the prototypes used for this analysis in that all the residential units are for-rent, which would eliminate the cost of latent defect insurance related to condominiums. It might be interesting to investigate this kind of project; however, unless constructed as an affordable housing project that incorporates outside subsidies, financial feasibility is not likely under current economic conditions. The following section describes some ways in which the City or Redevelopment Agency can assist catalytic TOD projects in the area of the Northeast Corridor.
88

Table 17: Summary of Development Prototypes and Pro-Formas Northeast Transit Line, Sacramento CA
Site 1 Site 2 Site 3Globe Station Arden/Del Paso Station Royal Oaks Station
Retail + Residential Retail + Office ResidentialDEVELOPMENT PROGRAM
Site acreage 0.47 0.52 0.88Total building square feet 31,565 24,000 39,320Building storeys 3 3 3Retail, building square feet 7,680 7,500 0Office, building square feet 0 16,500 0Residential, flats 20 0 8Residential, townhouses 7 0 28Off-street parking spaces 27 45 58Residential units/acre 57 0 41
PRO-FORMA
Hard Costs $4,215,577 $2,981,512 $4,911,448Soft Costs $1,649,638 $732,202 $1,614,827Overhead and Contingency $877,367 $553,603 $974,791Developer Profit $1,011,387 not applicable $1,125,160Total Development Costs $7,753,969 $4,267,316 $8,626,225
Retail Net Operating Income, Monthly $13,133 $12,825 not applicableOffice Net Operating Income, Monthly not applicable $18,945 not applicableApartment Net Operating Income, Monthly not applicable not applicable not applicableParking Net Operating Income, Monthly not applicable not applicable not applicableNet Operating Income, Annual $157,594 $381,240 not applicable
Sale Proceeds, Residential $4,734,640 not applicable $8,491,800Sale Proceeds, Retail $1,969,920 not applicable not applicableSales Commission and Marketing ($402,274) not applicable ($509,508)Net Sale Proceeds $6,302,286 not applicable $7,982,292
FEASIBILITY CRITERIA
Gross Profit $0 not applicable $0Gross Profit Goal 15% not applicable 15%
Return on Investment not applicable 8.9% not applicableReturn on Investment Goal not applicable 14.0% not applicable
LAND RESIDUAL (Land Price to Meet Feasibility Criteria)
Land Residual Value (Gap) ($1,451,683) ($1,544,173) ($643,933)
ADDITIONAL COSTS - ILLUSTRATION ONLYInfrastructure $60,000 $96,000 $176,000Land acquisition $409,464 $453,024 $766,656Demolition cost $12,400 $45,200 $30,800Total $481,864 $594,224 $973,456
Notes:On-site construction and costs only. Any infrastructure which is not available at the site, or off-site public improvements will require additional funds, which are estimated below the main pro-forma.
Sources: Bay Area Economics, 2006.

Table 18a: Globe Station Development Prototype and Pro-Forma Northeast Transit Line, Sacramento CA
Site 1Globe Station
Retail + ResidentialDEVELOPMENT PROGRAM
Site acreage 0.47Total building square feet 31,565Building storeys 3Retail, building square feet 7,680Office, building square feet 0Residential, flats 20Residential, townhouses 7Off-street parking spaces 27Residential units/acre 57
PRO-FORMA
Hard Costs $4,215,577Soft Costs $1,649,638Overhead and Contingency $877,367Developer Profit $1,011,387Total Development Costs $7,753,969
Retail Net Operating Income, Monthly $13,133Office Net Operating Income, Monthly $0Apartment Net Operating Income, Monthly $0Parking Net Operating Income, Monthly $0Net Operating Income, Annual $157,594
Sale Proceeds, Residential $4,734,640Sale Proceeds, Retail $1,969,920Sales Commission and Marketing ($402,274)Net Sale Proceeds $6,302,286
FEASIBILITY CRITERIA
Gross Profit $0Gross Profit Goal 15%
LAND RESIDUAL (Land Price to Meet Feasibility Criteria)
Land Residual Value (Gap) ($1,451,683)
ADDITIONAL COSTS - ILLUSTRATION ONLYOff-Site Infrastructure (a) $60,000Land acquisition ($20/ sq ft) $409,464Demolition cost (b) $12,400Total $481,864
Notes:Pro-forma calculations include on-site construction and costs only. Additional costs of demolition, land acquisition, and infrastructure which is not available at the site, or off-site public improvements will require additional funds, which are estimated below the main pro-forma. a) Estimates provided by Nolte Associates.b) Based on estimated demolition costs of $4 per building square feet of existing structures on site.
Sources: Nolte Associates, Bay Area Economics, 2006.

Table 18b: Estimated Development Cost, Globe Station Site Northeast Transit Line, Sacramento CA
HARD COSTS (a) Retail Hard Costs 7,680 Bldg S.F. $132 /Bldg S.F. $1,013,760 Office Hard Costs 0 Bldg S.F. $0 /Bldg S.F. $0 Residential Hard Costs, Townhouse 7,000 Bldg S.F. $110 /Bldg S.F. $770,000 Residential Hard Costs, Flats 16,885 Bldg S.F. $121 /Bldg S.F. $2,043,085 Parking, Surface 21 Spaces $4,000 /Space $84,000 Site Improvements 20,473 Site S.F. $10 /S.F. $204,732 Landscaping $100,000 /site $100,000Total Hard Costs $4,215,577
SOFT COSTS Architecture & Engineering Fees $4,215,577 Total Hard Costs 10.0% of Hard Costs $421,558 Insurance, Flats 20 For-sale units $25,000 /unit $500,000 Insurance, Townhouse 7 For-sale units $10,000 /unit $70,000 Development Impact Fees $336,057 Leasing Commission 7,680 Leasable S.F. $0.60 /S.F. $4,608 Total Construction Loan Costs $4,008,869 Loan $8.13 /Bldg S.F., avg $244,040 Permanent Loan Fees $4,008,869 Loan 1.0% of Loan $40,089 Interim Taxes $5,547,800 Hard & Soft Costs 1.2% of Hard & Soft Costs $33,287Total Soft Costs $1,649,638
Developer Overhead $5,865,215 Hard & Soft Costs 5% of Hard & Soft Costs $293,261Project Contingency $5,841,060 Hard & Soft Costs (b) 10% of Hard & Soft Costs $584,106Developer Profit $6,742,582 Hard & Soft Costs (c) 15% of Hard & Soft Costs $1,011,387
Total Development Costs: $7,753,969(Less) Net Sales Proceeds (d) ($6,302,286)Net Development Costs: $1,451,683
Notes:On-site construction and costs only. Any infrastructure which is not available at the site, or off-site public improvements will require additional funds.a) Woodframe construction with sound and fire isolation between uses and stacked flatsb) Project contingency costs are applied to all costs except loan costs and taxes.c) Developer profit is applied to all costs.d) Detailed in Table 2d, "Estimated Sale Proceeds"
Source: Bay Area Economics, 2006.
NE Line ProForma layered 2007-1-26 Dev Cost, Globe

Table 18c: Estimated Operating Income, Globe Station Site Northeast Transit Line, Sacramento CA
RETAIL Income Monthly Lease Rate (NNN) 7,680 Leasable S.F. $2.00 /Leasable S.F. $15,360 Less Vacancy 10% of Total Bldg ($1,536) Effective Gross Income $13,824Operating Expenses Monthly Unrecoverable Expenses -5.0% of Eff. Gross Income ($691) Capital Reserves Fund 7,680 Bldg S.F. $0.00 /Bldg S.F. $0Retail Net Operating Income $13,133
Retail Value 157,594 Annual Income 8.0% Cap rate $1,969,920Retail Value ($/S.F.) $257
OFFICE Income Monthly Lease Rate (NNN) 0 Leasable S.F. $1.50 /Leasable S.F. $0 Less Vacancy 10% of Total Bldg $0 Effective Gross Income $0Operating Expenses Monthly Unrecoverable Expenses 0 Bldg S.F. -8.7% of NNN rent $0 Capital Reserves Fund 0 Bldg S.F. $0.00 /Bldg S.F. $0Office Net Operating Income $0
APARTMENTIncome Monthly Lease - Studios 0 Leasable S.F. $0.00 /Leasable S.F. $0 Monthly Lease - 1BR 0 Leasable S.F. $0.00 /Leasable S.F. $0 Monthly Lease - 2BR 0 Leasable S.F. $0.00 /Leasable S.F. $0 Total Monthly Lease Rate (NNN) $0 Less Vacancy 10% of Total Bldg $0 Effective Gross Income $0Operating Expenses Monthly Operating Expenses 0 Units $291.67 /Unit $0 Capital Reserves Fund 0 Bldg S.F. $0.00 /Bldg S.F. $0Apartment Net Operating Income $0
PARKINGIncome Monthly Lease Rate 0 Rental Spaces $50.00 /Space $0 Less Vacancy 10% of Total $0 Effective Gross Income $0Operating Expenses Monthly Operating Expenses 0 Rental Spaces $0.00 /Space $0Parking Net Operating Income $0
Net Annual Revenue: $157,594
Notes:
Sources: Bay Area Economics, 2006.

Table 18d: Estimated Sale Proceeds, Globe Station Site Northeast Transit Line, Sacramento CA
SALE REVENUE Townhouse Units 7 Units 1,000 Avg S.F. $220 /S.F. $220,000 /unit $1,540,000 Flats - 1 Bedroom 16 Units 710 Avg S.F. $212 /S.F. $150,165 /unit $2,402,640 Flats - 2 Bedroom 4 Units 1,000 Avg S.F. $198 /S.F. $198,000 /unit $792,000 Retail $1,969,920Gross Sale Proceeds $6,704,560
(Less) Sales Commission and Marketing 6.0% of Sale Price ($402,274)Net Sale Proceeds $6,302,286
Notes:
Sources: Bay Area Economics, 2006.

Table 18e: Development Assumptions, Globe Station Site Northeast Transit Line, Sacramento CA
DEVELOPMENT ASSUMPTIONS
Development Program All Retail Office Res., TH Res., Flat Site acreage 0.47 Acres Building Storeys 3 Building Area 31,565 7,680 0 7,000 16,885 Bldg. S.F. Leasable Area 30,030 7,680 0 7,000 15,350 Leasable S.F. Residential Units n.a. n.a. n.a. 7 20 Units Landscaping S.F.
Development Cost Assumptions Building Hard Costs (a) $132 $110 $121 /S.F. Site Improvements $10 /S.F. Landscaping Allowance $100,000 /site Architecture 7.5% 7.5% 7.5% 7.5% of Hard Costs Engineering 2.5% 2.5% 2.5% 2.5% of Hard Costs Insurance Costs n.a. n.a. $10,000 $25,000 /unit Development Impact Fees (b) $336,057 Total Leasing Commission $0.60 /S.F. Project Contingency 10% 10% 5% 5% 5% of hard & soft costs Developer Overhead 5% 5% 5% 5% of hard & soft costs
Parking Costs Spaces/1,000 S.F., Commercial n.a. 0.0 0.0 n.a. n.a. Spaces/1,000 S.F. Spaces/Unit, Residential n.a. n.a. n.a. 1.0 1.0 Spaces/Unit Parking Spaces 27 0 0 7 20 Spaces Parking Construction Costs, Surf. 21 spaces $4,000 /Space
Monthly Revenues and Expenses Commercial Lease Rate/S.F., NNN(c) $2.00 $1.50 n.a. n.a. /Leasable S.F. Parking Rate/Space $50 /Space Vacancy Rate (d) 10.0% 10% n.a. 10% /Bldg S.F. Unrecoverable Expenses, Commercial(e) 5.0% 8.7% n.a. n.a. of NNN rent Operating Expenses, Apartments n.a. n.a. n.a. $292 /Unit Operating Expenses, Parking (f) $0 n.a. n.a. n.a. n.a. /Space Capital Reserves Fund (f) $0 $0 n.a. n.a. /Bldg S.F.
Residential Program Square Feet Units Rental Price Sale Price ($/sq.ft) ($/sq ft) Townhouse, 1-bedroom (c) 0 0 $0 $235 Townhouse, 2-bedroom (c) 1000 7 $0 $220 Flat, Studio (c) 0 0 $0 $225 Flat, 1-bedroom (c) 710 16 $0 $212 Flat, 2-bedroom (c) 1000 4 $0 $198
Financing Costs Construction Period 1 Years Max. Loan to Cost Ratio 0.8 of Total Value Construction Loan Rate 9.25% of Total Loan Drawdown Factor 0.55 of Total Loan Construction Loan Fees 1.0% of Total Loan Permanent Loan Fees 1.0% of Total Loan Interim Taxes (12 Months) 1.2% (minus a 0.55 drawdown factor) of Hard & Soft Costs
Revenue Goal Assumptions Return on Investment 14.0% of Total Costs Developer Profit on Cost (for-sale) 15.0% Cap rate 8.0% 7.5%
Notes and References:(a) Woodframe construction with sound and fire isolation between uses. (b) City of Sacramento Permit Services(c) BAE Market Analysis(d) 10% vacancy is used in order to validate project feasibility under relatively soft market conditions(e) Office expenses from Building Owners and Managers Association, "Experience Exchange Report" 2005.(f) Included in building operating expensesItems which are not referenced were collected from developers and/or bankers, most of whom asked not to be named.
Sources: City of Sacramento, 2006; Building Owners and Managers Association, 2005; Bay Area Economics, 2006.

Table 19a: Arden-Del Paso Station Development Prototype and Pro-Forma Northeast Transit Line, Sacramento CA
Site 2Arden-Del Paso Station
Retail + OfficeDEVELOPMENT PROGRAM
Site acreage 0.52Total building square feet 24,000Building storeys 3Retail, building square feet 7,500Office, building square feet 16,500Residential, flats 0Residential, townhouses 0Off-street parking spaces 45Residential units/acre 0
PRO-FORMA
Hard Costs $2,981,512Soft Costs $732,202Overhead and Contingency $553,603Total Development Costs $4,267,316
Retail Net Operating Income, Monthly $12,825Office Net Operating Income, Monthly $18,945Apartment Net Operating Income, Monthly $0Parking Net Operating Income, Monthly $0Net Operating Income, Annual $381,240
FEASIBILITY CRITERIA
Return on Investment 8.9%Return on Investment Goal 14.0%
LAND RESIDUAL (Land Price to Meet Feasibility Criteria)
Land Residual Value (Gap) ($1,544,173)
ADDITIONAL COSTS - ILLUSTRATION ONLYInfrastructure (a) $96,000Land acquisition ($20/ sq ft) $453,024Demolition cost (b) $45,200Total $594,224
Notes:Pro-forma calculations include on-site construction and costs only. Additional costs of demolition, land acquisition, and infrastructure which is not available at the site, or off-site public improvements will require additional funds, which are estimated below the main pro-forma. a) Estimates provided by Nolte Associates.b) Based on estimated demolition costs of $4 per building square feet of existing structures on site.
Sources: Nolte Associates, Bay Area Economics, 2006.

Table 19b: Estimated Development Cost, Arden-Del Paso Station Site Northeast Transit Line, Sacramento CA
HARD COSTS Retail Hard Costs (a) 7,500 Bldg S.F. $110 /Bldg S.F. $825,000 Office Hard Costs 15000 Bldg S.F. $110 /Bldg S.F. $1,650,000 Residential (Townhouse) Hard Costs 0 Bldg S.F. $110 /Bldg S.F. $0 Residential (Flat) Hard Costs 0 Bldg S.F. $121 /Bldg S.F. $0 Parking, Surface 45 Spaces $4,000 /Space $180,000 Site Improvements 22,651 Site S.F. $10 /S.F. $226,512 Landscaping $100,000 /site $100,000Total Hard Costs $2,981,512
SOFT COSTS Architecture & Engineering Fees $2,981,512 Total Hard Costs 10.0% of Hard Costs $298,151 Insurance 0 For-sale units $10,000 /unit $0 Development Impact Fees $200,320 Leasing Commission 22,500 Leasable S.F. $0.60 /S.F. $13,500 Total Construction Loan Costs $2,811,556 Loan $7.61 /Bldg S.F., avg $171,153 Permanent Loan Fees $2,811,556 Loan 1.0% of Loan $28,116 Interim Taxes $3,493,484 Hard & Soft Costs 1.2% of Hard & Soft Costs $20,961Total Soft Costs $732,202
Developer Overhead $3,713,714 Hard & Soft Costs 5% of Hard & Soft Costs $185,686Project Contingency $3,679,169 Hard & Soft Costs (b) 10% of Hard & Soft Costs $367,917
Total Development Costs: $4,267,316
Notes:On-site construction and costs only. Any infrastructure which is not available at the site, or off-site public improvements will require additional funds.a) Woodframe construction with sound and fire isolation between uses and stacked flatsb) Project contingency costs are applied to all costs except loan costs and taxes.
Source: Bay Area Economics, 2006.

Table 19c: Estimated Operating Income, Arden-Del Paso Station Site Northeast Transit Line, Sacramento CA
RETAIL Income Monthly Lease Rate (NNN) 7,500 Leasable S.F. $2.00 /Leasable S.F. $15,000 Less Vacancy 10% of Total Bldg ($1,500) Effective Gross Income $13,500Operating Expenses Monthly Unrecoverable Expenses -5.0% of Eff. Gross Income ($675) Capital Reserves Fund 7,500 Bldg S.F. $0.00 /Bldg S.F. $0Retail Net Operating Income $12,825
Retail Value 153,900 Annual Income 0.0% Cap rate #DIV/0!Retail Value ($/S.F.) #DIV/0!
OFFICE Income Monthly Lease Rate (NNN) 15,000 Leasable S.F. $1.50 /Leasable S.F. $22,500 Less Vacancy 10% of Total Bldg ($2,250) Effective Gross Income $20,250Operating Expenses Monthly Unrecoverable Expenses 15,000 Bldg S.F. -8.7% of NNN rent ($1,305) Capital Reserves Fund 15,000 Bldg S.F. $0.00 /Bldg S.F. $0Office Net Operating Income $18,945
APARTMENTIncome Monthly Lease - Studios 0 Leasable S.F. $0.00 /Leasable S.F. $0 Monthly Lease - 1BR 0 Leasable S.F. $0.00 /Leasable S.F. $0 Monthly Lease - 2BR 0 Leasable S.F. $0.00 /Leasable S.F. $0 Total Monthly Lease Rate (NNN) $0 Less Vacancy 10% of Total Bldg $0 Effective Gross Income $0Operating Expenses Monthly Operating Expenses 0 Units $291.67 /Unit $0 Capital Reserves Fund 0 Bldg S.F. $0.00 /Bldg S.F. $0Apartment Net Operating Income $0
PARKINGIncome Monthly Lease Rate 0 Rental Spaces $50.00 /Space $0 Less Vacancy 10% of Total $0 Effective Gross Income $0Operating Expenses Monthly Operating Expenses 0 Rental Spaces $0.00 /Space $0Parking Net Operating Income $0
Net Annual Revenue: $381,240
Notes:
Sources: Bay Area Economics, 2006.

Table 19d: Estimated Land Residual Value, Arden-Del Paso Station Site Northeast Transit Line, Sacramento CA
ACTUAL RETURNNet Development Cost $4,267,316Net Annual Operating Income $381,240Return on Investment, Actual 8.9%
INCOME SURPLUS/GAPReturn on Investment Goal 14.0%Net Annual Operating Income, Goal $597,424.26Annual Income Surplus (Gap) ($216,184.26)
DEVELOPMENT COST SURPLUS/GAPNet Annual Operating Income $381,240Return on Investment Goal 14.0%Total Supportable Costs $2,723,143
Land Residual Value (Funding Gap) ($1,544,173)
Notes:
Source: Bay Area Economics, 2006.

Table 19e: Development Assumptions, Arden-Del Paso Station Site Northeast Transit Line, Sacramento CA
DEVELOPMENT ASSUMPTIONS
Development Program All Retail Office Res., TH Res., Flat Site acreage 0.52 Acres Building Storeys 3 Building Area 24,000 7,500 16,500 0 0 Bldg. S.F. Leasable Area 22,500 7,500 15,000 0 0 Leasable S.F. Residential Units n.a. n.a. n.a. 0 0 Units Landscaping S.F.
Development Cost Assumptions Building Hard Costs (a) $110 $110 $110 $121 /S.F. Site Improvements $10 /S.F. Landscaping Allowance $100,000 /site Architecture 7.5% 7.5% 7.5% 7.5% of Hard Costs Engineering 2.5% 2.5% 2.5% 2.5% of Hard Costs Insurance Costs n.a. n.a. $10,000 $25,000 /unit Development Impact Fees (b) $200,320 Total Leasing Commission $0.60 /S.F. Project Contingency 10% 10% 5% 5% 5% of hard & soft costs Developer Overhead 5% 5% 5% 5% of hard & soft costs
Parking Costs Spaces/1,000 S.F., Commercial n.a. 0.0 3.0 n.a. n.a. Spaces/1,000 S.F. Spaces/Unit, Residential n.a. n.a. n.a. #DIV/0! #DIV/0! Spaces/Unit Parking Spaces 45 0 45 0 0 Spaces Parking Construction Costs, Surf. 45 spaces $4,000 /Space
Monthly Revenues and Expenses Commercial Lease Rate/S.F., NNN(c) $2.00 $1.50 n.a. n.a. /Leasable S.F. Parking Rate/Space $50 /Space Vacancy Rate (d) 10.0% 10% n.a. 10% /Bldg S.F. Unrecoverable Expenses, Commercial(e) 5.0% 8.7% n.a. n.a. of NNN rent Operating Expenses, Apartments n.a. n.a. n.a. $292 /Unit Operating Expenses, Parking (f) $0 n.a. n.a. n.a. n.a. /Space Capital Reserves Fund (f) $0 $0 n.a. n.a. /Bldg S.F.
Residential Program Square Feet Units Rental Price Sale Price ($/sq.ft) ($/sq ft) Townhouse, 1-bedroom (c) 0 0 $0 $235 Townhouse, 2-bedroom (c) 0 0 $0 $220 Flat, Studio (c) 0 0 $0 $250 Flat, 1-bedroom (c) 0 0 $0 $212 Flat, 2-bedroom (c) 0 0 $0 $198
Financing Costs Construction Period 1 Years Max. Loan to Cost Ratio 0.8 of Total Value Construction Loan Rate 9.25% of Total Loan Drawdown Factor 0.55 of Total Loan Construction Loan Fees 1.0% of Total Loan Permanent Loan Fees 1.0% of Total Loan Interim Taxes (12 Months) 1.2% (minus a 0.55 drawdown factor) of Hard & Soft Costs
Revenue Goal Assumptions Return on Investment 14.0% of Total Costs Developer Profit on Cost (for-sale) 15.0% Cap rate 8.0% 7.5%
Notes and References:(a) Woodframe construction with sound and fire isolation between uses. (b) City of Sacramento Permit Services(c) BAE Market Analysis(d) 10% vacancy is used in order to validate project feasibility under relatively soft market conditions(e) Office expenses from Building Owners and Managers Association, "Experience Exchange Report" 2005.(f) Included in building operating expensesItems which are not referenced were collected from developers and/or bankers, most of whom asked not to be named.
Sources: City of Sacramento, 2006; Building Owners and Managers Association, 2005; Bay Area Economics, 2006.

Table 20a: Royal Oaks Station Development Prototype and Pro-Forma Northeast Transit Line, Sacramento CA
Site 3Royal Oaks Station
ResidentialDEVELOPMENT PROGRAM
Site acreage 0.88Total building square feet 39,320Building storeys 3Retail, building square feet 0Office, building square feet 0Residential, flats 8Residential, townhouses & live-work 28Off-street parking spaces 58Residential units/acre 41
PRO-FORMA
Hard Costs $4,911,448Soft Costs $1,614,827Overhead and Contingency $974,791Developer Profit $1,125,160Total Development Costs $8,626,225
Retail Net Operating Income, Monthly n.a.Office Net Operating Income, Monthly n.a.Apartment Net Operating Income, Monthly n.a.Parking Net Operating Income, Monthly n.a.Net Operating Income, Annual $0
Sale Proceeds, Residential $8,491,800Sales Commission and Marketing ($509,508)Net Sale Proceeds $7,982,292
FEASIBILITY CRITERIA
Gross Profit $0Gross Profit Goal 15%
LAND RESIDUAL (Land Price to Meet Feasibility Criteria)Land Residual Value (Gap) ($643,933)
ADDITIONAL COSTS - ILLUSTRATION ONLYInfrastructure (a) $176,000Land acquisition ($20/ sq ft) $766,656Demolition cost (b) $30,800Total $973,456
Notes:Pro-forma calculations include on-site construction and costs only. Additional costs of demolition, land acquisition, and infrastructure which is not available at the site, or off-site public improvements will require additional funds, which are estimated below the main pro-forma. a) Estimates provided by Nolte Associates.b) Based on estimated demolition costs of $4 per building square feet of existing structures on site.
Sources: Nolte Associates, Bay Area Economics, 2006.

Table 20b: Estimated Development Cost, Royal Oaks Station Site Northeast Transit Line, Sacramento CA
HARD COSTS Retail Hard Costs (a) 0 Bldg S.F. $0 /Bldg S.F. $0 Office Hard Costs 0 Bldg S.F. $0 /Bldg S.F. $0 Residential (Townhouse) Hard Costs 33,600 Bldg S.F. $110 /Bldg S.F. $3,696,000 Residential (Flat) Hard Costs 5,720 Bldg S.F. $121 /Bldg S.F. $692,120 Parking, Surface 10 Spaces $4,000 /Space $40,000 Site Improvements 38,333 Site S.F. $10 /S.F. $383,328 Landscaping $100,000 /site $100,000Total Hard Costs $4,911,448
SOFT COSTS Architecture & Engineering Fees $4,911,448 Total Hard Costs 10.0% of Hard Costs $491,145 Insurance 36 For-sale units $10,000 /unit $360,000 Development Impact Fees $395,864 Leasing Commission - Leasable S.F. $0.60 /S.F. $0 Total Construction Loan Costs $4,668,326 Loan $7.32 /Bldg S.F., avg $284,184 Permanent Loan Fees $4,668,326 Loan 1.0% of Loan $46,683 Interim Taxes $6,158,456 Hard & Soft Costs 1.2% of Hard & Soft Costs $36,951Total Soft Costs $1,614,827
Developer Overhead $6,526,275 Hard & Soft Costs 5% of Hard & Soft Costs $326,314Project Contingency $6,484,770 Hard & Soft Costs (b) 10% of Hard & Soft Costs $648,477Developer Profit $7,501,065 Hard & Soft Costs (c) 15% of Hard and Soft Costs $1,125,160
Total Development Costs: $8,626,225Less Net Sales Proceeds (d) ($7,982,292)Net Development Costs: $643,933
Notes:On-site construction and costs only. Any infrastructure which is not available at the site, or off-site public improvements will require additional funds.a) Woodframe construction with sound and fire isolation between uses and stacked flatsb) Project contingency costs are applied to all costs except loan costs and taxes.c) Developer profit is applied to all costs.d) Detailed in Table 4c, "Estimated Sale Proceeds"
Source: Bay Area Economics, 2006.
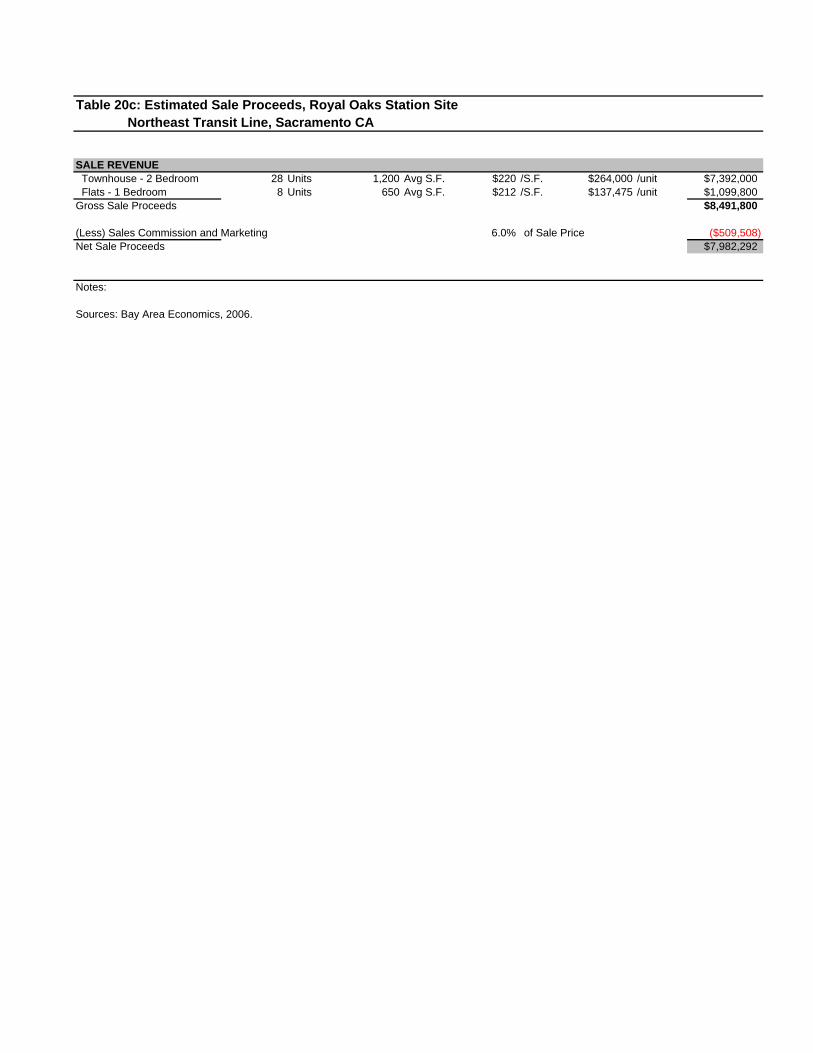
Table 20c: Estimated Sale Proceeds, Royal Oaks Station Site Northeast Transit Line, Sacramento CA
SALE REVENUE Townhouse - 2 Bedroom 28 Units 1,200 Avg S.F. $220 /S.F. $264,000 /unit $7,392,000 Flats - 1 Bedroom 8 Units 650 Avg S.F. $212 /S.F. $137,475 /unit $1,099,800Gross Sale Proceeds $8,491,800
(Less) Sales Commission and Marketing 6.0% of Sale Price ($509,508)Net Sale Proceeds $7,982,292
Notes:
Sources: Bay Area Economics, 2006.

Table 20d: Development Assumptions, Royal Oaks Station Site Northeast Transit Line, Sacramento CA
DEVELOPMENT ASSUMPTIONS
Development Program All Retail Office Res., TH Res., Flat Site acreage 0.88 Acres Building Storeys 3 Building Area 39,320 0 0 33,600 5,720 Bldg. S.F. Leasable Area 38,800 0 0 33,600 5,200 Leasable S.F. Residential Units n.a. n.a. n.a. 28 8 Units Landscaping S.F.
Development Cost Assumptions Building Hard Costs (a) $110 $121 /S.F. Site Improvements $10 /S.F. Landscaping Allowance $100,000 /site Architecture 7.5% 7.5% 7.5% 7.5% of Hard Costs Engineering 2.5% 2.5% 2.5% 2.5% of Hard Costs Insurance Costs n.a. n.a. $10,000 $25,000 /unit Development Impact Fees (b) $395,864 Total Leasing Commission $0.60 /S.F. Project Contingency 10% 10% 5% 5% 5% of hard & soft costs Developer Overhead 5% 5% 5% 5% of hard & soft costs
Parking Costs Spaces/1,000 S.F., Commercial n.a. #DIV/0! 0.0 n.a. n.a. Spaces/1,000 S.F. Spaces/Unit, Residential n.a. n.a. n.a. 1.8 1.0 Spaces/Unit Parking Spaces 58 0 0 50 8 Spaces Parking Construction Costs, Surf. 10 spaces $4,000 /Space
Monthly Revenues and Expenses Commercial Lease Rate/S.F., NNN(c) $2.00 $1.50 n.a. n.a. /Leasable S.F. Parking Rate/Space $50 /Space Vacancy Rate (d) 10.0% 10% n.a. 10% /Bldg S.F. Unrecoverable Expenses, Commercial(e) 5.0% 8.7% n.a. n.a. of NNN rent Operating Expenses, Apartments n.a. n.a. n.a. $292 /Unit Operating Expenses, Parking (f) $0 n.a. n.a. n.a. n.a. /Space Capital Reserves Fund (f) $0 $0 n.a. n.a. /Bldg S.F.
Residential Program Square Feet Units Rental Price Sale Price ($/sq.ft) ($/sq ft) Townhouse, 1-bedroom (c) 0 0 $0 $235 Townhouse, 2-bedroom (c) 1200 28 $0 $220 Flat, Studio (c) 0 0 $0 $225 Flat, 1-bedroom (c) 650 8 $0 $212 Flat, 2-bedroom (c) 0 0 $0 $198
Financing Costs Construction Period 1 Years Max. Loan to Cost Ratio 0.8 of Total Value Construction Loan Rate 9.25% of Total Loan Drawdown Factor 0.55 of Total Loan Construction Loan Fees 1.0% of Total Loan Permanent Loan Fees 1.0% of Total Loan Interim Taxes (12 Months) 1.2% (minus a 0.55 drawdown factor) of Hard & Soft Costs
Revenue Goal Assumptions Return on Investment 14.0% of Total Costs Developer Profit on Cost (for-sale) 15.0% Cap rate 8.0% 7.5%
Notes and References:(a) Woodframe construction with sound and fire isolation between uses. (b) City of Sacramento Permit Services(c) BAE Market Analysis(d) 10% vacancy is used in order to validate project feasibility under relatively soft market conditions(e) Office expenses from Building Owners and Managers Association, "Experience Exchange Report" 2005.(f) Included in building operating expensesItems which are not referenced were collected from developers and/or bankers, most of whom asked not to be named.
Sources: City of Sacramento, 2006; Building Owners and Managers Association, 2005; Bay Area Economics, 2006.

Table 21: Development Impact Fees Northeast Transit Line, Sacramento CA
Globe Arden/Del Paso Royal Oaks
Fire Dept Review Fee $1,200 $912 $1,554Construction Excise Tax $18,653 $16,243 $28,957General Plan Fee $1,497 $1,198 $2,362Strong Motion Fee $233 $203 $200City Business Operations $1,015 $812 $1,601Housing Trust Fund $2,258 $41,200 $0Housing Trust Fund Administration $110 $50 $0Water Supply Report $50 $110 $110Water Development Fee $79,473 $67,127 $67,127Utilities Fee Deposit $300 $300 $300Public Works Deposit $300 $300 $300Building Permit Fee $17,613 $14,180 $25,909Landscape Review Fee $50 $50 $50Plan Review Fee $14,395 $11,586 $21,182Residential Construction Tax $8,505 $0 $11,340Park Development Impact Fee $34,443 $3,600 $43,388Technology Fee $1,280 $1,031 $1,884Water Supply Test $475 $475 $475Sewer Development Fee $124 $124 $124Erosion & Sediment Control $500 $500 $500School Impact Fees $73,448 $10,080 $115,601Regional Sanitation Fees $80,136 $30,240 $72,900Public Improvements Estimate $0 $0 $0
$336,057 $200,320 $395,864$/Building Square Foot $10.65 $8.35 $10.07
Notes:Does not include impact fees for off-site public improvements
Sources: City of Sacramento Permit Services, Sacramento Regional County Sanitation District, Grant Joint Union High School District, Bay Area Economics, 2006
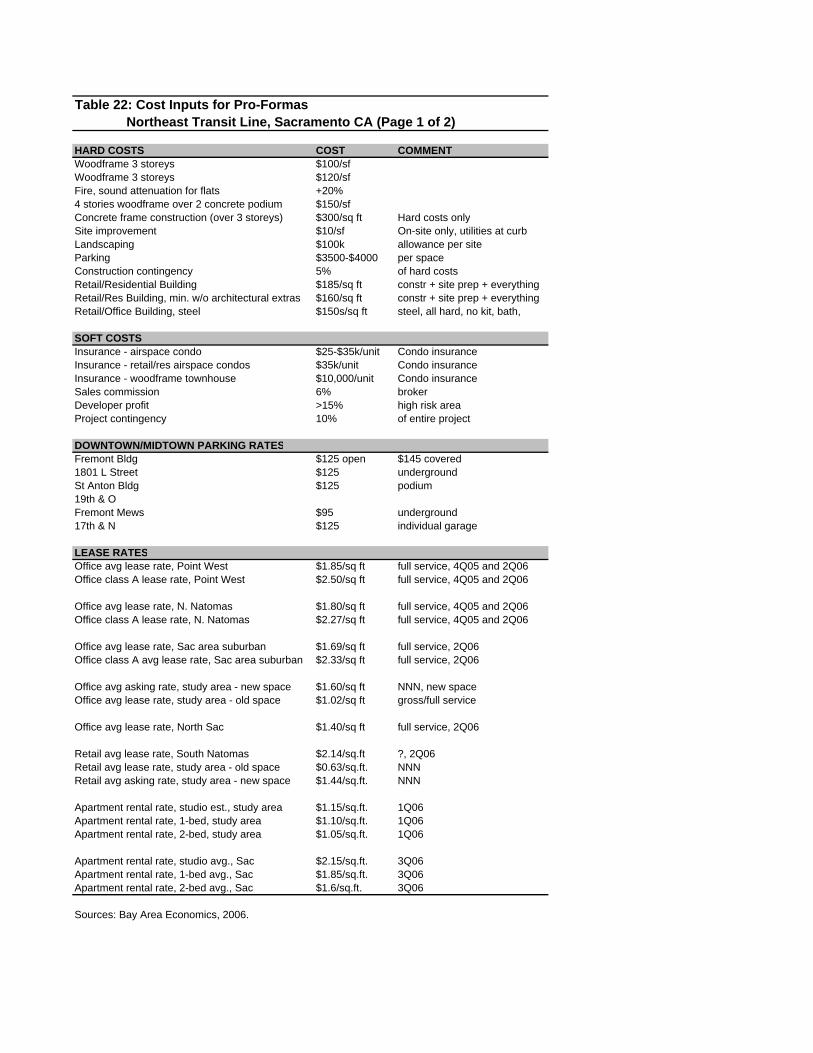
Table 22: Cost Inputs for Pro-Formas Northeast Transit Line, Sacramento CA (Page 1 of 2)
HARD COSTS COST COMMENTWoodframe 3 storeys $100/sfWoodframe 3 storeys $120/sfFire, sound attenuation for flats +20%4 stories woodframe over 2 concrete podium $150/sfConcrete frame construction (over 3 storeys) $300/sq ft Hard costs onlySite improvement $10/sf On-site only, utilities at curbLandscaping $100k allowance per siteParking $3500-$4000 per spaceConstruction contingency 5% of hard costsRetail/Residential Building $185/sq ft constr + site prep + everything Retail/Res Building, min. w/o architectural extras $160/sq ft constr + site prep + everything Retail/Office Building, steel $150s/sq ft steel, all hard, no kit, bath,
SOFT COSTSInsurance - airspace condo $25-$35k/unit Condo insuranceInsurance - retail/res airspace condos $35k/unit Condo insuranceInsurance - woodframe townhouse $10,000/unit Condo insuranceSales commission 6% brokerDeveloper profit >15% high risk areaProject contingency 10% of entire project
DOWNTOWN/MIDTOWN PARKING RATESFremont Bldg $125 open $145 covered1801 L Street $125 undergroundSt Anton Bldg $125 podium19th & OFremont Mews $95 underground17th & N $125 individual garage LEASE RATESOffice avg lease rate, Point West $1.85/sq ft full service, 4Q05 and 2Q06 Office class A lease rate, Point West $2.50/sq ft full service, 4Q05 and 2Q06
Office avg lease rate, N. Natomas $1.80/sq ft full service, 4Q05 and 2Q06 Office class A lease rate, N. Natomas $2.27/sq ft full service, 4Q05 and 2Q06
Office avg lease rate, Sac area suburban $1.69/sq ft full service, 2Q06Office class A avg lease rate, Sac area suburban $2.33/sq ft full service, 2Q06
Office avg asking rate, study area - new space $1.60/sq ft NNN, new spaceOffice avg lease rate, study area - old space $1.02/sq ft gross/full service
Office avg lease rate, North Sac $1.40/sq ft full service, 2Q06
Retail avg lease rate, South Natomas $2.14/sq.ft ?, 2Q06Retail avg lease rate, study area - old space $0.63/sq.ft. NNNRetail avg asking rate, study area - new space $1.44/sq.ft. NNN
Apartment rental rate, studio est., study area $1.15/sq.ft. 1Q06Apartment rental rate, 1-bed, study area $1.10/sq.ft. 1Q06Apartment rental rate, 2-bed, study area $1.05/sq.ft. 1Q06
Apartment rental rate, studio avg., Sac $2.15/sq.ft. 3Q06Apartment rental rate, 1-bed avg., Sac $1.85/sq.ft. 3Q06Apartment rental rate, 2-bed avg., Sac $1.6/sq.ft. 3Q06
Sources: Bay Area Economics, 2006.

Table 22: Cost Inputs for Pro-Formas Northeast Transit Line, Sacramento CA (Page 2 of 2)
SALE PRICESCondo sales in Sac area $167-$343/sf $249 avg. 2Q, 3Q06 Hanley Wood, Sperry Van NessCondo conversions in Sac area $167-$245/sf $202 avg. 2Q, 3Q06 Hanley Wood, Sperry Van NessCondo conversion in Carmichael (direct comp.) $202-$221/sf 3Q06 Sperry Van NessRecommended small condo in Study Area $250/sf 3Q06 BAE reportRecommended small condo conv. in Study Area $200/sf 3Q06 BAE reportCondo studio 725 sf $245/sf 3Q06 DeveloperCondo 1 BR 850 sf $235/sf 3Q06 DeveloperCondo 1/den/1.5 $230/sf 3Q06 DeveloperCondo 2BR 1100 sf $221/sf 3Q06 DeveloperCondo 2/den/2.5 $220/sf 3Q06 DeveloperCondo 3 BR $215/sf 3Q06 DeveloperFor-sale SFD average sale price, Study Area $265/sf approx 2Q2006 BAE
Retail asking sale prices in Study Area $114-$282/sf 3Q06 BAE reportOffice asking sale prices in Study Area $250/sf 3Q06 BAE reportRetail/office actual sale prices in Study Area $94-$241/sf 3Q06 BAE report
OPERATING COSTSRetail - Capital reserves 1.00% of effective gross income Cal. Redev. AgencyRetail - Management fee 3.00% of effective gross income Cal. Redev. AgencyRetail - Management fee 3.65% of total receipts $&c of Neighborhood Shopping Ctrs, 2004
Office - Administrative expenses 8.70% of total receipts Building Owners & Mgrs Assoc, 2005
Apartment - General Operating Exp. $2,500 per unit Cal. Redev AgencyApartment - Management 4.00% of gross effective income Cal. Redev AgencyApartment - Capital reserves 1.50% of gross income Cal. Redev AgencyApartment - Property Taxes 1.00% of apartment value Cal. Redev AgencyApt - Operating Expenses - Sr Aff, small project $3,000 per unit per year Kevin Smith, USAApt - Operating Expenses - All-age Aff, small proje$4,000 per unit per year Kevin Smith, USAApt - Operating Expenses - Elevator - add $250 per unit per year Kevin Smith, USA
RETURNCap rate - office, premium space in Sac 4.0 - 5.0 DeveloperCap rate - office B market in Sac area 5.0 - 6.0 DeveloperCap rate - office C market in Sac, est. 6.5 - 7.5 Developer
Cap rate - retail in Redding 8-9% BankCap rate - office in Redding 8 - 8.5% BankCap rate - MF in Redding 7.5-8% Bank
Cap rate - retail in Davis about 7% Has seen 6% recently BankCap rate - office in Davis 7% BankCap rate - MXU building 7% Not linear, use 7% as estimate Bank Sources: Bay Area Economics, 2006.

Funding Opportunities
The best opportunities for public funding to assist these catalytic projects are prior to construction, after construction, or by providing the off-site requirements related to the project. While it is not always feasible for public funding to be provided directly for the construction of a project, the City or Agency can make a project much more attractive for development by reducing the risk and time associated with the project, or by improving the efficiency by assembling small parcels into a larger site. The following list summarizes some of these opportunities: Assemble parcels. The per-square-foot cost of development is lower on a relatively large site which allows for design and construction efficiencies. The Agency can improve the financial feasibility of a project by assembling parcels to provide a site of at least one acre. Purchase and prepare site for sale to developer. The cost and risk of a project can be reduced if the City or Agency buys improved land and does all demolition. The Agency then sells the cleared land to the developer at the market rate, absorbing the cost of demolition and the lost value. Provide ready-to-build site. Cost and risk are also reduced if the Agency ensures that utilities and other infrastructure requirements are brought directly to the site, and any underground issues - such as contamination - are evaluated and addressed. Purchase and entitle site for sale to developer. In this case, the risk is further reduced and the developer can take a lower return on investment, since the return will be generated faster. If a specific building design is entitled, the Agency will issue an RFP for developers, and sell the land after architecture and engineering is complete. Finance necessary public improvements. In the case where the permit department determines that off-site public improvements are necessary for a project, the City could finance these as part of general improvements in the area. Public improvements might include lighting, landscaping, or changes to an intersection or median. Small-business loans or grants for finishing retail space and making tenant improvements. The first retail tenants for an area undergoing revitalization are often local retailers rather than the better funded and more experienced regional or national chains. As a result, they may not be prepared for the initial cost of finishing retail space which is provided as “cold-shell” (a dry-walled box which requires inner walls, ceilings, HVAC equipment and ducts, utility closet and all finishes and fixtures.) Loans or grants which provide funding of approximately $50 per square foot to finish the space can increase the chance that early retail tenants will be successful, and reduce the negative effects of tenant turn-over or unleased space. Provide assistance with building operations. The City or Agency could carry the cost of some of the building operations, for example, providing security staffing. Underwrite rents for retail and/or office projects. The pro-formas show that a retail/office project is likely to need considerable assistance in the early years, until lease rates increase to a level which provides the developer with an appropriate return. One way to do this would be for
106

the City or Agency to rent space at a higher rate than market, either for their own use, or to sub-lease at lower rates to non-profits, incubator companies or other pioneers. This approach takes significant political commitment to implement, since it is likely to require a lease of at least five years, and possibly longer if the lender is concerned about the investment. Designate a revolving low-interest loan to support new commercial projects in the area. An alternative way that the City or Agency could support a retail/office project would be to provide a low-interest loan that would cover the financing gap until market rents in the area increased sufficiently to provide an appropriate return. Identify and remove barriers to infill development. Infill development is notoriously challenging, partly due to City regulations. As one example, during this research for this study, BAE was told that the City encourages infill development by offering a waiver for water development fees, but that it did not apply to our catalytic prototype projects because it is only for single-family detached units. A study to identify and remove regulatory and cost barriers to infill development could have lasting effects. Resources City of Sacramento. The City of Sacramento’s Economic Development Department has Capital Improvement Program funds amounting to $2 million per year. These funds are set aside out of the transportation and utility departments for economic development programs developed in cooperation with the departments. Funds can be used for off-site improvements including streets, gutters, sidewalks and streetlights, and bringing utilities for construction to the property line. If the funds are used to make improvements as part of a larger project – rather than a particular development – then the development has no associated obligations. Sacramento Housing & Redevelopment Agency. SHRA is a joint powers authority separate from the City with funding from tax increments in the redevelopment area and also Community Development Block Grant (CDBG) funds from HUD. For new construction, SHRA programs include Developer’s Assistance, under which custom deals can be structured for the Agency to provide gap financing for individual projects. This program has a budget of $0.5 million, and does not generate a requirement for affordable units if tax increment funding is used. The Housing Development Assistance program provides funding for multi-family housing, and also has a $0.5 million budget. This program does have an affordable requirement. The Grow Sacramento fund is administered by SHRA for the City and County, and provides SBA guaranteed loans of $25,000 to $2 million for a wide range of uses, including land acquisition, construction, equipment leases and long-term working capital.
107

Pro-Forma Analysis Conclusions
The pro-forma analysis showed that a mixed-use project similar to the prototypes evaluated in the Northeast Corridor is likely to require some form of public investment in order to be financially feasible. Of the different land uses, residential projects are the most profitable, and a relatively high density project of townhouses or single-family detached units could be profitable at market rates. Retail and office projects are less feasible, due to the relatively low market rents in the area. Since retail and mixed-use retail/residential projects are desirable near Globe Station in the short term and near Arden-Del Paso in the longer term, the City and/or the Redevelopment Agency will need to consider how best to facilitate this kind of project. It is clear from the analysis and from discussions with local developers, that the feasibility of a project in this location depends strongly on the specifics of the design, which in turn affects the cost structure. Based on the information obtained from both the market analysis and the pro-formas, BAE recommends that the City begin with a project with a large for-sale residential component at a site on Del Paso Boulevard near the Globe station or the Arden Way station. Due to the possibility of a residential project at the Lumberjack site, additional construction near the Royal Oaks station should be delayed until the market impact of this project can be evaluated. The pro-formas show that a for-sale residential project can be profitable, and also that the specific design can have a significant effect on the profitability. One design that has not been analyzed in the pro-formas is a very high density, primarily residential prototype resembling the St. Anton Building on 21st and L Streets, and this prototype would be worth investigating further. The project would need to be designed with an eye to both the profitability and the urbanism. With a small amount of retail and/or office space at the ground floor, and an optimal design of the residential component, this could be achieved. The market analysis also showed demand for a commercial building with retail on the ground floor and offices above, however, a project like this would require support from the City or the Agency until market rents provide an appropriate return. While construction costs for a restaurant are higher than for other commercial space, rents are also higher, and this would be a use particularly well suited to TOD. The use and design of subsequent projects could be considered once it is seen how this initial retail/residential or retail/office project and others currently in the planning stage are implemented and received in the marketplace. The City can facilitate the project by assembling parcels to enable a more efficient project, by providing assistance in different ways before or after the actual construction, and by conducting a study of regulatory barriers to infill development, and removing these wherever feasible.
108

Appendices
109

Appendix A: North Sacramento Census Block Groups
Tract Block Group54.02 154.02 254.02 354.02 454.02 562.01 462.02 162.02 262.02 362.02 4
63 163 263 363 463 564 164 264 364 464 565 165 265 365 465 566 166 266 366 466 5
67.01 167.01 267.01 367.02 167.02 267.02 367.02 4
68 168 268 368 468 569 169 269 369 469 569 6
72.04 172.04 272.04 374.13 4
Sources: U.S. Census, 2000; BAE, 2006.

Æb
Arden-Del Paso Station
Lochbrae Rd
Zoning1/4 Mile Radius
Heavy Industrial
Light Industrial
Neighborhood Commercial/Office
Low Density Residential
Medium Density Residential
Medium-High Density Residential
Moderate-Intensity Office
Open Space
Public/Quasi-Public
Appendix B: Existing Zoning, Globe Station
®
Globe Station
Del Paso Blvd
Southgate Rd
Lochbrae Rd
El Monte Rd
Barstow St
Acoma St
Colfax St
Dale Ave
Globe Ave

Æb Arden Way
Del Paso Blvd
Arden-Del Paso Station
Oxf
ord
St
Forr
est S
t
Oxf
ord
St
Can
tebu
ry R
d
Woodlake Dr
El Monte Ave
Gro
ve A
ve
Hawthorne St
Gibson St
Forrest St
Fairf
ield
St
Lochbrae Rd
Calvados Ave
Globe Station
Zoning1/4 Mile Radius
Heavy Industrial
Light Industrial
Neighborhood Commercial/Office
Low Density Residential
Medium Density Residential
Medium-High Density Residential
Moderate-Intensity Office
Open Space
Public/Quasi-Public
Appendix C: Existing Zoning, Arden/Del Paso Station
®

Æby
Arden-Del Paso Station
Fairf
ield
St
Roy
al O
aks
Dr
Arden Way
Evergreen St
Beau
mon
t St
Em
pres
s St
Box
woo
d St
Er ic
k so n
St
Ever
gree
n S
t
Cam
brid
ge S
t
Oak
mon
t St
Calvados Ave
Dixieanne Ave
Can
talie
r St
Blackwood St
Royal Oaks Station
Zoning1/4 Mile Radius
Heavy Industrial
Light Industrial
Neighborhood Commercial/Office
Low Density Residential
Medium Density Residential
Medium-High Density Residential
Moderate-Intensity Office
Office Building
Open Space
Public/Quasi-Public
Appendix D: Existing Zoning, Royal Oaks Station
®


![6. [pro forma] project pro-forma james horbury](https://static.fdocuments.net/doc/165x107/588684481a28ab962a8b7881/6-pro-forma-project-pro-forma-james-horbury.jpg)