Marine Renewables Infrastructure Network - MaRINET2 Access Report Infrastructure: TECNALIA...
23
Infrastructure Access Report Infrastructure: TECNALIA Electrical PTO Lab User‐Project: REWELPO REWEC3‐Electrical PTO system Optimization Mediterranea University of Reggio Calabria Marine Renewables Infrastructure Network Status: Final Version: 02 Date: 26‐Jul‐2014 EC FP7 “Capacities” Specific Programme Research Infrastructure Action
Transcript of Marine Renewables Infrastructure Network - MaRINET2 Access Report Infrastructure: TECNALIA...

Infrastructure Access Report
Infrastructure: TECNALIA Electrical PTO Lab
User‐Project: REWELPO
REWEC3‐Electrical PTO system Optimization
Mediterranea University of Reggio Calabria
Marine Renewables Infrastructure Network
Status: Final Version: 02 Date: 26‐Jul‐2014
EC FP7 “Capacities” Specific Programme Research Infrastructure Action

Infrastructure Access Report: REWELPO
Rev. 02, 26‐Jul‐2014 Page 2 of 23
ABOUTMARINETMARINET (Marine Renewables Infrastructure Network for emerging Energy Technologies) is an EC‐funded network of research centres and organisations that are working together to accelerate the development of marine renewable energy ‐ wave, tidal & offshore‐wind. The initiative is funded through the EC's Seventh Framework Programme (FP7) and runs for four years until 2015. The network of 29 partners with 42 specialist marine research facilities is spread across 11 EU countries and 1 International Cooperation Partner Country (Brazil). MARINET offers periods of free‐of‐charge access to test facilities at a range of world‐class research centres. Companies and research groups can avail of this Transnational Access (TA) to test devices at any scale in areas such as wave energy, tidal energy, offshore‐wind energy and environmental data or to conduct tests on cross‐cutting areas such as power take‐off systems, grid integration, materials or moorings. In total, over 700 weeks of access is available to an estimated 300 projects and 800 external users, with at least four calls for access applications over the 4‐year initiative. MARINET partners are also working to implement common standards for testing in order to streamline the development process, conducting research to improve testing capabilities across the network, providing training at various facilities in the network in order to enhance personnel expertise and organising industry networking events in order to facilitate partnerships and knowledge exchange. The aim of the initiative is to streamline the capabilities of test infrastructures in order to enhance their impact and accelerate the commercialisation of marine renewable energy. See www.fp7‐marinet.eu for more details.
Partners Ireland
University College Cork, HMRC (UCC_HMRC) Coordinator
Sustainable Energy Authority of Ireland (SEAI_OEDU)
Denmark
Aalborg Universitet (AAU)
Danmarks Tekniske Universitet (RISOE)
France
Ecole Centrale de Nantes (ECN)
Institut Français de Recherche Pour l'Exploitation de la Mer (IFREMER)
United Kingdom
National Renewable Energy Centre Ltd. (NAREC)
The University of Exeter (UNEXE)
European Marine Energy Centre Ltd. (EMEC)
University of Strathclyde (UNI_STRATH)
The University of Edinburgh (UEDIN)
Queen’s University Belfast (QUB)
Plymouth University(PU)
Spain
Ente Vasco de la Energía (EVE)
Tecnalia Research & Innovation Foundation (TECNALIA)
Belgium
1‐Tech (1_TECH)
NetherlandsStichting Tidal Testing Centre (TTC)
Stichting Energieonderzoek Centrum Nederland (ECNeth)
Germany Fraunhofer‐Gesellschaft Zur Foerderung Der Angewandten Forschung E.V (Fh_IWES)
Gottfried Wilhelm Leibniz Universität Hannover (LUH)
Universitaet Stuttgart (USTUTT)
Portugal Wave Energy Centre – Centro de Energia das Ondas (WavEC)
Italy Università degli Studi di Firenze (UNIFI‐CRIACIV)
Università degli Studi di Firenze (UNIFI‐PIN)
Università degli Studi della Tuscia (UNI_TUS)
Consiglio Nazionale delle Ricerche (CNR‐INSEAN)
Brazil Instituto de Pesquisas Tecnológicas do Estado de São Paulo S.A. (IPT)
Norway Sintef Energi AS (SINTEF)
Norges Teknisk‐Naturvitenskapelige Universitet (NTNU)

Infrastructure Access Report: REWELPO
Rev. 02, 26‐Jul‐2014 Page 3 of 23
DOCUMENTINFORMATIONTitle REWEC3‐Electrical PTO system Optimization
Distribution Public
Document Reference MARINET‐TA1‐REWELPO
User‐Group Leader, Lead Author
Felice Arena Mediterranea University of Reggio Calabria DICEAM, Loc. Feo di Vito, Reggio Calabria (Italy). E‐mail: [email protected]
User‐Group Members, Contributing Authors
Alessandra Romolo Mediterranea University of Reggio Calabria Giovanni Malara Mediterranea University of Reggio Calabria Valentina Laface Mediterranea University of Reggio Calabria Federica Maria StratiMediterranea University of Reggio Calabria
Infrastructure Accessed: TECNALIA Electrical PTO Lab
Infrastructure Manager (or Main Contact)
Joseba Lopez Mendia
REVISIONHISTORYRev. Date Description Prepared by
(Name) Approved By Infrastructure
Manager
Status (Draft/Final)
01 15/07/2014 Report draft Felie Arena, Alessandra
Romolo, Giovanni Malara, Valentina Laface, Federica Maria Strati
Draft
02 26/07/2014 Final report Felie Arena, Alessandra
Romolo, Giovanni Malara, Valentina Laface, Federica Maria Strati
yes Final

Infrastructure Access Report: REWELPO
Rev. 02, 26‐Jul‐2014 Page 4 of 23
ABOUTTHISREPORTOne of the requirements of the EC in enabling a user group to benefit from free‐of‐charge access to an infrastructure is that the user group must be entitled to disseminate the foreground (information and results) that they have generated under the project in order to progress the state‐of‐the‐art of the sector. Notwithstanding this, the EC also state that dissemination activities shall be compatible with the protection of intellectual property rights, confidentiality obligations and the legitimate interests of the owner(s) of the foreground. The aim of this report is therefore to meet the first requirement of publicly disseminating the knowledge generated through this MARINET infrastructure access project in an accessible format in order to:
progress the state‐of‐the‐art
publicise resulting progress made for the technology/industry
provide evidence of progress made along the Structured Development Plan
provide due diligence material for potential future investment and financing
share lessons learned
avoid potential future replication by others
provide opportunities for future collaboration
etc. In some cases, the user group may wish to protect some of this information which they deem commercially sensitive, and so may choose to present results in a normalised (non‐dimensional) format or withhold certain design data – this is acceptable and allowed for in the second requirement outlined above.
ACKNOWLEDGEMENTThe work described in this publication has received support from MARINET, a European Community ‐ Research Infrastructure Action under the FP7 “Capacities” Specific Programme.
LEGALDISCLAIMERThe views expressed, and responsibility for the content of this publication, lie solely with the authors. The European Commission is not liable for any use that may be made of the information contained herein. This work may rely on data from sources external to the MARINET project Consortium. Members of the Consortium do not accept liability for loss or damage suffered by any third party as a result of errors or inaccuracies in such data. The information in this document is provided “as is” and no guarantee or warranty is given that the information is fit for any particular purpose. The user thereof uses the information at its sole risk and neither the European Commission nor any member of the MARINET Consortium is liable for any use that may be made of the information.

Infrastructure Access Report: REWELPO
Rev. 02, 26‐Jul‐2014 Page 5 of 23
EXECUTIVESUMMARYThe Resonant Wave Energy Converter 3 (REWEC3) is an Oscillating Water Column (OWC) type wave energy converter. It is composed by a chamber with a water column in the lower part and an air pocket at the top. The air pocket is connected to the atmosphere by a duct hosting a turbine. The wave motion induces oscillations of the water column which, in turn, induces an alternating flow on the turbine. Such a flow is exploited by specific turbines (such as Wells, impulse, etc.) that are able to rotate always in the same direction. The peculiarity of the REWEC3 is the presence of a small vertical (U‐shaped) duct connecting the water column to the open wave field. Such a small change in the configuration allows improving the performance of the device from the perspective of energy exploitation. Indeed, recent experimental works proved that it can reach resonance with incoming waves without the use of phase control devices. So that, the extraction of wave energy can be maximized by properly designing the geometrical configuration of the device. Hydrodynamics and optimization of the REWEC3 are discussed in a number of papers, but no specific considerations have been proposed on the PTO performance with this specific device. Specifically, the choice of the optimal turbine rotational speed for a given sea state and a given turbine, as well as the determination of an effective control algorithm, are still an open issue. In this context, the present MARINET project is the first step in the description of the REWEC3 – PTO system as a whole. The project has been developed by relying on adequate numerical algorithms for simulating the REWEC3 dynamics and on the Tecnalia test bench for measuring the power output of the PTO. Starting from a given REWEC3 and turbine configuration, a number of experiments have been carried out. The key findings of the project are: determination of an optimal reference rotational speed for given sea state; differentiation of the system behaviour in case of wind‐generated waves and swells. In addition, in the light of the MARINET objectives, a further result relates to the determination of the future steps for developing an optimized REWEC3 – PTO system.

Infrastructure Access Report: REWELPO
Rev. 02, 26‐Jul‐2014 Page 6 of 23
CONTENTS
1 INTRODUCTION & BACKGROUND .................................................................................................................... 7
1.1 INTRODUCTION .................................................................................................................................................... 7 1.2 DEVELOPMENT SO FAR .......................................................................................................................................... 8 1.2.1 Stage Gate Progress .................................................................................................................................... 8 1.2.2 Plan For This Access ..................................................................................................................................... 9
2 OUTLINE OF WORK CARRIED OUT .................................................................................................................... 9
2.1 SETUP ................................................................................................................................................................. 9 2.1.1 GENERAL DESCRIPTION OF ELECTRICAL PTO LAB .................................................................................................... 9 2.1.2 REWEC3 CONFIGURATION .............................................................................................................................. 11 2.2 TESTS ............................................................................................................................................................... 12 2.2.1 Test Plan .................................................................................................................................................... 12 2.2.2 Test procedure ........................................................................................................................................... 13 2.3 RESULTS ............................................................................................................................................................ 16 2.4 ANALYSIS & CONCLUSIONS ................................................................................................................................... 16
3 MAIN LEARNING OUTCOMES ......................................................................................................................... 22
3.1 PROGRESS MADE ............................................................................................................................................... 22 3.1.1 Progress Made: For This User‐Group or Technology ................................................................................. 22 3.1.2 Progress Made: For Marine Renewable Energy Industry .......................................................................... 22 3.2 KEY LESSONS LEARNED ........................................................................................................................................ 23
4 REFERENCES ................................................................................................................................................... 23

Infrastructure Access Report: REWELPO
Rev. 02, 26‐Jul‐2014 Page 7 of 23
1 INTRODUCTION&BACKGROUND
1.1 INTRODUCTIONThe Resonant Wave Energy Converter (REWEC) is an Oscillating Water Column (OWC) type wave energy converter. It was conceived about a decade ago by modifying the classical OWC configuration. Specifically, the device is composed by a closed air chamber and a water column connected to the open wave field. But, the connection to the open wave field involves a small vertical U‐shaped duct. For this reason, the device is also known as U‐OWC. The first experiments and theoretical analyses on the device were conducted by considering a U‐OWC embodied into a submerged breakwater (Boccotti, 2003). These first investigations revealed the main characteristic of the REWEC: it is able to reach resonance with incident waves without the need of phase control devices. In this regard, the crucial element of the device is the vertical duct. Indeed, it allows tuning the REWEC by properly designing the length and the width of the duct. In addition, the pressure in the air pocket can be controlled for adapting the performance of the plant to the characteristics of the actual sea state. Recently, the working principle of the REWEC was investigated in the context of vertical breakwaters (Boccotti, 2007a, 2007b, 2012; Boccotti et al., 2007). Specifically, the device was incorporated into classical vertical breakwaters used for creating a safe basin (such a device was named REWEC3). In this context, the “plant” allows accomplishing two objectives: converting wave energy to electrical energy; improving the safety of the basin against high sea waves. In this regard, it is worth‐mentioning that the device, by absorbing wave energy, fosters the reduction of reflected waves in front of the structure in comparison with traditional caisson breakwaters. From the perspective of theoretical modelling, the REWEC3 is quite different from the classical OWCs as its dynamic behaviour is well described by including nonlinear terms into the equation of water column oscillations. These nonlinearities were determined by experimental activities and relate to the head losses occurring in the vertical duct. The key consequence of this requirement is the need of working in time domain in contrast to linear analyses conducted for designing OWCs (Malara et al., 2013). A holistic view on the design of the plant was proposed by Boccotti (2012). He disseminated problems regarding the choice of the optimal U‐duct width and length, and the various strategies for incorporating with efficacy a Wells turbine. In terms of practical applications, the REWEC3 technology will be applied to the Civitavecchia port, in Rome (Italy) (Arena et al., 2013). In this context, the device was adopted only for improving the performance of the breakwater, with no energy conversion purposes. However, the potential of the infrastructure can potentially be exploited for energy supply.
Figure 1.1: comparison between an OWC (left panel) and a U‐OWC (right panel).
direction of wavepropagation
direction of wavepropagation

Infrastructure Access Report: REWELPO
Rev. 02, 26‐Jul‐2014 Page 8 of 23
1.2 DEVELOPMENTSOFAR
1.2.1 StageGateProgressPreviously completed: Planned for this project:
STAGE GATE CRITERIA Status
Stage 1 – Concept Validation
Linear monochromatic waves to validate or calibrate numerical models of the system (25 – 100 waves)
Finite monochromatic waves to include higher order effects (25 –100 waves)
Hull(s) sea worthiness in real seas (scaled duration at 3 hours)
Restricted degrees of freedom (DoF) if required by the early mathematical models
Provide the empirical hydrodynamic co‐efficient associated with the device (for mathematical modelling tuning)
Investigate physical process governing device response. May not be well defined theoretically or numerically solvable
Real seaway productivity (scaled duration at 20‐30 minutes)
Initially 2‐D (flume) test programme
Short crested seas need only be run at this early stage if the devices anticipated performance would be significantly affected by them
Evidence of the device seaworthiness
Initial indication of the full system load regimes
Stage 2 – Design Validation
Accurately simulated PTO characteristics
Performance in real seaways (long and short crested)
Survival loading and extreme motion behaviour.
Active damping control (may be deferred to Stage 3)
Device design changes and modifications
Mooring arrangements and effects on motion
Data for proposed PTO design and bench testing (Stage 3)
Engineering Design (Prototype), feasibility and costing
Site Review for Stage 3 and Stage 4 deployments
Over topping rates
Stage 3 – Sub‐Systems Validation
To investigate physical properties not well scaled & validate performance figures
To employ a realistic/actual PTO and generating system & develop control strategies
To qualify environmental factors (i.e. the device on the environment and vice versa) e.g. marine growth, corrosion, windage and current drag
To validate electrical supply quality and power electronic requirements.
To quantify survival conditions, mooring behaviour and hull seaworthiness
Manufacturing, deployment, recovery and O&M (component reliability)
Project planning and management, including licensing, certification, insurance etc.
Stage 4 – Solo Device Validation
Hull seaworthiness and survival strategies
Mooring and cable connection issues, including failure modes

Infrastructure Access Report: REWELPO
Rev. 02, 26‐Jul‐2014 Page 9 of 23
STAGE GATE CRITERIA Status
PTO performance and reliability
Component and assembly longevity
Electricity supply quality (absorbed/pneumatic power‐converted/electrical power)
Application in local wave climate conditions
Project management, manufacturing, deployment, recovery, etc
Service, maintenance and operational experience [O&M]
Accepted EIA
Stage 5 – Multi‐Device Demonstration
Economic Feasibility/Profitability
Multiple units performance
Device array interactions
Power supply interaction & quality
Environmental impact issues
Full technical and economic due diligence
Compliance of all operations with existing legal requirements
1.2.2 PlanForThisAccessCurrently, one of the aspects requiring a further development relates to PTO optimization. Indeed, as mentioned in the introductory paragraph, only the hydrodynamics and the design of the geometrical configuration of the device were investigated and reliability of the associated methods were assessed against experimental data. For this reason, REWELPO is aimed at beginning a systematic analysis of the PTO system coupled to a REWEC3 device. In this context, the Tecnalia facility was selected as it provides an effective instrumentation for coupling the available numerical codes of the User‐Group to the test‐bench required for pursuing pertinent experimental measurements. Considering the criteria planned for this project (see paragraph 1.2.1), this access was conceived for developing the following two points:
1. Accurately simulate PTO characteristics; 2. Employ real PTO in different sea state conditions.
This access allows obtaining a first perspective on the problem of PTO ‐ REWEC3 coupling. However, it is also a first stage to the development of optimal control strategies. Indeed, REWELPO was conceived for incrementing the knowledge of the User‐Group in the field of control theory and turbine dynamics. So that, future contributions on REWEC3 devices can be given from a broader perspective.
2 OUTLINEOFWORKCARRIEDOUT
2.1 SETUP
2.1.1 GENERALDESCRIPTIONOFELECTRICALPTOLABIn conjunction with the components of a wave energy converter mentioned previously, elements devoted to the conversion of turbine rotational energy to electrical power and to the injection of the produced energy to the grid are necessary. In this regard, the electrical conversion stage involves the following elements:
Electrical generator: there are different typologies such as linear or rotating, asynchronous or synchronous, with different behaviour. The choice of the typology is very important because it influences the choice of the power converter and of the control;
Power converter: it is the connection between the generator and the electrical grid;
Associated elements: other components of the electrical conversion system such as Dc‐link Capacitor, DC‐link, chopper resistor, Control boards, etc.

Infrastructure Access Report: REWELPO
Rev. 02, 26‐Jul‐2014 Page 10 of 23
Therefore, a distinction can be adopted, by differentiating the “device related part” (REWEC3 + turbine) and the “electrical related part” (PTO, etc.). Along these lines, the electrical infrastructure in Tecnalia is divided in two main parts (Figure 2.1):
Emulated part: it is the turbine emulator that reproduces the mechanical output of an ocean energy device that capture ocean energy and transform it into rotating motion. It is composed by the motor, the frequency converter to control the motor and the motor control software. The electrical motor is used to re‐create the dynamic response of an ocean energy device, from given input conditions.
Real part: it is the physical part of the PTO side. It includes the generator, the frequency converter to control the generator and a PLC with the generator control software. It is the same equipment that would be in on the full scale ocean energy device, but it is scaled.
The connection between the two parts is the mechanical shaft between the motor and the generator. The system includes:
electrical generator;
power electronics;
sensors;
control;
cables to connect to the grid. In order to implement correctly the desired system, key physical limitations of the facility must be accounted for. Specifically, the main constraints of this facility are:
maximum power: 28KW;
maximum rotational speed: 1800 rpm;
maximum mechanical torque: 100Nm;
inertia: the current installed inertia is given by a flywheel of 1kgm2, but there is the possibility of both to decrease and increase the inertia (up to 8 kgm2), by applying a compensation torque to the test bench in order to have the same dynamics as if it had a lower/higher inertia.
Figure 2.1: configuration of the testing infrastructure in Tecnalia.
Figure 2.2: tech‐bench with generator, gear box and motor.

Infrastructure Access Report: REWELPO
Rev. 02, 26‐Jul‐2014 Page 11 of 23
It is seen that several constraints are present. Therefore, a procedure for the determination of an adequate system must be considered. For the present work, it has been found convenient to adopt a Froude similarity for running the tests, with a scale factor determined according to the maximum mechanical torque. Therefore, a certain system is first simulated for determining the maximum torque. Then, the scale factor is calculated in order to “fit” the test bench. Specifically, the scale factor λ is calculated by the equation:
benchtest
simulated
T
T
max
max , (1)
Tmax simulated being the maximum torque obtained by simulation and Tmax test bench being the physical upper limit of the mechanical torque. In order to maintain a constant scale factor over all the tests, this parameter has been determined by considering the maximum simulated torque over the realization of all the case studies. Obviously, such a choice affects also the maximum available speed. However, this aspect has not posed any issue, as the plant has been conveniently designed for working in the desired speed range, (see the next paragraph for more details). The whole system runs in a dSPACE using a Matlab/Simulink model and simulates the performance of the device and turbine. The model must emulate the dynamics of the REWEC and of the turbine. Its input is the turbine speed, which is read from the test‐bench. Its output is the mechanical torque that is applied to the shaft. The dSPACE real‐time board is used to connect the simulation model to the physical world.
2.1.2 REWEC3CONFIGURATIONThe proposed tests are pursued with the objectives of defining an optimal operational regime under certain wave conditions, which can be further investigated in natural (uncontrolled) conditions at the NOEL laboratory of the Mediterranea University of Reggio Calabria. Therefore, the choice of the emulated plant as well as the selection of the wave conditions consider both test‐bench requirements and NOEL site conditions. As full scale reference model, a typical plant to be used in the Mediterranea Sea is adopted. The model is similar to the one described by Boccotti (2012). However, such a model has been slightly modified in order guarantee resonance with incident waves and higher efficiencies for the imposed rotational speeds. The plant is supposed equipped with a monoplane Wells turbine. In this regard, a crucial limit involved in the choice of the REWEC3 configuration relates to the need of “fitting” the rotational speed limits of the facility. To this end, the diameter of the turbine has been chosen by invoking the dimensionless flow rate coefficient:
R
uU a
* (2)
where ua denotes the air velocity through the turbine [m/s], ω the rotational speed of the turbine [rpm], R the radius of the turbine [m]. So that, the diameter has been determined in order to keep the parameter U* into the optimal range (0.05 ‐0.3), which is associated with the highest efficiency. Figure 2.3 shows a scheme of the REWEC3 considered during the tests. The width of the cell is 1.2m. Further, the inner diameter of the turbine is 2/3 of the outer diameter (this is a typical ratio for monoplane turbines).
Figure 2.3: size of the REWEC3 plant.
0.5
2
1.9
+1.90
units in meters
0.55
0.4
0.65
1

Infrastructure Access Report: REWELPO
Rev. 02, 26‐Jul‐2014 Page 12 of 23
2.2 TESTS
2.2.1 TestPlan
2.2.1.1 Pre‐processingThe system is tested under the action of two categories of sea states: wind‐generated waves; swells. As previously mentioned, the sea state conditions were chosen with reference to the actual sea that usually occurs at the Noel site. Table 2.1 summarizes the characteristics of the sea states simulated during the tests. In this regard, note that wind‐generated waves were described by a JONSWAP spectrum, while swells by a six‐parameter spectrum (Ochi, 2005).
Input Hs [m] Tp [s] ω [rpm] Type of sea state
1 0,60 3,30 1700 wind waves
2 0,60 3,30 1600 wind waves
3 0,60 3,30 1500 wind waves
4 0,60 3,30 1400 wind waves
5 0,60 3,30 1300 wind waves
6 0,60 3,30 1200 wind waves
7 0,40 2,70 1700 wind waves
8 0,40 2,70 1500 wind waves
9 0,40 2,70 1200 wind waves
10 0,80 3,80 1700 wind waves
11 0,80 3,80 1500 wind waves
12 0,8 3,80 1200 wind waves
13 0,15 3,30 1700 swells
14 0,15 3,30 1500 swells
15 0,15 3,30 1200 swells
16 0,20 3,60 1700 swells
17 0,20 3,60 1500 swells
18 0,20 3,60 1200 swells
19 0,20 4,00 1700 swells
20 0,20 4,00 1500 swells
21 0,20 4,00 1200 swells
22 0,20 4,50 1700 swells
23 0,20 4,50 1500 swells
24 0,20 4,50 1200 swells
25 0,25 4,00 1700 swells
26 0,25 4,00 1500 swells
27 0,25 4,00 1200 swells
Table 2.1: parameters associated with each case study: significant wave height; peak spectral period; turbine reference rotational speed; sea state spectrum.

Infrastructure Access Report: REWELPO
Rev. 02, 26‐Jul‐2014 Page 13 of 23
2.2.2 TestprocedureThe dSpace and Simulink/Matlab are implemented for each case study. Figure 2.4 shows the Simulink diagram used during the tests. It consists of two sides. A “test bench” part which connects the emulated part to the real part of the system. A “simulation” part, which is used for comparison purposes. Obviously, the output of the experiments are the ones obtained from the “test bench” side. However, a comparison with a theoretical calculation is pursued in parallel to the experiment for checking the reliability of the calculations and the correct operational regime of the test bench. Tests were carried out by imposing a constant reference speed to the turbine. To this end a Proportional Control Law has been implemented to provide the desired generator torque. Figure 2.5 shows the Proportional Control Law. This aspect affects also the treatment of the turbine inertia. In this regard, the problem is that the inertia of the simulated system does not coincide with the inertia in the test bench. Specifically, the inertia of the Wells turbine and of the real test bench are, respectively,
2/2.0 mkgJ d ,
and
2/2.1 mkgJ benchtest .
Several solutions could be used to overcome this problem, both mechanical and analytical. However, in this case an analytical procedure is used in order to emulate the scaled desired inertia (Jd scaled). The desired mechanical behaviour of the test bench is represented by the following equation:
Fdt
dJ
J
JTT benchtest
scaledd
benchtestem
)( , (3)
Tm being the mechanical torque applied by the motor (calculated through the mathematical models), Te the resistive torque applied by the generator (calculated as output from the Proportional Law), ω the rotational speed of the turbine and F the friction of the test bench. In this case the friction factor has been considered constant during the whole test simulation. Starting from equation (3), solving with respect to dω/dt, the instantaneous speed for the turbine that emulate the desired inertia for the test bench is computed.
Figure 2.4: Simulink diagram used for emulating the REWEC3 behaviour.

Infrastructure Access Report: REWELPO
Rev. 02, 26‐Jul‐2014 Page 14 of 23
Fig 2.5: Proportional Control Law
Figure 2.6 shows the Simulink representation of the REWEC3 dynamics. This part of the code is connected to the main body by receiving as input the rotational speed of the turbine and providing as output the mechanical torque.

Infrastructure Access Report: REWELPO
Rev. 02, 26‐Jul‐2014 Page 15 of 23
Figure 2.6: REWEC3 scheme used for computing hydrodynamics of the plant and the turbine mechanical torque.

Infrastructure Access Report: REWELPO
Rev. 02, 26‐Jul‐2014 Page 16 of 23
2.3 RESULTSThe main quantities under investigation are:
Turbine rotational speed;
Mechanical torque;
Power output.
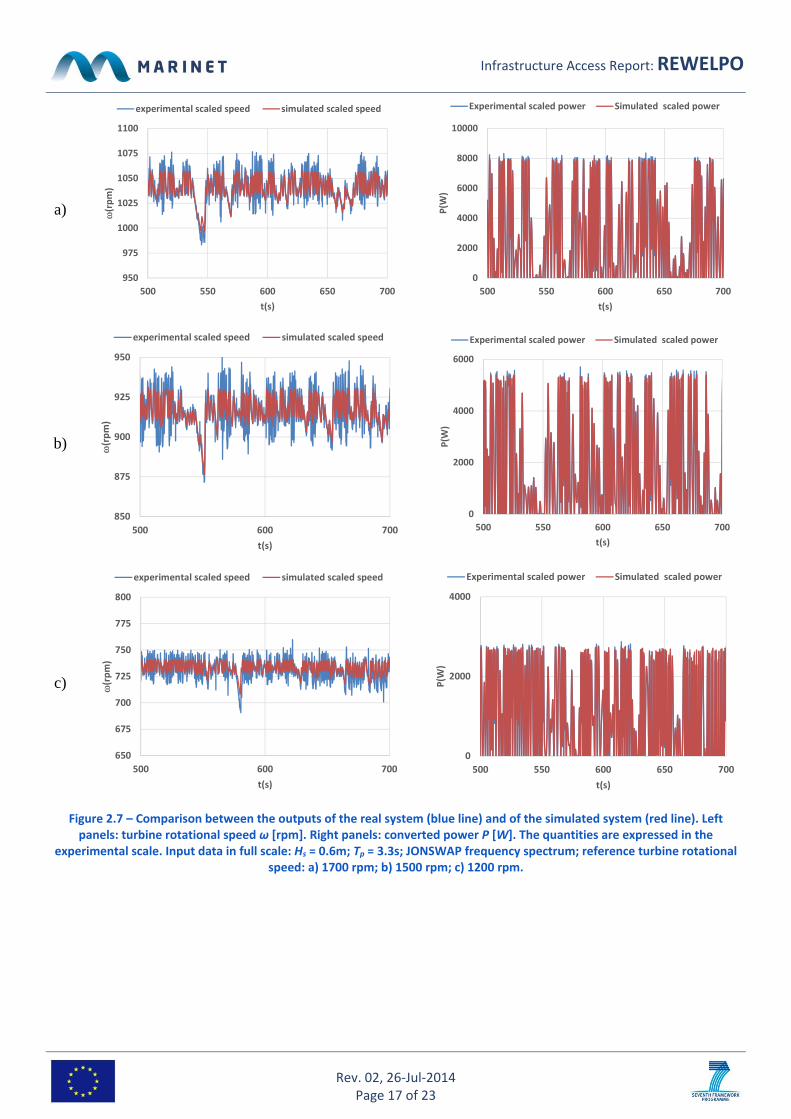
Figures 2.7 – 2.8 show the output of both the real and the simulated systems for specific case studies. The outputs are obtained by considering a fixed reference rotational speed. The first group (Figure 2.7) relates to a sea state compatible with a JONSWAP frequency spectrum; the second group (Figure 2.8) relates to a sea state compatible with swells. Obviously, the figures show short windows extracted from a long record of about 10 minutes. In these cases, the peak spectral period of the incident waves are close to the eigenperiod of the system. Thus, the plant works quite close to resonance. Table 2.2 shows the results of the experiments for all the case studies. The table compares the results of the experimental measurements against the numerical simulation. Such results shows that there is good agreement between the experiment and numerical simulation. These outputs are post‐processed in order to determine a characteristic curve of the turbine in a given sea state.
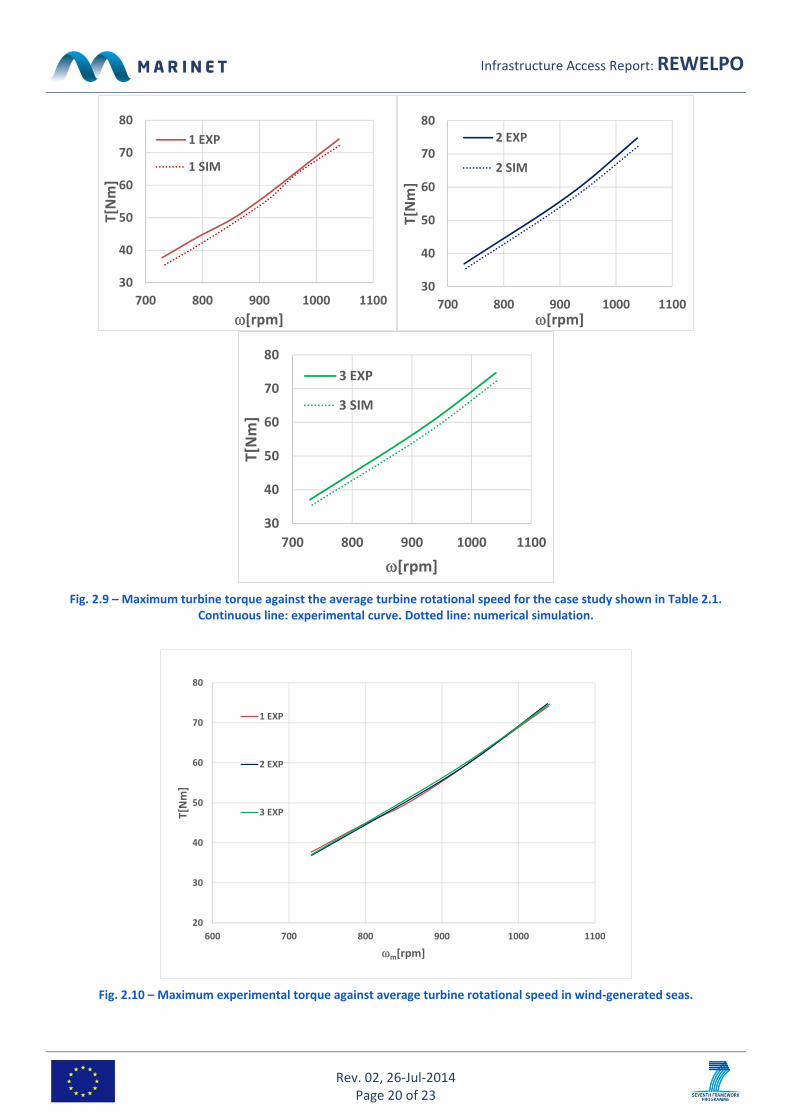
2.4 ANALYSIS&CONCLUSIONSThe results of the experiments are post‐processed for identifying the characteristic curves of the turbine. Computations are pursued starting from the numerical results discussed and summarized in table 2.2. Considering a certain sea state, the curves represent the average mechanical torque versus the reference rotational speed. Such a representation allows identifying the optimal reference speed associated with a sea state. Indeed, it is worth‐mentioning that the power is strictly related to the torque. So that, by representing the torque as a function of the rotational speed, the system can be optimized also in terms of power output. The characteristic curves are shown in figures 2.9 – 2.12. Specifically, figure 2.9 and 2.11 show the curve obtained from inputs pertaining to wind‐generated waves and swells. The curves show a comparison with the associated curve represented by using the simulated data. Figure 2.10 and 2.12 show the data pertaining to all the inputs. In this regard, it is seen that the experimental analysis allowed to identify an optimal rotational speed, where the calculated curve attains its maximum. However, it is also seen that in several cases the curves increase over the considered speed interval. In conclusion, it is seen that for swell sea states an optimal reference rotational speed is identified along the range of investigated values. On the other hand, it is observed that the peak of the curve in not attained in case of wind generated sea states. This aspect is probably related to the limited range of rotational speed. Therefore, this aspect requires further investigations in order to clarify what are the conditions for finding the optimal values. In addition, the determination of the connection between the spectral shape of the incident wave field and the optimal speed conditions should be the objectives of further investigations.
Infrastructure Access Report: REWELPO
Rev. 02, 26‐Jul‐2014 Page 17 of 23
a)
b)
c)
Figure 2.7 – Comparison between the outputs of the real system (blue line) and of the simulated system (red line). Left panels: turbine rotational speed ω [rpm]. Right panels: converted power P [W]. The quantities are expressed in the
experimental scale. Input data in full scale: Hs = 0.6m; Tp = 3.3s; JONSWAP frequency spectrum; reference turbine rotational speed: a) 1700 rpm; b) 1500 rpm; c) 1200 rpm.
950
975
1000
1025
1050
1075
1100
500 550 600 650 700
(rpm)
t(s)
experimental scaled speed simulated scaled speed
0
2000
4000
6000
8000
10000
500 550 600 650 700
P(W
)
t(s)
Experimental scaled power Simulated scaled power
850
875
900
925
950
500 600 700
(rpm)
t(s)
experimental scaled speed simulated scaled speed
0
2000
4000
6000
500 550 600 650 700
P(W
)
t(s)
Experimental scaled power Simulated scaled power
650
675
700
725
750
775
800
500 600 700
(rpm)
t(s)
experimental scaled speed simulated scaled speed
0
2000
4000
500 550 600 650 700
P(W
)
t(s)
Experimental scaled power Simulated scaled power

Infrastructure Access Report: REWELPO
Rev. 02, 26‐Jul‐2014 Page 18 of 23
a)
b)
c)
Fig. 2.8 – Comparison between the outputs of the real system (blue line) and of the simulated system (red line). Left panels: turbine rotational speed ω [rpm]. Right panels: converted power P [W]. The quantities are expressed in the experimental
scale. Input data in full scale: Hs = 0.15m; Tp = 3.3s; swell spectrum; reference turbine rotational speed: a) 1700 rpm; b) 1500 rpm; c) 1200 rpm.
400
500
600
700
800
900
1000
1100
500 550 600 650 700
(rpm)
t(s)
experimental scaled speed simulated scaled speed
0
500
1000
1500
2000
2500
3000
500 550 600 650 700
P(W
)
t(s)
Experimental scaled power Simulated scaled power
400
500
600
700
800
900
1000
1100
1200
500 550 600 650 700
(rpm)
t(s)
experimental scaled speed simulated scaled speed
0
500
1000
1500
2000
2500
3000
500 550 600 650 700
P(W
)
t(s)
Experimental scaled power Simulated scaled power
400
450
500
550
600
650
700
750
800
500 550 600 650 700
(rpm)
t(s)
experimental scaled speed simulated scaled speed
0
500
1000
1500
2000
2500
3000
500 550 600 650 700
P(W
)
t(s)
Experimental scaled power Simulated scaled power

Infrastructure Access Report: REWELPO
Rev. 02, 26‐Jul‐2014 Page 19 of 23
Input Hs [m] Tp [s] ωm exp [rpm]
Tmax exp [Nm]
ωm sim [rpm]
Tmax sim[Nm]
Wind Waves
1 1 0,6 3,30 1039,80 74,21 1040,10 72,17 2 0,6 3,30 967,59 64,45 965,08 63,46 3 0,6 3,30 915,91 57,39 916,97 55,84 4 0,6 3,30 853,71 49,79 855,27 48,47 5 0,6 3,30 791,44 44,04 793,95 41,67 6 0,6 3,30 729,10 37,70 732,53 35,40
2 7 0,4 2,70 1037,90 74,75 1038,60 72,19 8 0,4 2,70 915,33 57,44 916,31 55,82 9 0,4 2,70 729,70 36,90 732,01 35,39
3 10 0,8 3,81 1040,60 74,68 1041,40 72,18 11 0,8 3,81 916,03 58,12 917,48 55,84 12 0,8 3,81 729,24 37,05 731,76 35,37
Swells
4 13 0,15 3,3 885,76 42,40 905,34 41,72 14 0,15 3,3 831,22 42,74 814,33 42,89 15 0,15 3,3 691,25 32,41 690,03 32,12
5 16 0,2 3,6 993,52 46,30 995,90 46,23 17 0,2 3,6 882,66 49,12 884,71 49,09 18 0,2 3,6 716,73 35,92 714,78 35,34
6 19 0,2 4 976,90 44,05 976,26 44,07 20 0,2 4 874,56 51,41 869,69 52,00 21 0,2 4 709,13 35,59 705,39 35,11
7 28 0,2 4,5 936,48 44,37 936,8 43,56 29 0,2 4,5 867,30 40,84 835,46 41,73 30 0,2 4,5 699,26 31,11 697,9 31,05
8 31 0,25 4 1007,7 67,165 1006,5 66,73 32 0,25 4 895,13 55,72 897,29 55,26 33 0,25 4 719,59 36,12 720,86 35,37
Tab. 2.2 – Results of the experiments and from numerical simulations. It has been defined: Hs significant wave height of the sea state, Tp peak period of the sea state, ωref reference turbine rotational speed (full‐scale), ωexp mean value of the
experimental rotational speed, Tmax exp maximum experimental torque, ωsim mean value of the simulated rotational speed, Tmax sim maximum simulated torque. All quantities, except for ωref, are in the experimental scale.
Infrastructure Access Report: REWELPO
Rev. 02, 26‐Jul‐2014 Page 20 of 23
Fig. 2.9 – Maximum turbine torque against the average turbine rotational speed for the case study shown in Table 2.1.
Continuous line: experimental curve. Dotted line: numerical simulation.
Fig. 2.10 – Maximum experimental torque against average turbine rotational speed in wind‐generated seas.
30
40
50
60
70
80
700 800 900 1000 1100
T[Nm]
[rpm]
1 EXP
1 SIM
30
40
50
60
70
80
700 800 900 1000 1100
T[Nm]
[rpm]
2 EXP
2 SIM
30
40
50
60
70
80
700 800 900 1000 1100
T[Nm]
[rpm]
3 EXP
3 SIM
20
30
40
50
60
70
80
600 700 800 900 1000 1100
T[Nm]
m[rpm]
1 EXP
2 EXP
3 EXP

Infrastructure Access Report: REWELPO
Rev. 02, 26‐Jul‐2014 Page 21 of 23
Fig. 2.11 – Maximum turbine torque against the average turbine rotational speed for the case study shown in Table 2.1.
Continuous line: experimental curve. Dotted line: numerical simulation.
30
35
40
45
50
55
700 800 900 1000 1100
T[Nm]
[rpm]
4 EXP
4 SIM
30
35
40
45
50
55
700 800 900 1000 1100
T[Nm]
[rpm]
5 EXP
5 SIM
30
35
40
45
50
55
700 800 900 1000 1100
T[Nm]
[rpm]
6 EXP
6 SIM
30
35
40
45
50
700 800 900 1000 1100
T[Nm]
[rpm]
7 EXP
7 SIM
30
40
50
60
70
700 800 900 1000 1100
T[Nm]
[rpm]
8 EXP
8 SIM

Infrastructure Access Report: REWELPO
Rev. 02, 26‐Jul‐2014 Page 22 of 23
Fig. 2.12 – Cumulated experimental turbine power curves for swells sea states.
3 MAINLEARNINGOUTCOMES
3.1 PROGRESSMADEThe proposed MARINET project has been developed with the objective of starting an overall analysis of the REWEC3 – PTO system. In this context, the key conclusion of the project relates to the determination of the optimal reference rotational speed for a given sea state. However, it is worth‐mentioning that the project has revealed the need of conducting deeper analyses in order to investigate the optimization problem in the context of wind‐generated waves. Indeed, it has been found that the average power output is an increasing function of the rotational speed over the considered range. Thus, further case studies must be considered. In this regard, the problem is expected to be relevant from a scientific perspective, as in the open literature the connection between the spectral shape of the incident wave field and the optimal working conditions of a REWEC3 are largely unexplored.
3.1.1 ProgressMade:ForThisUser‐GrouporTechnologyThis MARINET project was developed on the REWEC3 – PTO interaction. However, the User‐Group worked primarily on problems pertaining to the plant dynamics. Thus, this project has been a key opportunity for introducing the group to the PTO related problems. Thus, the first progress is connected to the knowledge acquired in the context of the PTO implementation and the related control theory. From a technology perspective, it is seen that the project has faced for the first time the problem of coupling the REWEC3 to a PTO system.
3.1.1.1 NextStepsforResearchorStagedDevelopmentPlan–Exit/Change&Retest/Proceed?The next steps of the research are:
Identification of the optimal operational speeds in wind‐generated sea‐states;
Development of effective control laws for increasing the average converted power.
3.1.2 ProgressMade:ForMarineRenewableEnergyIndustryThe REWEC3 – PTO interaction is, with this project, at its early stage of development. In this context, the key progresses from an industry perspective are:
30
35
40
45
50
55
60
65
70
75
80
500 600 700 800 900 1000 1100
T[Nm]
[rpm]
4 EXP
5 EXP
6 EXP
7 EXP
8 EXP

Infrastructure Access Report: REWELPO
Rev. 02, 26‐Jul‐2014 Page 23 of 23
Experimental analysis in a test bench can be conducted with the stipulation that resonance is preserved during the scaling.
At full scale a control law is required for maximizing the absorbed power. However, this must accounts for the full spectral content of the incoming waves, and not only to a single parameter.
3.2 KEYLESSONSLEARNED Froude similarity cannot be adopted for scaling the REWEC3 due to its nonlinear behaviour, but can be
employed for scaling properly input and output of the PTO.
The coupled REWEC3 – PTO behaviour in wind‐generated seas is quite different with respect to swell sea states.
Optimal speeds can be identified for a given sea state, but the spectral shape of the incoming wave plays a remarkable role. Thus, a single parameter (such as significant wave height) is not sufficient for selecting the optimal speed.
4 REFERENCESArena, F., et al. (2013). On design and building of a U‐OWC wave energy converter in the Mediterranean Sea: a case
study. Proc. of the 32nd International Conference on Ocean, Offshore and Arctic Engineering, OMAE2013, Nantes, France.
Boccotti, P. (2003). "On a new wave energy absorber." Ocean Engineering 30(9): 1191‐1200. Boccotti, P. (2007a). "Comparison between a U‐OWC and a conventional OWC." Ocean Engineering 34(5‐6): 799‐805. Boccotti, P. (2007b). "Caisson breakwaters embodying an OWC with a small opening—Part I: Theory." Ocean
Engineering 34(5‐6): 806‐819. Boccotti, P. (2012). "Design of breakwater for conversion of wave energy into electrical energy." Ocean Engineering
51(0): 106‐118. Boccotti, P., et al. (2007). "Caisson breakwaters embodying an OWC with a small opening‐Part II: A small‐scale field
experiment." Ocean Engineering 34(5‐6): 820‐841. Malara, G. and F. Arena (2013). "Analytical modelling of an U‐Oscillating Water Column and performance in random
waves." Renewable Energy 60: 116‐126. Ochi, M. K. (2005). Ocean Waves: The Stochastic Approach. Cambridge, United Kingdom, Cambridge University
Press.