Marine Aquarium Fish Managed Fishery · 6 ESD Report Series No. 8 – Marine Aquarium Fish Managed...
104
FRDC – Subprogram Ecologically Sustainable Development Marine Aquarium Fish Managed Fishery ESD REPORT SERIES No. 8
Transcript of Marine Aquarium Fish Managed Fishery · 6 ESD Report Series No. 8 – Marine Aquarium Fish Managed...

FRDC – Subprogram
EcologicallySustainable Development
Marine Aquarium Fish Managed Fishery
ESD REPORT SERIES No. 8
2
ESD Report Series No. 8 – Marine Aquarium Fish Managed Fishery
Authors:
Smith, K.A., Newman, S.J. and Cliff, G.M.
Department of FisheriesWestern Australian Fisheries and Marine Research LaboratoriesPO Box 20North Beach WA 6920Telephone (08) 9203 0111Facsimile (08) 9203 0199 Website: http://www.fish.wa.gov.auABN: 55 689 794 771
Published by the Department of Fisheries, Western AustraliaESD Report Series No. 8, October 2010ISSN: 1448 - 3599 ISBN: 1 921258 97 7

ESD Report Series No. 8 – Marine Aquarium Fish Managed Fishery
3
Table of contents
Preface ............................................................................................................. 8
1.0 Introduction .............................................................................................. 9
2.0 Overview ................................................................................................. 11
3.0 Background on the Maf fishery ............................................................... 12
3.1. DESCRIPTION OF THE FISHERY ............................................................................... 12
3.1.1 Location of The Fishery ............................................................................. 12
3.1.1.1 License Area ......................................................................................... 12
3.1.2 Number of Licensees ................................................................................ 13
3.1.3 Description of Gear ................................................................................... 13
3.1.3.1 General ................................................................................................. 13
3.1.3.2 Operating Description ............................................................................ 13
3.1.4 Taxa Caught ............................................................................................. 15
3.1.4.1 Target ................................................................................................... 15
3.1.5 Bait Usage ............................................................................................... 16
3.2 HISTORY OF THE FISHERY ...................................................................................... 17
3.2.1 Management History ................................................................................. 17
3.2.2 Catch and Effort in the MAF ....................................................................... 17
3.3 RECREATIONAL FISHERY ......................................................................................... 18
3.3.1 Traditional Involvement in the Fishery .......................................................... 18
3.4 MAJOR ENVIRONMENTS .......................................................................................... 19
3.4.1 Physical Environment ................................................................................. 19
3.4.2 Economic Environment .............................................................................. 19
3.4.3 Social Environment ................................................................................... 19
3.5 CURRENT AND PROPOSED MANAGEMENT ARRANGEMENTS ..................................... 20
3.5.1 Summary of Current Management Strategies and Justification ..................... 20
3.5.2 Legislation and Policies Affecting the Fishery .............................................. 20
3.5.3 Proposed Future Management Arrangements .............................................. 21
3.6 RESEARCH STRATEGY ............................................................................................ 21
3.6.1 Recent/Current Research .......................................................................... 21
3.6.2 Proposed Future Research ........................................................................ 21
3.7 BIOLOGY OF SPECIES ............................................................................................ 22
3.7.1 Aquarium Fish Species .............................................................................. 22
3.7.2 Corals ...................................................................................................... 23

4
ESD Report Series No. 8 – Marine Aquarium Fish Managed Fishery
3.7.3 Invertebrates ............................................................................................ 23
3.7.4 Live Rock/Sand ........................................................................................ 23
3.7.5 Syngnathids .............................................................................................. 23
4.0 Outline of Reporting Process ................................................................... 25
4.1 SCOPE .................................................................................................................. 25
4.2 OVERVIEw ............................................................................................................. 25
4.3 ISSUE IDENTIFICATION (COMPONENT TREES) ........................................................... 26
4.4 RISk ASSESSMENT/PRIORITISATION PROCESS ....................................................... 27
4.5 COMPONENT REPORTS .......................................................................................... 28
4.6 APPLICATION TO MEET EPBC REQUIREMENTS .......................................................... 28
4.7 OVERVIEw TABLE .................................................................................................... 29
5.0 Performance Reports .............................................................................. 31
5.1 RETAINED SPECIES ................................................................................................. 31
5.1.1 Primary Species ....................................................................................... 31
5.1.1.1 Syngnathids Rationale for Inclusion ......................................................... 31
5.1.1.2 Other Finfish ......................................................................................... 33
5.1.1.3 Seagrass/Algae .................................................................................... 37
5.1.1.4 Hard Coral ............................................................................................ 38
5.1.1.5 Soft Coral .............................................................................................. 40
5.1.1.6 Hermit Crabs .......................................................................................... 42
5.1.1.7 Other Invertebrates ................................................................................ 43
5.1.1.8 Living Rock ........................................................................................... 45
5.1.1.9 Living Sand ........................................................................................... 45
5.2 NON RETAINED SPECIES ........................................................................................ 46
5.3 GENERAL ENVIRONMENT COMPONENT TREE FOR THE GENERAL ENVIRONMENT ........ 46
5.3.1 Removal of/Damage to Organisms ............................................................. 46
5.3.1.1 Trophic Interactions ............................................................................... 46
5.3.1.2 Benthic Biota (non-target elements) ........................................................ 47
5.3.1.3 Anchoring .............................................................................................. 47
5.3.2 Addition/Movement of Biological Material ................................................... 48
5.3.2.1 Translocation by Vessel Hulls Rationale for Inclusion: ............................... 48
5.3.3 Other Environmental Impacts ..................................................................... 48
5.3.3.1 Exhaust Fumes Rationale for Inclusion: ................................................... 48
5.3.3.2 Oil Discharge Rationale for Inclusion: ...................................................... 48
5.4 GOVERNANCE COMPONENT TREE FOR THE GOVERNANCE OF THE MARINE AQUARIUM MANAGED FISHERY ............................................................................... 49
5.4.1 Department of Fisheries – Management ..................................................... 49
5.4.1.1 Management Effectiveness (Outcomes) ................................................... 49
5.4.1.2 Management Arrangements .................................................................... 52

ESD Report Series No. 8 – Marine Aquarium Fish Managed Fishery
5
5.4.1.3 Compliance ........................................................................................... 55
5.4.1.4 Allocation Among Users ......................................................................... 57
5.4.1.5 Consultation (Including Communication) .................................................. 58
5.4.2 Department of Fisheries- Reporting ............................................................ 60
5.4.2.1 Assessments and Reviews ..................................................................... 60
5.4.3 Department of Fisheries – Legal Framework ............................................... 62
5.4.3.1 OCS Arrangements ................................................................................ 62
6.0 Bibliography ............................................................................................ 63
7.0 appendices ............................................................................................. 64
APPENDIX 1 DETAILED FISHING BLOCk AREAS FOR THE MARINE AQUARIUM MANAGED FISHERY FOR THE ABROLHOS ISLANDS, COCkBURN SOUND, GEOGRAPHE BAY, kING GEORGE SOUND AND PRINCESS ROYAL HARBOUR, AND SHARk BAY. ........................................................................64
APPENDIX 2 ACRONYMS .................................................................................................69
APPENDIX 3 DETAILS OF CONSEQUENCE TABLES .............................................................70
APPENDIX 4 LETTER OF JUSTIFICATION FOR TAkING OVER 750 SYNGNATHID SPECIMENS & STATUS REPORT .....................................................................72
APPENDIX 5 DRAFT CODE OF PRACTICE MARINE AQUARIUM MANAGED FISHERY .................78
APPENDIX 6 INFORMATION REGARDING TRAwL ACTIVITY ON THE SYNGNATHID FAMILY IN THE SHARk BAY AREA ..................................................................84
APPENDIX 7 MATERIALS SUPPLIED TO ENVIRONMENT AUSTRALIA AGAINST THEIR SPECIFIC GUIDELINES ........................................................................86
APPENDIX 8 APPROVAL AND RECOMMENDATIONS FROM DEH ..........................................100

6
ESD Report Series No. 8 – Marine Aquarium Fish Managed Fishery
List of Figures
figure 1.1 Summary of process for completing ESD reports and their relationship with the Annual Report and State of Fisheries Reports. (Example shown is for the west Coast Bioregion and the western Rock Lobster fishery.) .......................................10
figure 3.1 Map of the Marine Aquarium Fishery ...........................................................................12
figure 3.2 Fishing blocks for statistical analysis of catch and effort. .............................................14
figure 4.1 Summary of the ESD reporting framework processes. ..................................................26
figure 4.2 Example of a component tree structure. .....................................................................26

ESD Report Series No. 8 – Marine Aquarium Fish Managed Fishery
7
List of Tables
Table 3.1 Main taxa targeted - total catches per block from 1976 to 2003. Listed taxa/blocks are those for which catches summed from 1976 to 2003 were >1000 individuals. .............................................................................................15
Table 3.2 Total fishing effort (days of fishing per block) and distribution of effort, 1999 to 2003. ...........................................................................................................17
Table 3.3 Average distribution of annual effort by block, 2001 to 2003.. ......................................18
Table 4.1 Main National ESD Reporting Framework Components. .................................................25
Table 4.2 Risk ranking definitions. .............................................................................................27
Table 4.3 The National ESD reporting framework headings used in this report. ............................28
Table 5.1 Annual MAF catch (no. of individuals) of Syngnathids, 1999-2003. ...............................32
Table 5.2 Total Sygnathid catches (no. of individuals) by block in 2002 and 2003.........................33
Table 5.3 Average annual catches (no. of individuals) of finfish taxa reported by the MAF, from 2000 to 2003 (excluding syngnathids). ................................................................34
Table 5.4 Average annual catch (no. of individuals) per taxa of Group A finfish*, from 2000 to 2003. ...................................................................................................34
Table 5.5 Total catch (no. of individuals) of Group A and Group B finfish by block, summed from 2000 to 2003. .....................................................................................35
Table 5.6 Average annual catch (no. of individuals) of Group B finfish* by the MAF, from 2000 to 2003. ..................................................................................................36
Table 5.7 Annual MAF harvest (kg) of algae by block in 2002 and 2003 .......................................37
Table 5.8 Annual MAF catches (kg) of hard coral, 2001 to 2003. .................................................38
Table 5.9 Annual MAF catches (kg) of hard coral by block, 2002 and 2003. .................................39
Table 5.10 Annual MAF catch (kg) of hard coral in block 2016. .....................................................40
Table 5.11 Annual MAF catch (kg) of soft coral by block, 2001 to 2003. .......................................41
Table 5.12 Annual MAF catch (number of individuals) of hermit crabs by block, 2002 and 2003. .....42
Table 5.13 Annual MAF catches (number of individuals) of ‘other invertebrates’, 2001 to 2003. .....44
Table 5.14 Annual MAF catches (number of individuals) of ‘other invertebrates’ by block, 2001 to 2003. ...........................................................................................................44
Table 5.15 Annual MAF collections (kg) of ‘live rock’ by block. .......................................................45

8
ESD Report Series No. 8 – Marine Aquarium Fish Managed Fishery
PrefaceThe following report formed the basis of an application by the Western Australian Department of Fisheries to the Australian Government Department of the Environment and Heritage (DEH) (now known as the Department of Environment, Water, Heritage and the Arts) to assess the Marine Aquarium Fish Managed Fishery (MAF) against the Australian Government Guidelines for the Ecologically Sustainable Management of Fisheries.
A successful application against these guidelines was needed to meet the requirements under Parts 13 and 13A of the Environment Protection and Biodiversity Conservation Act, 1999 (EPBC) to enable those species that were caught and classified as Marine Aquarium fish to remain on the section 303DB list of species exempt from export regulations (previously Schedule 4 of the Wildlife Protection (Regulation of Exports and Imports) Act, 1982) past December 2004.
The application was submitted to DEH in 2004. Information presented in the following report relates to the MAF at the time of submission of the application (i.e. to the end of 2003), not to the time of publication.
ESD Report Series No. 8 – Marine Aquarium Fish Managed Fishery
9
1.0 Introduction Ecologically Sustainable Development (ESD) is the concept that seeks to integrate short and long-term economic, social and environmental effects in all decision-making. The Western Australian Government is committed to the concepts of ESD and these principles are implicitly contained in the objectives of the Fisheries Resources Management Act 1994 (FRMA). More recently, the Minister for Fisheries released a “Policy for the Implementation of Ecologically Sustainable Development for Fisheries and Aquaculture within Western Australia” (Fletcher 2002) to articulate, in a practical manner, how the Department of Fisheries can demonstrate to both the government and the broader community that these requirements are being achieved.
A major element of this policy was the requirement for reporting on the progress of each commercial fishery against the major ESD objectives by the end of 2003. This document forms part of this process being the ESD report for the Marine Aquarium Fish Managed Fishery
The reporting framework used to generate these ESD reports is the National ESD Framework for Fisheries (see Fletcher et al., 2002 or www.fisheries-esd.com for details). This framework operates by identifying the relevant issues for a fishery within 3 main categories of Ecological wellbeing, Human wellbeing and Ability to achieve completing a risk assessment on each of the identified issues and then providing suitably detailed reports on their status.
Due to recent changes in the Australian Government’s environmental legislation administered by the Department of Environment and Heritage (DEH), all export fisheries are now required to have an assessment on their environmental sustainability. As a consequence, the initial series of assessments for fisheries has concentrated on the environmental and governance components of ESD of this fishery. The social and economic elements of ESD will be covered in the next phase of assessments.
The reporting of performance for each fishery is the responsibility of the Department in conjunction with the relevant Management Advisory group and/or associated stakeholders. Consequently, the completion of this report has involved a substantial level of consultation and input from many groups including a public comment period.
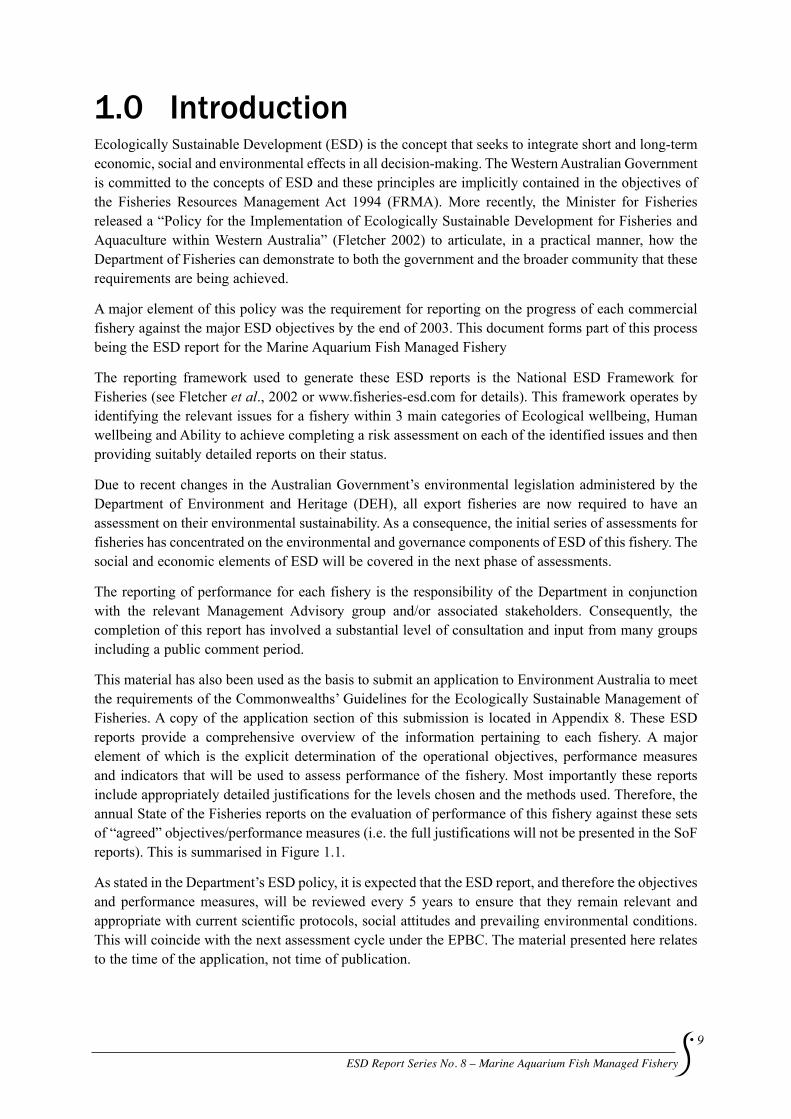
This material has also been used as the basis to submit an application to Environment Australia to meet the requirements of the Commonwealths’ Guidelines for the Ecologically Sustainable Management of Fisheries. A copy of the application section of this submission is located in Appendix 8. These ESD reports provide a comprehensive overview of the information pertaining to each fishery. A major element of which is the explicit determination of the operational objectives, performance measures and indicators that will be used to assess performance of the fishery. Most importantly these reports include appropriately detailed justifications for the levels chosen and the methods used. Therefore, the annual State of the Fisheries reports on the evaluation of performance of this fishery against these sets of “agreed” objectives/performance measures (i.e. the full justifications will not be presented in the SoF reports). This is summarised in Figure 1.1.
As stated in the Department’s ESD policy, it is expected that the ESD report, and therefore the objectives and performance measures, will be reviewed every 5 years to ensure that they remain relevant and appropriate with current scientific protocols, social attitudes and prevailing environmental conditions. This will coincide with the next assessment cycle under the EPBC. The material presented here relates to the time of the application, not time of publication.
10
ESD Report Series No. 8 – Marine Aquarium Fish Managed Fishery
figure 1.1 Summary of process for completing ESD reports and their relationship with the Annual Report and State of Fisheries Reports. (Example shown is for the west Coast Bioregion and the western Rock Lobster fishery.)

ESD Report Series No. 8 – Marine Aquarium Fish Managed Fishery
11
2.0 OverviewThe Marine Aquarium Fish Managed Fishery (MAF) targets more than 250 species of finfish under the management plan, and also takes coral, live rock, invertebrates, seagrass and algae. Reported catches from licensees for 2002/03 was 130,408 aquarium fish, 7,632 invertebrates, 4,637 kg hard coral and 6049 kg soft corals, living rock and algae (see section 5). The value of this fishery is uncertain. In 2003 the total number of licences was 13, with no more licences to be issued to the fishery.
The Fish Resources Management Act 1994 (FRMA) provides the legislative framework to implement the management arrangements for this fishery. The specific management plan for the Fishery, the Marine Aquarium Fish Management Plan 1995, is currently under review. It is intended that the fishery will be operating under a new management plan by 2005. Since the fishery is undergoing changes to its management plan, most of this ESD report is based on the current management plan.
The maintenance of the marine aquarium species stocks, as well as the successful continuation of the fishery, has been achieved through the combination of:
• thesuiteofmanagementarrangementsinplace;
• thesmallnumberoffishers,thephysiologicalconstraintsofdiving,alargeareaoffishablewaterandrelativelylownumberoffishtakenfromawidevarietyofspecies;and
• protectionforspeciesneedingspecialconservationormorevulnerabletoover-exploitation,asper‘protected fish’ listing under Schedule 2 of the FRMA, which includes humphead maori wrasse, coral of the order Scleractinia (in certain areas), leafy seadragon and potato cod.
It should be noted that due to the small size of this fishery and the very low risks to the stocks involved, this fishery does not attract a high priority in relation to research on the targeted species.
The MAF, being a relatively small-scale fishery has minimal impacts on the broader ecosystem. The fishery is able to operate over the whole of the WA coast, however there is only a limited amount of this area that is targeted by the fishermen and their impacts are considered negligible.
Consequently, the management regime for the MAF should meet the Guidelines for the Ecologically Sustainable Management of Fisheries. Detailed justification for this conclusion is documented within this ESD report.

12
ESD Report Series No. 8 – Marine Aquarium Fish Managed Fishery
3.0 Background on the MaF Fishery3.1. DESCRIPTION OF THE FISHERY
3.1.1 Location of The fishery
3.1.1.1 License area
figure 3.1 Map of the Marine Aquarium Fishery
The MAF licence area extends into Commonwealth waters, spanning the coastline from the Northern Territory border to the South Australian border (Figure 3.1). However, in practice, the fishery currently operates only in WA state waters. The effort is spread over a total gazetted length of coast of 20,781 km. During the last two years the Fishery has been active in waters from Esperance to Broome with popular areas being Perth to Busselton, Karratha to Port Headland, the Gascoyne Region and around Albany (Figure 3.2).

ESD Report Series No. 8 – Marine Aquarium Fish Managed Fishery
13
Licensees are not permitted to operate within the Ningaloo Marine Park or in any waters closed to fishing (e.g. Rowley Shoals, Reef Observation Areas, Sanctuary Zones). The Fishery is permitted to operate in general purpose zones of other marine parks, such as Jurien Bay and Montebello Islands Marine Park. However, licensees must obtain written approval from the Department of Environment and Conservation (DEC) prior to collecting within any marine park reserves. Recently, a Section 43 Order, which prohibits fishing, was placed on Cleaverville Reef to prohibit the take of coral and associated organisms (i.e. live rock).
3.1.2 Number of Licensees
There are 13 licenses in the fishery, all except one are fully transferable and in most years nearly all licences are used. Some licensees have endorsements to take specimens other than finfish. These include: • 5licenseespermittedtotakeacombinedmaximumquotaof7,500kgofcoral,• 3licenseespermittedtotake500kgeachofliverockandsand,• 3licenseespermittedtotakeinvertebrates,and• 2licenseespermittedtotakeseagrassandalgae.
The Marine Aquarium Fish Management Plan 1995, determines that the licensee or nominated operator must not work with more than two nominated divers at any one time and no more than two authorised vessels may be used in the fishing operation (that is, a ‘mother boat’ and an ‘auxiliary boat’). An authorised boat (whether a ‘mother’ or ‘auxiliary’ boat) must not be replaced by a vessel greater than eight (8) metres in length.
3.1.3 Description of Gear
3.1.3.1 General
Clause 12 of the Marine Aquarium Fish Management Plan 1995, determines that fish may be taken by hand held nets only. The MAF is primarily a dive-based fishery that uses hand held nets to capture the specimens. Fishing operations are heavily weather dependent due to the small vessels used and the potentially hazardous conditions (waves, swell etc) encountered. In addition to these constraints, there are human constraints (i.e. physiological effects of decompression) that limit the amount of effort exerted in the fishery, the depth of water and the offshore extent where collections can occur.
3.1.3.2 Operating Description
As the fishery is primarily dive based, commercial divers use self-contained underwater breathing apparatus (SCUBA) or surface air from a Hookah apparatus. Depending on the location, collection is usually done on day trips. Fish are mostly collected in buckets that remain attached to a drop line until fishing is completed. During hauling, buckets are held on the drop lines a few metres below the water surface for a period to allow for gradual decompression of the captured fish. Once fish are bought on to the boat, they are sorted and stored in small containers (usually 15 or 20 litre buckets).
For air transport, fish are placed into double plastic bags that are separated by newspaper, the bags are topped up with pure oxygen and placed in foam boxes. Road transport often uses large aerated tanks to transfer fish to the holding facility.
Fish are handled very carefully during all stages of the harvesting operation to minimise the mortality of the specimens. Those fish that are damaged have a reduced commercial value, therefore every effort is made to minimise potential injury to the fish by the handling procedure or by other captive fish. Licensees sort fish according to species and size to reduce both inter and intra-specific conflict.

14
ESD Report Series No. 8 – Marine Aquarium Fish Managed Fishery
3510
3610
2610
2710
2810
2910
3010
3110
3210
3310
3410
2010
2110
2210
2310
2410
2510
1810
1910
3511
3611
2611
2711
2811
2911
3011
3111
3211
3311
3411
2011
2111
2211
2311
2411
2511
1811
1911
3512
3612
2612
2712
2812
2912
3012
3112
3212
3312
3412
2012
2112
2212
2312
2412
2512
1812
1912
3513
3613
3013
3113
3213
3313
3413
2013
2113
2213
2313
1813
1913
3514
3614
2714
3014
3114
3214
3314
3414
2014
2114
2214
1814
1914
3515
3615
3015
3115
3215
3415
2015
2115
1815
1915
3516
3616
3416
2016
2116
1816
1916
3517
3617
2017
1817
1917
3618
3418
2018
1818
1918
3519
3619
3319
3419
2019
1819
1919
3520
3620
3320
3420
1820
1920
3521
3621
3321
3421
1821
1921
3522
3622
3422
1822
3523
3623
3423
3524
3624
3224
3324
3424
3525
3625
3225
3325
3425
3526
3626
3226
3326
3426
3527
3627
3227
3327
3427
3528
3628
3128
3228
3328
3428
3529
3629
3129
3229
3329
3429
3530
3630
3130
3230
3330
3430
1715 1716 1717 1718 17191720
1721 1722 1723
1617 1618 1619 1620 1621 1622 1623
1624
1518 1519 1520 1521 1522 1523 15251528
1529
1418 1419 1420 14211422
1423 1424 1426 1427 1428 1429
1320 1321 13221323
1324 1325 1326 1327 1328 1329
1220 1221 1222 12231224 1225 1226 1227 1228 1229
1120 1121 1122 11231124 1125 1126 1127 1128 1129
102210°S
12°S
14°S
16°S
18°S
20°S
22°S
24°S
26°S
28°S
30°S
32°S
34°S
36°S
110°E 115°E 120°E 125°E 130°E
1023 1024 10251026
1027 1028 1029
924 925 926 927 928 929
Western AustraliaFishing blocks for statistical analysisof catch and effort.
For more map details see map pagesfor each shaded area.
200 metre isobath
Wyndham
Derby
Roebourne
Onslow
Carnarvon
Geraldton Dongara
Jurien
Lancelin
Perth
Mandurah
Bunbury Esperance
Fishing blocks are defined by the latitude and last 2 digits of the longitude of the upper left cornerof the block ie 28° S latitude and 112° E longitude gives block 2812.
125°S 128°S
Augusta
Port Hedland
Broome
Albany
Abrolhos
figure 3.2 Fishing blocks for statistical analysis of catch and effort.

ESD Report Series No. 8 – Marine Aquarium Fish Managed Fishery
15
3.1.4 Taxa Caught
3.1.4.1 Target
Table 3.1 Main taxa targeted - total catches per block from 1976 to 2003. Listed taxa/blocks are those for which catches summed from 1976 to 2003 were >1000 individuals.
Common Name Family BlockTotal Catch
(No.individuals)Hardyheads Atherinidae 20180 788879Cardinalfishes Apogonidae & Dinolestidae 31150 59829Herring/sprats/sardine Clupeidae 20170 35690Goatfish Mullidae 96010 34042Black-axil Chromis Pomacentridae 35170 17914Gobys Gobiesocidae 24131 17235Yellowtail Trumpeter Terapontidae 35170 13837Milkfish Chanidae 31150 12286Ogilby’s Hardyhead Atherinidae 32150 11950Striped Catfish Plotosidae 96000 10731Striped Butterfish Scatophagidae 21140 9578Margined Coralfish Chaetodontidae 31150 5752Yellowtail Demoiselle Pomacentridae 24131 5352Scribbled Angelfish Pomacanthidae 32150 5337Green Chromis Pomacentridae 24131 4699Boxfish, White-barred Ostraciidae 96030 4302Shark, Port Jackson Heterodontidae 96030 4194Old Wife Enoplosidae 96030 4020Shadow Goby Gobiidae 31150 3642Clark’s Anemonefish Pomacentridae 31150 3591Yellow-headed Hulafish Plesiopidae 96010 3591Black-headed Puller Pomacentridae 96030 3520Western Australian Seahorse Syngnathidae 96030 3272Red Anemonefish Pomacentridae 32150 3107Black-finned Threadfin Polynemidae 20160 3000Blue-lined Hulafish Plesiopidae 96010 2831Sweep, Footballer Kyphosidae 96030 2698Blue-tail Mullet Mugilidae 20160 2478Gobbleguts Apogonidae 96000 2091Neon Damsel Pomacentridae 32150 2022Moonlighter Kyphosidae 96030 1512Shaw’s Cowfish Ostraciidae 96010 1467Common Seadragon Syngnathidae 96030 1427Cleanerfish Labridae 96021 1136Red-striped Cardinalfish Apogonidae 96010 1068Boxfish, Western Smooth Ostraciidae 96010 771Short-snouted Seahorse Syngnathidae 96030 284Spiny Seahorse Syngnathidae 20170 4Spiny Seahorse Syngnathidae 20160 1Spotted Seahorse Syngnathidae 20160 1
16
ESD Report Series No. 8 – Marine Aquarium Fish Managed Fishery
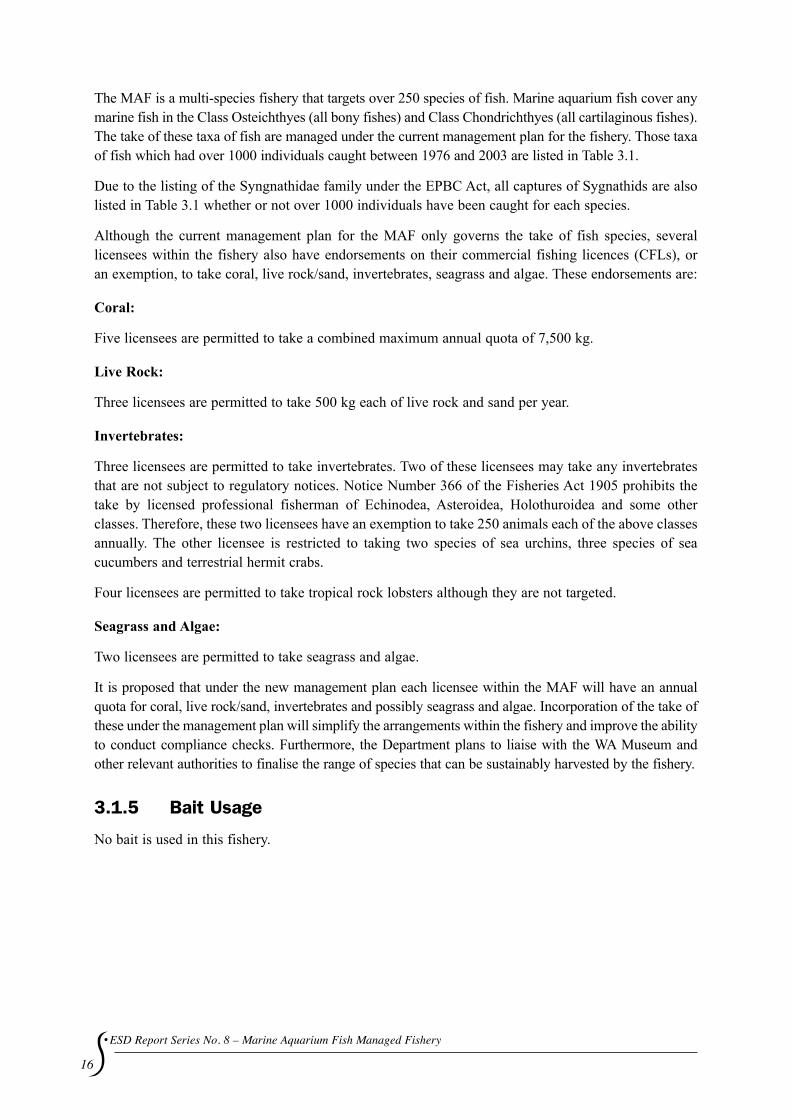
The MAF is a multi-species fishery that targets over 250 species of fish. Marine aquarium fish cover any marine fish in the Class Osteichthyes (all bony fishes) and Class Chondrichthyes (all cartilaginous fishes). The take of these taxa of fish are managed under the current management plan for the fishery. Those taxa of fish which had over 1000 individuals caught between 1976 and 2003 are listed in Table 3.1.
Due to the listing of the Syngnathidae family under the EPBC Act, all captures of Sygnathids are also listed in Table 3.1 whether or not over 1000 individuals have been caught for each species.
Although the current management plan for the MAF only governs the take of fish species, several licensees within the fishery also have endorsements on their commercial fishing licences (CFLs), or an exemption, to take coral, live rock/sand, invertebrates, seagrass and algae. These endorsements are:
Coral:
Five licensees are permitted to take a combined maximum annual quota of 7,500 kg.
Live Rock:
Three licensees are permitted to take 500 kg each of live rock and sand per year.
Invertebrates:
Three licensees are permitted to take invertebrates. Two of these licensees may take any invertebrates that are not subject to regulatory notices. Notice Number 366 of the Fisheries Act 1905 prohibits the take by licensed professional fisherman of Echinodea, Asteroidea, Holothuroidea and some other classes. Therefore, these two licensees have an exemption to take 250 animals each of the above classes annually. The other licensee is restricted to taking two species of sea urchins, three species of sea cucumbers and terrestrial hermit crabs.
Four licensees are permitted to take tropical rock lobsters although they are not targeted.
Seagrass and Algae:
Two licensees are permitted to take seagrass and algae.
It is proposed that under the new management plan each licensee within the MAF will have an annual quota for coral, live rock/sand, invertebrates and possibly seagrass and algae. Incorporation of the take of these under the management plan will simplify the arrangements within the fishery and improve the ability to conduct compliance checks. Furthermore, the Department plans to liaise with the WA Museum and other relevant authorities to finalise the range of species that can be sustainably harvested by the fishery.
3.1.5 Bait Usage
No bait is used in this fishery.

ESD Report Series No. 8 – Marine Aquarium Fish Managed Fishery
17
3.2 HISTORY OF THE FISHERY
3.2.1 Management History
The MAF in WA dates back to the 1960’s with early commercial operators working on permits or conditions on their commercial fishing licences. In 1986, the number of commercial licences was limited to 20. The fishery was reviewed again in 1991. This review resulted in an increase of licences from 20 to 25 in 1994. In accordance with Fisheries Management Paper No. 63 ‘Management of the marine aquarium fish fishery’ (Department of Fisheries 1994), performance criteria had to be met by each licensee to retain their licence. The number of licences in the Fishery declined to the current 13. The total number of licences has been capped at 13 with no more licences to be issued. Subsequently, the only means of access to the fishery is by purchasing an existing licence.
3.2.2 Catch and Effort in the Maf
As an ornamental Fishery, collectors can earn a high return from the capture of very small quantities of individuals. Therefore, the catches are small in comparison to the more common, food-fish fisheries. Statutory (compulsory) monthly catch and effort summaries are compiled by fishers and reported in the Department’s catch and effort statistics (CAES) system. Fishers report catch (kg or numbers) by species or species group. Catch location is reported in a 60 nautical mile (nm) grid (block) system (Figure 3.2), however negotiations are underway to change the grid to a 10 nm scale, and it is envisaged that reporting will be undertaken at this scale by the end of 2004.
Effort in the fishery has stabilised over the past three years (Table 3.2) with nearly all licensees reporting some level of activity. Effort was fairly concentrated with 85% of total effort across the fishery, taking place in six ‘blocks’ from 2001 to 2003 (Table 3.3). Due to the small number and transferability of the licences, effort could shift rapidly through licence transfers. For example, if an Albany based licence were transferred to a Broome resident, the associated effort could shift north.
Given that the specimens are collected for a live market, licensees are restricted in terms of the quantities that they can safely handle and transport (for example, by boat to shore, by vehicle to the holding facility and then on to the retailer) without impacting on the quality of the product. The size of the holding facility and access to regular freight and infrastructure services (such as airports, particularly in the remote northern locations of WA) restricts the levels of effort that can be expended in the Fishery at any given time. Further details on the catch are provided in section 5.1.
Table 3.2 Total fishing effort (days of fishing per block) and distribution of effort, 1999 to 2003.
1999 2000 2001 2002 2003No. of days 689 555 931 914 942No. of licensees reporting effort 14 12 13 12 11No. of blocks containing 95% of effort (total blocks fished) 9 (18) 14 (20) 14 (20) 10 (20) 7 (17)

18
ESD Report Series No. 8 – Marine Aquarium Fish Managed Fishery
Table 3.3 Average distribution of annual effort by block, 2001 to 2003. For location of blocks see Figure 3.2 and Appendix 1.
Block Average annual effort (days) % of total effort20160 325 35.031150 119 12.821140 110 11.920170 90 9.722140 75 8.196030 71 7.624131 37 4.032150 16 1.734180 15 1.624130 12 1.320150 9 0.996010 8 0.996000 6 0.733150 6 0.633140 4 0.420180 4 0.430150 3 0.419190 3 0.321150 2 0.323130 2 0.331140 2 0.233210 2 0.297011 1 0.134150 1 0.133220 1 0.135180 1 0.134190 1 0.135170 1 0.134220 1 0.118220 1 0.127140 <1 <0.120190 <1 <0.1
TOTAL 929 100
3.3 RECREATIONAL FISHERYThere is no documented recreational fishery. However, if the public wishes to collect specimens for their own private aquarium they are permitted to do so but are restricted to normal bag limits and size limits, where applicable. There is a complete ban on the recreational take of coral and totally protected fish such as leafy sea dragons in WA.
3.3.1 Traditional Involvement in the fishery
There is very limited information on this issue. However, it is believed that traditional involvement within this fishery is of minor significance. An aboriginal aquaculture group (Kimberley Aboriginal Aquaculture Corporation) are currently trialing the aquaculture of several marine aquarium fish species.

ESD Report Series No. 8 – Marine Aquarium Fish Managed Fishery
19
3.4 MAJOR ENVIRONMENTS
3.4.1 Physical Environment
The coastal environment of Western Australia is a vast area which, including the offshore islands, spans a length of approximately 20,870 km. At the southern end of the MAF, the coastline borders the Southern Ocean at latitudes of 32-34°S. At the northern end of the MAF the coastline is on the Timor Sea from 12-15°S, whilst the remainder borders the Indian Ocean. The waters range from temperate to tropical. A wide variety of conditions exist along this coastline, which includes large areas of shallow soft seabed, which form an ideal habitat for seagrasses (Kirkman and Walker, 1989). Coral reefs extend for over 3,000 kilometers along the western coast of Australia. A wide variety of reefs are found, ranging from open ocean atolls to fringing and barrier reefs. Reef degradation from sedimentation, run-off, nutrient enrichment, coastal development, and increasing population and visitor numbers to the area are all potential threats to the WA coastline.
The Leeuwin Current is a warm-water current of tropical origin that flows southwards along the Western Australian coast, most strongly in autumn and winter. The Current maintains much higher sea temperatures than occur off the west coasts of Southern Africa and South America at similar latitudes. It has two effects on WA coastal waters - it transports tropical marine larvae from more northern latitudes and it also raises winter water temperatures to enable many of these organisms to survive in the temperate waters found in the south western areas of the state.
3.4.2 Economic Environment
The MAF is part of a global multi-million dollar aquarium fish industry, worth an estimated US$200-330 million annually (Wabnitz et al, 2003). The major export markets are the United States, the European Union (EU) and, to a lesser extent, Japan. It is unclear precisely how much the MAF in Australia is worth because details of the domestic market, which is larger than the export market, are difficult to obtain (J. Potter (MAF licensee), pers. comm. 2003).
3.4.3 Social Environment
Under clauses 9 and 10 of the Marine Aquarium Fish Management Plan 1995, a licensee (or his nominated operator) can fish with 2 nominated divers, thus allowing up to 3 persons to fish under a single licence at any one time. While most licensees dive alone, a full complement of divers is sometimes used, which affects the rate of supply of aquarium fish to markets and the level of employment that the industry generates in regional centres.
By providing specimens for aquariums, the marine aquarium industry contributes to a greater public awareness of marine ecosystems. Aquariums can be an educational tool and are used in a variety of public and private places to convey information about marine ecosystems.

20
ESD Report Series No. 8 – Marine Aquarium Fish Managed Fishery
3.5 CuRRENT AND PROPOSED MANAgEMENT ARRANgEMENTS
3.5.1 Summary of Current Management Strategies and Justification
The current Management Plan commenced on 30 September 1995. The MAF is a limited entry fishery with 13 Managed Fishery Licence (MFL) holders operating on a State-wide basis. Licensees are permitted to take species of the Classes Chondrichthyes and Osteichthyes (i.e., cartilaginous and bony fishes, respectively) for marine aquarium purposes using hand-held nets.
The licensee or nominated operator must not work with more than two nominated divers at any one time and no more than two authorised vessels may be used in the fishing operation (i.e., a ‘mother boat’ and an ‘auxiliary boat’). An authorised boat (whether a mother or auxiliary boat) must not be replaced by a vessel greater than eight metres in length. Fish are only allowed to be collected by hand held nets. All MFL’s except one are fully transferable.
Some MFL holders are also endorsed to take various invertebrate species for marine aquarium purposes via a condition on their individual CFL. Similarly, some MFL holders have small quantities of coral and ‘live’ rock quota endorsed on their CFL’s.
While the Department recognises that the existing management arrangements may not be optimal in terms of efficient administration, equity and enforcement, there are no concerns with respect to sustainability given the limited entry status of the Fishery, the scale of the operations, the wide range of species targeted, the refugia available for these species and the highly selective nature of the Fishery.
Furthermore, the licensees have formed a formal industry association through the Western Australian Fishing Industry Council (WAFIC). A Code of Practice has been drafted by the Association, which advocates responsible fishing practices above and beyond what is legislated (see Appendix 6). The Code will formalise common practices such as not collecting breeding pairs, not repeatedly collecting from the same discrete area and not operating in popular locations during tourist seasons. While the Code itself will not be legislated, it is possible that some of the fishing practices outlined in the code will be incorporated into the revised management plan or be placed as a condition on the MFL.
Outside of the MAF, several public aquariums have been issued with an exemption to collect and hold aquarium specimens for purposes such as educational and community awareness programmes and tourism. For example, Coral World, trading as the Aquarium of Western Australia, has an exemption to collect a variety of aquarium fish, invertebrates, live rock and coral. The Department is considering the development of a specific ‘public aquarium licence’ for these ventures.
3.5.2 Legislation and Policies affecting the fishery
Marine Aquarium Fish Management Plan 1995 (the Plan);
Fish Resources Management Regulations 1995 (FRMR);
Fish Resources Management Act 1994 (FRMA);
Environment Protection and Biodiversity Conservation Act 1999 (EPBC)
Provides the export controls; and
Notice No. 366, Notice No. 387, Order No. 7 of 2001 (West Australian Government Gazette).

ESD Report Series No. 8 – Marine Aquarium Fish Managed Fishery
21
3.5.3 Proposed future Management arrangements
The Management Plan is currently under review. The following proposed changes are expected to be in place during 2005.
Some MFL holders are endorsed to take various invertebrate species for marine aquarium purposes via a condition on their individual CFL. These conditions are somewhat inequitable and the Department is currently considering providing all MFL’s holders with access to ‘invertebrates’ for marine aquarium purposes (with specific limitations on selected species and combined total quotas). Similarly, some MFL holders have small quantities of coral and ‘live’ rock quota endorsed on their CFL’s. It is the Department’s intention that all MFL holders will have access to coral, ‘live’ rock and ‘live’ sand quota for marine aquarium purposes. The Department will liaise with staff of the WA Museum and other relevant agencies to compile a report identifying any species (or groups of species) that may be vulnerable to exploitation and, depending on the outcomes of that report, may introduce ‘quotas’ for particular species.
There is a nominal annual quota of 750 syngnathids imposed on the MAF by DEH. The Department intends to allocate part of the quota to each licensee and establish ‘species-specific’ catch quotas (especially for those primarily targeted), to replace the current ‘blanket’ syngnathid quota. Management arrangements that are consistent with recent listing by the Convention on International Trade in Endangered Species of Wild Fauna and Flora (CITES) will also be included.
As part of the review the Department is also looking to increase the spatial resolution of the catch and effort data provided by MFL holders in the MAF. Monthly catch and effort data supplied by MFL holders, which are entered into the Department’s CAES System, is currently reported in a sixty-nautical mile (nm) grid system. While this spatial scale is suitable for larger scale commercial fisheries (such as rock lobster or wetline fishing) it does not provide a suitable level of detail for smaller scale commercial operations such as the MAF. It is likely that a ten nm grid system will be adopted although the CAES system and grid maps will need to be modified before this can be implemented.
Formal notification by the licensee to the Department of the intention to fish was identified at a recent Compliance Risk Assessment Workshop as a means of being able to better utilise limited compliance resources. It is intended that this measure be adopted within the Fishery to assist in targeting compliance effort and enable the Department to gain a better understanding of the frequency, location and duration of fishing operations. It is expected this will be introduced via an amendment to the Management Plan during 2005.
3.6 RESEARCH STRATEgY
3.6.1 Recent/Current Research
This is presently restricted to the collection and analysis of the MAF’s monthly catch and effort levels, as monitored through CAES records. Information on the biology of captured species has been obtained from published studies, including those completed by local universities or the WA Museum.
3.6.2 Proposed future Research
It is anticipated that the newly formed Industry Association will be proactive in securing funding to undertake research into the main species collected.

22
ESD Report Series No. 8 – Marine Aquarium Fish Managed Fishery
3.7 BIOLOgY OF SPECIES
3.7.1 aquarium fish Species
The most abundant finfish taxa in recent MAF catches (i.e. > 2000 individuals per taxon taken between 2000 to 2003) are described below.
Atherinids are small (typically <10cm), pelagic fish that typically form schools. Atherinomorus ogilbyi inhabits shallow coastal and estuarine waters of Northern Australia, usually in schools. It occurs in WA, Qld and NSW. Maximum length is 17 cm (Allen 1997).
Apogonids are typically small (<10cm), demersal fish. They are mouth-brooders, producing pelagic larvae (Neira and Bruce 1998). There are approximately 91 species of apogonids in Australia, mainly occurring in tropical areas.
Gobiesocids are small (<5 cm), demersal fish that attach to substrate via a sucking disc. They produce demersal eggs and pelagic larvae. They feed on small invertebrates. There are approximately 15 tropical species and numerous temperate species (Leis and Carson-Ewart 2000).
Clupeids are small or medium sized (<20 cm) pelagic species that typically form large, dense schools. Most clupeids feed on plankton. Clupeids are a major prey item for piscivorous fish and birds. There are numerous tropical and temperate species in Australia (Leis and Carson-Ewart 2000). They produce pelagic eggs and larvae.
Mugilids are medium to large sized, schooling fish. Most mugilids are demersal feeders, consuming detritus and vegetation. There are numerous tropical and temperate species in Australia (Leis and Carson-Ewart 2000). They produce pelagic eggs and larvae. Some of the larger mugilid species (mainly Mugil cephalus and Aldrichetta forsteri) are targeted by commercial fishers in Western Australia. Valamugil buchanani is a tropical species occurring in coastal and estuarine waters throughout the Indo-west Pacific. Maximum length is 40 cm (Allen 1997). This species is not targeted by other commercial fishers in Western Australia.
Ambassis vachellii is a tropical species occurring in estuarine waters throughout the east Indian Ocean and Indo-Australian Archipelago. It forms pelagic schools. Maximum length is 7 cm (Allen 1997).
Amniataba caudavittatus is a demersal species occurring in estuarine waters across western (from Cape Leeuwin northwards) and northern Australia and southern New Guinea. Maximum length is 28 cm (Allen 1997, Wise et al. 1994). Individuals are caught and occasionally retained by recreational fishers.
Pomacentrids are typically small (<10cm), producing demersal eggs and pelagic larvae. Chromis atripectoralis is a tropical species that forms large aggregations above coral reefs throughout the Indo-central Pacific. Maximum length is 10 cm (Allen 1997). Neopomacentrus azysron inhabits coral reefs throughout the Indo-west Pacific. Maximum length is 9 cm (Allen 1997).
Chanos chanos is a tropical species occurring in coastal and offshore waters of the Indo-west Pacific. In Australia, it occurs in WA (from Shark Bay northwards), NT, Qld and NSW. Maximum length is 180 cm. It is targeted by commercial fishers in some regions, but is not targeted by commercial fishers in WA (Allen 1997, Hutchins and Swainston 1986).
Selenotoca multifasciata is a tropical species occurring in estuarine and freshwaters waters of the Indo-Australian Archipelago. Maximum length is 28 cm (Allen 1997).

ESD Report Series No. 8 – Marine Aquarium Fish Managed Fishery
23
Plotosus lineatus inhabits coastal waters throughout the Indo-central Pacific, often in the vicinity of coral reefs. Maximum length is 32 cm. Eggs and larvae are demersal (Allen 1997, Neira et al. 1998).
3.7.2 Corals
This fishery collects small quantities of numerous species of soft and hard corals. The difficulties associated with accurate coral identification results in the majority of the catch being reported at family level or as ‘unspecified coral’. However, the fishers concentrate on coral species that survive and acclimatise in aquariums.
Of the soft corals identified, species from the family Alcyoniidae are the most commonly collected. This family forms the vast majority of octocoral coverage throughout the world, except in the Atlantic. These octocorals are known for their thick and encrusting forms and leathery skin. Many grow very large but can also form large colonial and/or clonal aggregations of individual colonies.
There are many more families of hard coral collected. Of the corals identified, the most commonly collected families during 2003 by volume in decreasing order were: Euphyllidae, Caryophylliidae, Dendrophylliidae, Trachyphylliidae and Acroporidae.
3.7.3 Invertebrates
The most commonly collected invertebrates are anemones, sea urchins, sea cucumbers, starfish and shrimp. Similar to the coral species, most are only reported to family level due to the lack of standard taxonomy for marine invertebrates.
3.7.4 Live Rock/Sand
Live rock is usually either a limestone based rock or dead coral that has live marine organisms growing on or in it. Typical inhabitants of live rock are anemones, tunicates, bryozoa, octocorals, sponges, echinoids, molluscs, tube worms, and calcareous algae. Live rock is often targeted for its cover of encrusting red algal species such as coralline algae. Live sand is marine sand containing live organisms including bacteria.
3.7.5 Syngnathids
Some species of syngnathids are vulnerable to overfishing because they reproduce relatively slowly, have low rates of dispersal and are highly habitat dependent. In addition, the distribution and biology of many syngnathids is poorly understood. However, there is no evidence of decline for any syngnathid species retained by the MAF (Pogonowski et al. 2002).
There is an annual limit of 750 syngnathids imposed on the MAF by DEH. No leafy seadragons are permitted to be taken. At least six species of syngnathids are retained by the MAF, although only four are generally targeted. Since 1999 the following species have been recorded:
• Hippocampusangustus/elongatus(catch reported as H.angustus but catches are probably mainly H.elongatus, with minor quantities of H.angustus,as H.angustus is not recorded south of Shark Bay where most captures in the fishery occur)
• Phyllopteryxtaeniolatus
• Hippocampusbreviceps

24
ESD Report Series No. 8 – Marine Aquarium Fish Managed Fishery
• Stigmatoporaargus
• Filicampustigris
• Haliichthystaeniophorus
The syngnathid species primarily taken are widely distributed within WA waters and occur in both shallow and deep waters in both urban and remote locations.
The western spiny seahorse (Hippocampus angustus) is endemic to WA and has a recorded distributional range from Shark Bay to the Dampier Archipelago. The species has been trawled to depths of 31 metres but is also found in shallows. It is generally found in association with seagrass beds. There is no evidence of declines for this species. The species is often misidentified as H.hystrix or H.elongatus (Pogonoski et al. 2002).
The common weedy seadragon (Phyllopteryx taeniolatus) is endemic to Australia and occurs from Port Stephens (NSW) through to Geraldton (WA), including Tasmania. The species is usually found in kelp reefs with edges of sand to depths of 50 metres. Individuals are often found washed up on the shore following storm events. Longevity in aquaria is at least 4-5 years, but lifespan in the wild is unknown. This species breeds early summer and generally only produces one brood per season. There is no evidence of declines for this species (Pogonoski et al. 2002).
The short-snouted seahorse (Hippocampusbreviceps) occurs in South Australia and Tasmania but it’s occurance in WA is uncertain. The presence of this species in MAF catches requires validation. This species is usually found in association with seaweed and algal communities and occurs to depths of 20 metres. Individuals are rarely seen because of their good camouflage and small size. Longevity in aquaria is at least 3 years, but lifespan in the wild is unknown. This species breeds on a monthly cycle over the summer months. There is no evidence of declines for this species (Pogonoski et al. 2002).
The spotted pipefish (Stigmatopora argus) is endemic to southern Australia, occurring from Sydney (NSW) to Shark Bay (WA), including Tasmania (Gomon et al. 1994). The species is usually found in shallow seagrass beds and weedy areas on rocky reefs and they are thought to have a life span of approximately 12 months (Duque-Portugal 1989). They are abundant but are rarely seen because of good camouflage.
The tiger pipefish (Filicampus tigris) is endemic to southern Australia, occurring from southern Queensland to Shark Bay (WA) mostly at depths of 2-25 m (Gomon et al. 1994). This species is rarely taken by the MAF.
The ribboned pipefish (Haliichthystaeniophorus) occurring across northern Australia from Shark Bay (WA) to northern Queensland and also in the Indo-Pacific (Gomon et al. 1994). It is mainly known from trawl grounds. This species is rarely taken by the MAF.
ESD Report Series No. 8 – Marine Aquarium Fish Managed Fishery
25
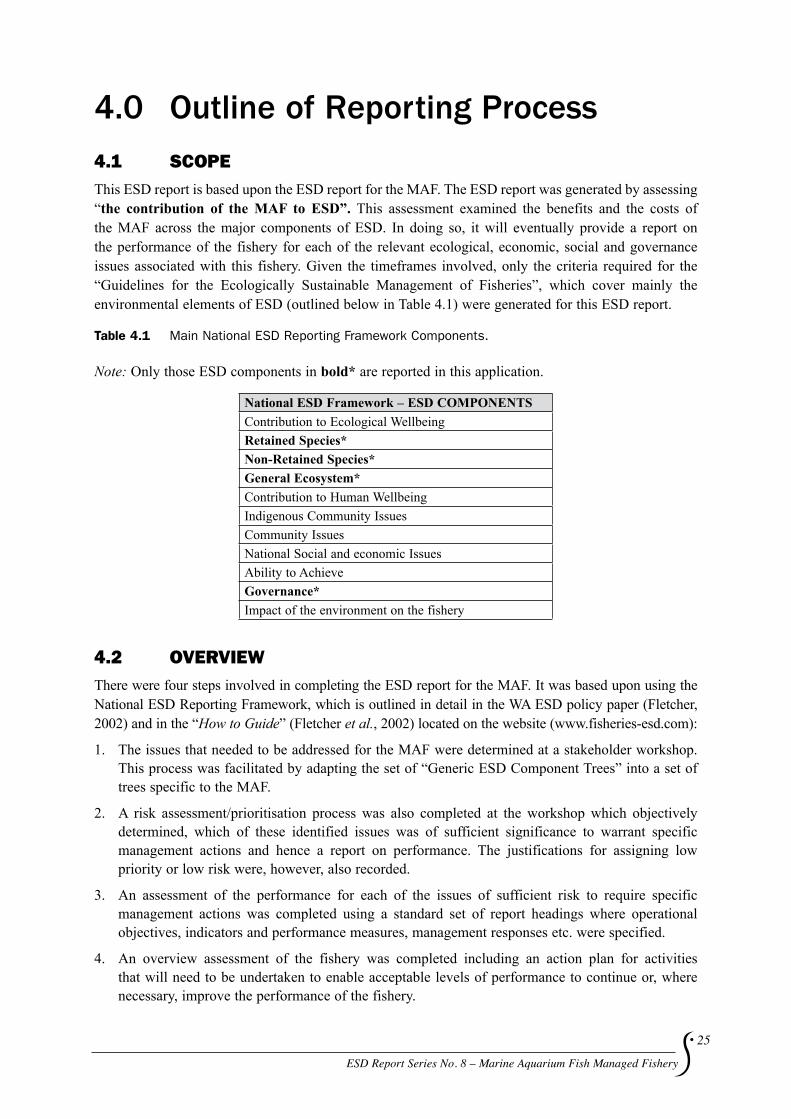
4.0 Outline of Reporting Process 4.1 SCOPE This ESD report is based upon the ESD report for the MAF. The ESD report was generated by assessing “the contribution of the MAF to ESD”. This assessment examined the benefits and the costs of the MAF across the major components of ESD. In doing so, it will eventually provide a report on the performance of the fishery for each of the relevant ecological, economic, social and governance issues associated with this fishery. Given the timeframes involved, only the criteria required for the “Guidelines for the Ecologically Sustainable Management of Fisheries”, which cover mainly the environmental elements of ESD (outlined below in Table 4.1) were generated for this ESD report.
Table 4.1 Main National ESD Reporting Framework Components.
Note: Only those ESD components in bold* are reported in this application.
National ESD Framework – ESD COMPONENTSContribution to Ecological WellbeingRetained Species*Non-Retained Species*General Ecosystem*Contribution to Human WellbeingIndigenous Community IssuesCommunity IssuesNational Social and economic IssuesAbility to Achieve Governance*Impact of the environment on the fishery
4.2 OVERVIEw There were four steps involved in completing the ESD report for the MAF. It was based upon using the National ESD Reporting Framework, which is outlined in detail in the WA ESD policy paper (Fletcher, 2002) and in the “HowtoGuide” (Fletcher et al., 2002) located on the website (www.fisheries-esd.com):
1. The issues that needed to be addressed for the MAF were determined at a stakeholder workshop. This process was facilitated by adapting the set of “Generic ESD Component Trees” into a set of trees specific to the MAF.
2. A risk assessment/prioritisation process was also completed at the workshop which objectively determined, which of these identified issues was of sufficient significance to warrant specific management actions and hence a report on performance. The justifications for assigning low priority or low risk were, however, also recorded.
3. An assessment of the performance for each of the issues of sufficient risk to require specific management actions was completed using a standard set of report headings where operational objectives, indicators and performance measures, management responses etc. were specified.
4. An overview assessment of the fishery was completed including an action plan for activities that will need to be undertaken to enable acceptable levels of performance to continue or, where necessary, improve the performance of the fishery.

26
ESD Report Series No. 8 – Marine Aquarium Fish Managed Fishery
ESD Component Trees(issues identifi ed)
Risk Assessment
Low Risk/Priority > Low Risk/Priority
Report on Justifi cation for Risk Rating Only
Develop Objectives Indicators
Performance limitsReport Current
Status
PLUSGENERAL
BACKGROUNDINFORMATION
=ESD REPORT
Use Data for other purposes
For example,Applications
to DEH
figure 4.1 Summary of the ESD reporting framework processes.
4.3 ISSuE IDENTIFICATION (COMPONENT TREES) The National ESD Reporting Framework has eight major components, which fall into three categories of the “contributions to ecological wellbeing”, “contributions to human wellbeing” and the “ability to achieve the objectives” (Table 4.1). Each of the major components is broken down into more specific sub-components for which operational objectives can ultimately be developed.
To maximise the consistency of the approach amongst different fisheries, common issues within each of the components were identified by the SCFA and ESD reference groups within each of the major component areas and arranged into a series of “generic” component trees (See Fletcher (2002) and the www.fisheries-esd.com web site for a full description). These generic trees were used as the starting point for identifying the issues. These trees were subsequently adapted into trees specific to the MAF by expanding (splitting) or contracting (removing/lumping) the number of sub-components as required (Figure 4.1). This process was conducted at a workshop attended by a variety of stakeholder groups in March 2004.
Component
Sub - Component 3Sub - Component 1
Sub - sub - Component
Sub - Component 2
Sub - sub - Component
Sub - sub - sub Component
Sub - sub - sub Component
figure 4.2 Example of a component tree structure.

ESD Report Series No. 8 – Marine Aquarium Fish Managed Fishery
27
4.4 RISk ASSESSMENT/PRIORITISATION PROCESS After the components/issues were identified, a process to prioritise each of these needs was completed using a formal risk assessment process. The risk assessment framework that was applied at the internal workshop was consistent with the Australian Standard AS/NZS 4360:1999 Risk Management, concentrating on the risk assessment components. The general Risk Assessment process is well documented but in summary, it considers the range of potential consequences of an issue/activity and how likely those consequences are to occur. The combination of the level of consequence and the likelihood is used to produce an estimated level of risk associated with the particular hazardous event/issue in question.
The researchers made an estimate of the consequence level for each issue. This level was from 0-5, with 0 being negligible and 5 being catastrophic/irreversible.
The level of consequence was determined at the appropriate scale for the issue. Thus for target species the consequence of the MAF was based at the population not at the individual level. Obviously catching one fish is always catastrophic for the individual but not always for the population. Similarly, when assessing possible ecosystem impacts this was done at the level of the whole ecosystem or at least in terms of the entire extent of the habitat, not at the level of an individual patch or individuals of non-target species.
The likelihood of a consequence occurring was assigned to one of six levels from remote to likely. In doing so, again it was considered the likelihood of the “hazardous” event (consequence) actually occurring based upon collective wisdom, which included an understanding of the scale of impact required.
From these two figures (consequence and likelihood), the overall risk value, which is the mathematical product of the consequence and likelihood levels (Risk = Consequence x Likelihood), was calculated. Finally, each issue was assigned a Risk Ranking within one of five categories: High, Moderate, Acceptable, Low and Negligible based on the risk value (Table 4.2).
Table 4.2 Risk ranking definitions.
RISK Rank Likely Management Response ReportingNegligible 0 Nil Short Justification Only
Low 1 None Specific Full Justification needed
Moderate 2 Specific Management Needed Full Performance Report
High 3 Possible increases to management activities needed Full Performance Report
Extreme 4 Likely additional management activities needed Full Performance Report
In general, only the issues of sufficient risk (Moderate, High and Extreme), i.e. those that require specific management actions, need to have a full performance reports completed. Nonetheless, the rationale for classifying issues as low risk or even negligible were also documented and formed part of the ESD report. This allows all stakeholders and interested parties to see why issues were accorded these ratings.
It is important to note that the Risk Assessment involves the completion of reports that contain the completed justifications for the scores generated. Thus, the scores determined within the meeting by themselves are insufficient.
28
ESD Report Series No. 8 – Marine Aquarium Fish Managed Fishery
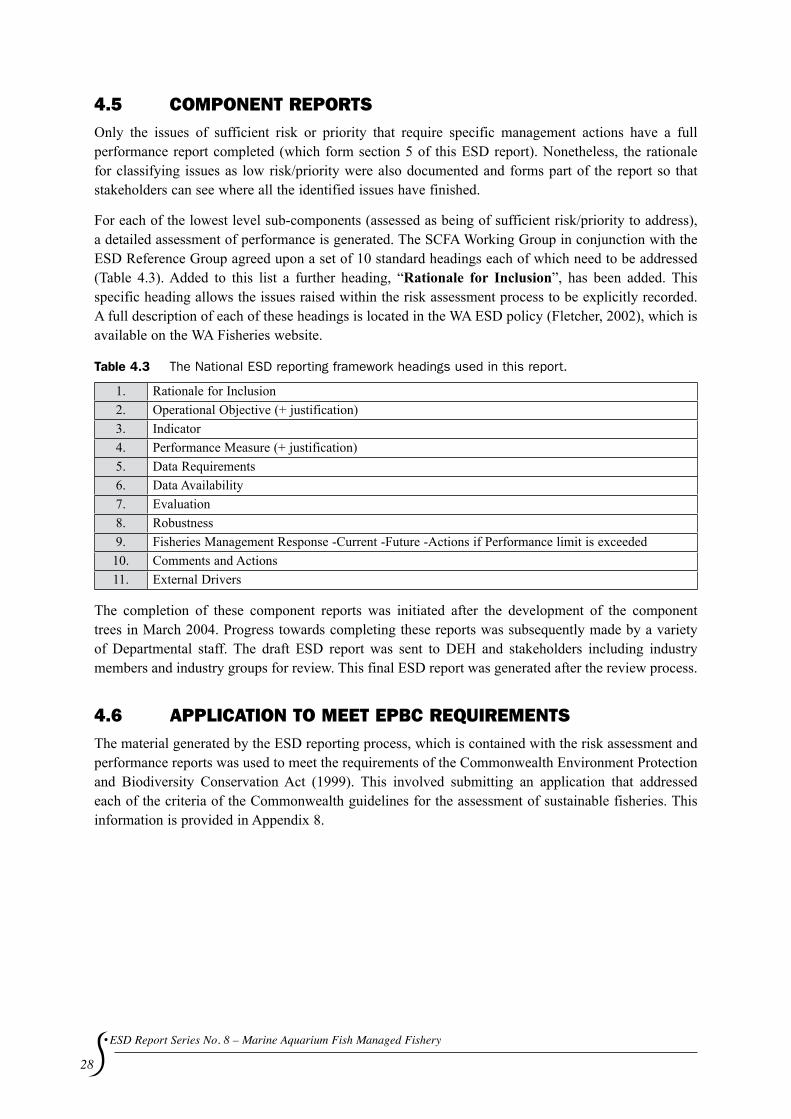
4.5 COMPONENT REPORTS Only the issues of sufficient risk or priority that require specific management actions have a full performance report completed (which form section 5 of this ESD report). Nonetheless, the rationale for classifying issues as low risk/priority were also documented and forms part of the report so that stakeholders can see where all the identified issues have finished.
For each of the lowest level sub-components (assessed as being of sufficient risk/priority to address), a detailed assessment of performance is generated. The SCFA Working Group in conjunction with the ESD Reference Group agreed upon a set of 10 standard headings each of which need to be addressed (Table 4.3). Added to this list a further heading, “Rationale for Inclusion”, has been added. This specific heading allows the issues raised within the risk assessment process to be explicitly recorded. A full description of each of these headings is located in the WA ESD policy (Fletcher, 2002), which is available on the WA Fisheries website.
Table 4.3 The National ESD reporting framework headings used in this report.
1. Rationale for Inclusion 2. Operational Objective (+ justification) 3. Indicator4. Performance Measure (+ justification)5. Data Requirements6. Data Availability7. Evaluation8. Robustness 9. Fisheries Management Response -Current -Future -Actions if Performance limit is exceeded10. Comments and Actions11. External Drivers
The completion of these component reports was initiated after the development of the component trees in March 2004. Progress towards completing these reports was subsequently made by a variety of Departmental staff. The draft ESD report was sent to DEH and stakeholders including industry members and industry groups for review. This final ESD report was generated after the review process.
4.6 APPLICATION TO MEET EPBC REQuIREMENTS The material generated by the ESD reporting process, which is contained with the risk assessment and performance reports was used to meet the requirements of the Commonwealth Environment Protection and Biodiversity Conservation Act (1999). This involved submitting an application that addressed each of the criteria of the Commonwealth guidelines for the assessment of sustainable fisheries. This information is provided in Appendix 8.
ESD Report Series No. 8 – Marine Aquarium Fish Managed Fishery
29
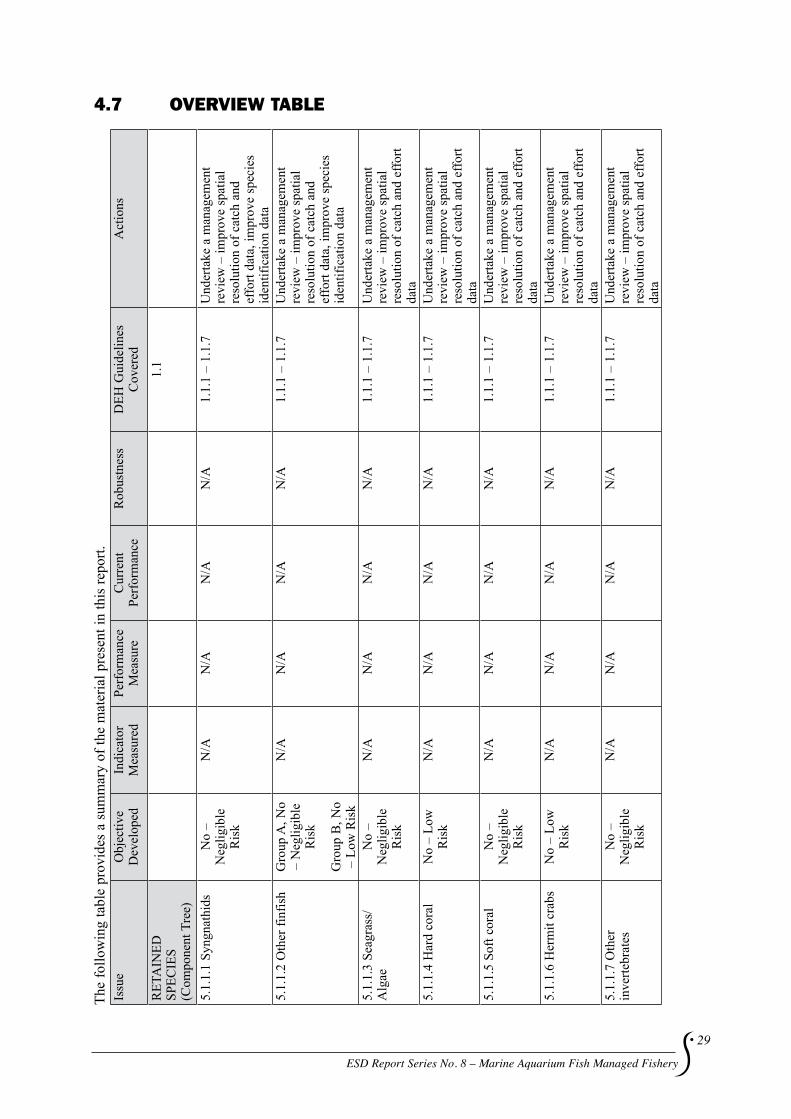
4.7 OVERVIEw TABLETh
e fo
llow
ing
tabl
e pr
ovid
es a
sum
mar
y of
the
mat
eria
l pre
sent
in th
is re
port.
Is
sue
Obj
ectiv
e D
evel
oped
In
dica
tor
Mea
sure
d Pe
rfor
man
ce
Mea
sure
C
urre
nt
Perf
orm
ance
R
obus
tnes
s D
EH G
uide
lines
C
over
ed
Act
ions
RET
AIN
ED
SPEC
IES
(Com
pone
nt T
ree)
1.1
5.1.
1.1
Syng
nath
ids
No
– N
eglig
ible
R
isk
N/A
N/A
N
/A
N/A
1.
1.1
– 1.
1.7
Und
erta
ke a
man
agem
ent
revi
ew –
impr
ove
spat
ial
reso
lutio
n of
cat
ch a
nd
effo
rt da
ta, i
mpr
ove
spec
ies
iden
tific
atio
n da
ta5.
1.1.
2 O
ther
finf
ish
Gro
up A
, No
– N
eglig
ible
R
isk
Gro
up B
, No
– Lo
w R
isk
N/A
N
/A
N/A
N
/A
1.1.
1 –
1.1.
7 U
nder
take
a m
anag
emen
t re
view
– im
prov
e sp
atia
l re
solu
tion
of c
atch
and
ef
fort
data
, im
prov
e sp
ecie
s id
entif
icat
ion
data
5.1.
1.3
Seag
rass
/A
lgae
N
o –
Neg
ligib
le
Ris
k
N/A
N
/A
N/A
N
/A
1.1.
1 –
1.1.
7 U
nder
take
a m
anag
emen
t re
view
– im
prov
e sp
atia
l re
solu
tion
of c
atch
and
effo
rt da
ta5.
1.1.
4 H
ard
cora
lN
o –
Low
R
isk
N/A
N
/A
N/A
N
/A
1.1.
1 –
1.1.
7 U
nder
take
a m
anag
emen
t re
view
– im
prov
e sp
atia
l re
solu
tion
of c
atch
and
effo
rt da
ta5.
1.1.
5 So
ft co
ral
No
– N
eglig
ible
R
isk
N/A
N
/A
N/A
N
/A
1.1.
1 –
1.1.
7 U
nder
take
a m
anag
emen
t re
view
– im
prov
e sp
atia
l re
solu
tion
of c
atch
and
effo
rt da
ta5.
1.1.
6 H
erm
it cr
abs
No
– Lo
w
Ris
k N
/A
N/A
N
/A
N/A
1.
1.1
– 1.
1.7
Und
erta
ke a
man
agem
ent
revi
ew –
impr
ove
spat
ial
reso
lutio
n of
cat
ch a
nd e
ffort
data
5.1.
1.7
Oth
er
inve
rtebr
ates
No
– N
eglig
ible
R
isk
N/A
N
/A
N/A
N
/A
1.1.
1 –
1.1.
7 U
nder
take
a m
anag
emen
t re
view
– im
prov
e sp
atia
l re
solu
tion
of c
atch
and
effo
rt da
ta

30
ESD Report Series No. 8 – Marine Aquarium Fish Managed Fishery
Issu
e O
bjec
tive
Dev
elop
ed
Indi
cato
r M
easu
red
Perf
orm
ance
M
easu
re
Cur
rent
Pe
rfor
man
ce
Rob
ustn
ess
DEH
Gui
delin
es
Cov
ered
A
ctio
ns
5.1.
1.8
Livi
ng ro
ckN
o –
Neg
ligib
le
Ris
k
N/A
N
/A
N/A
N
/A
1.1.
1 –
1.1.
7 U
nder
take
a m
anag
emen
t re
view
– im
prov
e sp
atia
l re
solu
tion
of c
atch
and
effo
rt da
ta5.
1.1.
9 Li
ving
san
dN
o –
Neg
ligib
le
Ris
k
N/A
N
/A
N/A
N
/A
1.1.
1 –
1.1.
7 U
nder
take
a m
anag
emen
t re
view
– im
prov
e sp
atia
l re
solu
tion
of c
atch
and
effo
rt da
taN
ON
-RET
AIN
ED
N/A
N
/A
N/A
N
/A
N/A
2.
1 an
d 2.
2 SP
ECIE
S (C
ompo
nent
Tre
e)
GEN
ERA
L EN
VIR
ON
MEN
T (C
ompo
nent
Tre
e)
2.3
5.3.
1.1
Trop
hic
inte
ract
ions
No
–N
eglig
ible
R
isk
N/A
N
/A
N/A
N
/A
2.3.
1 –
2.3.
5 R
evie
w R
isk
at N
ext M
ajor
A
sses
smen
t.
5.3.
1.2
Ben
thic
bio
ta
(non
-targ
et e
lem
ents
) N
o –
Neg
ligib
le
Ris
k
N/A
N
/A
N/A
N
/A
2.3.
1 –
2.3.
5 R
evie
w R
isk
at N
ext M
ajor
A
sses
smen
t.
5.3.
1.3
Anc
horin
g N
o –
Neg
ligib
le
Ris
k
N/A
N
/A
N/A
N
/A
2.3.
1 –
2.3.
5 R
evie
w R
isk
at N
ext M
ajor
A
sses
smen
t.
5.3.
2.1
Tran
sloc
atio
n by
Ves
sel H
ulls
No
– Lo
w
Ris
k N
/A
N/A
N
/A
N/A
2.
3.1
– 2.
3.5
Rev
iew
Ris
k at
Nex
t Maj
or
Ass
essm
ent.
5.3.
3.1
Exha
ust
fum
es
No
– N
eglig
ible
R
isk
N/A
N
/A
N/A
N
/A
2.3.
1 –
2.3.
5 R
evie
w R
isk
at N
ext M
ajor
A
sses
smen
t.
5.3.
3.2
Oil
disc
harg
eN
o –
Neg
ligib
le
Ris
k
N/A
N
/A
N/A
N
/A
2.3.
1 –
2.3.
5 R
evie
w R
isk
at N
ext M
ajor
A
sses
smen
t.

ESD Report Series No. 8 – Marine Aquarium Fish Managed Fishery
31
5.0 Performance Reports 5.1 RETAINED SPECIESCOMPONENT TREE FOR THE RETAINED SPECIES
Other finfish
Algae/seagrass
Hard coral
Soft coral
Hermit crabs
Other invertebrates
‘Living rock’
‘Living sand’
Snygnathids
Finfish
Primary Species By-Product Species (none)
Retained Species
A blue box indicates that the issue was considered a low or negligible risk, with no specific management required, and only a justification is presented.
5.1.1 Primary Species
5.1.1.1 Syngnathids Rationale for Inclusion
Small numbers of seahorses and pipefish are retained by the fishery. All species in the family Syngnathidae are listed as protected species under Commonwealth legislation (EPBC). It is an offence to kill, injure, take, trade, keep or move a member of a listed species without a permit (EPBC). Permits have been issued to licensees in the MAF.
ERA Risk Rating: Impact on breeding stocks (C0 L6 NEGLIGIBLE)

32
ESD Report Series No. 8 – Marine Aquarium Fish Managed Fishery
In general, some species of syngnathids may be vulnerable to overfishing because they reproduce relatively slowly, have low rates of dispersal and are highly habitat dependent. The distribution and biology of many syngnathids is poorly understood.
The MAF catches various species of shallow water syngnathids. However, the impact of the MAF on these syngnathids is likely to be minimal because low numbers of each species are caught per year (Table 5.1). No other commercial fishery targets these populations of syngnathids because the MAF operates in shallow water and other fisheries operate in deeper waters.
An annual limit of 750 syngnathids is imposed on the MAF by the Department of Environment and Heritage. No leafy seadragons (Phycodurus eques) are permitted to be taken. There is no evidence of declines for any syngnathid species retained by the MAF (Pogonowski et al. 2002).
At least six species of syngnathids have been reported by the MAF in the past, although only four are generally targeted. Hippocampusangustusis endemic to Western Australian waters and has been recorded from Shark Bay to the Dampier Archipelago (Pogonowski et al. 2002). The other syngnathid species reported by the MAF (see Table 5.1) each have a relatively wide distribution, encompassing the waters of WA and at least 1 other Australian state (Pogonowski et al. 2002). Hence, the total area in which syngnathids are captured by the MAF is very low relative to the total distribution of each species (Table 5.2).
Table 5.1 Annual MAF catch (no. of individuals) of Syngnathids, 1999-2003.
Taxa 1999 2000 2001 2002 2003Filicampus tigris 3 Haliichthystaeniophorus 1Hippocampusangustus/elongatus* 178 329 330 456 110Hippocampusbreviceps 64 62 56 18Phyllopteryx taeniolatus 136 223 325 332 215Stigmatopora argus 78 24 1 21 50Syngnathidae, unspecified 29 6 8TOTAL 460 638 741 833 383
*catch reported as H.angustus but catches are probably mainly H.elongatus, with minor quantities of H.angustus.
Therefore, the fishery is ‘likely’ to have a ‘negligible’ impact on breeding populations of syngnathids. This results in a risk rating of NEGLIGIBLE.
Whilst there is uncertainty about the correct identification of some retained syngnathid species, due to the very low catch levels, this uncertainty does not represent a risk to the sustainability of any individual species. However, it is recognised that the standard of reporting by the MAF could be improved. A stakeholder workshop will be held during 2004/05 to address taxonomic uncertainties and other issues in the MAF.
Under the current DEH management arrangements there is nothing to prevent 750 of one species of syngnathid being taken. The management plan review process will investigate the potential to develop species-specific quotas for syngnathids, and the allocation of individual quotas to licensees.

ESD Report Series No. 8 – Marine Aquarium Fish Managed Fishery
33
Table 5.2 Total Sygnathid catches (no. of individuals) by block in 2002 and 2003.
Block 9600 = Cockburn Sound, 9603 = King George Sound. For locations of other blocks, see Figure 3.2.
Annual catchBlock 2002 20039603 298 2033115 195 1089600 96 383215 109 42413 603418 333015 313315 162017 103518 63419 52016 4
TOTAL 833 383
5.1.1.2 Other Finfish
Rationale for Inclusion:
Small numbers of numerous marine finfish species are retained by the fishery.
ERa Risk Rating: Impact on breeding stocks:
Group a (C0 L6 NEGLIGIBLE) Group B (C1 L4 LOW)
From 2000 to 2003, the total annual catch (no. of individuals) of finfish (excluding syngnathids) by the MAF was 109757, 165657, 104907 and 130025, respectively. While there are currently no quotas on the total catch of finfish by the MAF, the total finfish catch is effectively limited by restrictions on the number of licensees (13 in total) and the physiological constraints of diver-based collection methods.
The vast majority of finfish species that are retained by the MAF are not targeted by other commercial fisheries in Western Australia. From 2000 to 2003, the MAF retained finfish from 117 families, comprising at least 541 species/taxa. However, not all taxa were reported each year – between 321 and 331 taxa were reported in any single year. The number of retained individuals of each taxa was generally very low, i.e. <2000 individuals per year (Table 5.3).
In this report, finfish taxa are divided into 2 groups, according to the average annual catch level. Group A contains those taxa that have an average annual catch of <2000 individuals per year. Group B contains those taxa that have an average annual catch of >2000 individuals per year.
Group A Finfish. This group includes 97 % of taxa caught by the fishery (Tables 5.3, 5.4). Much of the catch is taken around Roebourne (blocks 2016 and 2017) and the around Perth metropolitan area (block 3115), although the total catch is spread across a very wide area, comprising 34 MAF reporting blocks (Table 5.5). The finfish species taken by the MAF tend to be small (<10 cm in length) and abundant, with biological characteristics (high fecundity, planktonic larval dispersal, early age-at-maturity, etc) that minimise the risk of overfishing. Annual catches of <2000 individuals per species are likely to be negligible compared with total stock abundance and also negligible compared with rates of natural mortality (e.g. due to predation).

34
ESD Report Series No. 8 – Marine Aquarium Fish Managed Fishery
Therefore, the fishery is ‘likely’ to have a ‘negligible’ impact on breeding populations of Group A finfish. This results in a risk rating of NEGLIGIBLE.
Table 5.3 Average annual catches (no. of individuals) of finfish taxa reported by the MAF, from 2000 to 2003 (excluding syngnathids).
Group Average annual catch Number of taxa in this categoryA 0-50 427A 50-100 37A 100-500 50A 500-1000 9A 1000-1500 3A 1500-2000 0B > 2000 15
Table 5.4 Average annual catch (no. of individuals) per taxa of Group A finfish*, from 2000 to 2003.
(Group A taxa had an average annual catch of <2000 individuals. ‘Other’ is the summed catch of the remaining 427 taxa that had average annual catches of <50 individuals per year)
Taxa Catch Taxa Catch Taxa Catch Periopthalmus argentilineatus 1200 Gerres oyena 205 Parma mccullochi 90 Pomacentridae 1066 Cryptocentrus obliquus 202 Sillago sihama 89 Mullidae 1035 Istigobius ornatus 201 Paraplesiops meleagris 88 Yongeichthys nebulosus 989 Liza vaigiensis 190 Amphiprion frenatus 86 Polydactylus nigripinnis 800 Amphiprion rubrocinctus 187 Sphyraena barracuda 84 Heterodontusportusjacksoni 757 Lutjanusrusselli 186 Gobiidae 82 Apogon rueppellii 615 Halichoeresbrownfieldi 184 Istiblennius meleagris 82 Glossogobius biocellatus 603 Rhabdosargus sarba 172 Halichoeresmelanochir 80 Lutjanusargentimaculatus 573 Epinephelus coioides 172 Anoplocapros robustus 79 Amphiprionclarkii 554 Apogon victoriae 158 Apogon angustatus 78 Chelmon marginalis 538 Taeniura lymma 153 Siphonognathus radiatus 77 Monodactylus argenteus 509 Dasyatiskuhlii 151 Acentrogobius gracilis 76 Mugil cephalus 496 Pomacentrus milleri 149 Bathygobius fuscus 75 Anoplocapros lenticularis 465 Petroscirtes breviceps 142 Pseudochromis fuscus 75 Neopomacentrus filamentosus 460 Aracana aurita 141 Arothron reticularis 73 Chaetodontidae/Pomacanthidae 457 Neatypus obliquus 141 Orectolobidae 72 Trachinops noarlungae 455 Parupeneus signatus 139 Chelmonops curiosus 71 Chaetodon aureofasciatus 455 Labridae 139 Bodianus frenchii 70 Blenniidae 448 Chromis viridis 136 Thyrsites atun 68 Sillaginidae 395 Microcanthus strigatus 129 Cirripectes filamentosus 65 Coris auricularis 392 Pterois volitans 125 Arius graeffei 64 Lactoria cornuta 360 Pempheris analis 123 Aptychotrema vincentiana 61 Teraponjarbua 350 Scorpaenopsis venosa 122 Halophryneocellatus 59 Carangidae 340 Labroides dimidiatus 117 Plotosidae 58 Chromisklunzingeri 309 Hemiramphidae 111 Salarias fasciatus 55 Pomacentrus pavo 300 Amblygobius phalaena 109 Congrogadus subducens 54 Enoplosus armatus 296 Parachaetodon ocellatus 106 Istigobius decoratus 54 Pomacentrus coelestis 284 Abudefduf vaigiensis 104 Belonidae 53 Ecsenius yaeyamensis 249 Valenciennea muralis 101 Ariidae 52 Trachinops brauni 242 Chaetodon assarius 97 Apogonendekataenia 52 Thalassoma lunare 239 Pterapogon mirifica 97 Acanthurus triostegus 52 Chaetodontoplus duboulayi 220 Acanthurus grammoptilus 93 Sargocentron rubrum 51 Tilodon sexfasciatum 205 Pempherisklunzingeri 91 Pempheris multiradiatus 50
Other (includes 427 taxa) 3454

ESD Report Series No. 8 – Marine Aquarium Fish Managed Fishery
35
Table 5.5 Total catch (no. of individuals) of Group A and Group B finfish by block, summed from 2000 to 2003.
Block 9600 = Cockburn Sound, 9601 = Geographe Bay, 9603 = King George Sound, 97011 = Abrolhos Islands. For locations of other blocks, see Figure 3.2.
Block Group A Group B 1919 9 2015 92 8 2016 14037 43178 2017 3846 34827 2018 210 21007 2019 317 343 2114 1223 259 2214 516 41 2313 31 146 2413 511 141 2714 13 3014 2 3015 92 1 3114 47 3115 3479 407 3215 861 109 3314 103 3315 138 3320 2 3321 61 3322 29 3414 5 3415 54 3418 235 3419 10 3420 23 3422 12 3517 99 3518 10 9600 186 75 9601 261 9603 529 97011 8
Group B Finfish. From 2000 to 2003, only 15 finfish taxa had average annual catches of >2000 per year (Table 5.6). Five of these taxa (apogonids, atherinids, clupeids, mugilids and gobiesocids) may represent >1 species, and so catches of individual species within these taxa may not actually exceed 2000 individuals per year. None of these 15 taxa are listed as threatened (Pogonowski et al. 2002).
Group B taxa share biological characteristics that minimise the risk of overfishing. All are relatively abundant species that have a wide distribution. The abundances of these taxa are high, partly because they occur in a range of habitat types and have broad diets (either omnivorous or planktivorous), and so are not strongly affected by food or habitat limitations. Most of these taxa have an early age-at-maturity, are highly fecund and produce pelagic eggs and/or larvae, which allows dispersal over long distances and promotes recruitment across a broad area.

36
ESD Report Series No. 8 – Marine Aquarium Fish Managed Fishery
From 2000 to 2003, group B taxa were mainly caught in the region from Port Hedland to Roebourne (MAF blocks 2016, 2017, 2018) (Table 5.5). Nearly all of these fish were taken by a single licensee, for the purpose of supplying live food.
The current MAF Management Plan does not refer to the taking of fish for live food. However, the Management Plan is under review and it is anticipated that the new Plan will restrict the taking of fish for live food within the MAF.
Group B taxa are common prey items for larger piscivores (fish and birds). Therefore, despite the relatively high catches (compared to other finfish caught by the MAF) and the localised distribution of catches, the quantities of these taxa taken by the MAF are likely to be minor relative to natural mortality due to predation. Assuming an average body weight of 20 g per fish, average annual MAF catches of Group B taxa are estimated to range from 42 to 482 kg per taxa. The risk of localised depletion is low because rates of population growth by these species are relatively rapid and can sustain moderate levels of fishing. Also, annual population replenishment of these species occurs via recruitment of planktonic larvae, independent of local population abundance. The total area in which these taxa are captured by the MAF is very small relative to the total distribution of each species, and so the impact of the MAF on the total breeding stock of each species is likely to be low or negligible.
Therefore, it is possible that the fishery could have a minor, but detectable, impact on breeding populations of Group B finfish. This results in a risk rating of LOW.
Table 5.6 Average annual catch (no. of individuals) of Group B finfish* by the MAF, from 2000 to 2003.
(*Group B taxa had an average annual catch of >2000 individuals per year). Family Taxa/species Common Name Average Catch Apogonidae/Dinolestidae Unspecified Cardinalfish 24084 Atherinidae Unspecified Hardyheads 20470
Atherinomorus ogilbyi Ogilby’s Hardyhead 7113Clupeidae Unspecified Herring/sardine 8923 Mugilidae Unspecified Mullet 7626
Valamugil buchanani Blue-tail mullet 3519Gobiesocidae Unspecified Clingfish 4551 Pomacentridae Chromis atripectoralis Black-axil chromis 4514
Chromis cinerascens Green chromis 2482 Neopomacentrus azysron Yellowtail demoiselle 2100
Teraponidae Amniataba caudavittatus Yellowtail grunter 3644Chandidae Chanos chanos Milkfish 3072 Chanidae Ambassis vachellii Telkara Perchlet 3000 Plotosidae Plotosus lineatus Striped catfish 2943 Scatophagidae Selenotoca multifasciata Striped butterfish 2500
A very high diversity of finfish species in the catch has resulted in uncertainty about the correct identification of some retained species. Due to the very low catch levels, this uncertainty does not represent a risk to the sustainability of any individual species. However, it is recognised that the standard of reporting by the MAF could be improved. A stakeholder workshop will be held during 2004/05 to address taxonomic uncertainties, the taking of fish for live food and other issues in the MAF.
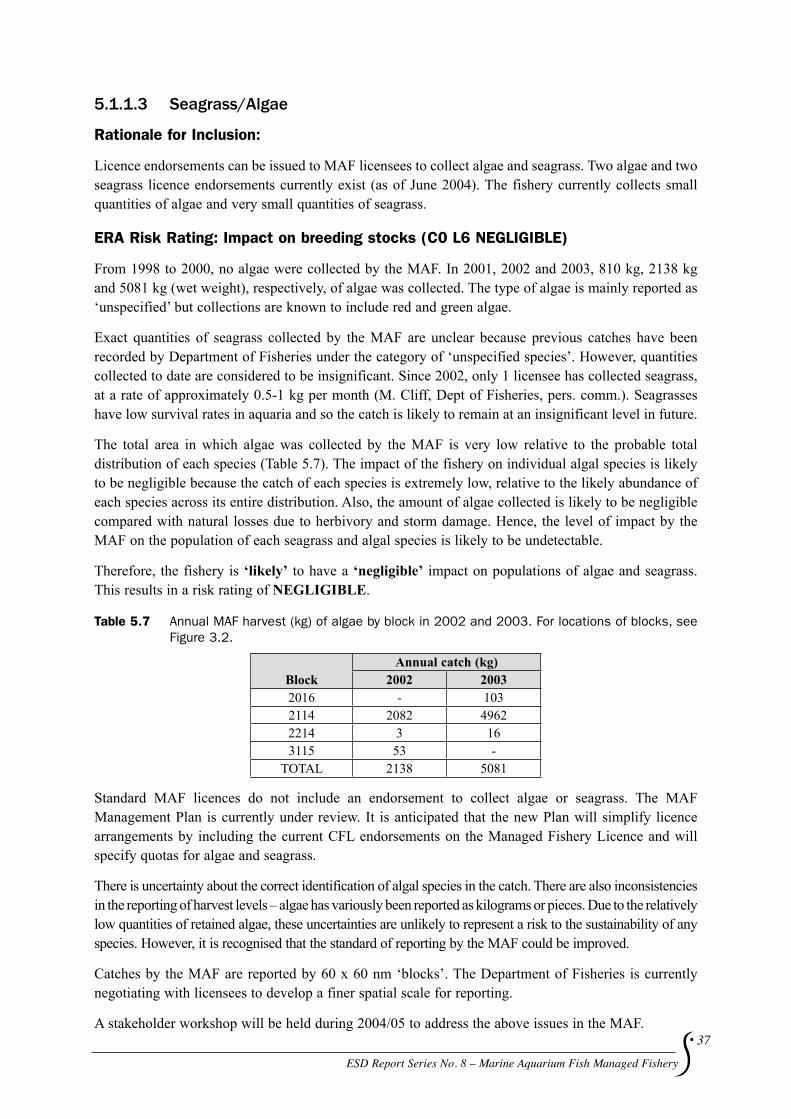
ESD Report Series No. 8 – Marine Aquarium Fish Managed Fishery
37
5.1.1.3 Seagrass/algae
Rationale for Inclusion:
Licence endorsements can be issued to MAF licensees to collect algae and seagrass. Two algae and two seagrass licence endorsements currently exist (as of June 2004). The fishery currently collects small quantities of algae and very small quantities of seagrass.
ERa Risk Rating: Impact on breeding stocks (C0 L6 NEGLIGIBLE)
From 1998 to 2000, no algae were collected by the MAF. In 2001, 2002 and 2003, 810 kg, 2138 kg and 5081 kg (wet weight), respectively, of algae was collected. The type of algae is mainly reported as ‘unspecified’ but collections are known to include red and green algae.
Exact quantities of seagrass collected by the MAF are unclear because previous catches have been recorded by Department of Fisheries under the category of ‘unspecified species’. However, quantities collected to date are considered to be insignificant. Since 2002, only 1 licensee has collected seagrass, at a rate of approximately 0.5-1 kg per month (M. Cliff, Dept of Fisheries, pers. comm.). Seagrasses have low survival rates in aquaria and so the catch is likely to remain at an insignificant level in future.
The total area in which algae was collected by the MAF is very low relative to the probable total distribution of each species (Table 5.7). The impact of the fishery on individual algal species is likely to be negligible because the catch of each species is extremely low, relative to the likely abundance of each species across its entire distribution. Also, the amount of algae collected is likely to be negligible compared with natural losses due to herbivory and storm damage. Hence, the level of impact by the MAF on the population of each seagrass and algal species is likely to be undetectable.
Therefore, the fishery is ‘likely’ to have a ‘negligible’ impact on populations of algae and seagrass. This results in a risk rating of NEGLIGIBLE.
Table 5.7 Annual MAF harvest (kg) of algae by block in 2002 and 2003. For locations of blocks, see Figure 3.2.
Annual catch (kg)Block 2002 20032016 - 1032114 2082 49622214 3 163115 53 -
TOTAL 2138 5081
Standard MAF licences do not include an endorsement to collect algae or seagrass. The MAF Management Plan is currently under review. It is anticipated that the new Plan will simplify licence arrangements by including the current CFL endorsements on the Managed Fishery Licence and will specify quotas for algae and seagrass.
There is uncertainty about the correct identification of algal species in the catch. There are also inconsistencies in the reporting of harvest levels – algae has variously been reported as kilograms or pieces. Due to the relatively low quantities of retained algae, these uncertainties are unlikely to represent a risk to the sustainability of any species. However, it is recognised that the standard of reporting by the MAF could be improved.
Catches by the MAF are reported by 60 x 60 nm ‘blocks’. The Department of Fisheries is currently negotiating with licensees to develop a finer spatial scale for reporting.
A stakeholder workshop will be held during 2004/05 to address the above issues in the MAF.

38
ESD Report Series No. 8 – Marine Aquarium Fish Managed Fishery
5.1.1.4 Hard Coral
Rationale for Inclusion:
Licence endorsements can be issued to MAF licensees to collect hard coral. Five permits currently exist (as of June 2004). The fishery collects small quantities of numerous species of hard coral.
ERA Risk Rating: Impact on breeding stocks (C1 L5 LOW)
From the mid-1980s, the Department of Fisheries permitted five licensees to each collect up to 2,000 kg of hard coral, with an annual total fishery maximum of 10,000 kg. This maximum was recently reduced, through non-renewal of a licence, to 8,000 kg. MAF licensees have proposed that the total allowable catch be redistributed among all licensees in the fishery. This proposal is supported by the Department of Fisheries. Under this proposal, the 4 current licensees with existing coral-collecting permits would be allocated 1,000 kg per year and the remaining 9 licensees without coral-collecting permits being would be allocated 500 kg per year. This equates to a total maximum annual allowable take of 8,500 kg. No other commercial or recreational fishery in Western Australia is permitted to retain hard coral.
Collections of hard coral have variously been reported as kilograms or pieces. It is estimated that 5 pieces = approximately 1 kg (M. Cliff, Dept. of Fisheries, pers. comm.). Based on this estimate, total annual catches of 2006 kg, 2309 kg and 2197 kg were reported in 1999, 2000 and 2001, respectively. In 2002 and 2003, total annual catches of hard coral by the MAF were approximately 4700 kg (Table 5.8).
Since 2001, some hard coral catches have been reported by species. From 2001 to 2003, 21 individual species were named in collections. However, the vast majority of the catch was only reported at family level (15 families) or as ‘unspecified hard coral’ (Table 5.8).
Most of the hard coral collection by the MAF occurs in block 2016 (Tables 5.9, 5.10). From 2001 to 2003, the catch within block 2016 comprised at least 30 taxa. Over this 3-year period, the total catch of Caryophylliidae was 1125 kg, while catches of other taxa were much lower and ranged from 1 to 575 kg per taxa (Table 5.10).
Table 5.8 Annual MAF catches (kg) of hard coral, 2001 to 2003.
Annual catch (kg)Family 2001 2002 2003Acroporidae 22 201 345Agariciidae 2 7Anthemiphylliidae 33 296 222Caryophylliidae 16 721 449Dendrophylliidae 67 352 459Euphyllidae 57 489 855Fungiidae 18 89 94Merulinidae 2 5 2Mussidae 28 169 68Oculinidae 7 14Pectiniidae 3Pocilloporidae 7 5 58Poritidae 60 404 151Siderastreidae 3Trachyphylliidae 75 276Hard coral, unspecified 1887 1931 1634Grand Total 2197 4748 4637

ESD Report Series No. 8 – Marine Aquarium Fish Managed Fishery
39
Table 5.9 Annual MAF catches (kg) of hard coral by block, 2002 and 2003.
See Figure 3.2 for location of blocks.
Annual catch (kg)Block 2002 20032016 3836 38322017 130 1262114 149 1182214 217 2492413 150 343115 267 279
Grand Total 4748 4637
There is a small risk of localised depletion of some hard coral species in block 2016. The impact of the current catch rate is likely to be greatest for slow growing species. Presently, there is considerable uncertainty about the correct identification of hard coral species in the reported catch. Whilst there are uncertainties about the quantity of hard coral collected because of inconsistencies in reported catch units (kg versus pieces), the risks to any one species is very small because the area over which each species is targeted by the MAF represent much less than 1% of the total distribution of theses species groups. Moreover, the damage to these groups from the storms that frequent these locations are likely to result in damage that is many orders of magnitude larger than results from these collections. Therefore, the impact of the MAF on the standing stocks of each hard coral species is likely to be low to negligible.
It has been, nonetheless, recognised that the standard of reporting by the MAF should be improved. Taxonomic uncertainties need to be resolved. Also, the Department of Fisheries is currently negotiating with licensees to develop a finer spatial scale for reporting. Catches by the MAF are currently reported by 60 x 60 nm ‘blocks’.
Therefore, the fishery may have a minor, but detectable, impact on populations of some hard coral species. This results in a risk rating of LOW.

40
ESD Report Series No. 8 – Marine Aquarium Fish Managed Fishery
Table 5.10 Annual MAF catch (kg) of hard coral in block 2016.
Family Species 2001 2002 2003Acroporidae Acropora tizardi 3
Unspecified 4 98 235Astreopora gracilis 6
Agariciidae Unspecified 2Pavona decussata 4
Anthemiphylliidae Caulastrea tumida 5Unspecified 33 261 145Favites abdita 2Moseleya latistellata 18 7
Caryophylliidae Unspecified 16 719 389Dendrophylliidae Unspecified 51 91 93
Duncanopsammia axifuga 226 192Euphyllidae Catalaphylliajardinei 15 88 222
Euphyllia ancora 104 209Euphyllia glabrescens 42 250 283
Fungiidae Unspecified 18 71 72Polyphyllia talpina 17 21
Merulinidae Unspecified 2 5 2Mussidae Unspecified 28 169 57
Scolymia australis 2Oculinidae Unspecified 7 11Pectiniidae Pectinia lactuca 3Pocilloporidae Pocillopora damicornis 42
Pocillopora eydouxi 2Unspecified 7 3 5
Poritidae Goniopora columna 8 88 1Porites attenuata 1Unspecified 52 312 128
Trachyphylliidae Trachyphyllia geoffroyi 30 243Unspecified 45 28
Hard coral Unspecified 103 1230 1422TOTAL 379 3836 3832
Standard MAF licenses do not include an endorsement to collect hard coral, although the taking of hard corals by MAF licensees currently occurs via an endorsement on their CFL. The MAF Management Plan is currently under review. It is anticipated that the new Plan will simplify licence arrangements by amalgamating current licenses and will specify quotas for hard coral.
A stakeholder workshop will be held during 2004/05 to address the above issues in the MAF. Experts in hard coral taxonomy will be invited to the workshop.
5.1.1.5 Soft Coral
Rationale for Inclusion:
Licence endorsements can be issued to MAF licensees to collect soft coral. The fishery collects small quantities of various species of soft coral (Alcyonacea).

ESD Report Series No. 8 – Marine Aquarium Fish Managed Fishery
41
ERa Risk Rating: Impact on breeding stocks (C0 L6 NEGLIGIBLE)
Until 2001, no soft coral collections were reported by the MAF. From 2001 to 2003, the catch was reported at family level (2 families) or as ‘unspecified soft coral’ (Table 5.11). Collections of soft coral have variously been reported as kilograms or pieces.
Table 5.11 Annual MAF catch (kg) of soft coral by block, 2001 to 2003.
For location of blocks, see Figure 3.2.
Annual catch (kg)Family Block 2001 2002 2003Alcyoniidae 2016 28 693 513
2017 - - 20 2114 4 34 15 2214 7 48 74 2413 - 290 -
Nephtheidae 2016 - - 11
Soft coral, unspecified 2016 - - 253 2114 53 12 10 2214 20 19 22
2413 6 - -TOTAL 118 1096 918
The total area within which soft corals are collected by the MAF is very small relative to the likely total distribution of each species (Table 5.11). The impact of the fishery on individual soft coral species is likely to be negligible because the catch of each species is extremely low, relative to the likely abundance of each species across its entire distribution. Also, the amount of soft coral collected is likely to be small compared with natural losses due to storm damage and predation. No other commercial or recreational fishery in Western Australia is permitted to retain soft coral. Therefore, the fishery is ‘likely’ to have a ‘negligible’ impact on populations of soft corals. This results in a risk rating of NEGLIGIBLE.
Standard MAF licenses do not include an endorsement to collect soft coral, although the taking of soft corals by MAF licensees currently occurs via an endorsement of their CFL. The MAF Management Plan is currently under review. It is anticipated that the new Plan will simplify licence arrangements by amalgamating current licenses and will specify quotas for soft coral.
There is uncertainty about the correct identification of soft coral species in the reported catch. There are also uncertainties about the quantity of soft coral collected because of inconsistencies in reported catch units (kg versus pieces). Due to the relatively low quantities of retained soft corals, these uncertainties are unlikely to represent a risk to the sustainability of any species. However, it is recognised that the standard of reporting by the MAF could be improved.
Catches by the MAF are currently reported by 60 x 60 nm ‘blocks’. The Department of Fisheries is currently negotiating with licensees to develop a finer spatial scale for reporting.
A stakeholder workshop will be held during 2004/05 to address the above issues in the MAF. Experts in soft coral taxonomy will be invited to the workshop.

42
ESD Report Series No. 8 – Marine Aquarium Fish Managed Fishery
5.1.1.6 Hermit Crabs
Rationale for Inclusion:
Three MAF licensees are currently allowed to collect hermit crabs. The fishery collects terrestrial hermit crabs (Coenobita variabilis) and small numbers of shallow-water hermit crabs.
ERa Risk Rating: Impact on breeding stocks (C1 L3 LOW)
Collections of both C. variabilis and shallow-water hermit crabs by the MAF mainly occur in a single area (block 2016) located between Onslow and Port Hedland (Table 5.12). In 2002 and 2003, catches (number of crabs) of C. variabilis were 70,055 and 62,935, respectively, and catches of shallow-water hermit crabs were 14,018 and 32,076, respectively.
Two fishers outside the MAF also have permits for taking C. variabilis. Only 1 of these permits has been active in recent years. Collections by this permit holder usually occur in different areas (around Broome) to those of the MAF (Table 5.12).
In previous years, catches of both C. variabilis and shallow-water hermit crabs were lower. In 1999, 2000 and 2001, the total catches (number of crabs) of C. variabilis were 13415, 11633 and 24070, respectively. The total catches of shallow-water hermit crabs were 311, 1088 and 0, respectively.
Collections of shallow-water hermit crabs are not reported by species and the catch may include numerous species. Most shallow-water hermit crabs in Australia belong to the family Diogenidae, which contains a large number of species (Jones and Morgan 1994).
Table 5.12 Annual MAF catch (number of individuals) of hermit crabs by block, 2002 and 2003.
For location of blocks, see Figure 3.2.
Annual catch (number of crabs)MAF Non-MAF
Taxa Block 2002 2003 2002 2003Coenobita variabilis 1722 - - 59800 32900
1821 - - - 14900 1822 1200 - - -
1921 - - 8000 -2016 67855 62935 - -
2115 1000 - - -TOTAL 70055 62935 67800 47800Hermit crabs, other 2016 12047 28103 - - 2214 1891 3273 - - 3115 - 400 - - 2017 - 300 - - 2114 80 - - -TOTAL 14018 32076 0 0
Coenobita variabilis is distributed across northern Australia, from Exmouth Gulf to northern Queensland (Jones and Morgan 1994). Individuals occur in the intertidal zone and up to 100 m from the shoreline. They are common in mangroves, but also occur in sandy and rocky areas. Adults live out of water, but females require water in which to lay their eggs. Eggs and larvae are planktonic. Juveniles recruit to land. Maximum carapace length is 40 mm.

ESD Report Series No. 8 – Marine Aquarium Fish Managed Fishery
43
Given that the vast majority of the catch by the MAF is taken from a single block (2016), there is a small potential for localised depletion. Whilst the catches for C. variabilis are higher than for shallow-water hermit crabs, the risks to these stocks are very low given the often very high densities of this group that can be found within suitable intertidal areas.
Total catches of shallow-water crabs may include several species, and so catches of individual shallow-water crab species are likely to be considerably lower than catches of C. variabilis.
The total area in which C. variabilis is collected by the MAF and the non-MAF permit holder is small relative to the total distribution of the species. Hence the catch of this species is low, relative to the likely abundance of the species across its entire distribution. Also, recruitment of planktonic larvae, which can be dispersed long distances, is likely to ensure replenishment of fished populations and minimise the risk of localised extinction. The supply of new recruits can occur from unfished populations throughout northern WA.
Similarly, the impact of the fishery on the breeding stocks of shallow-water hermit crabs is likely to be low because the catch of each species is small, relative to the likely abundance of each species across its entire distribution. Also, recruitment of planktonic larvae is likely to ensure replenishment of fished populations and minimise the risk of localised depletion.
Therefore, it is ‘unlikely’ that even a ‘minor’ impact on populations of hermit crabs will result from the MAF. This results in a risk rating of LOW.
5.1.1.7 Other Invertebrates
Rationale for Inclusion:
The fishery by way of an endorsement on their commercial fishing licence catches small quantities of numerous invertebrate species.
ERa Risk Rating: Impact on breeding stocks (C0 L6 NEGLIGIBLE)
From 2001 to 2003, 24 taxa of ‘other invertebrates’ (excluding hard and soft corals and hermit crabs) were collected by the MAF (Table 5.13). This catch was distributed across 11 MAF blocks (Table 5.14). The composition of the catch was variable across years. In 2002 and 2003, anemones (various species) were the most abundant component of the catch. The total area in which ‘other invertebrates’ are collected by the MAF is small relative to the total distribution of each species. Hence, catches are low relative to the likely abundance of each species across its entire distribution.
The life history characteristics of most invertebrate species (high rate of natural mortality, rapid growth, early age at maturity, medium-high fecundity) result in a low vulnerability to overfishing. Also, a pelagic larval phase allows each species to disperse widely and would facilitate annual recruitment to each area of the fishery, irrespective of local population abundance. This minimises the risk of localised depletions.
Therefore, the impact of the MAF on populations of ‘other invertebrates’ is ‘likely’ to be ‘negligible’. This results in a risk rating of NEGLIGIBLE.

44
ESD Report Series No. 8 – Marine Aquarium Fish Managed Fishery
Table 5.13 Annual MAF catches (number of individuals) of ‘other invertebrates’, 2001 to 2003.
Family Species Common Name 2001 2002 2003Crustacea Unspecified Unspecified 3150
Unspecified Shrimp 128 69 91Palinuridae Panulirus ornatus Ornate rock lobster 1 1Porcellanidae Unspecified Porcelain crabs 9 5Stenopodidae Stenopus hispidus Banded coral shrimp 156 149 168Order Echinoidea Unspecified Sea urchin 6 227 644Order Asteroidea Unspecified Starfish 101 425 197Comasteridae Unspecified Basketstar-Crinoids 51Holothuriidae Holothuriaedulis Burnt sausage cucumber 6 183
Holothurialeucospilota Black cucumber 40Unspecified Sea cucumber 25 170
Nudibranchia Unspecified Nudibranchs 24 31Octopodidae Unspecified Octopus 15 32Serpulidae Unspecified Tubeworms 8Actinodiscidae Discosoma spp. Coral-like anemone 383Zoanthidae Unspecified Zoanthid anemones 86Order Actiniaria Unspecified Anemone 782 2967 2585Stichodactylidae Entacmea quadricolor Anemone 145 436 2901
Stichodactylidae Carpet anemones 16 86Order Corallimorpharia Unspecified Coral-like anemones 2Order Pennatulacea Unspecified Seapens 3 6Protoptilidae Distichoptilum gracile Seapen 6Virgulariidae Unspecified Seapens 6Order Scyphozoa Unspecified Jellyfish 1
Table 5.14 Annual MAF catches (number of individuals) of ‘other invertebrates’ by block, 2001 to 2003.
Block 9600 = Cockburn Sound, 9601 = Geographe Bay. For location of other blocks, see Figure 3.2.
Block 2001 2002 20032016 85 1773 47082017 3150 30 6592114 555 417 11932214 145 283 5492313 39 2402413 299 1240 383114 213115 175 648 2353215 109600 9 4 109601 9
TOTAL 4497 4395 7632
Standard MAF licenses do not include an endorsement to collect invertebrates, although the taking of invertebrates by MAF licensees currently occurs by way of an endorsement on their commercial fishing licence. The MAF Management Plan is currently under review. It is anticipated that the new Plan will specify quotas for invertebrates.

ESD Report Series No. 8 – Marine Aquarium Fish Managed Fishery
45
There is considerable uncertainty about the correct identification of ‘other invertebrate’ species in the reported catch. Due to the low catch levels, these uncertainties are unlikely to represent a risk to the sustainability of any species. However, it is recognised that the standard of reporting by the MAF could be improved.
Catches by the MAF are currently reported by 60 x 60 nm ‘blocks’. The Department of Fisheries is currently negotiating with licensees to develop a finer spatial scale for reporting. A stakeholder workshop will be held during 2004/05 to address the above issues in the MAF. Experts in invertebrate taxonomy will be invited to the workshop.
5.1.1.8 Living Rock
Rationale for Inclusion:
The fishery collects small quantities of ‘live rock’. Three endorsements to take 500 kg each currently exist (as of May 2004) for MAF licensees to collect ‘live rock’.
ERa Risk Rating: Impact on environment (C0 L6 NEGLIGIBLE)
‘Live rock’ is defined as rock and dead coral with live marine organisms growing on and/or in it. It is collected as substrate for aquariums. From 2001 to 2003, collections of ‘live rock’ ranged between 0 and 2089 kg per block. Collections were made in 8 blocks.
Table 5.15 Annual MAF collections (kg) of ‘live rock’ by block.
For locations of blocks, see Figure 3.2.
Block 2001 2002 20032015 782016 63 1032 20892017 560 202018 12114 32413 325 2403115 70 328 4213322 10
TOTAL 1110 1600 2530
The Department of Fisheries proposes to implement a quota that will allow each license some units of live rock per year. The impact of this collection level by the MAF on populations of rock-dwelling organisms or other associated organisms is considered to be NEGLIGIBLE. Impacts on the general environment would probably be undetectable.
5.1.1.9 Living Sand
Rationale for Inclusion:
The fishery collects very small quantities of ‘live sand’.
ERa Risk Rating: Impact on environment (C0 L6 NEGLIGIBLE)

46
ESD Report Series No. 8 – Marine Aquarium Fish Managed Fishery
‘Live sand’ is defined as marine sand containing live organisms. It is collected as substrate for aquariums. In 2002 and 2003, 100 kg and 50 kg, respectively, of live sand were collected by the MAF. A single licensee in block 2413 made collections.
The Department of Fisheries proposes to implement a quota that will allow each license some units of live sand per year. The impact of this collection level by the MAF on populations of sand-dwelling organisms or other associated organisms is considered to be NEGLIGIBLE. Impacts on the general environment would probably be undetectable.
5.2 NON RETAINED SPECIES There are no non-retained species for this fishery.
5.3 gENERAL ENVIRONMENT COMPONENT TREE FOR THE gENERAL ENVIRONMENT
Translocation
Discarding provisioning (not in this fishery)
Additional movement of biological material
Removal of damage to organisms
Fishing (eg trophic levels)
Benethic Biota (habitat removal)
Anchoring
Damage to habitat
Other
Air quality (Fuel usage/Exhaust)
Water quality (Oil discharge)
Impacts on the biological community (eg trophic structure)
General Environment
A blue box indicates that the issue was considered a low risk, with no specific management required, and only a justification is presented.
5.3.1 Removal of/Damage to Organisms
5.3.1.1 Trophic Interactions
Rationale for Inclusion:
The assessment of potential indirect ecosystem impacts that could result from the removal of target species by a fishery should always be assessed. Finfish and small invertebrates comprise major components of the MAF catch.
Most of the finfish species in the MAF catch are small-sized (<10 cm in length). Many are planktivorous. Many are prey to piscivorous birds and larger fish. Most of the invertebrates in the MAF catch are also small-sized. Most consume plankton or detritus. There is no evidence that any finfish or invertebrate species play a ‘keystone’ role in the ecosystem. Therefore, the majority of the species within these 2

ESD Report Series No. 8 – Marine Aquarium Fish Managed Fishery
47
groups are similar in their trophic function and it is appropriate to consider the impact of total finfish and total invertebrate removals by the fishery.
ERa Risk Rating: Impact on the environment (C0 L6 NEGLIGIBLE)
From 2000 and 2003, total finfish catches averaged between 0 and 1144 kg per block per year (assuming an average body weight of 20 g per fish). It is not possible to estimate the total weight of invertebrates taken by the fishery each year. However, the invertebrates that are collected by the fishery are all small-sized and so the total numbers of individuals probably amount to a relatively small total biomass per region. This level of biomass removal by the fishery is likely to be negligible compared with natural rates of mortality (especially due to predation) that act on populations of small fish and invertebrates in each region. Impacts to trophic dynamics in each region would probably be undetectable.
Therefore, it is ‘likely’ that the trophic impact of removals by the fishery is ‘negligible’. This results in a risk rating of NEGLIGIBLE.
Although the trophic impact of total removals by this fishery was rated as NEGLIGIBLE, the Department of Fisheries recognises that an assessment of trophic impacts by fisheries at a regional level, rather than at the individual fishery level, would be beneficial. Consequently, the Department will investigate the development of research to identify any detectable regional changes in the structure of coastal fish communities over the last 40 years.
5.3.1.2 Benthic Biota (non-target elements)
Rationale for Inclusion:
Apart from the impact on the habitat associated with the collection of the specific target species (see above) the fishery may have some impact on the surrounding benthic habitats.
ERa Risk Rating: Impact on the environment (C0 L6 NEGLIGIBLE)
There is likely to very insignificant impacts on the surrounding habitats from the activities of the MAF. This may occur from the removal of non-target benthos accidentally whilst collecting specimens. The scale of this is likely to be much lower than for the target groups and occur across a wider range of species and hence will result in negligible impact.
5.3.1.3 anchoring
Rationale for Inclusion:
Small vessels, which use anchors, are used in the fishery.
ERa Risk Rating: Impact on general environment (C0 L6 NEGLIGIBLE)
There are 13 licensees operating in the fishery, all except one use relatively small (<12 m) licensed fishing vessels. The fishery extends the entire length of the Western Australian coastline and some collection activities (e.g. collection of hermit crabs and wading in shallow water) are not undertaken from a vessel.
Therefore, the impact of anchoring by the fishery over this area is ‘likely’ to be ‘negligible’. This results in a risk rating of NEGLIGIBLE.

48
ESD Report Series No. 8 – Marine Aquarium Fish Managed Fishery
5.3.2 addition/Movement of Biological Material
5.3.2.1 Translocation by Vessel Hulls Rationale for Inclusion:
Vessels used in the fishery travel between regions and could potentially be a vector for exotic species and diseases.
ERa Risk Rating: Impact on the environment (C4 L1 LOW)
Thirteen licensees operate in the fishery, which extends along the entire length of the Western Australian coastline. The hulls of vessels moving between regions could provide an opportunity for translocation of organisms. However, licensees typically operate within a small region and do not travel between regions. Also, the Leeuwin Current flows along the length of the WA coastline, transporting biological material and resulting in a high level of connectivity between regions. Therefore, vessels in the fishery are unlikely to translocate organisms beyond the range of dispersal that would occur through natural processes. Vessels operating in the fishery do not use ballast water. Therefore, although the impact of translocation of exotic pests or diseases could be ‘major’, the likelihood of this event is ‘remote’. This results in a risk rating of LOW.
5.3.3 Other Environmental Impacts
5.3.3.1 Exhaust Fumes Rationale for Inclusion:
Vessels in the fishery produce exhaust fumes.
ERa Risk Rating: Impact on general environment (C0 L6 NEGLIGIBLE)
There are 13 licensees operating in the fishery, all except one use relatively small (<12 m) licensed fishing vessels. The fishery extends the entire length of the Western Australian coastline and some collection activities (e.g. collection of hermit crab) are not undertaken from a vessel.
Therefore, the impact of exhaust fumes released by the fishery over this area is ‘likely’ to be ‘negligible’. This results in a risk rating of NEGLIGIBLE.
5.3.3.2 Oil Discharge Rationale for Inclusion:
The fishery uses small vessels, which use oil.
ERa Risk Rating: Impact on general environment (C0 L6 NEGLIGIBLE)
There is a risk of oil spills from vessels used in the fishery. However, there are only 13 licensees operating in the fishery, all except one use relatively small (<12 m) licensed fishing vessels. The fishery extends the entire length of the Western Australian coastline and some collection activities (e.g. collection of hermit crab) are not undertaken from a vessel.
Therefore, the risk to the environment of oil being released by a small number of small vessels over this large area is ‘likely’ to be ‘negligible’. This results in a risk rating of NEGLIGIBLE.

ESD Report Series No. 8 – Marine Aquarium Fish Managed Fishery
49
5.4 gOVERNANCE COMPONENT TREE FOR THE gOVERNANCE OF THE MARINE AQuARIuM MANAgED FISHERY
Government
Management
Management Effectiveness (Outcomes)
Assessment & Reviews Fisheries Law
Access rights
OCS arrangements
Licence Registry
code of conduct participation peak bodies reporting skilled people
Transfer Efficiency
Integrity
Arrangements
Compliance
Information
Resources
Allocation
Proactive Management
Consultation Reporting Legal framework
Department of Fisheries
Industry
Governance
NB - Generic components have been removed from the tree and only the blue boxes will be reported in this ESD report.
5.4.1 Department of fisheries – Management
5.4.1.1 Management Effectiveness (Outcomes)
Rationale for Inclusion:
The effectiveness of management arrangements in the MAF are ultimately measured by assessing the outcomes of various strategies employed to manage this fishery. Effort has been controlled through input controls since the inception of the management plan in 1995. This plan restricts the number of licence holders who can commercially fish for aquarium fish and imposes gear restrictions.
The expected outcome in this fishery is that licensees are able to comfortably catch their targeted species. Any reduction in the ability of the licensees to target the MAF species that cannot be readily explained (e.g. natural recruitment variability, negative market forces) may reflect a reduction in management effectiveness and raise concerns about the ongoing sustainability of the commercial fishery. Due to the high number of species taken in this fishery, minimal biological and ecological research has been carried out on the MAF. The Department of Fisheries Research Division has many years of catch and effort data for the fishery.
Operational Objective
The effort used to comfortably catch the targeted species is maintained within an acceptable range as predicted from historical data (except for the Syngnathid species, which has a blanket restriction of only 750 specimens that are allowed to be harvested in any given year).

50
ESD Report Series No. 8 – Marine Aquarium Fish Managed Fishery
Justification:
If effective management arrangements are operational in the fishery, then the level of effort used to collectthetargetedspeciesshouldbemaintained.Intheeventcommercialfishermenwereunabletocatchasignificantproportionofthetargetedspecies,orthistookasubstantiallydifferentperiodoftimethannormal,thenthereason/swouldneedtobeidentifiedandexplained.Forexample,itmaybethatunfavourableweatherconditionsreducedthenumberofdaysabletobefishedandhencetheabilityofthelicenseestogetareasonableamountofthetargetedspecieswouldhavetobejustified–orthereasonmaystemfromchangestothemarketpriceandhencetheincentivetofish.
Indicator
The level of effort to collect the targeted species of MAF.
Performance Measure
The number of days fished in relation to catch.
It has been suggested that the number of hours searched (as opposed to the number of days fished) would give a better representation of the effort and consequently the performance/efficiency of the licensees.
Justification:
ThepossibilityofestablishinganewwayofmeasuringeffortthroughhourssearchedforfishratherthandaysfishingisonewhichtheDepartmentofFisheriesisassessing.Itisconsideredthatthisgivesabetterrepresentationofeffortbecausethenumberofhoursittakestofindthefishthelicenseesaretargeting inoneday isamuchbetter representation than justgiving the fact that theywent fishingfor one day. It should also be noted that the MAF licencees often target species that are commercially valuable on an opportunistic basis rather than individual species.
Data Requirements for Indicator
The following data are required for this indicator:
Data Requirement Data Availability Historical catch levels Yes – records available and accessible Level of fishing effort Yes – available as number of fisher days Commercial catch Yes – available through CAESS data Impacts from other resource users Yes (for some other interactive fisheries) - Information
is available through CAESS data (see Appendix 7 for information regarding trawl activity on Syngnathid family in the Shark Bay Area). There are no real estimates of recreational catch but it is considered that it would be minimal
Environmental impacts No – there is no real understanding of impact of environmental conditions on stock abundance
Evaluation
Commercial catch
Reported catches from MAF licensees (from the State of the Fisheries Report)
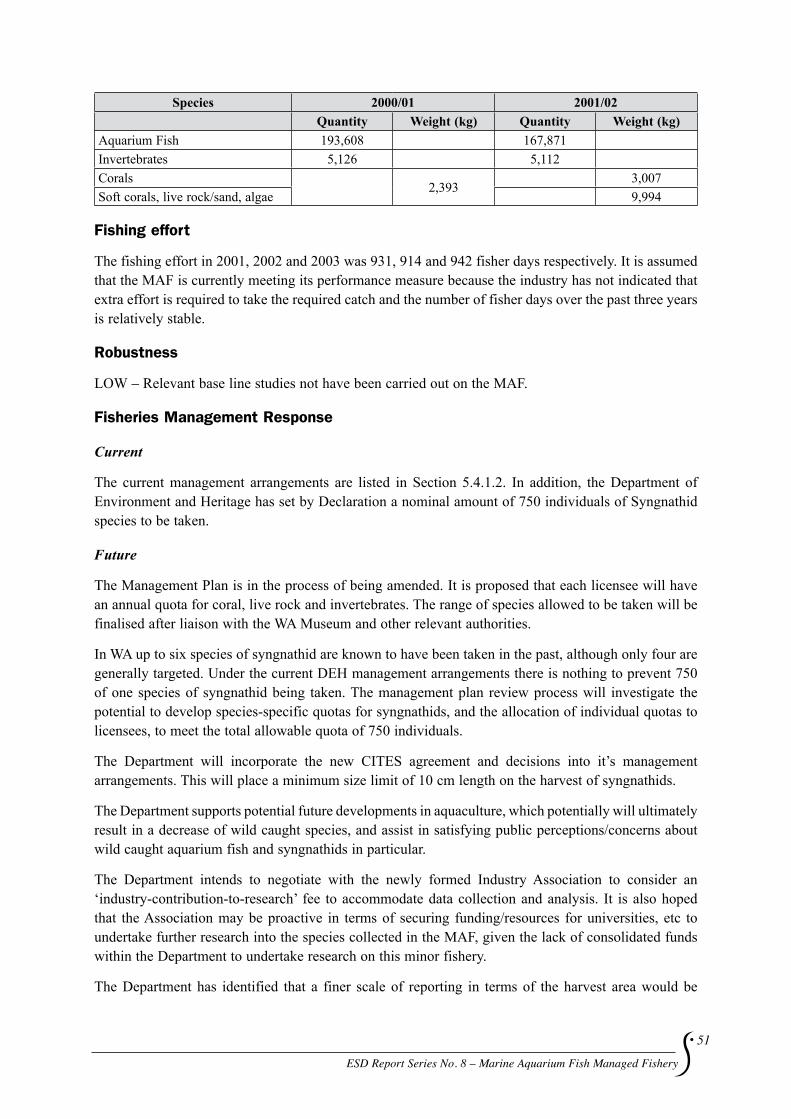
ESD Report Series No. 8 – Marine Aquarium Fish Managed Fishery
51
Species 2000/01 2001/02 Quantity Weight (kg) Quantity Weight (kg)
Aquarium Fish 193,608 167,871 Invertebrates 5,126 5,112 Corals
2,393 3,007
Soft corals, live rock/sand, algae 9,994
fishing effort
The fishing effort in 2001, 2002 and 2003 was 931, 914 and 942 fisher days respectively. It is assumed that the MAF is currently meeting its performance measure because the industry has not indicated that extra effort is required to take the required catch and the number of fisher days over the past three years is relatively stable.
Robustness
LOW – Relevant base line studies not have been carried out on the MAF.
fisheries Management Response
Current
The current management arrangements are listed in Section 5.4.1.2. In addition, the Department of Environment and Heritage has set by Declaration a nominal amount of 750 individuals of Syngnathid species to be taken.
Future
The Management Plan is in the process of being amended. It is proposed that each licensee will have an annual quota for coral, live rock and invertebrates. The range of species allowed to be taken will be finalised after liaison with the WA Museum and other relevant authorities.
In WA up to six species of syngnathid are known to have been taken in the past, although only four are generally targeted. Under the current DEH management arrangements there is nothing to prevent 750 of one species of syngnathid being taken. The management plan review process will investigate the potential to develop species-specific quotas for syngnathids, and the allocation of individual quotas to licensees, to meet the total allowable quota of 750 individuals.
The Department will incorporate the new CITES agreement and decisions into it’s management arrangements. This will place a minimum size limit of 10 cm length on the harvest of syngnathids.
The Department supports potential future developments in aquaculture, which potentially will ultimately result in a decrease of wild caught species, and assist in satisfying public perceptions/concerns about wild caught aquarium fish and syngnathids in particular.
The Department intends to negotiate with the newly formed Industry Association to consider an ‘industry-contribution-to-research’ fee to accommodate data collection and analysis. It is also hoped that the Association may be proactive in terms of securing funding/resources for universities, etc to undertake further research into the species collected in the MAF, given the lack of consolidated funds within the Department to undertake research on this minor fishery.
The Department has identified that a finer scale of reporting in terms of the harvest area would be
52
ESD Report Series No. 8 – Marine Aquarium Fish Managed Fishery
beneficial in collecting more information on the distribution of snygnathids and the primary finfish species targeted within the MAF. The current catch and effort return forms provide for a 60 x 60 nautical mile (nm) grid system which does not provide a suitable level of detail for smaller scale commercial operations such as the MAF. Consequently, the Department is in the process of negotiating with the Association to impose a smaller grid system of possibly 10 nm.
At a recent internal Risk Assessment Workshop, several compliance ‘loopholes’ in the existing management arrangements were identified. Once feasible solutions are finalised, they will be incorporated into the Management Plan to improve enforcement rigour within the Fishery.
Actions if Performance Limit is Exceeded: If the effort required to catch the target species were outside the historical values then a review of the causes would be undertaken. This review would examine why the catch levels were not met. If this variation is not explained by changes in the market conditions or environmental variations or a peculiarity of industry dynamics and behaviour, then strategies that offer further protection for those species will be considered. These strategies include reductions in total effort expended in the fishery through a reduction in the number of days fished, area or seasonal closures, species restrictions and quota reductions for coral and live rock.
For the Syngnathid family, harvesting of greater than 750 specimens requires the Department to prepare a report to DEH indicating why the take was exceeded. In 2002, 833 syngnathids were taken and as a result a report was submitted to DEH (Appendix 5).
Comments and actions
A change to the way in which effort is reported, from ‘number of fisher days’ to ‘numbers of hours searched’, as mentioned above, should provide a better representation of effort and monitor performance within the fishery. Areas within the fishery that have experienced a decreased abundance of targeted species due to fishing effort may then be more easily identified.
External Driver Checklist
• Divingconditionsvarybetweenyearswhichmayaffectcatchratesandhencethelevelofeffortrequired.
• Thedirectimpactofrecreationalfishermenandotherfishingactivities(forexample,trawlingandother line fish fishing) is unknown.
• Marketcapacity/demandmayaffectthetakeofMAFtargetedspeciesanditisforecastthatsomeofthe popular marine aquarium species will be supplied by the aquaculture industry. This may reduce the level of effort or shift it to other species.
5.4.1.2 Management arrangements
Rationale for Inclusion:
In Western Australia, a number of instruments are used to articulate the management arrangements for fisheries. The FRMA has elements that affect all fisheries. The FRMA provides for the creation of Management Plans, Orders (Notices), Regulations, Ministerial Policy Guidelines (MPG) and Policy Statements.
The Act sets out the objects for the sustainable management of fish resources in Western Australia and provides the framework for developing and implementing management plans for each of the State’s fisheries. The Marine Aquarium Fish Management Plan 1995 is effectively a set of rules for the

ESD Report Series No. 8 – Marine Aquarium Fish Managed Fishery
53
fishery and includes, amongst other things, clauses concerning gear restrictions and license restrictions. Management arrangements for the commercial take of aquarium fish and other species (ie. coral, live rock, invertebrates and marine plants) are provided for through both a Managed Fishery Licence and a Commercial Fishing Licence.
The Marine Aquarium Fish Managed Fishery has recently established a formal Industry Association called the Aquarium Specimen Collectors Association of W.A. Inc. Current membership consists of 9 of the 13 licensees and a further 2 have indicated that they will be joining shortly. The formation of this Association indicates the level of long-term commitment to the Industry that is exhibited by the licensees. The terms of reference for the Association (as outlined in their Constitution) are:
• TouniteallmembersforthecommonbenefitoftheFishery
• TopresenttheviewsofmemberstocommunicatewithGovernment
• Topromoteeffortswithintheindustryforthesolvingofcommonproblems
• Toactasadviserto,orintermediarybetween,GovernmentandIndustry
• Toappointornominaterepresentativestovariousbodies.
One of the Association’s key projects is to revise and formalise a Code of Practice (see Appendix 6) for the licensees. This newly formed association should create a better overall communication base and provide a ‘professional’ lobby group for the industry.
Operational Objective
To have an effective and understandable plan of management for this fishery.
The Department, in consultation with the recently formed Industry Association and other stakeholders, will periodically review The Marine Aquarium Fish Management Plan 1995, related legislation and regulations to ensure the management framework remains relevant and aligned with the management objectives.
Justification:
Management arrangements ultimately enable the sustainable exploitation of a natural resource where the potential to harvest the resource could exceed the ability of the resource to replenish itself. The development of rules can restrict the potential to harvest (effort) to an appropriate level, and management arrangements can define processes within which access to the resource can be allocated to competing user groups (including natural ecosystems).
Indicator
The extent to which the FRMA, FRMR, Management Plans, and other management arrangements allow for the timely setting of appropriate effort levels and resource allocation in the fishery.
The extent to which the Marine Aquarium Fish Management Plan 1995 and supporting documentation addresses each of the issues and has appropriate objectives, indicators and performance measures along with planned management responses.
Performance Measure
The Management Plan should be 100% effective.

54
ESD Report Series No. 8 – Marine Aquarium Fish Managed Fishery
Evaluation
Each year an Annual General Meeting is organised by the Department to allow the MAF industry and Department to discuss any issues. As a result, a review is done on an annual basis. In addition, any major problems with management arrangements that arise outside of this timeframe can be raised by anyone (industry or the Department) at any time and they will be addressed.
The performance of the management arrangements is evaluated on two levels – the micro level (i.e., the relevance of individual clauses and the role they play) and the macro level (i.e., the relevance of The Marine Aquarium Fish Management Plan 1995 as a whole and the role it plays).
The current performance is assessed against each of the following key principles, under the collective management arrangements:
1. An explicit description of the management unit – the management unit is explicitly described in the “Declaration of the MAF ” section of The Marine Aquarium Fish Management Plan 1995.
2. The issues addressed by the Marine Aquarium Fish Management Plan 1995 – the issues that need to be addressed by the Plan have been examined thoroughly and are documented within the ESD component trees and their reports.
3. Description of the stock/s, their habitat/s and the fishing activities – the MAF and fishing activities are described in section 2.
4. Clear operational (measurable) objectives and their associated performance measures and indicators – these are located in section 5 (component reports) for each of the major issues.
5. Clearly defined rules, including what actions are to be taken if performance measures are triggered – for each of these major issues, the management actions that will be taken if performance limits are exceeded are now articulated in section 5 (Component Reports).
6. Economic and social characteristics of the groups involved in the Fishery – a brief description of the economic and social characteristics is located in section 2.
7. Management and regulatory details for the implementation of the actual management arrangements – the regulations relating to the MAF are located in both the Marine Aquarium Fish Management Plan 1995 and the FRMR and orders.
8. The reporting and assessment arrangements – these arrangements are documented in Section 5.4.4 and include annual reporting against current agreed performance limits and targets and a five yearly review of these arrangements and assumptions.
9. How and when reviews of the management arrangements will occur (including consultation mechanisms) – the FRMA clearly sets out how the process for the review of any Management Plan must occur. Changes resulting from a Plan review were implemented in 2001.
10. A synopsis of how each of the ESD issues are being addressed – a synopsis of ESD issues has been compiled within the Overview Table of this report.
Robustness High
The management arrangements for the MAF are comprehensive and are performing relatively well. The fact that the management arrangements are contained within enforceable legislation provides a high degree of stability with respect to how the MAF is managed. This said, the processes for achieving the changes to the management arrangements are well understood by the majority of stakeholders and the system is flexible enough so that the management process can respond to external stimuli. It has been identified that a few loopholes may exist and these need to be addressed by the Department of Fisheries.
ESD Report Series No. 8 – Marine Aquarium Fish Managed Fishery
55
fisheries Management Response
Management has successfully administered the Marine Aquarium Fish Management Plan 1995 and related legislation to achieve and pursue the stated objectives.
Comments and actions
The MAF is managed in a dynamic and consultative manner but fishermen are often resistant to change. While most fishermen have a very high level of confidence in the Department’s research activities, members of industry can sometimes be sceptical of research findings. Individual fishermen’s views can understandably be greatly influenced by their own experiences and observations while fishing, and these sometimes give them a contrary view of the state of the MAF, particularly when they are aware that minimal research has been conducted on the MAF. Nonetheless, there is generally a very good relationship between fishermen and the Departmental research scientists and most will accept the advice of the researchers. It is anticipated that the newly formed Industry Association will be proactive in securing funding to undertake research into the main species collected.
External Driver Check List
Unquantified environmental factors (e.g. climatic changes, ocean currents) may impact on the size of the exploitable biomass despite management arrangements. Similarly, the direct impact of recreational fishermen and other fishing activities (e.g., trawling and line fishing) are also unknown. Further research is required to provide a reasonably accurate estimate of stock biomass so that appropriate management arrangements can be developed to respond to any potential future changes.
The impact from increased general human interaction (e.g., boating and diving activities) may also impact on MAF targeted species but is unquantified at this stage.
5.4.1.3 Compliance
Rationale for Inclusion:
Effective compliance is vital to achieve the management objectives of any fishery. The Department has very few resources available for enforcement and compliance monitoring programs in the MAF.
Operational Objective
To have sufficiently high levels of compliance with the FRMA, FRMR, the Marine Aquarium Fish Management Plan 1995, licence conditions (endorsements) and notices whilst ensuring the sustainability of the target stock.
Justification:
Theactivitiesof theparticipants in theMAFneedtobesufficientlyconsistentwith themanagementframeworkand legislation tomake it likely that theexpectedoutcomesandobjectivesof the fisherywillbeachieved.
Indicators
The level of compliance with the legislation, including the estimated level of boundary infringements. The level of compliance with any conditions of a licence.
The degree of understanding and acceptance of the rules governing the operation of the MAF by the licensees and the broader fishing community.

56
ESD Report Series No. 8 – Marine Aquarium Fish Managed Fishery
Performance Measures
These are currently under development by the Department (and in consultation with Industry) following completion of a compliance risk assessment workshop. Performance measures may include that no fishing occurs in closed areas (such as marine parks) and that quota are not exceeded.
Data Collection Requirements and Processes
• Randominspectionsofboatsandcatchonlanding.
• Numberandtypeofbreachesandenforcementresponses(forexample,warningversusprosecution).
• Monitoringofclosedareas.
• Ongoingcollectionofdataonillegalactivities.
• Comparativedataontherelativeeffectivenessofcertaincompliancetechniques.
Evaluation
A risk assessment workshop was conducted in March 2003 to identify problems associated with compliance within the MAF. It concluded that despite Fisheries Officers encountering or being informed of numerous situations where license holders have been in breach of the management plan, infringements and prosecutions are difficult to achieve given deficiencies in the provisions of the Management Plan. Further workshops need to be held and the issues addressed are considered to be ongoing.
Robustness Medium
The catch and effort returns are mandatory each month and if they are not submitted the licensees are prosecuted, there is a high (generally 100%) compliance rate for catch and effort returns in the MAF.
There were only 3 inspections carried out on the MAF in 2002.
fisheries Management Response
Despite the relatively low levels of compliance work being done in the MAF, the Regional Services division of the Department continues to gather intelligence on suspected breaches within the fishery. Compliance staff will continue to conduct routine inspections.
Furthermore, compliance staff will continue to be employed in an educational role in addition to an enforcement role to raise the awareness of the legislative requirements relating to the MAF.
Comments and actions
The Department will continue to provide a compliance service, within budgetary and resourcing constraints, to the MAF. It is expected that continuing compliance risk assessments will enable the Department to better direct resources to further increase the effectiveness of the limited compliance activities. The Management Plan will be amended to tighten up on the identified compliance ‘loopholes’.
MAF fishing activities occur over a large part of the State and currently there is no requirement for fishers to notify the Department that they intend to fish. It has been suggested by the Department that MAF licensees should have to nominate the area/s that they intend to operate which will assist compliance officers with their inspections.

ESD Report Series No. 8 – Marine Aquarium Fish Managed Fishery
57
External Driver Checklist
• Changestotechnologythatmayfacilitateanincreaseinthelevelofnon-compliance.
• Changes to non-Fisheries legislation (National Competition Policy) may impact upon theDepartment’s ability to restrict activities in a way that assist compliance.
5.4.1.4 allocation among Users
Rationale for Inclusion:
Within the broad context of ESD, the issue of how fish resources can be best shared between competing users requires consideration. In WA, the Integrated Fisheries Management Review Committee was established to develop a strategy to integrate the management and sustainable use of fish resources. The report produced by the Committee in November 2002 proposes an alternative management framework and a set of guiding principles for allocating fish stocks to ensure optimal benefits are realised for the WA community.
The Department of Fisheries recognises that the integrated fisheries management approach applies to the MAF. In addition to the commercial fishery there is also likely to be a small recreational fishery for marine aquarium fish in W.A. There are also non-extractive interests (Department of Conservation and Land Management, dive operations, etc) in the resource and its related ecosystem, which also need to be considered within the management process.
Operational Objective
To ensure that allocation decisions aim to maximise the overall benefit to the Western Australian community from the use of fish stocks and take into account the economic, social, cultural and environmental factors.
Indicator
The level of resource sharing conflict between users and the level of participation of interested groups in any focused resource sharing process.
Performance Measure
To be determined as part of the integrated fisheries management process on broad scale resource sharing.
Data Requirements for Indicator
In order to ensure satisfactory allocation among user groups the following data is required: It should also be noted that cost is another major factor when considering various management options. For example, a TAC, which incorporated a recreational ‘allocation’ may satisfy sustainability issues, but would be prohibitively expensive in terms of the management/administration of the recreational ‘quota’.

58
ESD Report Series No. 8 – Marine Aquarium Fish Managed Fishery
Data Requirement Data Availability
Breeding stock abundance estimates Yes– available for some species.
Estimate of recreational catch NO- There has been no data related to the MAF
targeted species in relation to recreational fishers, however it is considered minimal
Estimate of projected growth of recreational Marine Aquarium fishing Unknown
Impacts from other commercial fishermen Some catch data from other commercial fishermen (e.g. pipe fishes recorded from trawl fisheries).
The Department is currently awaiting the outcomes of the integrated fisheries management review process in terms of processes that need to be used for resource allocation mechanisms among user groups and timeframes etc.
Evaluation
There is no method currently in use to evaluate recreational harvesting within the MAF.
Robustness Medium
At present, whilst there is no specific allocation made to the recreational sector their current level of catch is considered negligible and therefore sustainable. However, ‘catch and release’ of unwanted species may be having an additional impact on stocks. For the same reason, it is also important to gain some understanding of the quantities of MAF targeted species being caught but not retained by other commercial fishing activities (e.g., trawling in both State and Commonwealth vessels). It should also be noted that increased recreational catch would prompt a reassessment of current management arrangements (for both recreational and commercial sectors).
fisheries Management Response
It is expected that some further direction in relation to resource sharing will be given once the Minister finalises his determinations on the new framework following the review of the Integrated Fisheries Management Review Committee’s report.
External Driver Checklist
Resource sharing issues being raised with the Minister independently of the Integrated Fisheries Management Review Committee recommended process.
5.4.1.5 Consultation (Including Communication)
Rationale for Inclusion:
The FRMA has certain requirements with regard to consultation that must be undertaken in the course of managing fisheries. The management of the MAF is based around a robust consultation and communication process.
There are sections in the FRMA that relate to the development of a management plan (Section 64) and to the amendment of a management plan (Section 65). Given that the MAF already has a management plan, Section 65 is the most relevant.

ESD Report Series No. 8 – Marine Aquarium Fish Managed Fishery
59
This states that:
Section 65. Procedure before amending management plan
(1) A management plan must specify an advisory committee or advisory committees or a person or personswhoaretobeconsultedbeforetheplanisamendedorrevoked.
(2) Before amending or revoking a management plan the Minister must consult with the advisorycommittee or advisory committees or the person or persons specified for that purpose in the plan.
(3) Despite subsection (2), the Minister may amend a management plan without consulting inaccordancewiththatsubsectionif,intheMinistersopinion,theamendmentis–
(a) required urgently; or
(b) of a minor nature
(4)If–
(a) the Minister amends a management plan; and
(b)theamendmentismadewithoutconsultationbecauseitis,intheMinister’sopinion,requiredurgently,
theMinistermustconsultwiththeadvisorycommitteeoradvisorycommitteesorthepersonorpersonsspecified for that purpose in the plan as soon as practicable after the plan has been amended.
The particular group, which must be consulted for the MAF, is designated in the management plan as ‘all licensees’. There is no formal Ministerial Advisory Committee (MAC), however in addition to the licensees the Department also consults with the newly formed Association and the WA Fishing Industry Council. Meetings held with the MAF typically involve discussions about management, research and compliance issues in the fishery and provide a forum for Industry to raise concerns and/or ask questions of the Department concerning management arrangements.
Operational Objective
To administer a consultation process that is in accordance with the requirements of the FRMA and allows for the best possible advice from all relevant stakeholders to be provided to the decision maker (Minister/CEO) in a timely manner.
Indicators
The Minister (or the Department on his behalf) conforms to the consultation requirements of the FRMA and the level to which licensees consider that they are adequately and appropriately consulted.
Performance Measures
• Properconsultationprocedureshavebeenfollowedinanyamendmentofthemanagementplan.
• Industrymeetingsheldannually.
Data Requirements
The views of Industry collected from stakeholders at each annual meeting. When an amendment is proposed, documentation of the formal consultation procedures is needed.

60
ESD Report Series No. 8 – Marine Aquarium Fish Managed Fishery
Evaluation
Consultation on management of the MAF fishery is conducted in an open, accountable and inclusive environment where all sectors of the industry and the Department (i.e., management, compliance and research) collectively identify and discuss appropriate courses of action.
Decision makers are provided with advice based on this consultation and reasons are provided for decisions that vary from consultation-based advice.
Robustness High
The consultation process is extremely well understood with relatively high levels of participation from licensees.
fisheries Management Response
The Department is attempting to improve communication links with Industry in the MAF through regular correspondence and encouraging communication with a newly appointed dedicated half time fisheries management officer.
Comments and actions
The Department will continue to provide a commercial fisheries management officer who coordinates and further develops the consultation process for the MAF.
External Driver Check List
Despite the aforementioned consultation processes that are in place, disaffected parties may still seek to use political avenues to further their cause.
5.4.2 Department of fisheries- Reporting
5.4.2.1 assessments and Reviews
Rationale for Inclusion:
It is important that the outcomes of the fisheries management processes administered by the Department for the MAF are available for review by external parties. It is also important that the community is sufficiently informed on the status of the MAF, given that it is utilising a community resource.
The reports that are currently developed annually include: the State of the Fisheries Report, the Annual Report to the Auditor, the ESD report, and this ESD report to DEH. There is a longer-term plan to have the entire system of management audited by the WA Environmental Protection Authority (EPA).
Operational Objective
To continue to report on an annual basis to Parliament and the community on the status of all fisheries including the MAF and to prepare a framework for reporting on ESD requirements for all Western Australian fisheries.

ESD Report Series No. 8 – Marine Aquarium Fish Managed Fishery
61
Indicators
The extent to which external bodies with knowledge on the management of fisheries resources have access to relevant material and the level of acceptance within the community.
Performance Measure
General acceptance of the management system by the community.
Data Requirements
The majority of data required to generate reports is already collected in the course of pursuing resource management objectives. The Department conducts an annual survey of the community with respect to the community’s opinion on the status of the State’s fisheries and their attitudes to the performance of the Department.
Evaluation
The Department has implemented more than one process to report on the performance of this fishery and in doing so has acted to ensure that the community has access to this information. In addition to this base level reporting, continual development of the management process will see the MAF undergo regular independent audits ensuring that the evaluation of the management arrangements in this fishery is robust.
The Department has been the recipient of a number of awards for excellence for its standard of reporting - Premiers Awards in 1998, 1999 for Public Service excellence, Category Awards in Annual Reporting in1998,1999,2000;LonnieAwardsin2000,2001and2002.
Current reporting arrangements for this fishery include:
State of Fisheries. There is annual reporting on the performance of the fishery against the agreed objectives within the “State of the Fisheries Report”. This document is available in hard copy format but is also available from the Department’s web site in PDF format.
Annual Report. A summary of this report is presented within the Department’s Annual Report and is used in some of the Performance Indicators that are reviewed annually by the OAG.
ESD Report Series. Following completion of this ESD report the Department will publish it as part of the ESD Report Series which will be available from the website.
Reports to industry. Each year, the status of the resource and effectiveness of current management are presented to industry at an annual meeting.
Robustness High
fisheries Management Response
Current
For many years the Department has produced substantial and high quality documents that report on the operation of the Department and the status of its fisheries - these reports are the Annual Report and the State of the Fisheries.
62
ESD Report Series No. 8 – Marine Aquarium Fish Managed Fishery
Future
The Department is working with the EPA to prepare a framework for reporting on ESD for all Western Australian fisheries. It is proposed that this framework will be linked to a regular audit cycle involving the EPA and periodic reporting to the OAG. The Department is working to combine the processes for reporting to the States and the Commonwealth and believes that this can best be achieved by using a Bilateral Agreement with DEH under the EPBC.
Comments and actions
The assessment and review processes already established together with proposed external review processes should ensure that there are many opportunities for the appropriateness of the management regime and the results it produces to be reviewed.
External Driver Check List
The assessments provided by independent review bodies and the community.
5.4.3 Department of fisheries – Legal framework
5.4.3.1 OCS arrangements
The licence area for the MAF extends into Commonwealth waters and OSC arrangements would apply. However, in practise all fishing for marine aquarium target species currently occurs within state waters. Therefore the OCS arrangements are not required.

ESD Report Series No. 8 – Marine Aquarium Fish Managed Fishery
63
6.0 Bibliography
Allen GR. 1997. Marine fishes of tropical Australia and south-east Asia. Western Australian Museum, Perth. 292 pp.
Department of Fisheries. 1994. Management of the Marine Aquarium Fish Fishery. Fisheries Management Paper No. 63. Department of Fisheries Western Australia.
Duque-Portugal FJ. 1989. Distribution, growth and reproductive ecology of three pipefish from seagrass beds. MSc Thesis, University of Sydney, Sydney.
Fletcher WJ. 2002. Policy for Implementation of Ecologically Sustainable Development for Fisheries and Aquaculture within Western Australia. Fisheries Management Paper No. 157. Department of Fisheries Western Australia.
Fletcher W, Chesson J, Sainsbury K, Fisher M, Hundloe T and Whitworth B. 2002. Reporting on Ecologically Sustainable Development: A “How to Guide” for fisheries in Australia. FRDC project report 2000/145.
Gomon MF Glover JCM and Kuiter RH. 1994. The Fishes of Australia’s South Coast. State Print, Adelaide. 992 pp.
Hutchins B and Swainston R. 1986. Sea fishes of southern Australia. Swainston Publishing, Perth.
Jones DS and Morgan GJ. 1994. A field guide to crustaceans of Australian Waters. Reed, Sydney. 216 pp.
Kirkman H and Walker DI. 1989. Regional studies - Western Australian seagrass. In: “Biology of Seagrasses. A treatise on the biology of seagrasses with special reference to the Australian region.” Elsevier, Amsterdam. pp 157-181.
Leis JM and Carson-Ewart BM. 2000. The larvae of Indo-Pacific coastal fishes. Brill, Leiden.
Neira F. 1998. Plotosidae: Catfishes. In: Larvae of temperate Australian fishes. Neira FJ Miskiewicz AG and Trnski T (eds). University of Western Australian Press, Nedlands. pp 65-67.
Neira FJ and Bruce BD. 1998. Apogonidae: Cardinalfishes. In: Larvae of temperate Australian fishes. Neira FJ, Miskiewicz AG and Trnski T (eds). University of Western Australian Press, Nedlands. pp 174-179.
Pogonowski JJ, Pollard DA and Paxton JR. 2002. Conservation overview and action plan for Australian threatened and potentially threatened marine and estuarine fishes. Environment Australia, Canberra. 375 pp.
Wabnitz C, Taylor M, Green E and Razak T. 2002. From Ocean to Aquarium. UNEP-WCMC, Cambridge, UK.
Wise BS, Potter IC and Wallace JH. 1994. Growth, movements and diet of the terapontid Amniataba caudavittata in an Australian estuary. Journal of Fish Biology 45:917 931.

64
ESD Report Series No. 8 – Marine Aquarium Fish Managed Fishery
7.0 appendicesAPPENDIX 1 DETAILED FISHINg BLOCk AREAS FOR THE MARINE
AQuARIuM MANAgED FISHERY FOR THE ABROLHOS ISLANDS, COCkBuRN SOuND, gEOgRAPHE BAY, kINg gEORgE SOuND AND PRINCESS ROYAL HARBOuR, AND SHARk BAY.
abrolhos
27132
97011
97012
97013
97014
28142
97015
29132 29142
2714
28132
GERALDTON
DONGARA
KALBARRI
ABROLHOS ISLANDS AREA
North Is.
Pelsart Group
Clio Rf.
Turtle DoveShoal
PelsartBank
Wallaby Group
Easter Group
114 ° 30' E29° 30' S
29° 10' S
28° 50' S
28° 30' S
28° 10' S
27° 30' S113 ° 37' E
113 ° E
200 metre isobath
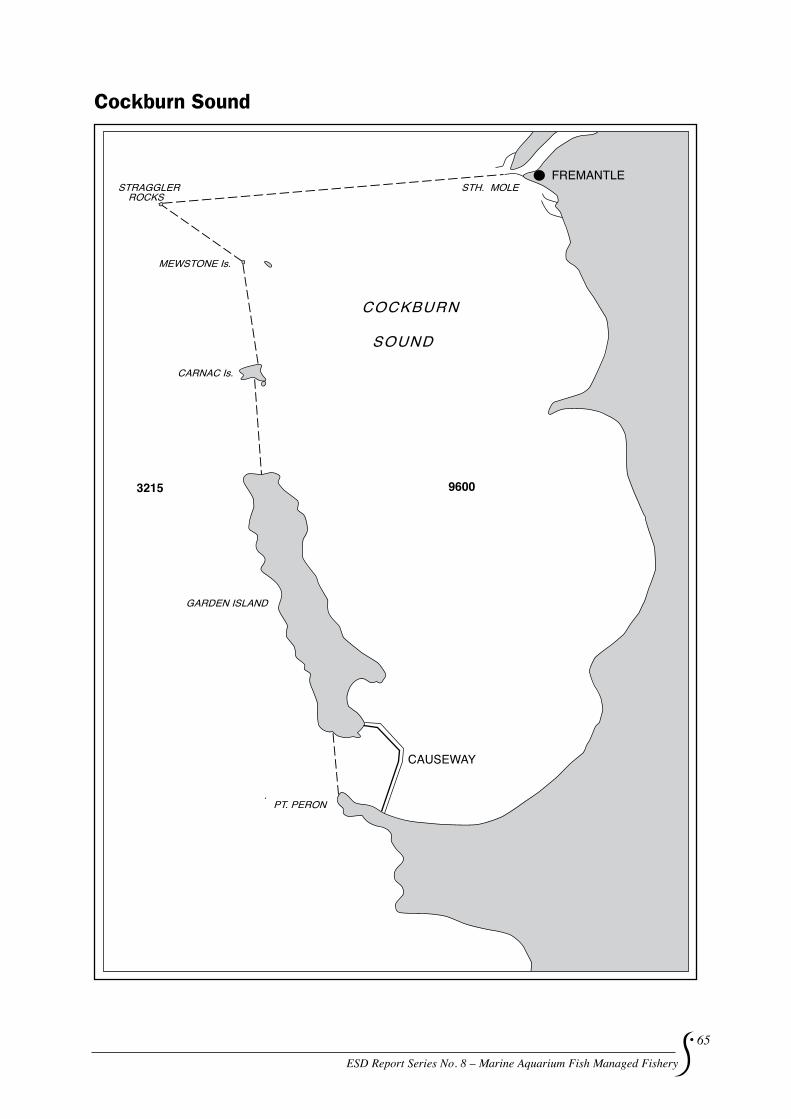
ESD Report Series No. 8 – Marine Aquarium Fish Managed Fishery
65
Cockburn Sound
FREMANTLE
CAUSEWAY
PT. PERON.
GARDEN ISLAND
CARNAC Is.
MEWSTONE Is.
STH. MOLESTRAGGLERROCKS
COCKBURN
SOUND
96003215

66
ESD Report Series No. 8 – Marine Aquarium Fish Managed Fishery
Geographe Bay
32153214
331513314
33° S
CAPE
9601
G E O G R A P H EB A Y
BUSSELTON
BUNBURY
115° E
NATURALISTE

ESD Report Series No. 8 – Marine Aquarium Fish Managed Fishery
67
King George Sound and Princess Royal Harbour
BETT
YS B
EACH
COFF
IN IS
LAND
FALS
E IS
LAND
INNE
R IS
LAND
NANA
RUP
BEAC
H
BEN
DEA
RG B
EACH
MIC
HAEL
MAS
ISLA
ND
GREE
N IS
LAND
MID
DLET
ON B
EACH
EMU
BEAC
H
VANC
OUVE
R BE
ACH
MIS
TAKE
N IS
LAND SE
AL IS
LAND
GOOD
E BE
ACH
WHA
LERS
BEA
CH
CABL
E BE
ACH
ECLI
PSE
ISLA
ND
SOUT
HWES
T IS
LAND
BREA
KSEA
ISLA
ND
PEA
K H
EAD
Kin
g G
eorg
e So
und
CA
PEVA
NC
OU
VER
Prin
cess
Roy
alH
arbo
ur
ALB
AN
Y
Oys
ter
Har
bour
3418
3517
9509
9505
9603
3518
1
35° S
118°
E

68
ESD Report Series No. 8 – Marine Aquarium Fish Managed Fishery
Shark Bay
2412 24131
96021
2512
96022
2612
26131
96023
CARNARVON
DENHAM
DIRKHARTOG Is.
Steep Pt.
C. Levillain
C. Inscription
BERNIER Is .
KOKS Is.C. Ronsard
Quobba Pt.
DORRE Is.
113 ° E
25 ° S
26 ° S
Greenough Pt.
114 ° E
S H A R K B A Y
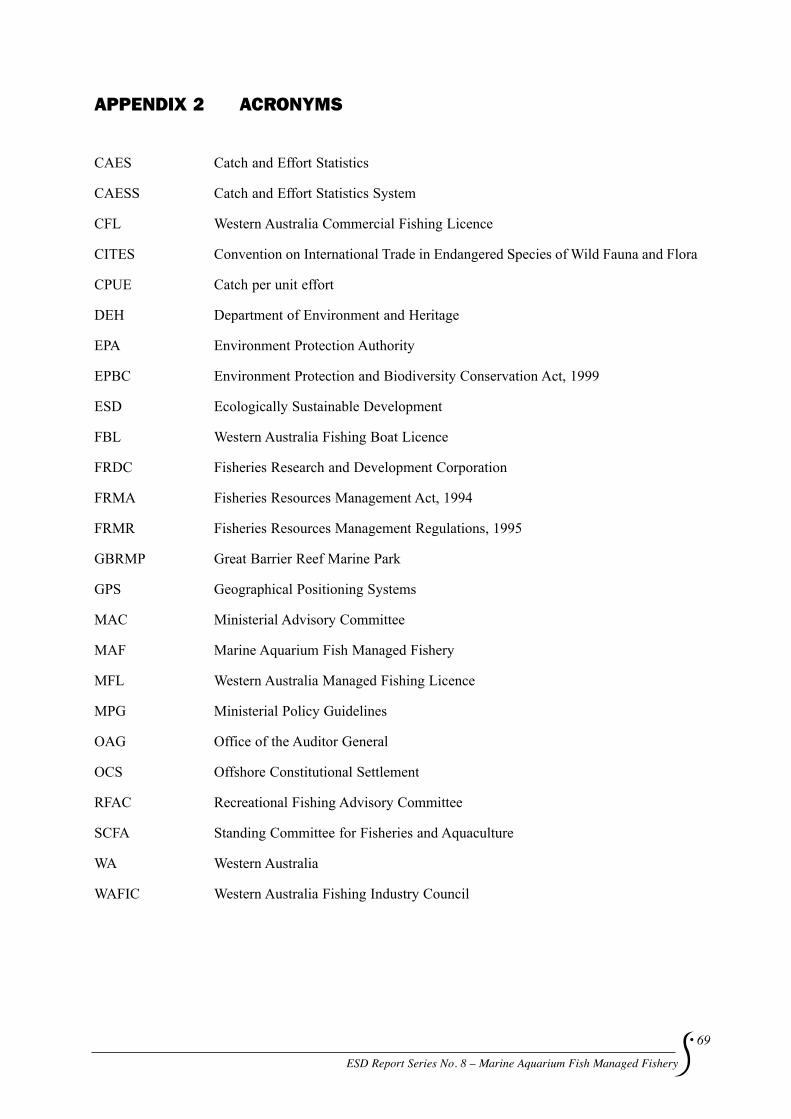
ESD Report Series No. 8 – Marine Aquarium Fish Managed Fishery
69
APPENDIX 2 ACRONYMS
CAES Catch and Effort Statistics
CAESS Catch and Effort Statistics System
CFL Western Australia Commercial Fishing Licence
CITES Convention on International Trade in Endangered Species of Wild Fauna and Flora
CPUE Catch per unit effort
DEH Department of Environment and Heritage
EPA Environment Protection Authority
EPBC Environment Protection and Biodiversity Conservation Act, 1999
ESD Ecologically Sustainable Development
FBL Western Australia Fishing Boat Licence
FRDC Fisheries Research and Development Corporation
FRMA Fisheries Resources Management Act, 1994
FRMR Fisheries Resources Management Regulations, 1995
GBRMP Great Barrier Reef Marine Park
GPS Geographical Positioning Systems
MAC Ministerial Advisory Committee
MAF Marine Aquarium Fish Managed Fishery
MFL Western Australia Managed Fishing Licence
MPG Ministerial Policy Guidelines
OAG Office of the Auditor General
OCS Offshore Constitutional Settlement
RFAC Recreational Fishing Advisory Committee
SCFA Standing Committee for Fisheries and Aquaculture
WA Western Australia
WAFIC Western Australia Fishing Industry Council
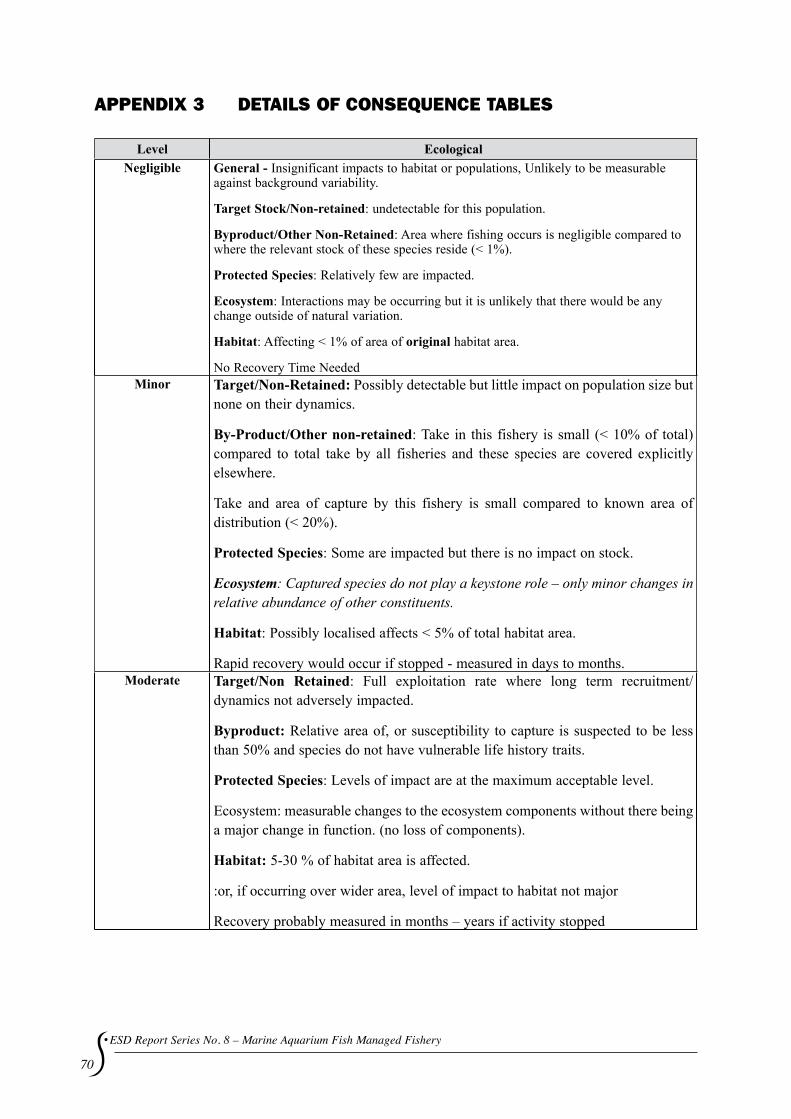
70
ESD Report Series No. 8 – Marine Aquarium Fish Managed Fishery
APPENDIX 3 DETAILS OF CONSEQuENCE TABLES
Level EcologicalNegligible General - Insignificant impacts to habitat or populations, Unlikely to be measurable
against background variability.
Target Stock/Non-retained: undetectable for this population.
Byproduct/Other Non-Retained: Area where fishing occurs is negligible compared to where the relevant stock of these species reside (< 1%).
Protected Species: Relatively few are impacted.
Ecosystem: Interactions may be occurring but it is unlikely that there would be any change outside of natural variation.
Habitat: Affecting < 1% of area of original habitat area.
No Recovery Time NeededMinor Target/Non-Retained: Possibly detectable but little impact on population size but
none on their dynamics.
By-Product/Other non-retained: Take in this fishery is small (< 10% of total) compared to total take by all fisheries and these species are covered explicitly elsewhere.
Take and area of capture by this fishery is small compared to known area of distribution (< 20%).
Protected Species: Some are impacted but there is no impact on stock.
Ecosystem:Capturedspeciesdonotplayakeystonerole–onlyminorchangesinrelative abundance of other constituents.
Habitat: Possibly localised affects < 5% of total habitat area.
Rapid recovery would occur if stopped - measured in days to months.Moderate Target/Non Retained: Full exploitation rate where long term recruitment/
dynamics not adversely impacted.
Byproduct: Relative area of, or susceptibility to capture is suspected to be less than 50% and species do not have vulnerable life history traits.
Protected Species: Levels of impact are at the maximum acceptable level.
Ecosystem: measurable changes to the ecosystem components without there being a major change in function. (no loss of components).
Habitat: 5-30 % of habitat area is affected.
:or, if occurring over wider area, level of impact to habitat not major
Recovery probably measured in months – years if activity stopped

ESD Report Series No. 8 – Marine Aquarium Fish Managed Fishery
71
Severe Target/Non Retained: Affecting recruitment levels of stocks/ or their capacity to increase.
By-Product:Other Non-Retained: No information is available on the relative area or susceptibility to capture or on the vulnerability of life history traits of this type of species.
Relative levels of capture/susceptibility greater than 50% and species should be examined explicitly.
Protected Species: Same as target species
Ecosystem: Ecosystem function altered measurably and some function or components are missing/declining/increasing outside of historical range &/or allowed/facilitated new species to appear.
Habitat: 30- 60 % of habitat is affected/removed.
Recovery measured in years if stoppedMajor Target/Non Retained: Likely to cause local extinctions.
By-Product:Other non-retained:N/A.
Protected Species: same as target species.
Ecosystem: A major change to ecosystem structure and function (different dynamics now occur with different species/groups now the major targets of capture).
Habitat: 60 - 90% affected.
Recovery period measured in years to decades if stopped.Catastrophic Target/NonRetained:Local extinctions are imminent/immediate.
By-Product/Other Non-retained N/A.
Protected Species: same as target.
Ecosystem: Total collapse of ecosystem processes.
Habitat: > 90% affected in a major way/removed.
Long-term recovery period will be greater than decades or never, even if stopped

72
ESD Report Series No. 8 – Marine Aquarium Fish Managed Fishery
APPENDIX 4 LETTER OF JuSTIFICATION FOR TAkINg OVER 750 SYNgNATHID SPECIMENS & STATuS REPORT
Your Ref:
Our Ref: 593/98-12 Enquiries: H. Greif (08) 9482 7306
Ms A McDonald Environment Australia Department of Environment and Heritage GPO Box 787 CANBERRA ACT 2601
Dear Ms McDonald
Further to your letter of 1 October, please accept the following advice in regard to the commercial collection of syngnathids in Western Australia (WA) (with respect to the conditions of the Commonwealth Declaration of Controlled Specimens (provided for under Section 10A of the Wildlife Protection (Regulation of Exports and Imports) Act 1982) (the Declaration)). That is:
Syngnathids are not harvested in Commonwealth waters off the WA coast.
Syngnathids are harvested in accordance with the provisions of the Marine Aquarium Fish Management Plan 1995.
See below for further details.
Licensees make reasonable efforts to ensure that non-egg bearing adults are not taken. It should also be noted that licensees in the Marine Aquarium Fish Managed Fishery have recently formed a formal Association under the banner of the WA Fishing Industry Council. The Association intends on revising the existing Code of Practice and adopting it formally. The take of non-egg bearing adults will be included in the Code of Practice. The formation of the Association indicates the level of long-term commitment to the industry that is exhibited by licensees.
The leafy seadragon (Phycodurus eques) is a totally protected fish under the provisions of Section 46 of the Fish Resources Management Act 1994, Regulation 10 and Schedule 2 of the of the Fish Resources Management Regulations 1995.
Under the provisions of the Marine Aquarium Fish Management Plan 1994 licensees are only permitted to use hand held nets.
Any post-capture/pre-sale mortalities are recorded on the mandatory monthly catch and effort returns that are submitted to the Department. No mortalities were recorded over the 2002 period.
See below for further details.
See enclosed report.
Syngnathids are prepared and shipped in accordance with Guideline 51 of the International Air Transport Association Live Animal Regulations.
Annual quota of syngnathids Over the 2002 period a total of 833 individual syngnathids were harvested from WA waters for marine aquarium purposes (see enclosed report for specific details). This figure is over the nominal 750 individuals set by the Declaration and was previously ear-marked in the covering letter accompanying the Department’s October 2002 report. Under such

ESD Report Series No. 8 – Marine Aquarium Fish Managed Fishery
73
circumstances the Department is required to demonstrate to Environment Australia that this ‘excess’ take of syngnathids is sustainable.
As also noted in the covering letter accompanying the Department’s October 2002 report the sustainable take of syngnathids is currently being assessed as part of the ecological sustainability report required under the provisions of the Environment Protection and Biodiversity Conservation Act 1999 for the Marine Aquarium Fish Managed Fishery. In any event, the Department does not consider this level of harvest unsustainable particularly given the spread of species (and their distributional ranges and their cryptic behaviours) and collection sites.
As noted in previous correspondences, the Department would prefer to have a species-specific annual ‘quota’ rather than a blanket ‘syngnathid’ quota. This would ensure that species, which may be more vulnerable to over-fishing or species for which biological data is poor, are not ‘lumped together’ with other more robust/well known species.
Under the current Declaration there is nothing to prevent 750 of one species of syngnathid being taken. Consequently, while the overall syngnathid ‘quota’ was exceeded by 83 individuals during the 2002 period, given that the total take was spread over four + species, I do not consider it necessary to ‘demonstrate’ sustainability unless the take of a single species exceeded the 750 ‘quota’. To do so based on the current collective syngnathid quota would not achieve anything.
I do note however, that there has been a relative increase in the numbers of western spiny seahorse (Hippocampusangustus), common weedy seadragon (Phyllopteryx taeniolatus) and spotted pipefish (Stigmatopora argus)) collected in the 2002 period. That is, from 330 in 2001 to 456 in 2002, from 325 in 2001 to 332 in 2002, and from 1 in 2001 to 21 in 2002 respectively. I do not consider these increases unsustainable for the reasons described previously. However, please note that I will advise licensees of this increase and remind them of the requirements of the Declaration. Please also note that there was a reduction in the collection of the short-snouted seahorse (Hippocampusbreviceps) from 56 in 2001 to 18 in 2002.
Resource Assessment Forms Information on size, sex and reproductive status has been collected sporadically by some operator’s on the Resource Assessment Forms. However, as noted in the Department’s October 2002 report, this data has very limited value without a specific project and support funding to co-ordinate the data collection and analysis.
Please note that the Department also intends to negotiate with the newly formed Association to consider an ‘industry-contribution-to-research’ ‘fee’ to accommodate such data collection and analysis. It is also hoped that the Association may be proactive in terms of securing funding/resources for universities etc to undertake further research into the species collected in the Marine Aquarium Fish Managed Fishery, given the severe lack of consolidated funds within the Department to undertake research on such a minor fishery.
Other issues The Department has identified that a finer scale of reporting in terms of the take area would be beneficial in collecting more targeted information on the distribution of syngnathids and the primary finfish species targeted within the Marine Aquarium Fish Managed Fishery.
The current catch and effort return forms, which are entered into the Department’s Catch and Effort Statistical (CAES) System, provide for a 60 nautical mile (nm) grid system. While this gross scale is suitable for larger scale commercial fisheries (such as the rock lobster or wetline fishing) it does not provide a suitable level of detail for smaller scale commercial operations such as the Marine Aquarium Fish Managed Fishery.

74
ESD Report Series No. 8 – Marine Aquarium Fish Managed Fishery
Consequently, the Department is in the process of negotiating with the newly formed Association to introduce a smaller grid system. Ideally, the Department would like to introduce a ten (10) nm grid system to complement that negotiated with licensees in the Specimen Shell Managed Fishery.
Please also note that earlier this year, an internal Risk Assessment Workshop was undertaken by the Department’s compliance personnel to identify and risk rank potential ‘loopholes’ in the existing management arrangements and to identify feasible solutions to improve the enforcement rigour within the Fishery. Once these outcomes/recommendations are finalised it is intended that they also be incorporated in the Plan.
I trust the above information will suffice. However, should you have any further queries, please do not hesitate to contact me on telephone (08) 9482 7306 and email [email protected] .
Yours sincerely
Heidi Greif Commercial Policy Officer
29 October 2003

ESD Report Series No. 8 – Marine Aquarium Fish Managed Fishery
75
Status report for collection of syngnathids in Western australia
October 2003
1.0 Management overview
The catch of syngnathids is a small component of the Marine Aquarium Fish Managed Fishery (the Fishery), which is managed under the legislative provisions of the Marine Aquarium Fish Management Plan 1995. The Fishery targets over 200 species in varying quantities.
There are 14 licences in the Fishery, with the licensees ranging from the ‘hobbyist’ to the vertically integrated businessman. Licensees in the Fishery are only permitted to collect specimens by hand or using hand held nets. Operationally, licensees are restricted by weather and physical dive limitations. Licensees are also restricted in the number of ‘crew’ that may participate in the collections.
The Fishery is a Statewide Fishery although there are a number of areas along the coast that are protected from commercial fishing. For example, sanctuary zones of Marine Parks and Marine Nature Reserves and the entire State and Commonwealth portions of the Ningaloo Marine Park (implemented through the Department of Conservation and Land Management) as well as some Fish Habitat Protection Areas and the area between Point Maud and Tantabiddi Well (implemented through the Department of Fisheries).
Under the provisions of Regulation 64 of the Fish Resources Management Regulations 1995, licensees are required to submit monthly catch and effort returns detailing the number of species taken and the locations of take. The State’s waters are divided into grid squares of 60 x 60 nautical miles for the purposes of recording take location. Certain areas such as Shark Bay and the Houtman Abrolhos Islands are divided up into smaller areas. The returns are recorded in the Department’s Catch and Effort Statistical System.
2.0 Commercial catch and effort
The syngnathid catches reported by licensees in the Fishery over the period from 1994 to 2002 are shown in Table 1 below. It is difficult to extract the effort data relating specifically to the take of syngnathids because licensees rarely set out to specifically target syngnathids. More often than not syngnathids are taken on an opportunistic basis during other marine aquarium fish collecting activities. However, the total number of fisher days recorded by licensees in the Fishery as a whole over the 2002 calendar year period was 910 days. The number of operators reporting syngnathid catches over the 2002 period was 7.
The catch distribution for 2002 is shown in Figure 1 and ranges from the Gascoyne region to the Southern region of WA. The spatial distribution of catches varies greatly from year to year depending on the operational requirements of each licensee.

76
ESD Report Series No. 8 – Marine Aquarium Fish Managed Fishery
Common name Scientific name 1994 1995 1996 1997 1998 1999 2000 2001 2002 Weedy seadragon Phllopteryx taeniolatus 50 24 22 99 123 136 223 325 332 WA spiny seahorse Hippocampusangustus 290 364 192 378 358 178 329 330 456 Short snouted seahorse Hipocampusbreviceps 2 21 39 64 62 56 18 Spiny seahorse Hippocampushistrix 1 Spotted seahorse Hippocampuskuda 1 Tiger pipefish Filicampus tigris 3 Ribboned pipefish Haliichthystaeniophorus 1 Upside down pipefish HeraldianocturnaSpotted pipefish Stigmatopora argus 78 24 1 21 Other 29 6 Total 340 390 226 513 552 460 638 741 833
Table 1 Reported catches of syngnathids by licensees in the Marine Aquarium Fish Managed Fishery from 1994 to 2002
3.0 Catch by other sectors
The recreational take of syngnathids is unknown as there are no reporting requirements for recreational collections of syngnathids. Indications of the level of recreational fishing activity may be extrapolated from regional creel surveys conducted on the Lower West Coast (96/97), Gascoyne (98/99) and Pilbara (99/00) regions of Western Australia, which recorded no take of syngnathids. The National Recreational Fishing Survey (00/01), which recorded over 19,000 recreational fishing trips, did not report syngnathids being taken as part of the survey. However, it is likely that there are certain recreational groups, such as marine aquarium enthusiasts that do take syngnathids for marine aquarium purposes. Consequently, the Department intends to consider the introduction of a daily recreational bag limit for syngnathids.

ESD Report Series No. 8 – Marine Aquarium Fish Managed Fishery
77
There is also some unreported bycatch of syngnathids in other commercial fishing operations, but the size of the catch and the associated mortality rate is unknown. There is also no measure of illegal fishing activities in relation to syngnathids.
4.0 Biological characteristics of primary syngnathid species taken
Some operators have collected information relating to size, sex and reproductive status, sporadically on Resource Assessment Forms. However, as noted in the Department’s October 2002 report, this data has very limited value without a specific project and support funding to co-ordinate the data collection and analysis.
Regardless, the following information indicates that the syngnathid species primarily taken are widely distributed within WA waters and occur in both shallow and deep waters in both urban and remote locations. It is estimated that 80% of populations occur in areas that receive little to no impact from fishing (based on the distributional ranges and the spatial catch and effort data). Consequently, the relatively small take of each species by licensees in the Marine Aquarium Fish Managed Fishery is highly unlikely to affect the sustainability of the wild populations.
The western spiny seahorse (Hippocampusangustus) is endemic to WA and has a distributional range from North West Cape through to Augusta. The species has been trawled to depths of 30 metres but is also found in shallows. It is generally found in association with seagrass beds. There is no evidence of decline for this species. The species is often misidentified as H.hystrix or H.elongatus (Pogonoski et al. 2002).
The common weedy seadragon (Phyllopteryx taeniolatus) is endemic to Australia and has a distributional range from the central coast of NSW through to WA’s midwest coast (including Tasmania). The species is usually found in kelp reefs with edges of sand to depths of 50 metres. Individuals are often found washed up on the shore following storm events. Consequently, the natural mortality is considered higher than any other mortality source. Longevity in aquaria is at least 4 years, but lifespan in the wild is unknown. This species breeds early summer and generally only produces one brood per season. There is no evidence of decline for this species (Pogonoski et al. 2002).
The short-snouted seahorse (Hippocampusbreviceps) has a distributional range from the central coast of NSW through to Lancelin on WA’s midwest coast (including Tasmania). The species is usually found in association with seaweed and algal communities and occurs to depths of 20 metres. Individuals are rarely seen because of their good camouflage and small size. Longevity in aquaria is at least 3 years, but lifespan in the wild is unknown. This species breeds on a monthly cycle over the summer months. There is no evidence of decline for this species (Pogonoski et al. 2002).
The spotted pipefish (Stigmatopora argus) is endemic to Australia and has a distributional range from southern QLD through to WA’s midwest coast (including Tasmania) (Gomon et al. 1994). The speciesis usually found in shallow seagrass beds and weedy areas on rocky reefs and they are thought to have a life span of approximately 12 months (Duque-Portugal 1989). They are abundant but are rarely seen because of good camouflage.
5.0 Stock assessment
A species-specific stock assessment is not feasible for the syngnathid ‘fishery’ given the comparatively low catches and the wide spatial scale of fishing and reporting. However, the Department recognises that an annual report such as this provides a general indication of the trends of take within the ‘fishery’. The Department is also of the opinion that a species-specific catch ‘quota’ (especially for those primarily targeted) would be more beneficial than the current ‘blanket’ syngnathid ‘quota’.

78
ESD Report Series No. 8 – Marine Aquarium Fish Managed Fishery
APPENDIX 5 DRAFT CODE OF PRACTICE MARINE AQuARIuM MANAgED FISHERY
DRafT CODE Of PRaCTICE
April 2004For the Collection of Aquarium Fish, Living Rock, Live Sand and Coral
Purpose of the Code of Practice
The Aquarium Specimen Collectors Association of Western Australia Inc. (Association) developed this Code of Practice (Code) as an agreement between licensees of the Marine Aquarium Managed Fishery, for the purpose of:
Establishing a voluntary set of standards or behaviour for responsible fishing and resource sharing.
Demonstrating to other aquatic users of the licensees’ commitment to ensuring the Fishery is, and continues to be managed in a sustainable way and
Providing a valuable source of information to those wanting to know more about the Fishery and how it operates.
Licenseeswho have agreed to abide by theCode have provided their signatures at the end of thisdocument.ItisavoluntaryagreementbetweenlicenseesandadherencetotheCodeisaconditionofmembershipintheAssociation.AbreachoftheCodeislikelytoresultin:
• ExpulsionofthatmemberfromtheAssociation
• RecommendationtotheExecutiveDirectoroftheDepartmentofFisheriesWA,Theassociationdoes not believe that member to be a fit and proper person to hold a licence in the Fishery.
TheDepartmentofFisheries,TheMarineConservationCouncil,andRecfishwesthavealsoendorsedthisdocument.Thiscodewillremaininplaceuntilitisupdatedin2006.*****(endorsements still to come)****
Description of the FisheryLicensees of the Fishery
TheMarineAquarium fishery inWesternAustraliadatesback to the1960’s,withearlycommercialoperatorsworkingonpermitsorconditionsendorsedontheircommercialfishinglicences.In1995TheMarineAquariumFishManagedFisherywasformed.Itisasmallcommercialhighlyselectivefisherywiththirteenlicenseespermittedtotakebonyandcartilaginousfishformarineaquariumpurposes.Fiveofthelicenseesareendorsedwithaconditiontotakeothermarineorganismssuchasliverock,coralsandinvertebrates.
Like the other Aquarium Fisheries in Australia, only hand held nets are used to capture fish. No chemicals, explosives or traps are permitted. The Fishery currently has Environment Australia approval and export clearance for syngnathids (sea horses and pipe fish) based on the non-destructive capture methods and sustainability of the fishery. Also the fishery is currently seeking Environment Australia approval for the remainder of specimens collected. The Aquarium Fisheries of Australia are widely recognised as the best in the world.
“When questioned about the sustainability of the aquarium trade I point to the Australian Aquarium Fisheries as the benchmark”

ESD Report Series No. 8 – Marine Aquarium Fish Managed Fishery
79
-Steve Robinson President Marine Dealers Association of North America
“The marine aquarium industry and coral reef conservation in Australia are models for the rest of the world,”….. “Australia has never used chemicals to catch fish, and the collectors act as excellent stewards of the reefs they work …..” Paul Holthus, Marine Aquarium Council president
“Reefs, like forests, will only be protected in the long term if they are appreciated. Aquariums, both public and private are playing a crucial role in this. They are helping to create interest for the general public and it is not unreasonable to suppose that this interest, once embraced by a whole generation will result in an active desire to conserve.”
Dr J.E.N. Veron, Australian Institute of Marine Science.
The Market
The live organisms collected in the Fishery supply aquarium outlets, public oceanariums (eg AQWA), andavarietyofbusinessesandindividualswantingtomaintainareefaquarium.MarineorganismscapturedintheFisherysupplyAustralianmarketsandinternationalexportsofmarineaquariumfish only.
A large percentage of the fish sold as aquarium specimens in Australia are imported from countries suchasIndonesia,Fiji,TheSolomonIslandsandSriLanka.Manyofthesespecimensarecaughtusingdubiousmeans(iecyanidepoisoning),withhighmortalityratesbothduringcollectionandafter importation into Australia.
Both West Australian and indeed Australian collected specimens are highly regarded internationally for the high quality and high rates of survival due to the collection methods used. These live aquarium specimens’ command extreme prices on a per kg basis reflecting the low amount ofkg’s taken relative tootherhighervolumemoremechanical fisheries.Onadollarperkgbasis,ornamental fish are second only to pearls. Fish currently achieve prices averaging $1 000.00 per kg,invertebrates$1000.00perkgandcorals$100.00perkg.MakingtheFisherysecondinvalueonaperkgbasisonlytopearls.
Components of a Reef Aquarium
Amodernreefaquariumconsistsoflivesand,which isusuallyofcorallineorigin(brokendowncoral),collectedfromtheoceanfloorbecauseitcontainslivemicro-organismswhichbreakdownwastesproduced by other life in the aquarium. “Livingrock”islooserockconsistingofolddeadcoralsdislodgedfromthereefbytropicalstormsandcyclones.Itisnormallycollectedfromawavesweptreefarea.Thesurfaceof livingrock iscovered insmallplantsandencrustingorganisms.Therearealsomanymicroorganismslivingwithintherocksurface.Theseplayanimportantroleinthebreakdownofwasteswithintheaquarium.Livingrockalsoformsthebasisofthereefconstructionanddecorationwithinthetank.
Coral, fish and invertebrates are mainly selected for their aesthetic values, temperament and hardiness, butmanyofthemplayimportantrolesintheaquariumecosystemsuchasGrazingonalgae’sandbreakingdowndetritus.
Utilisingtheseorganismsinsuchawayallowstheaquaristtocreateaminiversionofarealreefwithits own ecosystem. This has seen great improvements in long-term survival and propagation ofcaptiveorganisms.Collectorsnownotonlytakefromthewildbutalsocultureandgrowanumberof their specimens for sale.
Maintaining Resource Sustainability
There are several important factors that act to minimise the impact the collectors have on the marine

80
ESD Report Series No. 8 – Marine Aquarium Fish Managed Fishery
environment and ensure these activities continue to be sustainable. These are:
Number of Operators: There are 13 licensed operators in the Fisherywho are licensed to operateover theentireofWesternAustralia’scoastline.Noother licences tooperate in theFisherywillbemadeavailableinthefutureandtheonlywaytoobtainalicenceistobuyanexistinglicencefromalicenseeseekingtoleavetheFishery.Inthiswaythetotaleffortofthefisheryiscappedata sustainable level.
Individual Quota:Collectorsareallocatedacertainamountofquotatotakecertainmarineorganismsdepending on their licence conditions. The Department of Fisheries is responsible for determining andenforcingthequotalevelsfortheFishery.Currently7500kgoflivecoraland1500kgofliverockisdistributedamong5ofthelicensees.Whilethesenumbersmaylooklargetherealityis,anindividualcollectorwithmaximumquotamayonlycollectlessthan6kgeachday.Theequivalentamountofcoralandrockequaltothetotalquotaavailablefortheentirefisheryforayearwouldberepresentedonlessthana1-hectaresiteofmediumtolow-densitycoralreeforevenonesinglecoralhead.OnlyapinprickonamapofWA.
Market requirements: Themarket for aquarium specimensdemandsa vastlywide rangeof species,whichminimisesanypossibleeffector time,spentcollectingonanyoneparticularspecies.Themarketalsorequiresspecimensofasmallrangeofsizes,shapesandonlythoseinperfectcondition,(thisbeingaverysmallpercentageoftheavailablestocks),andatanyonetimethemarketforoneindividualspeciesislimited.Thekeyistosupplyquality,diversityandvariety.
Natural Abundance: Themajority of species, ofwhich there are over 150, sought by collectors arefound in large numbers. There is also little or no competition from other commercial fisheries or the recreational sector to target these species.
Collection Methods:Collectioninthefisheryoccurswithhandheldnetssotherearemanyphysicallimitsonhowmucheachcollectorcancatch inagiven time.This isparticularly influencedbytheneed to catchandhandle each specimen individually in order to keep it in good condition.Collectors are legally required to only use hand nets and hand tools. No chemicals, explosives ormechanicalmeans are permitted.Hand held nets are an inefficientmeans of capture as theoverwhelmingmajorityoffishmanagetoescapecapturebyretreatingwithinreefstructuresoroutswimmingthefisher.Nounwantedbycatchisproducedwithmarineaquariumspecimencollecting.Marine aquarium specimen collectors are completely discriminate in their fishing practices and shouldberecognisedassuch.Unlikealmostallotherfishingmethodssuchastrawlfishing,netandlinefishing,recreationalincluded.Allofwhicharealmostcompletelyindiscriminate.
Dive based fishery: As a dive based fishery, the actual physical constraints of human endurance and the physiological effects of decompression, limit the effort in the fishery. Additionally, optimal conditions oftide,swell,visibilityandwindarerequiredtosuccessfullycapturelivefish.Thustheunusualnatureof the fishery imposes limitations on the amount of effort that can be made.
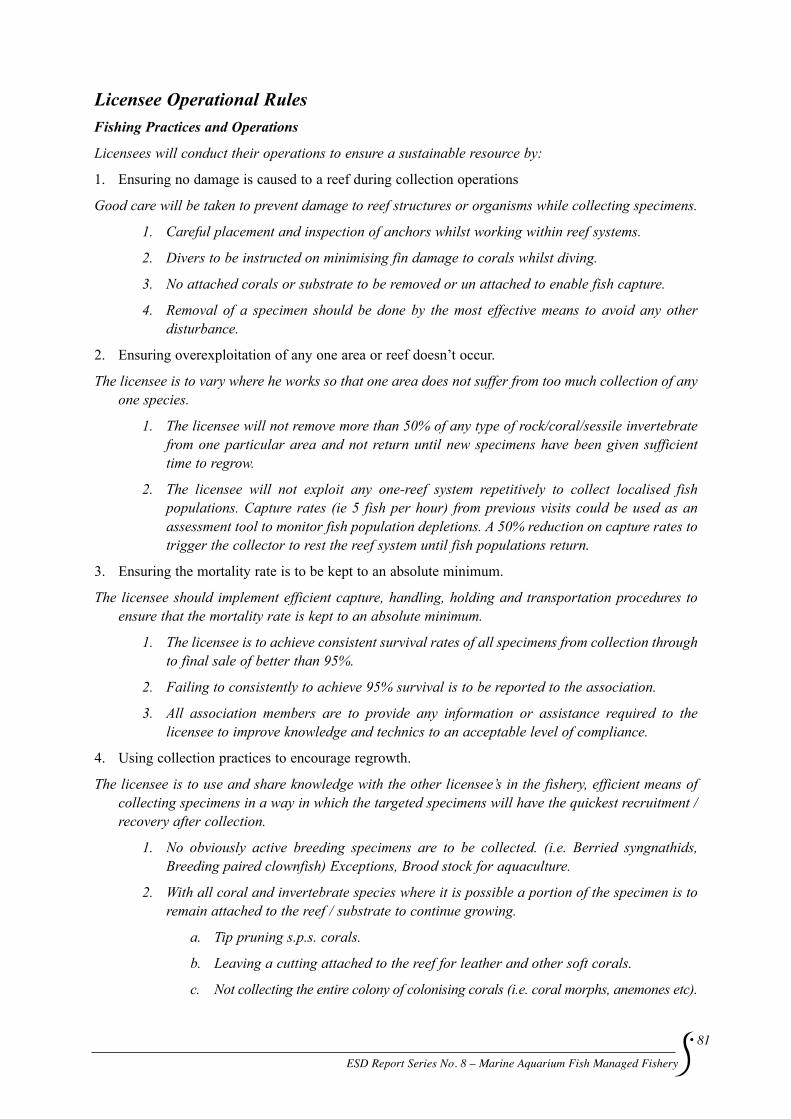
ESD Report Series No. 8 – Marine Aquarium Fish Managed Fishery
81
Licensee Operational Rules Fishing Practices and Operations
Licenseeswillconducttheiroperationstoensureasustainableresourceby:
1. Ensuring no damage is caused to a reef during collection operations
Goodcarewillbetakentopreventdamagetoreefstructuresororganismswhilecollectingspecimens.
1. Carefulplacementandinspectionofanchorswhilstworkingwithinreefsystems.
2. Diverstobeinstructedonminimisingfindamagetocoralswhilstdiving.
3. No attached corals or substrate to be removed or un attached to enable fish capture.
4. Removal of a specimen should be done by the most effective means to avoid any other disturbance.
2. Ensuring overexploitation of any one area or reef doesn’t occur.
Thelicenseeistovarywhereheworkssothatoneareadoesnotsufferfromtoomuchcollectionofanyone species.
1. Thelicenseewillnotremovemorethan50%ofanytypeofrock/coral/sessileinvertebratefromoneparticularareaandnot returnuntil newspecimenshavebeengiven sufficienttimetoregrow.
2. The licensee will not exploit any one-reef system repetitively to collect localised fishpopulations. Capture rates (ie 5 fish per hour) from previous visits could be used as an assessmenttooltomonitorfishpopulationdepletions.A50%reductiononcaptureratestotrigger the collector to rest the reef system until fish populations return.
3. Ensuring the mortality rate is to be kept to an absolute minimum.
The licensee should implement efficient capture, handling, holding and transportation procedures to ensurethatthemortalityrateiskepttoanabsoluteminimum.
1. The licensee is to achieve consistent survival rates of all specimens from collection through tofinalsaleofbetterthan95%.
2. Failingtoconsistentlytoachieve95%survivalistobereportedtotheassociation.
3. All association members are to provide any information or assistance required to the licenseetoimproveknowledgeandtechnicstoanacceptablelevelofcompliance.
4. Using collection practices to encourage regrowth.
Thelicenseeistouseandshareknowledgewiththeotherlicensee’sinthefishery,efficientmeansofcollectingspecimensinawayinwhichthetargetedspecimenswillhavethequickestrecruitment/recovery after collection.
1. No obviously active breeding specimens are to be collected. (i.e. Berried syngnathids, Breedingpairedclownfish)Exceptions,Broodstockforaquaculture.
2. Withallcoralandinvertebratespecieswhereitispossibleaportionofthespecimenistoremainattachedtothereef/substratetocontinuegrowing.
a. Tip pruning s.p.s. corals.
b. Leaving a cutting attached to the reef for leather and other soft corals.
c. Not collecting the entire colony of colonising corals (i.e. coral morphs, anemones etc).

82
ESD Report Series No. 8 – Marine Aquarium Fish Managed Fishery
5. Collecting only enough fish/coral/rock/sand for the immediate needs of the licensee.
Nomorespecimensshouldbetakenthanthelicenseeknowscanbesafelytransportedandstoreduntilsold.
1. Thelicenseeistoonlycollectspecimensthathe/shehas.
a. A firm purchase order for or facilities to hold the specimens until sale.
b. Transport arrangements in place to send the specimens to holding facilities
c. The ability to comply to rule 3.1.
6. Not collecting from reef systems, which have limited resources and may not cope with collection.
7. Supplying accurate records of identification and quantities of specimens to the Department of Fisheries
ThiswillensuretheDepartmentofFisheriesmaintainsaccuratecatchrecordsfromthefishery.
8. Staying up to date with regulations relating to the fishery.
Licenseeshave the responsibilityofkeepingabreastofall the lawsandby lawsenactedbyvariousgovernmentbodiesand localshirecouncilswhen itcomes togainingaccess to fishinggrounds.Collectorsshouldnotcauseenvironmentaldamagewhengainingaccessorleaving.
9. Taking due care specimens will have the best chance of survival in the aquarium trade.
Licensees are to collect specimens suitable for the aquarium trade.
1. Licenseesaretokeepalistofspecimensconsiderednotsuitableforthegeneralaquariumtrade (attachment A).
2. AnyspecimenssoldfromattachmentAMustbesoldandmarketedtoallcustomers(retailandwholesale)bythecollectorwiththecorrespondingwarning.
3. Eachlicenseeistoendeavourtosupplyspecimensonlytofacilitieswiththeappropriatehusbandry abilities.
Resource Sharing
Long-termsustainabilityisthekeyobjectiveofresourcemanagement.Sustainabilitymusttakeaccountof all users of the resource. We support resource-sharing methods that maintain sustainability of the resource by:
10. Leaving no obvious evidence of harvesting.
Collectors should aim to operate in such a manner that there is little or no obvious evidence of collection.
11. Keeping collection from reefs and locations frequented by other users to a minimum.
Manylocaldiveandtouroperatorshaveparticularlocationsthatareverypopularwiththeircustomersandthusimportanttotheoperator’sbusiness.Collectorsaretoavoidpossibleconflictbyavoidingor minimise collecting from such locations. This includes reducing time spent on public boat ramps duringpeakrecreationaltimes.
12. Not portraying a negative image of the fishery.
Collectorsaretobemindfulofotheraquaticusersintheareaandwheninteractingwithotherusersshould do so in a professional and cooperativemanner.Where possible, collectors should takethe time to explain the management of the fishery to interested members of the public. If a dispute occursthenwehaveadutytobehaveinanon-aggressiveandlawfulmanner.
13. Adopting the most efficient and sustainable methods of harvesting.

ESD Report Series No. 8 – Marine Aquarium Fish Managed Fishery
83
Pollution Control
Licenseeshavearesponsibilitytoprotectthemarineenvironmentbytakingthefollowingmeasurestomanage pollution:
14. Fuelling operation should be carried out on land wherever possible.
15. Ensuring oil and other chemicals must never be discharged overboard.
16. Have secure bins and bags on board for waste and disposing of all rubbish back on land into secured bins.
17. Report any observed environmental damage to the appropriate authorities.
Compliance
Itisparamountlicenseesactinaccordancewiththelawtoensuresustainabilityofstocksandcredibilityofthefishery.OurindustrywillcooperateatalltimeswiththeDepartmentofFisheriestoidentifyand prevent illegal fishing activities by:
18. Immediately notifying illegal fishing to the Department of Fisheries Regional Office concerned.
19. Reviewing their membership of the Association if a blatant illegal fishing act has taken place by an operator within the fishery.
Research
Fisheriesresearchformsthebasisoftheknowledgerequiredtomakeinformedmanagementdecisionsinourindustry.Therefore,collectorsshouldparticipatewithresearchmanagers(andWAmuseumstaffwherenecessary)inthecollectionofstatisticstoaidintheconservationandmanagementofstocks.
Wewill:
20. Assist researchers where possible by offering assistance and advice with research projects.
21. Work with the WA Museum in the identification of species.
22. Work with the Department of Fisheries Research in streamlining identification of organisms.
23. Incorporate any appropriate research into best practice techniques to improve collection methods.
24. Endeavour to further knowledge and minimise wild collection of specimens suitable for captive culture.
ThankyouformakingtheefforttoreadtheAquariumSpecimenCollectorsAssociationofWAInc.CodeOf Practice. Please inform Fisheries WA or the Aquarium Specimen Collectors Association of WA Inc. of any breaches to this code by members. Similarly of any undesirable activities conducted by non-commercial collectors should be addressed.
Contacts:
Fisheries WA, 168 St Georges terrace, WA 6000
Fishwatch1800815507
Aquarium Specimen Collectors Association of WA, Inc.
President: Steven Marns (08) 9307 6257
Vice president: Jonathon Potter (08) 9949 2272
Secretary: Peter Fullarton (08) 9305 9891
Attachment A.Name WarningBlacktipreefshark Carchahinus melanopterus Max size 2m, not suitable for home aquariums.

84
ESD Report Series No. 8 – Marine Aquarium Fish Managed Fishery
APPENDIX 6 INFORMATION REgARDINg TRAwL ACTIVITY ON THE SYNgNATHID FAMILY IN THE SHARk BAY AREA
Map of the Shark Bay area detailing the locations where Syngnathids were taken during a fisheries trawl exercise. The numbers refer to the site numbers in the following table.
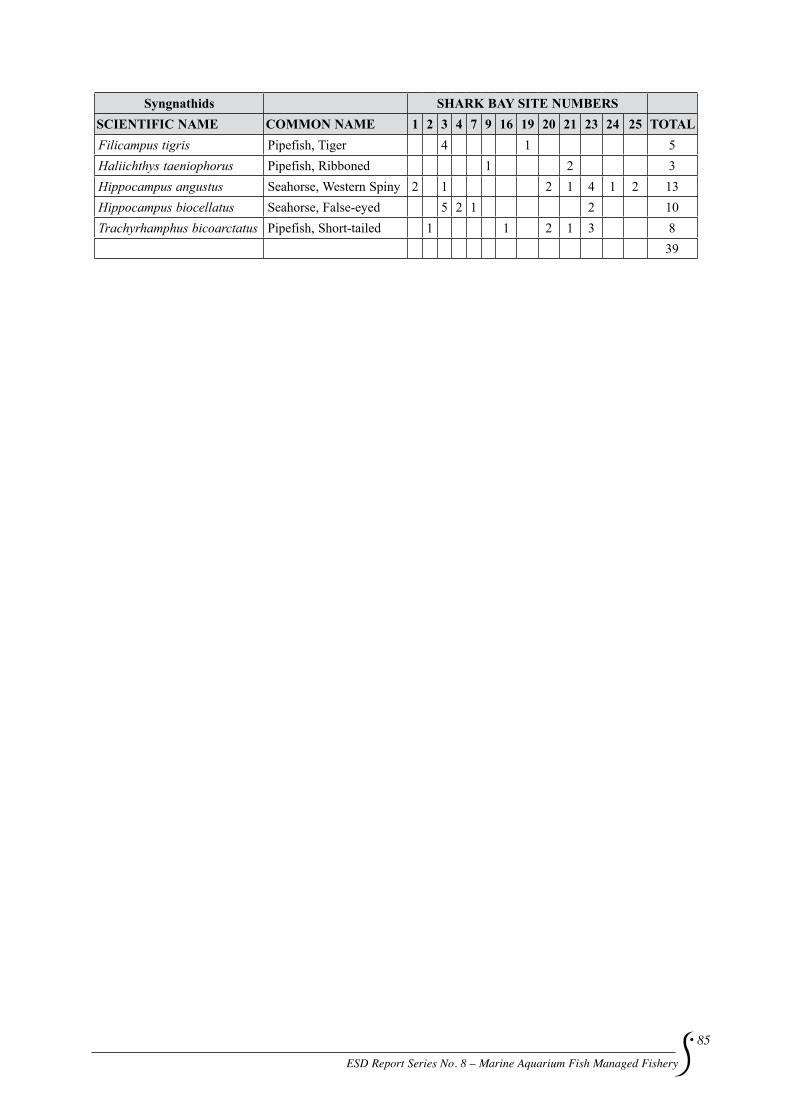
ESD Report Series No. 8 – Marine Aquarium Fish Managed Fishery
85
Syngnathids SHARK BAY SITE NUMBERSSCIENTIFIC NAME COMMON NAME 1 2 3 4 7 9 16 19 20 21 23 24 25 TOTALFilicampus tigris Pipefish, Tiger 4 1 5Haliichthystaeniophorus Pipefish, Ribboned 1 2 3Hippocampusangustus Seahorse, Western Spiny 2 1 2 1 4 1 2 13Hippocampusbiocellatus Seahorse, False-eyed 5 2 1 2 10Trachyrhamphus bicoarctatus Pipefish, Short-tailed 1 1 2 1 3 8
39
86
ESD Report Series No. 8 – Marine Aquarium Fish Managed Fishery
APPENDIX 7 MATERIALS SuPPLIED TO ENVIRONMENT AuSTRALIA AgAINST THEIR SPECIFIC guIDELINES
SECTION 4. aSSESSMENT OF THE MaRINE aQUaRIUM FISHERY MaNaGEMENT REGIME aGaINST THE aUSTRaLIaN GOVERNMENT GUIDELINES FOR aSSESSING THE ECOLOGICaLLY SUSTaINaBLE MaNaGEMENT OF FISHERIES
GENERaL REQUIREMENTS Of THE GUIDELINES
The management arrangements must be:
Documented, publicly available and transparent;
As per the FRMA “the Executive Director is to cause a copy of every order, regulation and management plan in force under this Act:
-TobekeptattheheadofficeoftheDepartment;and
- To be available for inspection free of charge by members of the public at that office during normal office hours.”
In addition to the legislative requirements, the current management regime, as documented in the formal set of management regulations, can be purchased by interested parties from the State Law Publisher and viewed on the their website www.slp.wa.gov.au/statutes/subsiduary.nsf/Fisheries.
Of more relevance is that any discussion papers and proposals for modifications to these management arrangements are distributed widely to stakeholder groups automatically and other interested individuals by request in hard copy format. Where appropriate, they are now also available from the Departmental web site www.fish.wa.gov.au.
Finally, once completed, the full ESD Report for the fishery will be made publicly available via publication and electronically from the Departmental website. This will provide increased transparency through explicitly stating objectives, indicators, performance measures, management arrangements for each issue and how the fishery is currently performing against these criteria. As a result, the Department of Fisheries is meeting the guideline.
Developed through a consultative process providing opportunity to all interested and affected parties, including the general public;
The Department of Fisheries is meeting this guideline through a variety of consultative processes. S64 and S65 of the FRMA define the requirement for procedures that must be undertaken before determining or amending all management plans.
Licensees from the MAF have recently established a formal Industry Association called the Aquarium Specimen Collectors Association of WA Inc. This Association should create a better overall communication base for the fishery and improve the image of the fishery. The terms of reference are described in Section 5.4.1.
The MAF is currently undergoing a review of its management plan, which will result in numerous changes to the current management regime and the development of a new management plan in 2005.

ESD Report Series No. 8 – Marine Aquarium Fish Managed Fishery
87
The Department of Fisheries will be consulting with stakeholders (including those listed under the guideline below), during the review and development of the new management plan.
In addition, a workshop was held to seek outside involvement in the development of this report for the MAF. This workshop included industry members, industry representative groups, scientific researchers, other state government agencies and non-government environmental groups. The information that was collected through the workshop has been incorporated into this report.
Ensure that a range of expertise and community interest are involved inindividual fishery management committees and during the stock assessment process;
The range of expertise and community interests that have been involved in the process of determining management and reviewing stock assessments is extensive. The groups that have been involved in the generation and review of the information contained in this ESD report include:
DepartmentofFisheries,WA;DepartmentofConservationandLandManagement,WA;WesternAustralianFishingIndustryCouncil(WAFIC);ConservationCouncilofWA;MarineandCoastalCommunityNetwork;W.A.Museum;andThe Marine Aquarium Industry.
The organisations that were invited but did not attend the workshop included:
DepartmentofEnvironment,WA;DEH;Recfishwest;andCurtin University.
As a result the Department of Fisheries is meeting this objective. See Section 5.4.1.5 for more information.
Be strategic, containing objectives and performance criteria by which the effectiveness of the management arrangements are measured;
The Department of Fisheries is achieving this guideline through the ESD Component Reports. These reports (see Section 5 Performance Reports) contain the available objectives, indicators and performance measures for measuring the effectiveness of the management arrangements for the MAF. For some components, the objectives, indicators and performance measures are well established and the data are available to demonstrate levels of performance over time. For other components, the objectives, indicators and performance measures have only just been developed and/or the necessary data collection is only just being initiated. The status of this information and, where applicable, individual performance criteria, is documented within each of the individual component reports within the National ESD Reporting Framework in Section 5.1-5.4.
Be capable of controlling the level of harvest in the fishery using input and/or output controls;
The FRMA, commercial fishing licence and specifically the management plan for the MAF provides the legislative ability to control the level of harvest within this fishery. This is achieved through the use of effective input and output control measures based upon limited entry, gear restrictions and quotas.

88
ESD Report Series No. 8 – Marine Aquarium Fish Managed Fishery
In the case of the Syngnathid family an annual quota of 750 individuals is set by DEH and an annual report is provided to DEH outlining the past performance in the fishery.
These arrangements have been varied during the past 40 years to ensure that management remains appropriate to achieve the sustainability objectives for the fishery. As was previously discussed the current management plan for the fishery is under review. This review may result in changes to the current management arrangements in an attempt to improve the management regime for the fishery. As a result, the Department of Fisheries is meeting this guideline.
Contain the means of enforcing critical aspects of the management arrangements;
The Department of Fisheries employs operational staff to ensure compliance with the critical aspects of the management arrangements for the MAF. This includes at-sea patrols to ensure restrictions on gear and other operational rules are being adhered as well as inspections of catches at the point of landing and aquarium display centres.
Due to the limited resources available to this fishery, compliance checks are usually conducted in conjunction with other fisheries i.e. when other fisheries are operating in the same area. In 2002/03, of the 3 formal compliance checks for this fishery, none resulted in a breach.
The Department of Fisheries conducted a compliance risk assessment workshop in March 2003 to identify the compliance problems in the MAF. The objectives of the workshop were:
• Toidentifyandassesstheseverityofthecompliancerisksassociatedwiththefisheryandprovidejustificationfortherankingsassigned;
• Toidentifycurrentandfuturecomplianceactivitiesthatcouldbeundertakentoobviatetherisksidentified;and
• Toidentifyanypolicy,managementorlegislativedeficiencieswiththefisherythatmayimpactonthe effectiveness of any compliance activities.
The results from this workshop highlighted the difficulties with the current management plan for proficient compliance checks to be conducted within the fishery. The review of the management plan and development of the new management plan will address the problems and gaps for compliance within this fishery.
Nonetheless given the value of licences and the competitive nature of the industry, fishers themselves are also a source of information on illegal activities. A full summary of these compliance activities and their effectiveness is provided in Section 5.4.1.3. Through the combination of having employed operational staff as well as good dialog with the fishers, the Department is meeting this guideline.
Provide for the periodic review of the performance of the fishery management arrangements and the management strategies, objectives and criteria;
The Department is meeting this guideline through the annual “State of the Fisheries” report and the five-year review of this document. DEH is set to review its stance on the Syngnathidae family at the end of October 2004 when the current declaration regarding the Syngnathidae family is reviewed. There is an annual review of the performance of the major aspects of the fishery through the completion of the “State of the Fisheries” report. This is updated and published each year including periodic reviews by the Office of the Auditor General (OAG). It forms an essential supplement to the Department’s Annual Report to the WA Parliament with the latest version located on the Departmental website www.fish.wa.gov.au.
ESD Report Series No. 8 – Marine Aquarium Fish Managed Fishery
89
The ESD Component Reports contain a comprehensive performance evaluation of the fishery based upon the framework described in the ESD policy (Fletcher, 2002). The reports include the development of objectives, indicators and performance measures for all aspects of this fishery and included status reports for those components that are not subject to annual assessment. The Department intends to complete and review externally this full assessment, including examination of the validity of the objectives and performance measures every five years.
Be capable of assessing, monitoring and avoiding, remedying or mitigating any adverse impacts on the wider marine ecosystem in which the target specieslives and the fishery operates; and
The Department of Fisheries is meeting this guideline through the development of this report. Capabilities for the assessment, monitoring and avoidance, remedying or mitigating any adverse impacts on the wider marine ecosystem are documented in the “General Environment” Section 5.3. This has been completed through a formal risk assessment analysis of the issues and, where necessary, the development of suitable monitoring programs. The risk assessment workshop was a critical part of the mechanisms to identify potential impacts of the MAF on the wider marine ecosystems. This process did not identify any issues that posed greater than a minor risk and hence there is currently no need to implement specific monitoring for such impacts.
Require compliance with relevant threat abatement plans, recovery plans, theNational Policy on Fisheries Bycatch, and bycatch action strategies developed under that policy.
The management regime complies with all relevant threat abatement plans for species where there is an interaction and therefore is meeting this guideline. Details are provided in the “non retained species” section of the ESD report (Section 5.2). In addition the management for all WA fisheries adhere to the relevant international agreements such as the International Convention for the Prevention of Pollution from Ships (MARPOL) and the UnitedNationalConventionontheLawoftheSeas. Furthermore, WA will incorporate the new agreement and decisions decided under CITES into it’s management of seahorses.
A risk assessment workshop was conducted in March 2003 to identify problems associated with compliance within the MAF. It concluded that despite Fisheries Officers encountering or being informed of numerous situations where license holders have been in breach of the management plan, infringements and prosecutions are difficult to achieve given deficiencies in the provisions of the Management Plan. Further workshops need to be held and the issues addressed are considered to be ongoing.
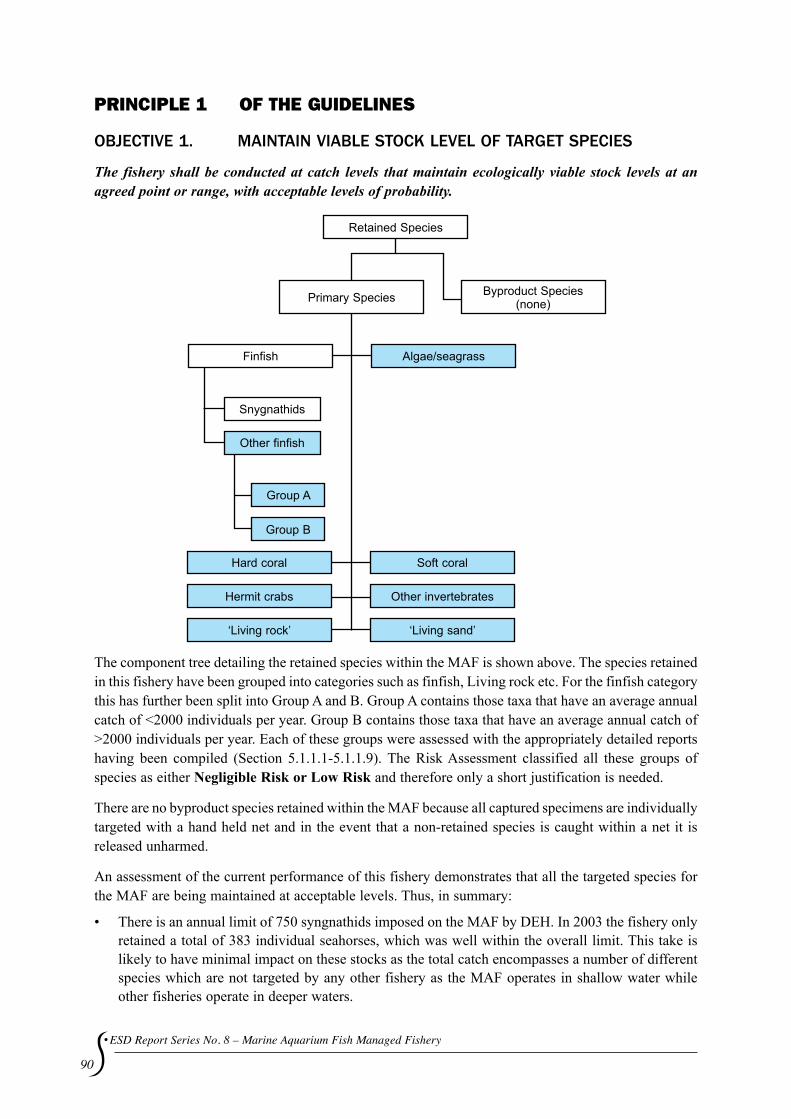
90
ESD Report Series No. 8 – Marine Aquarium Fish Managed Fishery
PRINCIPLE 1 OF THE guIDELINES
OBJECTIVE 1. MaINTaIN VIaBLE STOCK LEVEL OF TaRGET SPECIES
The fishery shall be conducted at catch levels that maintain ecologically viable stock levels at an agreed point or range, with acceptable levels of probability.
Primary Species
Finfish
Snygnathids
Other finfish
Group A
Group B
Hard coral Soft coral
Other invertebrates
‘Living sand’
Hermit crabs
‘Living rock’
Algae/seagrass
Byproduct Species (none)
Retained Species
The component tree detailing the retained species within the MAF is shown above. The species retained in this fishery have been grouped into categories such as finfish, Living rock etc. For the finfish category this has further been split into Group A and B. Group A contains those taxa that have an average annual catch of <2000 individuals per year. Group B contains those taxa that have an average annual catch of >2000 individuals per year. Each of these groups were assessed with the appropriately detailed reports having been compiled (Section 5.1.1.1-5.1.1.9). The Risk Assessment classified all these groups of species as either Negligible Risk or Low Risk and therefore only a short justification is needed.
There are no byproduct species retained within the MAF because all captured specimens are individually targeted with a hand held net and in the event that a non-retained species is caught within a net it is released unharmed.
An assessment of the current performance of this fishery demonstrates that all the targeted species for the MAF are being maintained at acceptable levels. Thus, in summary:
• Thereisanannuallimitof750syngnathidsimposedontheMAFbyDEH.In2003thefisheryonlyretained a total of 383 individual seahorses, which was well within the overall limit. This take is likely to have minimal impact on these stocks as the total catch encompasses a number of different species which are not targeted by any other fishery as the MAF operates in shallow water while other fisheries operate in deeper waters.

ESD Report Series No. 8 – Marine Aquarium Fish Managed Fishery
91
• From2000to2003,thetotalannualcatch(no.ofindividuals)ofotherfinfishbythefisherywas109,757;165,657;104,907;and130,025,respectively.Thetotalcatchesoffinfishbetween2000and 2003 came from 117 families comprising of at least 541 species. Furthermore, not all taxa were reported each year and the number of retained individuals of each taxa was generally very low, i.e. <2000 individuals per year.
• From1998to2000,noalgaewerecollectedbyMAF.In2001-2003thecatchofalgaerangedfrom810 kg to 5081 kg (wet weight). Since 2002 only 1 licensee has collected seagrass, at a rate of 0.5 – 1 kg per month.
• Theannualmaximumtakeofhardcoralwasrecentlyreducedfrom10,000to7,500kg.In2002and2003, total annual catches of hard coral by the whole MAF was approximately 4700 kg. With the development of a new management plan for the MAF, it has been proposed that the total allowable catch be redistributed among all licensees within the fishery. Even with the redistribution the maximum annual allowable take would be 8,500 kg.
• From 2001 to 2003, the catch of soft corals was reported at a family level (2 families) or as“unspecified” soft coral. The catch for 2001 through 2003 was only 118, 1096 and 918 kg, respectively.
• Three licesees are currently permitted to take hermit crabs. The take of hermit crabs includeterrestrial as well as a small number of shallow-water hermit crabs. Between 2002 and 2003, the catch of the terrestrial hermit crabs were 70,055 and 62,935 individuals, respectively, and catches of shallow-water hermit crabs were 14,018 and 323,076 individuals respectively.
• OnlysmallquantitiesofotherinvertebratesarecollectedbytheMAF.From2001to2003,24taxaof “other invertebrates” were collected by the MAF. The composition of the catch has been variable among the years. In 2002 and 2003, anemones (various species) were the most abundant.
• OnelicenseeintheMAFcollectslivesand.Livesandiscollectedasasubstrateforaquariums.In2002 and 2003, only100 kg and 50 kg, respectively, of live sand were collected by the MAF.
Consequently, it is considered that this fishery is meeting the requirement of Principle 1. The information relevant to this principle for these species is detailed below.
Information Requirements
1.1.1 There is a reliable information collection system in place appropriate to the scale of the fishery. The level of data collection should be based upon an appropriate mix of fishery independent and dependent research and monitoring.
Data collection for MAF is largely restricted to fishery dependent data collection systems which currently monitor the catch (species or taxa specific), effort and catch rates for the fishery. Fishers within the MAF provide monthly returns under the statutory catch and effort system (CAES). These returns contain information on catch (individuals caught and spatial area (60 x 60 nm grids)), and days and hours fished by month and year.
It is proposed that the resolution of the information provided by fishers will be increased as part of the revision to the management plan. It is expected that the spatial scale of the blocks will be reduced to 10 x 10 nm, at least in areas where there is relatively high activity levels.
The specific data requirements needed to assess performance for each of the relevant objectives are detailed in the relevant sections of the ESD report, which is in Section 5.1. Retained Species. These requirements are summarised as follows:

92
ESD Report Series No. 8 – Marine Aquarium Fish Managed Fishery
Monitoring Program Information Collected Robustness
CAES Monthly summaries of catch and effort. Available since 1985. Moderate
1.1.2 There is a robust assessment of the dynamics and status of the species/fishery and periodic review of the process and the data collected. Assessment should include a process to identify any reduction in biological diversity and/or reproductive capacity. Review should take place at regular intervals but at least every three years.
This guideline is discussed under 1.1.5.
1.1.3 The distribution and spatial structure of the stock(s) has been established and factored into management responses.
Most of the species of finfish collected by the MAF in both Group A and Group B have extremely large distributions (see section 2 for details).
There is only one syngnathid species, which the fishery catches that is endemic to WA. Hippocampusangustus, has only been recorded from Shark Bay to the Dampier Archipelago (Pogonowski et al. 2002). The other syngnathid species retained by the MAF have a relatively wide distribution, encompassing the waters of WA and at least 1 other Australian state or Territory (Pogonowski et al. 2002). Hence, the total area in which syngnathids are captured by the MAF is very low relative to the total distribution of each species. See section 5.1.1.1 for more information.
In addition, the MAF also collects seagrass and algae, hard and soft coral, live rock, live sand and hermit crabs all of which have extremely large distributions and include a range of species.
1.1.4 There are reliable estimates of all removals, including commercial (landings and discards), recreational and indigenous, from the fished stocks. These estimates have been factored into stock assessments and target species catch levels.
Within the list of monitoring programs outlined below, the MAF data covering each of the sources of removal are outlined. Specific information on the take and risk to species is located in Section 5.1.1
There are no significant indigenous or recreational fishing activities for these species.
Sector Catch Data Collected Frequency Commercial Fishers monthly or trip summaries (CAES). Catch, effort and location. Monthly. Charter Boat N/A N/A Recreational N/A N/A Indigenous N/A N/A
Illegal Estimated from compliance data. Annually.
1.1.5 There is a sound estimate of the potential productivity of the fished stock/s and the proportion that could be harvested.
From 2000 to 2003, the MAF retained finfish from 117 families, comprising at least 541 species. However, not all taxa were reported each year – between 321 and 331 taxa were reported in any single year. The number of retained individuals of each taxa was generally very low, i.e. <2000 individuals per year (Table 5.3).
The finfish taxa are divided into 2 groups, according to the average annual catch level. Group A contains

ESD Report Series No. 8 – Marine Aquarium Fish Managed Fishery
93
those taxa that have an average annual catch of <2000 individuals per year. Group B contains those taxa that have an average annual catch of >2000 individuals per year.
Group A. This group includes 97 % of taxa caught by the fishery. The largest numbers are taken around Roebourne (blocks 2016, 2017) and around the Perth metropolitan area (block 3115). The total catch, however, is spread across a very wide area, comprising 34 MAF reporting blocks (Table 5.5).
The finfish species taken by the MAF tend to be small (<10 cm) and abundant, nearly all of which have biological characteristics (high fecundity, planktonic larvae dispersal, early age-at maturity, etc) that minimise the risk of overfishing. Annual catches of <2000 individuals per species are likely to result in only negligible impacts on the total stock abundance and are also negligible compared with rates of natural mortality (e.g. due to predation). See Section 5.1.1.2 for more information.
Group B. From 2000 to 2003, only 15 finfish taxa had average annual catches of >2000 individuals per year (Table 5.6). Five of these taxa (apogonids, atherinids, clupeids, mugilids and gobiesocids) may represent >1 species, and so annual catches of any individual species within even these taxa may not actually exceed 2000 individuals per year. None of these 15 taxa are listed as threatened (Pogonowski et al. 2002).
The Group B taxa have biological characteristics that minimise the risk of overfishing. All are relatively abundant species that have a wide distribution. The abundances of these taxa are high, partly because they occur in a range of habitat types and have broad diets (either omnivorous or planktivorous), and so are not strongly affected by food or habitat limitations. Most of these taxa have an early age-at-maturity, are highly fecund and produce pelagic eggs and/or larvae, which allows dispersal over long distances and promotes recruitment across a broad area.
The risk of even localised depletion for these species is low because rates of population growth by these species are relatively rapid and they can sustain moderate levels of fishing. Also, annual population replenishment of these species occurs via recruitment of planktonic larvae which are independent of local population abundance. The total area in which these taxa are captured by the MAF is very small relative to the total distribution of each species, and so the impact of the MAF on the total breeding stock of each species is likely to be low. See Section
5.1.1.2 for more information.
Management Responses
1.1.6 There are reference points (target and/or limit) that trigger management actions including a biological bottom line and/or a catch or effort upper limit beyond which the stock should not be taken.
Due to the small number of each of the individual finfish species taken, there are currently few specific triggers or reference points. As discussed above, the finfish taxa are divided into two groups according to the average annual catch level.
Group A contains those taxa that have an average annual catch of <2000 individuals per year. This group includes 97% of the taxa caught by the fishery (Table 5.2). Annual catches of <2000 individuals per species are likely to be negligible compared with the total stock abundance and also negligible compared with the rates of natural mortality (e.g. due to predation) and therefore no specific management actions beyond the current levels are required.
Group B From 2000 to 2003, most of the Group B taxa were taken for the purpose of supplying live

94
ESD Report Series No. 8 – Marine Aquarium Fish Managed Fishery
food. The current MAF Management Plan does not refer to the taking of fish for live food. With the Management Plan currently under review, the take of fish for live food will be prohibited within the MAF.
A specific level (for the total take of both Groups) that will trigger a review will be developed as part of the revision of the management plan. If the total catch of both groups exceeds the determined trigger level, this will result in the risk levels being re-examined and potentially individual limits for some species/groups may then need to be considered.
Syngnathids The take of syngnathids by this fishery is already controlled by an annual limit set by DEH. The annual limit set for the MAF by DEH is 750 syngnathids. This annual limit is not species dependent and made up of four to six species of syngnathids. If this limit is exceeded in any given year, the Department is required to prepare a report to DEH indicating why the take was exceeded. In 2002 833 syngnathids were taken and as a result a report was submitted to DEH (Appendix 5).
The review of the Management Plan is currently developing species-specific quotas, and it is envisaged that the total syngnathid quota (6 species) will be distributed among the licensees when the plan is implemented during 2005.
Other The take of algae, seagrass, coral, hermit crabs, other invertebrates and live rock and sand are managed by input controls in particular by specific licence endorsements that allow certain fishers the ability to take these groups of species. Currently, under the management their managed fishery licence does not cover plan the take of these groups of species and fishers wanting to take these groups must have a specific endorsement. It is anticipated that the new plan will include these groups of species, and quotas on the MAF licence.
While the take of hard coral is managed through a CFL endorsement, the Department has set an annual maximum amount, which is allowed to be taken. This maximum has recently been reduced, through non-renewal of a licence, from 10,000 kg to 7,500 kg. Additionally, the Department is investigating the redistribution of the total allowable catch of hard coral among all licensees in the fishery through the new management plan. Under this proposal, the 4 current licensees with 2000 kg coral quota would be reduced and allocated 1,000 kg per year and the remaining 9 licensees would be allocated 500 kg per year. If all these license options are exercised the Department would set a revised maximum limit of 8,500 kg.
With the development of the new management plan the take of all species will be reviewed and in particular, the take of coral will be investigated and reviewed by an expert panel. The coral expert panel will review the current take of coral by the MAF and develop a robust list of coral species, which the MAF should be allowed to take.
1.1.7 There are management strategies in place capable of controlling the level of take.
A full discussion of the main regulations and their justifications are located in Section 2.5. The following is a summary of the management arrangements for the fishery:
It is a limited entry fishery with 13 Managed Fishery Licence (MFL) holders operating on a State-wide basis. Licensees are permitted to take species of the Classes Chondrichthyes and Osteichthyes (that is, cartilaginous and bony fishes respectively) for marine aquarium purposes using hand-held nets.
The licensee or nominated operator must not work with more than two nominated divers at any one time and no more than two authorised vessels may be used in the fishing operation (that is, a ‘mother boat’ and an ‘auxiliary boat’). An authorised boat (whether a ‘mother’ or ‘auxiliary’ boat) must not be

ESD Report Series No. 8 – Marine Aquarium Fish Managed Fishery
95
replaced by a vessel greater than eight (8) metres in length. Fish are only allowed to be collected by a net or nets held in the hand.
It should also be noted that MAF licensees have drafted a Code of Practice (Appendix 6), which advocates responsible fishing practices above and beyond what is legislated. The Code will formalise common practices such as not collecting breeding pairs, not repeatedly collecting from the same discrete area or not operating in popular locations during tourist season. While the Code itself will not be legislated the possibility of some of the fishing practices outlined in the code being incorporated into the revised management plan, or being placed as a condition on the MFL.
It is the Department’s intention that following the management review, all MFL holders will have access to coral, ‘live’ rock and ‘live’ sand quota for marine aquarium purposes. The Department intends to compile a report identifying any species (or groups of species) that may be vulnerable to exploitation and then depending on the outcomes of that report introduce ‘quotas’ for those particular species. The preparation of this report will involve consultation and liaison with sygnathid expertise in agencies other than the Department of Fisheries.
As part of the review the Department is also looking to increase the spatial resolution of the catch and effort data provided by MFL holders in the MAF to improve the information available to monitor performance.
1.1.8 Fishing is conducted in a manner that does not threaten stocks of by-product species.
There are no by-product species taken by this fishery.
1.1.9 The management response, considering uncertainties in the assessment and precautionary management actions, has a high chance of achieving the objective.
The MAF is currently managed through input and output controls including gear and effort restrictions, and licence endorsements with specific quotas. The relatively limited area where fishing occurs compared to the wide distribution of these species both in WA and across this geographic region, combined with the small number of operators in this fishery and the improvements to management outlined above make it highly likely that the objective of maintaining adequate stocks of these species will be met.
OBJECTIVE 2. RECOVERY OF STOCKS
Where the fished stock(s) are below a defined reference point, the fishery will be managed to promote recovery to ecologically viable stock levels within nominated timeframes.
Not applicable.
PRINCIPLE 2 OF THE guIDELINES
OBJECTIVE 1. BYCaTCH
The fishery is conducted in a manner that does not threaten bycatch species.
Because of the restrictions placed on the gear that can be used and the highly selective fishing methods that are employed there are no by catch associated with the Marine Aquarium Fishery.
Information Requirements
96
ESD Report Series No. 8 – Marine Aquarium Fish Managed Fishery
2.1.1 Reliable information, appropriate to the scale of the fishery, is collected on the composition and abundance of bycatch.
Not Applicable
assessments
2.1.2 There is a risk analysis of the bycatch with respect to its vulnerability to fishing.
Not Applicable
Management Responses
2.1.3 Measures are in place to avoid capture and mortality of bycatch species unless it is determined that the level is sustainable (except in relation to endangered, threatened or protected species). Steps must be taken to develop suitable technology if none is available.
Not Applicable
2.1.4 An indicator group of by-catch species is monitored.
Not applicable.
2.1.5 There are decision rules that trigger additional management measures when there is significant perturbation in the indicator species numbers.
Not applicable.
2.1.6 The management response, considering uncertainties in the assessment and precautionary management actions, has a high chance of achieving the objective.
Given that there are no known interactions of the MAF with non-retained species and the selective method of fishing used (diving, collection by hand only) in the fishery it is likely that the level of interaction will continue to be only minimal with only acceptable levels of impact occurring.
OBJECTIVE 2. PROTECTED/LISTED SPECIES
The fishery is conducted in a manner that avoids mortality of, or injuries to,endangered, threatened or protected species and avoid and minimises impacts on threatened ecological communities.
Information Requirements
2.2.1 Reliable information is collected on the interaction with endangered, threatened or protected species and threatened ecological communities.
The MAF is allowed to take species from the Syngnathid family, which is listed under the EPBC Act. The annual limit is set by DEH at 750 syngnathids. No leafy sea dragons are permitted to be taken by this fishery. There is no evidence of decline for any syngnathid species retained by the MAF (Pogonowski et al., 2002).
At least six species of syngnathids have been retained by the MAF in the past, although only four are generally targeted. Hippocampusangustusis endemic to Western Australian waters and has been recorded from Shark Bay to the Dampier Archipelago (Pogonowski et al. 2002). The other syngnathid
ESD Report Series No. 8 – Marine Aquarium Fish Managed Fishery
97
species retained by the MAF each have a relatively wide distribution, encompassing the waters of WA and at least 1 other Australian state (Pogonowski et al. 2002). Hence, the total area in which syngnathids are captured by the MAF is very low relative to the total distribution of each species.
There are no known interactions between the MAF and any other endangered, threatened, or protected species or threatened ecological communities. Due to the relatively selective method used in this fishery it is unlikely that the MAF has interactions with endangered, threatened or protected species. Furthermore, there is minimal chance for interactions through boat strikes because the boats are small and moving at relatively slow speeds which allow for most species (eg turtles, whales etc) to be avoided and/or species to move away from the boats.
assessments
2.2.2 There is an assessment of the impact of the fishery on endangered, threatened or protected species.
There is a blanket restriction on the Syngnathid family that states that only 750 are allowed to be taken each year in the fishery and if this figure is exceeded justification needs to be given by the Department. In 2002, 833 syngnathids were taken which was over the allotted amount. The Department developed a report to outline the reason why this catch went over as well as the implications it would have on the species. This report is detailed below and a letter that was sent to Environment Australia by the Department of Fisheries Western Australia (see Appendix 5). Licensees were notified of their breach of the limit, and the Department intends to implement species specific quotas to licensees with a total sygnathid quota of 750.
The syngnathid species primarily taken are widely distributed within WA waters and occur in both shallow and deep waters in both urban and remote locations. It is estimated that 80% of populations occur in areas that receive little to no impact from fishing (based on the distributional ranges and the spatial catch and effort data). Consequently, the relatively small take of each species by licensees in the MAF is highly unlikely to have an unsustainable impact on the wild populations.
2.2.3 There is an assessment of the impact of the fishery on threatened ecological communities.
There are no threatened ecological communities associated with the MAF.
Management Responses
2.2.4 There are measures in place to avoid capture and/or mortality of endangered, threatened or protected species.
Current management arrangements prohibit the landing of the leafy seadragon (Phycodurus eques).
2.2.5 There are measures in place to avoid impact on threatened ecological communities.
Not applicable given nature and size of operations.
2.2.6 The management response, considering uncertainties in the assessment and precautionary management actions, has a high chance of achieving the objective.
Given the extremely low levels of interaction of this fishery with protected species, it is more than likely that the current situation of having only negligible impacts on these species will continue.

98
ESD Report Series No. 8 – Marine Aquarium Fish Managed Fishery
OBJECTIVE 3. GENERaL ECOSYSTEM
The fishery is conducted, in a manner that minimises the impact of fishing operations on the ecosystem generally.
Impacts on the biological community
Removal of/damage to organisms
addition/movement of biological material Damage to Habitats Air Quality
(fuel usage/exhaust fumes)
Water Quality
Substrate Quality
Fishing (trophic interactions) Discarding Anchoring
Benthic Biota Translocation
Other
General Environment
The issues that relate to the broader ecosystem identified for the MAF are shown below in the component tree. A formal risk assessment process subsequently assessed each of these issues with the information relating to each issue detailed in Section 5.3.
Of the issues identified for the MAF, all were considered of NEGLIGIBLE or LOW risk (trophic interactions, benthic biota, anchoring, translocation by vessel hulls and exhaust fumes). Consequently, the MAF’s current performance is meeting Objective 3 and this acceptable performance is likely to at least continue or improve in the future.
Information Requirements
2.3.1 Information appropriate for the analysis in 2.3.2 is collated and/or collected covering the fisheries impact on the ecosystem and environment generally.
Appropriate levels of information have been obtained for most of the issues identified, which has allowed a sensible assessment of the level of risk to be made. This information includes data collected, which is directly related to the MAF -in terms of levels of catch and effort.
2.3.2 Information is collected and a risk analysis, appropriate to the scale of the fishery and its potential impacts, is conducted into the susceptibility of each of the following ecosystem components to the fishery.
A formal risk assessment was completed (see Section 5.3 for details) on each of the identified issues relevant to the MAF (see component tree for issues). The identified issues were assessed and a summary of the outcomes is located in the Summary Table below. Complete justifications are located in the performance reports in Section 5.3.

ESD Report Series No. 8 – Marine Aquarium Fish Managed Fishery
99
Summary table of risk assessment outcomes for environmental issues related to the MAF.
ISSUES RISK SUMMARY JUSTIFICATION FULL DETAILS
Removal of /damage to the environment: 5.3.1
Trophic interactions Negligible Most of the finfish species in the MAF catch are small-sized (<10 cm). Many are planktivorous. Many are prey to piscivorous birds and larger fish. Most of the invertebrate in the MAF catch are also small-sized. Most consume plankton or detritus. There is no evidence that any finfish or invertebrate species play a ‘keystone’ role in the ecosystem. Therefore, the majority of the species within these 2 groups are similar in their trophic function and it is appropriate to consider the impact of total finfish and total invertebrate removals by the fishery.
5.3.1.1
Benthic Biota (non target species)
Negligible The fishery will not affect any group that is not targeted. 5.3.1.2
Anchoring Negligible There are 13 licencees operating in the fishery, all of whom use relatively small (<12 m) vessels. The fishery extends the entire length of the Western Australian coastline and some collection activities (e.g. collection of hermit crab) are not undertaken from a vessel.
5.3.1.3
Addition/Movement of Biological Material:
5.3.2
Translocation by Vessel Hulls
Low There are 13 licencees operating in the fishery, all of whom use relatively small (<12 m) vessels. The fishery extends the entire length of the Western Australian coastline and some collection activities (e.g. collection of hermit crab) are not undertaken from a vessel.
5.3.2.1
Other Environmental Impacts:
5.3.3
Exhaust Fumes Negligible Same as above. 5.3.3.1 Oil Discharge Negligible Same as above. 5.3.3.2
Management Response
2.3.3 Management actions are in place to ensure significant damage to ecosystems does not arise from the impacts described in 2.3.1.
None of the activities were identified as posing sufficient risk to warrant specific management attention. Reports are available in Section 5.3.
2.3.4 There are decision rules that trigger further management responses when monitoring detects impacts on selected ecosystem indicators beyond a predetermined level, or where action is initiated by ESD report of the precautionary approach.
Not applicable.
2.3.5 The management response, considering uncertainties in the assessment and precautionary management actions, has a high chance of achieving the objective.
The risk assessment identified that under current management arrangements there have been minimal or negligible impacts from the MAF on the broader ecosystem. It is, therefore, highly likely that the fishery will continue to meet the objectives of having only acceptable levels of impact. If future studies indicate that further management is required for one or more of the various habitat types, then appropriate actions will be developed.
100
ESD Report Series No. 8 – Marine Aquarium Fish Managed Fishery
APPENDIX 8 APPROVAL AND RECOMMENDATIONS FROM DEHThe Hon Jon Ford MLCMinister for Fisheries11th Floor Dumas House2 Havelock StWest Perth WA 6005
Dear Minister
I am writing to you as Delegate of the Minister for the Environment and Heritage in relation to the assessment of the Western Australian Marine Aquarium Fish Managed Fishery under the Environment Protection and Biodiversity Conservation Act 1999 (the EPBC Act). In August 2004 the Department of Fisheries Western Australia (DFWA) submitted the document entitled Final ESD report to the Australian Government DepartmentofEnvironmentandHeritageontheMarineAquariumFishManagedFishery for assessment under the EPBC Act.
The submission has been assessed for the purposes of the protected species provisions of Part 13 and the wildlife trade provisions of Part 13A of the EPBC Act.
I am pleased to advise that assessment of the fishery is now complete. The assessment report will be available on the Department of the Environment and Heritage (DEH) website at: http://www.deh.gov.au/coasts/fisheries/wa/marine-aquarium/index.html.
I am satisfied that the operation of the fishery is consistent with the objects of the wildlife trade provisions in Part 13A of the EPBC Act. I am also satisfied that it is unlikely to be detrimental to the survival or conservation status of any taxon to which the fishery operation relates, or threaten any relevant ecosystem. The fishery is relatively well managed and operates under an adaptable and precautionary regime capable of controlling, monitoring and enforcing the level of take from the fishery. Performance against the Australian Government Guidelines for the Ecologically Sustainable Management of Fisheries is adequate, however there are a number of issues that need to be addressed to contain environmental risks in the longer term. Hence, I propose to declare the fishery an approved Wildlife Trade Operation (WTO), under Part 13A of the EPBC Act. This declaration would allow the export of product from the fishery for the next three years. I will make the declaration subject to the conditions at Attachment A.
I also propose to include product from this WTO fishery on the List of Exempt Native Specimens (LENS) so that exporters would not require EPBC Act export permits. Please note that the LENS listing excludes any species listed under the Convention on the International Trade in Endangered Species of Wild Flora and Fauna (CITES). Exporters will be required to apply to DEH for a CITES export permit to export any CITES listed species including Hippocampus seahorses and hard coral.
The management regime aims to ensure that fishing is conducted in a manner that does not lead to over-fishing and for fishing operations to be managed to minimise their impact on the structure, productivity, function and biological diversity of the ecosystem. On balance, the fishery is being managed in an ecologically sustainable manner and is working to address existing problems and to minimise environmental risks.
While there are some environmental risks associated with this fishery, I believe that DFWA is committed to addressing these issues and is already taking proactive steps in some areas. Officers from our two departments have discussed key areas requiring ongoing and increased attention. I understand that they have agreed to a number of recommended actions, focusing on addressing key issues, to be implemented before the next Australian Government review of the fishery. The recommendations (Attachment B) have been an important factor in my decision to declare

ESD Report Series No. 8 – Marine Aquarium Fish Managed Fishery
101
the fishery a WTO and I look forward to receiving your confirmation that they will be implemented.
At this time, I am not satisfied that the management arrangements for the fishery require that all reasonable steps are taken to ensure that protected species are not injured or killed. I note that the fishery is in a developing stage and there is currently no restrictions on the harvest of species protected or listed under the EPBC Act. Consequently, there are also no mechanisms in place in the management regime for the fishery to explicitly prohibit the take of any EPBC Act listed threatened fish or to prohibit the take of listed marine species in Commonwealth waters. I understand that DFWA is aware that accreditation of the fishery under these components of Part 13 of the EPBC Act is not possible at this time, and has agreed that if operators wish to harvest listed marine species in Commonwealth waters in the future, a wildlife conservation plan will be negotiated between DBIRD and DEH and implemented. This arrangement has been included as a condition on the WTO declaration for this fishery. Accreditation will be granted for cetaceans, as the management arrangements in the fishery do not permit the harvest of cetaceans as listed under the EPBC Act.
I would like to thank you for the constructive way in which your officials have approached this assessment.
Yours sincerely
[Signed]
LARA MUSGRAVEDelegate of the Minister for the Environment and Heritage11th October 2005

102
ESD Report Series No. 8 – Marine Aquarium Fish Managed Fishery
Conditions on the approved wildlife trade declaration for the Western australian Marine aquarium fish Managed fishery
Relating to the harvesting of fish specimens that are, or are derived from, fish or invertebrates taken in the MAF.
1. Operation of the fishery will be carried out in accordance with the Western Australian Marine Aquarium Fish Management Plan 1995 and associated management regime in force under the Western Australian Fish Resources Management Act 1994 and the Western Australian Fish Resources Management Regulations 1995.
2. The Western Australian Department of Fisheries (DFWA) will advise DEH of any material change to the MAF’s legislated management plan and/or arrangements that could affect the criteria on which EPBC decisions are based, within three months of that change being made.
3. The declaration covers the Western Australian Marine Aquarium Fish Managed Fishery only to the extent that the Western Australian Marine Aquarium Fish Managed Fishery relates to specimens that:
i. are not listed under Part 13 of the EPBC Act, or ii. are listed marine species that are not taken in the Commonwealth marine area, or iii. are listed marine species that are taken in the Commonwealth marine area ac-
cording to the specifications of a wildlife conservation plan negotiated between DFWA and DEH.
4. Reports to be produced and presented to DEH annually, and to include: i. information sufficient to allow assessment of the progress of DFWA in imple-
menting the recommendations made in the Assessment of the Western Australian Marine Aquarium Fish Managed Fishery 2005;
ii. A description of the status of the fishery and catch and effort information; iii. A statement of the performance of the fishery against objectives, performance
indicators and measures once developed; and iv. Research undertaken or completed relevant to the fishery.

ESD Report Series No. 8 – Marine Aquarium Fish Managed Fishery
103
Recommendations to DfWa on the ecologically sustainable management of the Western australian Marine aquarium fish Managed fishery
The Western Australian Marine Aquarium Fish Managed Fishery (MAF) is a relatively well-managed fishery with a range of management measures to promote the ecologically sustainable harvesting of species from the fishery including limited entry, gear restrictions and area restrictions that should enable the fishery to be ecologically sustainable in the short to medium term. Stocks are not currently overfished and the management arrangements provide the basis to ensure that fishing is conducted in a manner that will not lead to over-fishing.
While management is appropriately precautionary, issues that must be managed to ensure that their impacts are minimised include a lack of information on critical elements of species biology, potential for localised depletion of some species targeted in the fishery, lack of data validation for commercial catch data and current absence of strategies to address identified compliance risks. The fishery also targets seahorses listed under the Convention on the International Trade in Endangered Species of Wild Flora and Fauna (CITES) and syngnathids listed under Part 13 of the EPBC Act. Therefore special consideration is needed to ensure the ecological sustainability of these species and to ensure that international conventions are being adequately addressed.
The following recommendations aim to address these risks and uncertainties. DFWA should action these recommendations before the next review in 2008 within the timeframe specified in individual recommendations.
Recommendations1. DFWA to advise DEH of any material change to the MAF’s legislated management plan and/or
arrangements that could affect the criteria on which EPBC Act decisions are based, within three months of that change being made.
2. The ESD Report, including all performance measures, responses and information requirements to be incorporated into the management regime and decision making process.
3. DFWA to consult with DEH prior to a change to the management arrangements for a CITES or EPBC Act listed species being implemented.
4. Within 18 months DFWA to develop and implement strategies to address identified compliance risks within the fishery.
5. DFWA to implement data validation mechanisms for CITES and EPBC Act listed species harvested in the fishery within 18 months.
6. Within 2 years DFWA to develop and implement a research strategy to gather further information on the stock status, biology and ecology of CITES and EPBC Act listed species. DEH notes that the research strategy will need to be implemented within the constraints of available resources.
7. Within 2 years DFWA to identify species at risk of localised and serial depletion and to implement management measures to mitigate these risks in the fishery.
8. Within 12 months DFWA to develop a timeline for the implementation of proposed changes to the Management Plan for the MAF, as outlined in the DFWA submission.
9. DFWA to provide a mechanism which allows fishers to record interactions with protected/listed species. DFWA to ensure that industry has the capacity to make these reports at an appropriate level of accuracy.

104
ESD Report Series No. 8 – Marine Aquarium Fish Managed Fishery


![[eBook] - Aquarium - The Reef Aquarium - Vol.2](https://static.fdocuments.net/doc/165x107/5571f8b649795991698deee2/ebook-aquarium-the-reef-aquarium-vol2.jpg)