ESD Risk Assessment of proposed Deep Water Crab fishery. · ESD Risk Assessment of proposed Deep...
32
ESD Risk Assessment of proposed Deep Water Crab fishery. PIRSA Fisheries and Aquaculture January 2015
Transcript of ESD Risk Assessment of proposed Deep Water Crab fishery. · ESD Risk Assessment of proposed Deep...

ESD Risk Assessment of proposed Deep Water Crab fishery.
PIRSA Fisheries and Aquaculture
January 2015

2
Table of Contents 1 Introduction ........................................................................................................................... 3
1.1 Exploratory and Developmental Permits ........................................................................ 3
1.2 Proposed Exploratory Activity ........................................................................................ 3
2 Deep Water Crab .................................................................................................................. 3
2.1 Biological information ..................................................................................................... 4
2.2 Movement ...................................................................................................................... 4
2.3 Other Species ................................................................................................................ 4
3 Related fisheries ................................................................................................................... 5
3.1 Giant Crab Fishery ......................................................................................................... 5
3.2 Rock Lobster Fishery ..................................................................................................... 5
3.3 Western Australia deep water crab fishery..................................................................... 5
4 Environment .......................................................................................................................... 6
5 Social and Economic Information .......................................................................................... 6
6 Methodology - ESD Risk Assessment ................................................................................... 7
8 Results ................................................................................................................................ 11
8.1 Issues related to the retained species (All Sectors) ..................................................... 11
8.2 Issues related to the non retained species ................................................................... 13
8.3 Issues related to the general environment impacts of a fishery ................................... 15
8.4 Contribution of the fishery/industry to community wellbeing ......................................... 16
8.5 Issues related to the governance of the fishery/industry .............................................. 17
8.6 External Impacts Affecting Performance of the proposed activity: ............................... 20
8.7 Summary of ESD Reporting Framework ...................................................................... 21
8.8 Performance report for high and medium risk components .......................................... 21
9 References .......................................................................................................................... 27
10 Appendix ............................................................................................................................. 29

3
1 Introduction
An application for an exploratory or developmental permit to harvest deep water crabs in the waters of
South Australia greater than 300m has been received by PIRSA Fisheries and Aquaculture.
An Ecologically Sustainable Development (ESD) risk assessment is a necessary part of the process of
assessing experimental or developmental permit applications. The ESD risk assessment process
examines an extensive range of issues, risks and opportunities identified by stakeholders and provides
a method for ranking the identified risks based on consequence and likelihood.
1.1 Exploratory and Developmental Permits
Experimental and Developmental Fishery permits are provided to fishers to develop new commercial
fisheries based on new species or areas not part of an existing fishery. These permits have been
available since December 2013. Initially, an exploratory fishery permit would be provided to allow the
gathering of preliminary information to determine the feasibility of commercially harvesting the aquatic
resource. If deemed feasible, a developmental fishery permit would then be provided to enable a more
rigorous assessment of the commercial potential of a fishery, in order to demonstrate that it is
ecologically sustainable, economically viable and socially acceptable.
1.2 Proposed Exploratory Activity
The exploratory fishery application has identified the following Crustaceans as the primary targets:
Chaceaon bicolour or similar (Crystal Crab), Champagne Crab (Hypothalassia acerba) or similar. Other
species of crabs may be encountered and retained to investigate market potential.
Access to the resource is requested year round in waters in South Australian waters >300m using pots
currently used in the Rock Lobster/Giant Crab Fishery. That is are steel-framed rock lobster pots fitted
with moulded plastic necks and covered in 50 x 75 mm plastic mesh. Escape gaps will be fitted on the
pots. The activity proposed is for 500 baited pots to be operated in “long lines” with 80 to 180 pots
strung together with a line with one headline and bouy attached to the string.
2 Deep Water Crab
Crystal crabs (C. bicolour) previously known as snow crabs inhabit waters of the continental slope
on substrates of sand, mud or shell debris in depths from 200-2000 m (Jones and Morgan 2002),
however in WA reported commercial catches have been limited to depths of 450-1220 m
(Melville-Smith et al. 2003) where temperatures average 4-6.5°C (Melville-Smith et al. 2007). Up
to 2003 over 90% of the catch of crystal crabs from WA was obtained between 500-800 m depth
(Melville-Smith et al. 2003). At the shallow end of their range (300-400 m) a higher proportion of
female crystal crabs are present, at intermediate depths the ratio of males to females is equal,
while at around 800-900 m depth the population is dominated by males (MESA 2014). Crystal
crabs can achieve a maximum carapace width (CW) of 180 mm, their range includes western,
northern and eastern Australia but their precise distribution is unknown (Jones and Morgan 2002).
In WA their range extends from Exmouth in WA to the WA/SA border (Melville-Smith et al. 2003),
their existence East of the 120° line of longitude in the Great Australian Bight has not been
confirmed as while conducting surveys it was found that sea lice had removed all bait from pots in
this area (Chuwen and Stevens 2006).

4
Champagne crabs (Hypothalassia acerba) also known as the spiny deepwater crab are usually
caught on substrates of sand and rock at depths of 30-550 m (Jones and Morgan 2002), while
Smith et al. (2004b) reported that in WA H. acerba is typically caught in water of 90-310 m depth
and Melville-Smith (2007) reported that the abundance of champagne crabs peaked at 145-200m
depth. Champagne crabs can achieve a maximum size of 150 mm CW, their range extends from
Kalbarri WA (Smith et al. 2004b), east to northern NSW (Jones and Morgan 2002).
2.1 Biological information
Spawning of crystal crabs occurs throughout the year due to a lack of seasonal environmental
variation in the deep waters of the continental slope. This was supported by capture of ovigerous
females in 11 month of the year (Chuwen and Stevens 2006) on the lower West Coast of WA.
Estimates of size at first maturity (SAM) for crystal crabs were 90 mm and 94 mm carapace
length (CL) for females and males respectively (Chuwen and Stevens 2006). However it has
been noted these estimates of SAM may be underestimated due to selective sampling a result of
using baited pots (Smith et al. 2004a). Crystal crabs are very slow-growing and long lived making
them susceptible to overfishing (Smith et al. 2004b). Estimates of growth suggest that males
reach maturity and minimum legal size (MLS) at around 12 and 14 years respectively and large
crabs are around 30 years old (Melville-Smith et al. 2007). The growth rate of crystal crabs was
found to vary with temperature, with a difference of around 4 years to reach MLS at temperatures
of 6-14° C (Melville-Smith et al. 2007). Catches of male crystal crabs has been found to be
consistently higher (4:1) than for female crabs. The behavioural characteristics of male crystal
crabs are thought to increase their catchability, rather than an imbalance in the sex ratios lower
(Chuwen and Stevens 2006).
Notable differences between the spawning of champagne and crystal crabs were reported by
Melville-Smith (2007) who found that champagne crabs on the lower West Coast of WA exhibit
seasonal maturation, which results in females maturing progressively between July and
December and egg bearing between January and March. On the South Coast of WA the patterns
of maturation were markedly different with indications that conditions in this area were not
conducive to spawning and that there may be a migration from the South to the West coast to
breed. The SAM of female champagne crabs was estimated at 69.7 mm CL but it is thought that
this could be an underestimate due to the selectivity for mature animals when animals are
collected using baited pots (Smith et al. 2004a).
2.2 Movement
A study by Melville et al. (2007) on the movement of crystal crabs in WA found that their
movements are typically random. The majority of crabs moved less than 50 km when at large for
extended periods of up four years. A small proportion (~2%) were recaptured more than 100 km
from their release location.
2.3 Other Species
Other crustaceans which inhabit South Australian continental slope waters of depth greater than
300 m.
Scampi Metanephrops australiensis (170-1000 m depth)
Spider crab Lepomithrax gaimardii (0-820 m depth)
Small crab (up to 15 mm CW) Ebalia intermedia (0-550 m depth)

5
Small crab (up to 40 mm CW) Pilumnus tomentosus (0-550 m depth)
3 Related fisheries
3.1 Giant Crab Fishery
Fishing for Giant Crabs is predominately in water from 100-200m. Further information about the
commercial Giant Crab Fishery can be found in the report ‘A report prepared for Environment Australia
on the Management of the South Australian Giant Crab (Pseudocarcinus gigas) Fishery1’.
A total allowable commercial catch is set for Giant Crab annually distributed between quota holders with
some quota held aside to account for by-catch of Giant Crabs allowed for Rock Lobster Fishery licence
holders who do not hold Giant Crab quota. A closed season, minimum legal size limit, maximum number
of pots allowed and protection of spawning females are also in place.
3.2 Rock Lobster Fishery
Fishing for Rock Lobster is generally in shallower water (<100 m) than that for giant Crab or the
proposed activity. Further information about the Rock Lobster Fishery can be found in the management
plans for the commercial Southern and Northern Zone Rock Lobster Fishery. A total allowable
commercial catch is set for Rock Lobster annually. A closed season, minimum legal size limit, maximum
number of pots allowed and protection of spawning females are also in place.
3.3 Western Australia deep water crab fishery
In WA small catches of crystal crab have been reported since 1993, however a significant
commercial fishery based on Chaceon albus (separate species from C. bicolour ) and
champagne crabs (H. acerba) has been in operation since 1997. Both C. albus and H. acerba are
highly valued with the majority of the catch exported live to Asia.
The maximum landed weight of crystal crabs peaked at 222 t in 2001, with the majority of this
taken from the lower West Coast, while catches on the south coast peaked at around 14 t in 2009
(How and Nardi 2013). In recent years the maximum yield has been set at 140 t per annum for
Crystal Crab in the West Coast fishery with no TACC set for the South Coast.
Champagne crabs have been harvested in WA since 1989 by western rock lobster fishers
working in deep water, the maximum landed weight peaked at 50 t in 1998 in the Western Coast
Fishery and above 30t in 1997 in the South Coast Fishery. The TACC is now set at 14 t of
Champagne and Giant Crab combined for the West Coast fishery (How and Nardi 2013) with no
TACC set for this species in the South Coast fishery.
Between 1997 and 1999 Champagne crab was intensively targeted and the stocks did not
withstand the fishing pressure resulting in a decline in stocks (Melville-Smith et al. 2007).
The deep-water crab fishery in WA mostly operates in depths of 500-800 m using baited pots
operated in “long lines” with 80 to 180 pots in a string (How and Nardi 2013) with average soak
1 Report can be viewed at http://www.pir.sa.gov.au/fisheries/commercial_fishing/commercial_fisheries/miscellaneous_fishery

6
times of 3-7 days (Melville-Smith et al. 2003), and on average around 400-500 pots pulled each
day (Melville-Smith et al. 2007). In one instance a string of pots was left unintentionally for a
period of 54 days, this resulted in a catch rate of around double the average. As no bait remained
in these pots at the time of retrieval it is thought that the pots were being used for shelter
(Chuwen and Stevens 2006). Transportation of crystal crabs requires submersion in refrigerated
holding tanks which specialist vessels to maintain product quality (Chuwen and Stevens 2006).
The WA fishery is managed using a stock assessment which aims to assess the status of the
deep sea crab stocks by investigating the commercial catch from logbook returns (How and Nardi
2013). Fishers are required to record data on detailed daily catch and effort for legal and sub-
legal sized crabs and berried crabs (Melville-Smith et al. 2007). The fishery is managed using a
range of control measures, these include restrictions on effort by limiting the number of pots in the
water at any time, gear restrictions by mandating the use of escape gaps and their size (56 mm
high and 301 mm long (Melville-Smith et al. 2007)) and by imposing a conservative MLS. In the
WA fishery biological restrictions mandate that all crabs bearing eggs and those with a carapace
width (CW) of less than 120 mm and 92 mm for crystal and champagne crabs respectively be
returned to the water. The use of escape gaps has been found to be effective for female crabs
but allows ~16% of legal-sized male crabs to escape (Melville-Smith et al. 2007). Catch per unit
effort (CPUE) of crystal crabs from the West Coast of WA increased from 1.2 to 2.86 kg/pot lift
from 1999 to 2000 as result of increased knowledge of fishers and has since declined to 1.52 in
2003 and subsequently increased to 1.89 kg/pot lift in 2005 (Melville-Smith et al. 2007) It was
found that the size of the pots influenced the number of crabs caught with an increase in pot
volume resulting in a proportional increase in catch (Chuwen and Stevens 2006). Extraction rates
are estimated at less than 3 kg of crabs per year from each square kilometre of suitable habitat
(500 -1000 m water depth (Melville-Smith et al. 2010)).
4 Environment
The proposed activity includes deep water (> 300 m) off the coast of South Australia out to the edge of
the Australian concomic Exclusion Zone at 200 nm from the coast of South Australia.
The proposed area includes flat continental shelf to about 200 m dropping away rapidly at the
continental shelf.A weak current flows eastwards along the continential slope, turning to the south at
Bass Strait. Strong winds in summer often bring about upwelling of cool nutrient rich water in South
Australia. Water temperates gradually decline to depths of about 200 m, dropping rapidly to 0oc.
5 Social and Economic Information
Crystal Crab and Champagne Crab are sought after seafood in China and in the long-term it is
envisaged that a fishery for deep water crabs would be exported to this market to maximise
economic beneift.
As the proposed activity is an exploratory fishery and has not been operating to date there is no
specific social or economic information available.

7
6 Methodology - ESD Risk Assessment
PIRSA adopted a process for issue identification, risk assessment, and reporting closely based on the
National ESD Framework “How To Guide” (see www.fisheries-esd.com), as well as the Department of
Fisheries, Western Australia ESD performance reports pioneered by Dr Rick Fletcher and other WA
Fisheries staff.
Identification of issues was informed by the generic ESD component tree approach with each
component tree refined specifically for the proposed activity.
Each major component tree reflected the primary components of ESD, and the ESD report assesses the
performance of proposed activity for each of the relevant ecological, economic, social and governance
issues facing it (Table 1). The process also identified where additional (or reduced) management or
research attention is needed, and identify strategies and performance criteria to achieve management
objectives to the required standard.
Retained Species
Ecological Wellbeing Non-retained Species
General Ecosystem Impacts
Community Human Wellbeing
Aboriginal Community
Governance Ability to Achieve
External Factors Affecting Performance of the Fishery
The steps followed to complete the ESD Risk Assessment Report were:
1. A set of “Generic ESD Component Trees” were modified into a set of trees specific to the proposed activity. The final trees are provided in the results section.
A risk assessment of the identified issues (or components) was completed based on the consequence arising from the issue and likelihood that this consequence will occur (see appendix 1 for further information on consequence levels). The combination of the consequence and likelihood estimated a level of risk associated with issues that may undermine or alternatively contribute to ESD objectives (
Table 1: Primary ESD Components

8
2. Table 2).

9
Table 2: Risk matrix
Consequence Level
Negligible Minor Moderate Major Extreme
Likelihood Levels 1 2 3 4
Remote 1 0 1 2 3 4
Unlikely 2 0 2 4 6 8
Possible 3 0 3 6 9 12
Likely 4 0 4 8 12 16
Table 3 - Relationship between risk value, risk category, management response and reporting requirements.
Risk Category Risk Values Management Response Reporting Requirements
Negligible 0-2 None Brief Justification
Low 3-4 No Specific Management Full Justification Report
Medium 6-8 Specific Management/ Monitoring Needed Full Performance Report
High 9-16 Increased Management Activities Needed Full Performance Report
3. Risks were prioritised according to their severity. For higher level risks - where an increase in management or research attention was considered necessary - a detailed analysis of the issue, associated risks, and preferred risk management strategies was completed. For low risk issues, the reasons for assigning low risk and/or priority were recorded.
4. For higher level risks a full ESD performance report was prepared completed in the context of specific management objectives, include operational objectives, indicators and performance measures. Risk assessment was completed individually with key stakeholders and the outcomes collated. Key stakeholders were then provided with an opportunity to comment on a draft of the report prior to releasing the draft report for a public comment period. Following consideration of comments provided through public submissions the report will be finalised.
Report on
Justification for Risk
Rating Only
Low Risk/Priority
Develop Objectives
Indicators
Performance limits
Report Current Status
> Low Risk/Priority
Risk Assessment
ESD Component
Trees
(issues identified)
PLUS
GENERAL
BACKGROUND
INFORMATION
=
ESD REPORT
Use Data for
other
purposes
For
example,
Applications
to EA

10
Figure 1: Summary of the ESD reporting framework processes

11
8 Results
8.1 Issues related to the retained species (All Sectors)
The proposal requests a harvest of 100t with no species defined. The risk assessment was conducted
on the basis of 100t combined for all species, but could result in the total harvest being of one species
only.
The requested harvest was considered compared to TACC for Giant Crab in South Australia of 22t, 140t
for the Western Australian West Coast Deep Sea Crab Fishery for Crystal Crabs and reported harvest
of 22t of deep sea crabs including 6.9t Giant Crab, 5.5t Champagne Crab and 1.6t Crystal Crab in
Western Australian South Coast Crustacean Fishery in 2011/12 (How and Nardi 2013).
It was noted that the proposed gear included escape gaps currently required for the Rock Lobster
Fishery that would allow for small crabs and other by-catch to escape.
8.1.1 Crystal Crab
This species is long lived and slow growing and thus potentially vulnerable to overfishing.
At a harvest of 100t overfishing of Crystal Crab was considered to result in a major consequence
(Consequence level 3) and the likelihood of this occurring was considered possible (Likelihood level 3).
Risk Score (9) = High.
Retained Species
Primary Species
Scallop
Queen Scallop
King Scallop
Sea Urchin
Native Oyster
Turbo
Specimen Shells
By-catch
Epiphytes
Retained Species
Primary Species
Other Species (unknown species - possible spider crab
(Lepomithrax gaimardii )
Crystal Crab
(Chaceaon bicolour)
Champagne Crab
(Hypothalassia acerba)
By-catch
Small crabs
Giant Crab
Rock Lobster

12
8.1.2 Champagne Crab
The area of the proposed fishery was deeper than main area reported in Western Australian for
Champagne Crab abundance (145-200m) noting that this may be a different species in South Australia.
It was noted that Champagne Crab stocks in Western Australia have declined reportedly due to not
withstand the being intensively targeted (Melville-Smith et al. 2007).
It was considered that there was lower potential for large catches of Champagne Crab. Monitoring of
catch of Champagne crabs will be important to monitor risk to this species.
At a harvest of 100 t overfishing of Champagne crab was considered to result in a major consequence
(Consequence level 3) and the likelihood of this occurring was considered unlikely (Likelihood level 2).
Risk Score (6) = Medium.
8.1.3 Spider Crab and other unknown/ small crab species.
Spider Crabs are known to aggregate and therefore considered that these could be taken at high catch
rates. The risk to this species was considered to be largely unknown as there is limited information on
biology of these crabs in the fishing area. Risk for this species was considered on a precautionary basis.
Similarly, the information available for other unknown and small crab species is unknown and therefore
considered on a precautionary basis.
At a harvest of 100t overfishing of Spider Crab or other small crabs was considered to result in a major
consequence (Consequence level 3) and the likelihood of this occurring was considered possible
(Likelihood level 3). Risk Score (9) = High.
8.1.4 Giant Crabs and Rock Lobster
At the depth range proposed for the activity it is considered that limit numbers of Giant Crabs and very
minimal numbers of rock lobster would be encountered the proposed activity. It was considered that any
catch of Giant Crab and Rock Lobster could be included in the existing TACCs for these species or
released and therefore the consequence of the catch on the population was considered to be minor
(Consequence score 1) with the likelihood of this occurring being remote (Likelihood score 1). Risk
Score (1) = Negligible.
8.1.5 Mitigation strategies.
The potential risks to Crystal Crab, Champagne Crabs, Spider Crabs and other crab species could be
reduced with a lower cap set all species combined. For example:
50t cap was considered to result in a Moderate consequence (Consequence level 2) and the
likelihood of this occurring was considered unlikely (Likelihood level 2). Risk Score (4) = Low.
25t cap was considered to result in a Minor consequence (Consequence level 1) and the
likelihood of this occurring was considered remote (Likelihood level 1). Risk Score (1) =
Negligible.
Commercial catch rates for individual species are a possible performance indicator for monitoring stocks
noting that catch rates can be impacted by external factors including water temperature, oceanic
currents and market forces. It is therefore considered that this performance indicator would be
considered moderately robust at measuring the abundance of crabs.

13
8.2 Issues related to the non retained species
8.2.1 Threatened and Protected Species (TEPS)
Interactions between headlines and buoys attached to rock lobster pots and migrating Humpback and
Southern Right whales has been reported for the Western Australian Western Rock Lobster Fishery. A
code of practice has been introduced for the fishery including the need for fishers to reduce slack rope
on the surface, not set pots in clusters and regularly checking pots resulting in a reduction in
entanglements. Interactions in the Western Rock Lobster Fishery are predominately with Humpback
Whales (~90%) due to their migration pattern and morphology which increases their likelihood of
entanglement. (WA Department of Fisheries 2012).
Species of whales that occur in South Australian waters and their EBPC Classification include:
Species Scientific name SA National Parks and Wildlife Act (1972) listing
Southern Right Whale Eubalaena australis Vulnerable
Sperm Whale Physeter macrocephalus Rare
Humpback Whale Megaptera novaeangliae Vulnerable
Minke Whale Balaenoptera acutorostrata Rare
Orca (Killer Whale) Orcinus orca Migratory
The South Australian Rock Lobster Fishery operates with similar gear (pots with headlines and bouys)
as is proposed for harvest of deep sea crabs, and it is noted that there have been no reports of
interactions with cetaceans in the Rock Lobster Fishery for the period for which reporting of wildlife
interactions has been monitored (2007/08 to 2012/13, Tsolos and Boyle 2014). Noting however, that the
proposed activity would use pots strung together with only one headline/bouys for 80-180 pots
Non Retained Species
Direct Interaction but no capture
Threatened and Protected Species
Whale
Australian Sea Lions
Direct
Sharks
Sponge
Algae
Octopus
Fish

14
significantly reducing the number of headlines and bouys that a cetacean to become entangled in
compared to a similar rock lobster operation with the same number of pots.
It was considered that the consequence of an interaction between whales and gear in a South
Australian Deep Water Crab Fishery would be minor to the whole whale population for that species
(Consequence level 1) and the likelihood of interactions was considered to be unlikely (Likelihood level
2). Risk Score (2) = Negligible.
Interactions Australian Sea Lions have been addressed in the Northern Zone Rock Lobster Fishery to
mitigate entry of pups into pots. However, as the area of operations for the proposed activity is likely to
some distance (>80k km) from breeding colonies and/or too deep (>300 m) and thus the likelihood of
interactions with Australian Sea Lions was considered negligible (Likelihood Level 0) and therefore
poses negligible risk. Risk Score (0) = Negligible.
8.2.2 Sharks
Stakeholders considered the potential for interactions with gulper sharks that are listed as Conservation
dependant under the EBPC Act. Southern Dogfish (Centrophorus zeehaani) occurs in waters off South
Australia (Williams et al. 2012) at depths of 210 – 700m (Last and Stevens 2009).
Southern Dogfish are however considered to be at low risk from trap fisheries (NSW Department of
Primary Industries 2012) and survival of dogfish taken on lines was high (Wilson et al. 2009). It was
considered that the consequence of interaction with the proposed gear (pots) was minor (Consequence
level 1) and the likelihood of an interaction was unlikely (Likelihood level 2) Risk Score (2) = Negligible
8.2.3 Other Species
It was noted that the fish assemblages that may be present in the area of the proposed activity were
expected to be different to those for the Rock Lobster or Giant Crab Fishery due to the different depths
of the activities. Thus it was unknown what fish species may be included as bycatch in the proposed
activity.
The risk for all other components were considered negligible due to the low number of pots and the
large area of operations. Consequence was considered negligible (Consequence score 0) with the
likelihood of this occurring being remote (Likelihood score 0). Risk Score (0) = Negligible.

15
8.3 Issues related to the general environment impacts of a fishery
Much of the area over which the proposed activity is to be conducted has been subject to limited
research on habitats, biodiversity and ecology and there is paucity of specific information available in
considering this component of the fishery. For example there is no direct information available on the
food chain impact of fishing for deep water crabs.
It is generally considered that the rock lobster pots to be used in the proposed activity cause minimal
environmental disturbance in their normal area of operations (Casement and Svane 1999).
All components were considered to have a minor impact (Consequence level 1) and likelihood to be
remove (likelihood level 1) due to the low number of pots and the large area of operations and rock
lobster pots having low levels of impact on ecosystems. Risk Score (1) = Negligible.
General Ecosystem Effects on the Fishery
Impact on Trophic Structure
Removal of Animals
Impact on Predators
Impact on Competitors
Habitat Disturbance
Anchoring
Dive Equipment
Beach Launching
Broader Environment
Air Quality
Greenhouse Gas Emissions
Water Quality
Rubbish/Debris
Bilge Discharge
Hydraulic Oil (for cages)
Disease
General Ecosystem Effects on the Fishery
Addition/movement of biological material
Bait
Translocation
Discarding
Disease
Removal/Damage to Organisms
Habitat disturbance
Ghost fishing
Trophic impacts of fishing
Broader Environment
Air Quality
Greenhouse Gas
Emissions
Water Quality
Rubbish/Debris
Bilge Discharge

16
8.4 Contribution of the fishery/industry to community wellbeing
All components were considered to have a minimal impact (Consequence level 1) with a likelihood of
remote (Likelihood level 1) due to the limited size of the proposed activity. Risk Score (01) = Negligible.
It was noted that there may be some improvement to the component of Research and Knowledge from
the proposed activity as it could add greatly to current knowledge of deep water crabs of South
Australia., however the level of improvement was not known.
Community
Fishing Industry
Profit
Employment
WHS
Relationship with Community
Asset Value
Lifestyle
Dependent Communities
Regional Centres
Economic Value
Employment
GReg P & GStateP
Re-Investment
Social Value
Social Capital
Identity
Health/Food
Infrastructure
Attitude of Recreational Fishers
Non-Dependent Communities
City Centres
Economic Value
Social Value
Health/Food
Research/Knowledge
Infrastructure

17
8.5 Issues related to the governance of the fishery/industry

18
Governance
Government
PIRSA
Policy & Management
Management Effectiveness
Resources
Strategic Policy
Research/
Information
Compliance
Allocation
Legal Framework
OCS Agreement
Licence Transferability
Consultation
Information
Participation
Inter-Agency Coordination
Reporting
Aquaculture
Food Safety
Other Agencies
SA Govt - DEWNR
Cwth DotE
AQIS
Industry
Codes of Conduct
Communication
Participation
Industry Association
Access Security
Others (NGOs, etc
NGOs Effectiveness
Participation

19
Considering the resources required by PIRSA to manage a small fishery there was considered to be
some impact of policy and management related to the proposed activity. It was considered that the
impact to the fishery was moderate (Consequence level 2) with a likelihood of possible (Likelihood level
3). Risk Score (6) = Medium.
All other Sub-components within the Government - PIRSA component were considered to have a
minimal impact (Consequence level 1) with a likelihood of remote (Likelihood level 1) due to the limited
size of the proposed activity. Risk Score (01) = Negligible.
There could be some impact on the fishery related to interactions with other NGOs related to the
governance of the fishery from interactions with other Agencies and other NGOs related to community
perceptions of the proposed activities. It was considered that the impact to the fishery was moderate
(Consequence level 2) with a likelihood of possible (Likelihood level 3). Risk Score (6) = Medium.
The risk of industry interactions on the proposed activity was considered to be low given the low level of
the activity compared to other fisheries. All sub-components were considered to have a minimal impact
(Consequence level 1) with a likelihood of remote (Likelihood level 1) due to the limited size of the
proposed activity. Risk Score (01) = Negligible.
Governance
Government
PIRSA
Policy & Management
Management Effectiveness
Resources
Strategic Policy
Research/
Information
Compliance
Illegal Fishing
Legal Framework
Consultation
Information
Participation
Inter-Agency Coordination
Reporting
Aquaculture
SASQAP
Fisheries Council
Management Plan
Allocation
Consultation
Other
Other Agencies
SA Govt - DEWNR
Comm DotE
AQIS
Marine Parks
Industry
Codes of Conduct
Communication/
Participation
Industry Association
Access Security
Others (NGOs, etc
NGOs Effectiveness
Participation

20
8.6 External Impacts Affecting Performance of the proposed activity:
It was considered that all ecological impacts on the fishery would be minimal due to the large area over
which the proposed activity is to be conducted and the limited extent of fishing (pot lifts). All sub-
components were considered to have a minimal impact (Consequence level 1) with a likelihood of
remote (Likelihood level 1) due to the limited size of the proposed activity. Risk Score (1) = Negligible.
It was considered that there could be economic impacts on the performance of the proposed activity. All
sub-components were considered to have a moderate impact (Consequence level 2) with a likelihood
possible (Likelihood level 3) due to the limited size of the proposed activity. Risk Score (6) = Moderate.
External Factors Affecting Performance of the Fishery
Ecological Impacts on the Fishery
Biophysical Environment
Physical
Oceanographic
Climate Change
Temperature
Weather
Biological
Diseases
Toxins
Exotic Species
Human Induced Changes
Water Quality
Habitat Modification
Impacts of Other Drivers
Economics
Fuel Prices
Market Forces
Market Access
Labour
Other Fishing Costs
Access
Marine Parks Other
Commercial Activities
Fishing
Shipping/mining

21
Interactions with other shipping (including shipping) and potential mining exploration in the area, or
commercial fishing could interact with the gear and impact on the fishery. All components were
considered to have a moderate impact (Consequence level 2) with a likelihood possible (Likelihood level
3) due to the limited size of the proposed activity. Risk Score (6) = Moderate.
8.7 Summary of ESD Reporting Framework
In summary, the ESD reporting framework for all components of the fishery identified three components
of retained species to be of potentially high risk at the proposed harvest levels. Champagne Crab (also
a target species) was found to be potentially at medium risk (Table 4).
Medium risks were also identified for governance and external factors effecting fishery performance.
Table 4: Summary of ESD risk rating outcomes
Component Trees High Medium Low Negligible Total
Retained Species 3 1 0 2 6
Non-retained species 0 0 0 2 2
General Ecosystem 0 0 0 2 2
General Community 0 0 0 3 3
Governance 0 3 0 6 9
External Factors affecting
Fishery Performance
0 2 0 2 4
Total 3 6 0 17 26
8.8 Performance report for high and medium risk components Full ESD performance reports are provided for each of the identified high and medium risk components (Table 5). As the activity assessed is a proposed activity, the performance report is in the context of potential management objectives including proposed operational objectives and options for management strategies. A summary of outcomes for all components assessed are provided in Table 6.

22
Table 5: Full performance report for High and Medium risks
Component Risk/Issue Description Risk rating Proposed Objective Proposed Strategies
Performance Indicator
Retained species
Crystal Crab
Risk of fishery impacts on spawning biomass of Crystal Crab – primary species
High
Maintain stocks of all species of deep water crabs at sustainable levels
Total harvest of proposed activity restricted for all species combined annually.
Total harvest of Crystal Crab (Chaceaon bicolour or C. albus) restricted annually.
Total harvest of Champagne Crab (Hypothalassia acerba) annually.
Catch in numbers and weight of all deep sea crabs harvested recorded by species.
Harvest of berried female crabs prohibited
Escape Gaps required on pots
Total Catch
Total Catch Crystal Crabs
Total Catch Champagne Crabs
Catch in numbers and weight of all deep sea crabs
Champagne Crab
Risk of fishery impacts on spawning biomass of Champagne Crab – primary species
Medium
Other deep water
crabs
Risk of fishery impacts on spawning biomass of Champagne Crab – primary species
High
Governance
Policy and
management
Risk to the fishery through lack of sufficient resources to manage fishery efficiently
Medium
Proponent participation in management of the fishery through consultation
Management arrangements are developed in consultation with proponent
No performance indicators proposed
Other agencies Risk to the fishery from other agencies Medium Management
arrangements for the proposed activity are communicated to other agencies
Proposed management arrangements provided for public comment and communicated to other agencies.
No performance indicators proposed
Others Risk to the fishery from other interested stakeholder Medium

23
External factors
affecting the
performance of
the fishery
Economic
Risk to the fishery from economic drivers such as increased fuel prices and changes to market forces
Medium
Management arrangements allow for fishing operations to be efficient within sustainability bounds
Management arrangements are developed in consultation with proponent
No performance indicators proposed
Access – Other
Commercial Activities
Risk to the fishery from increased shipping/fishing activity limiting access to the area of the proposed activity.
Medium
Management arrangements allow for fishing operations to be efficient within sustainability bounds
Management arrangements are developed in consultation with proponent
No performance indicators proposed

24
Table 6: Overview of ESD Risk Assessment for all components
Component Risk Objective
Proposed
Performance Indicator
proposed
Robustness
Issues related to the retained species
Primary Species - Crystal Crab H Yes Yes M
Primary Species - Champagne Crab M Yes Yes M
Primary Species - Other H Yes Yes M
By-catch - small crabs H Yes Yes L
By-catch – Giant Crab N Yes2 Yes M
By-catch – Rock Lobster N Yes3 Yes H
Issues related to the non retained species
Direct interaction but no capture - Threatened,
endangered and Protected Species - Whales
N No
No M
Direct interaction but no capture - Threatened,
endangered and Protected Species – Australia Sea
Lions
N No No M
Direct - Sharks N No No M
Direct - Sponge N No No n/a
Direct – Algae N No No n/a
Direct - Octopus N No No n/a
Direct – Fish N No No n/a
Issues related to the general environment impacts of a fishery
Addition/movement of biological material - Bait N No No n/a
Addition/movement of biological material -
Translocation
N No No n/a
Addition/movement of biological material -
Discarding
N No No n/a
Addition/movement of biological material - Disease N No No n/a
Removal/Damage to Organisms – Habitat
Disturbance
N No No n/a
Removal/Damage to Organisms – Ghost fishing N No No n/a
Removal/Damage to Organisms – Trophic impacts
of fishing
N No No n/a
Broader Environment – Air quality – Greenhouse gas N No No n/a
2 Management arrangements for the SA Commercial Giant Crab Fishery are described in the policy for the fishery (pir.sa.gov.au). 3 Management arrangements for the SA Commercial Rock Lobster Fisheries are described in management plans for the fishery (pir.sa.gov.au).

25
emissions
Broader Environment – water quality –
Rubbish/Debris
N No No n/a
Broader Environment – water quality – Bilge
discharge
N No No n/a
Contribution of the fishery/industry to community wellbeing
Fishing Industry – Profit N No No n/a
Fishing Industry – Employment N No No n/a
Fishing Industry – WHS N No No n/a
Fishing Industry – Relationship with Community N No No n/a
Fishing Industry – WHS N No No n/a
Fishing Industry – Asset value N No No n/a
Fishing Industry – lifestyle N No No n/a
Dependent communities – regional centres –
Economic Value - Employment
N No No n/a
Dependent communities – regional centres –
Economic Value – GRP/GSP
N No No n/a
Dependent communities – regional centres –
Economic Value - Reinvestment
N No No n/a
Dependent communities – regional centres – Social
Value – Social Capital
N No No n/a
Dependent communities – regional centres – Social
Value – Identity
N No No n/a
Dependent communities – regional centres – Social
Value – Health/food
N No No n/a
Dependent communities – regional centres –
Infrastructure
N No No n/a
Dependent communities – regional centres –Attitude
of recreational fishers
N No No n/a
Non-dependent communities –city centres –
Economic value
N No No n/a
Non-dependent communities –city centres –Social
value – Health/Food
N No No n/a
Non-dependent communities –city centres – Social
value – Research/knowledge
N No No n/a
Non-dependent communities –city centres –
Infrastructure
N No No n/a
Issues related to the governance of the fishery/industry
Government - PIRSA – Policy & Management –
Management Effectiveness
M No No n/a
Government - PIRSA – Policy & Management – M No No n/a

26
Resources
Government - PIRSA – Policy & Management –
Strategic Policy
M No No n/a
Government - PIRSA – Policy & Management –
Research Information
M No No n/a
Government - PIRSA – Policy & Management –
Compliance
M No No n/a
Government - PIRSA – Policy & Management –
Allocation
M No No n/a
Government - PIRSA – Legal Framework - OCS N No No n/a
Government - PIRSA – Legal Framework – Access
rights/licence transferability
N No No n/a
Government - PIRSA - Consultation – Information N No No n/a
Government - PIRSA - Consultation – Participation N No No n/a
Government - PIRSA - Consultation – Inter-agency
Coordination
N No No n/a
Government - PIRSA - Reporting N No No n/a
Government - PIRSA - Aquaculture N No No n/a
Government - PIRSA – Food Safety N No No n/a
Government – Other agencies– SA DEWNR –
Marine Parks
M No No n/a
Government – Other agencies– Cwth DotE M No No n/a
Government – Other agencies– AQIS M No No n/a
Industry– Codes of Conduct N No No n/a
Industry– Communication/participation N No No n/a
Industry– Industry Association N No No n/a
Industry– Access Security N No No n/a
Other (NGOs)– NGO effectiveness M No No n/a
Other (NGOs)– –Participation M No No n/a
External Factors Affecting Performance of the Fishery
Ecological Impacts – Biophysical environment –
Physical - Oceanographic
N No No n/a
Ecological Impacts – Biophysical environment –
Physical – Climate Change
N No No n/a
Ecological Impacts – Biophysical environment –
Physical - Temperature
N No No n/a
Ecological Impacts – Biophysical environment –
Physical - Weather
N No No n/a
Ecological Impacts – Biophysical environment – N No No n/a

27
Biological - Disease
Ecological Impacts – Biophysical environment –
Biological - Toxins
N No No n/a
Ecological Impacts – Biophysical environment –
Biological - Exotic species
N No No n/a
Ecological Impacts – Human induced changes –
Water quality
N No No n/a
Ecological Impacts – Human induced changes –
Habitat Modification
N No No n/a
Impacts of other drivers– Economics – Fuel Prices M No No n/a
Impacts of other drivers– Economics – Market forces M No No n/a
Impacts of other drivers– Economics – Market
Access
M No No n/a
Impacts of other drivers– Economics – Labour M No No n/a
Impacts of other drivers– Economics – Other Fishing
Costs
M No No n/a
Access - Marine Parks N No No n/a
Access - Other Commercial Activities – Fishing N No No n/a
Access - Other Commercial Activities –
Shipping/mining
N No No n/a
9 References
Casement, .D and Svane, I. (1999). Direct effects of rock lobster pots on temperate shallow rocky
reefs in South Australia. A report to the South Australian Rock Lobster Industry. SARDI Aquatic
Sciences.
Chuwen, B. M. and Stevens, R. (2006). Evaluation of Crystal Crab (Chaceon bicolor) resources
on the south coast of Western Australia. Fisheries Research and Development Corporation
Report, FRDC project 2003/077.
Department of Fisheries (2012). Application to the Department of Sustain ability, Environment,
Water, Population and Communities on the Western Rock Lobster Fishery Against the Guidelines
for the Ecologically Sustainable Management of Fisheries, 2007 - second edition. Western
Australian Department of Fisheries, 3rd Floor, The Atrium, 168 8t Georges Terrace, Perth
Western Australia, 6000.
Fletcher, W.J. and Santoro, K. (eds). (2013). Status Reports of the Fisheries and Aquatic
Resources of Western Australia 2012/13: The State of the Fisheries. Department of Fisheries,
Western Australia.
How, J. and Nardi, K. (2013). West Coast Deep Sea Crustacean Managed Fishery Status Report.
In: Status Reports of the Fisheries and Aquatic Resources of Western Australia 2012/13: The

28
State of the Fisheries eds. W.J. Fletcher and K. Santororo, Department of Fisheries Western
Australia. pp 45-55.
Jones, D. S. and Morgan, G. J. (2002). A Field Guide to Crustaceans of Australian Waters. New
Holland Publishers. Sydney, Australia.
Last PR, and Stevens J. (2009). Sharks and Rays of Australia. CSIRO Publishing Australia.
Melville-Smith, R., Gould, R. and Bellchambers, L. (2003). The crystal crab fishery in Western
Australia: first steps in the development of a sustainable deepwater crab fishery. FAO. 117-129.
Melville-Smith, R., Norton, R. and Thomson, A. (2007). Biological and Fisheries Data for
Managing Deep Sea Crabs in Western Australia Final report to Fisheries Research and
Development Corporation on Project No. 2001/055. Fisheries Research Report No. 165,
Department of Fisheries, Western Australia, 248p.
Melville-Smith, R., Thomson, A. and Unsworth, P. (2010). West Coast Deep Sea Crab Fishery
Status Report in State of the Fisheries Report 2008/09 WA. Department of Fisheries WA.
MESA (2014). Oceans of Life. from http://www.mesa.edu.au/seaweek2010/cf14.asp.
NSW Department of Primary Industries (2012). NSW Strategy to assist with the rebuilding of
Harrisson’s and southern dogfish populations. Draft for Consultation, August 2012. Available at:
www.dpi.nsw.gov.au/fisheries/commercial/info/gulper-shark.
Smith, K. D., Hall, N. G., de Lestang, S. and Potter, I. C. (2004a). Potential bias in estimates of
the size of maturity of crabs derived from trap samples. ICES Journal of Marine Science: Journal
du Conseil. 61(6): 906-912.
Smith, K. D., Potter, I. C. and Hall, N. G. (2004b). Biological and Fisheries Data for Managing the
Deep-sea Crabs Hypothalassia acerba and Chaceon bicolor in Western Australia. Final Report
FRDC projects 1999/154 and 2001/055. Centre for Fish and Fisheries Research. Murdoch,
Australia.
Tsolos, A. and Boyle, M. (2014). Interactions with Threatened, Endangered or Protected Species
in South Australian Managed Fisheries – 2012/13. Report to PIRSA Fisheries and
Aquaculture. South Australian Research and Development Institute (Aquatic Sciences), Adelaide.
SARDI Publication No. F2009/000544-4. SARDI Research Report Series No. 755. 70pp.
Wilson DT, Patterson HM, Summerson R and Hobsbawn PI (2009) Information to support
management options for upper-slope gulper sharks (including Harrisson's dogfish and southern
dogfish). Final Report to the Fisheries Research and Development Corporation Project No.
2008/65. Bureau of Rural Sciences, Canberra.

29
10 Appendix Table 7 - Consequence categories for the major target/vulnerable species. The default objective is - maintain the biomass above the target reference point”.
Level Ecological (Target/Vulnerable Species)
Negligible (0) No measureable decline
Exploited Stock Abundance Range 100% to 90% unfished levels
Minor (1) Either not detectable against background variability for this population; or if detectable, minimal impact on population size
and none on dynamics.
Exploited Stock Abundance Range < 90% to 70% unfished levels
Moderate (2) Fishery operating at, or close to, the exploitation rate that will deliver MSY.
Exploited Stock Abundance Range < 70% to > Bmsy
Major (3) Stock has been reduced to levels below MSY and may also be getting into the range where recruitment overfishing may
occur.
Exploited Stock Abundance Range < Bmsy to > Brec
Extreme (4) Stock size or significant species range contraction > 50% have occurred and recruitment levels reduced affecting future
recruitment and their capacity to increase from a depleted state (i.e. recruitment overfishing)
Exploited Stock Abundance Range < Brec
Table 8 - Consequence categories for the by-product species/minor by-catch species. The default objective is - to maintain appropriate levels of biomass of by-catch species to minimize any significant impact on their dynamics and the broader ecosystem.
Level Ecological (by-product/general by-catch)
Negligible (0) Very few individuals are captured in relation to likely population size (<1%)
Minor (1) Take in this fishery is small (< 10%), compared to total take by all fisheries and these species are covered
explicitly elsewhere.
Take and area of capture by this fishery is small, compared to known area of distribution (< 20%).
Moderate (2) Relative area of, or susceptibility to capture is suspected to be less than 50% and species do not have vulnerable
life history traits.
Major (3) No information is available on the relative area or susceptibility to capture or on the vulnerability of life history
traits of this type of species AND
The relative levels of capture/susceptibility suspected/known to be greater than 50% and species should be
examined explicitly
Extreme (4) N/A Once a consequence reaches this point it should be examined using target species table.
30
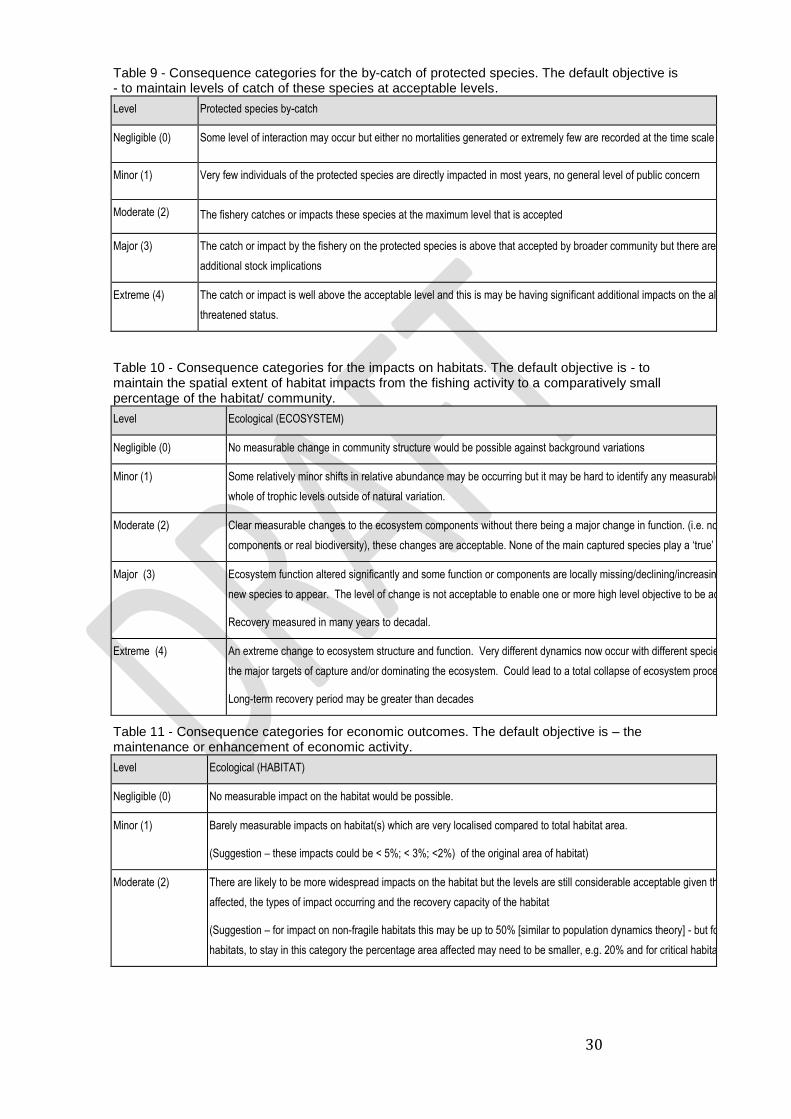
Table 9 - Consequence categories for the by-catch of protected species. The default objective is - to maintain levels of catch of these species at acceptable levels.
Level Protected species by-catch
Negligible (0) Some level of interaction may occur but either no mortalities generated or extremely few are recorded at the time scale of years.
Minor (1) Very few individuals of the protected species are directly impacted in most years, no general level of public concern
Moderate (2) The fishery catches or impacts these species at the maximum level that is accepted
Major (3) The catch or impact by the fishery on the protected species is above that accepted by broader community but there are few/no
additional stock implications
Extreme (4) The catch or impact is well above the acceptable level and this is may be having significant additional impacts on the already
threatened status.
Table 10 - Consequence categories for the impacts on habitats. The default objective is - to maintain the spatial extent of habitat impacts from the fishing activity to a comparatively small percentage of the habitat/ community.
Level Ecological (ECOSYSTEM)
Negligible (0) No measurable change in community structure would be possible against background variations
Minor (1) Some relatively minor shifts in relative abundance may be occurring but it may be hard to identify any measurable changes at
whole of trophic levels outside of natural variation.
Moderate (2) Clear measurable changes to the ecosystem components without there being a major change in function. (i.e. no loss of
components or real biodiversity), these changes are acceptable. None of the main captured species play a ‘true’ keystone role
Major (3) Ecosystem function altered significantly and some function or components are locally missing/declining/increasing &/or allowed
new species to appear. The level of change is not acceptable to enable one or more high level objective to be achieved.
Recovery measured in many years to decadal.
Extreme (4) An extreme change to ecosystem structure and function. Very different dynamics now occur with different species/groups now
the major targets of capture and/or dominating the ecosystem. Could lead to a total collapse of ecosystem processes.
Long-term recovery period may be greater than decades
Table 11 - Consequence categories for economic outcomes. The default objective is – the maintenance or enhancement of economic activity.
Level Ecological (HABITAT)
Negligible (0) No measurable impact on the habitat would be possible.
Minor (1) Barely measurable impacts on habitat(s) which are very localised compared to total habitat area.
(Suggestion – these impacts could be < 5%; < 3%; <2%) of the original area of habitat)
Moderate (2) There are likely to be more widespread impacts on the habitat but the levels are still considerable acceptable given the % of area
affected, the types of impact occurring and the recovery capacity of the habitat
(Suggestion – for impact on non-fragile habitats this may be up to 50% [similar to population dynamics theory] - but for more fragile
habitats, to stay in this category the percentage area affected may need to be smaller, e.g. 20% and for critical habitats less than 5%)

31
Major (3) The level of impact on habitats may be larger than is sensible to ensure that the habitat will not be able to recover adequately, or it will
cause strong downstream effects from loss of function.
(Suggestion - Where the activity makes a significant impact in the area affected and the area > 25 - 50% [based on recovery rates] of
habitat is being removed; whilst for critical habitats this would be < 10%)
Extreme (4) Too much of the habitat is being affected, which may endanger its long-term survival and result in severe changes to ecosystem
function and the entire habitat is in danger of being affected in a major way/removed.
(Suggestion this may equate to 70 - 90% of the habitat being affected or removed by the activity; for more fragile habitats this would
be > 30% and for critical habitats 10-20%)
Table 12 - Consequence categories for social disruptions. The default objective is – maintenance or enhancement of appropriate social structures and outcomes.
Level Social Implications
Negligible (0) Not measurable or no direct involvement
Minor (1) Direct impacts may be measurable but minimal concerns
Moderate (2) Some direct impacts on social structures but not to the point where local communities are threatened or social dislocations will occur
Major (3) Severe impacts on social structures, at least at a local level.
Extreme (4) Changes will cause a complete alteration to some social structures that are present within a region of a country
Table 13 - Suggested consequence levels for economic outcomes. The default objective is - maintenance or enhancement of economic activity.
Level Economic
Negligible (0) None or not detectable
Minor (1) Possible detectable, but no real impact on the economic pathways for the industry or the community.
Moderate (2) Some level of reduction for a major fishery or a large reduction in a small fishery that the community is not dependent upon.
Major (3) Fishery/industry has declined significantly in economic generation and this will have clear flow on effects to other parts of the
community. May result in some level of political intervention.
Extreme (4) Total collapse of any economic activity coming from what was an industry that the community derived a significant level of their
income or employment (resource dependency), including possible debts. High levels of political intervention likely.
Table 14 - Likelihood Definitions – these are usually defined for the likelihood of a particular consequence level actually occurring within the assessment period. Level Descriptor
Likely (4) A particular consequence level is expected to occur (Probability of 40 - 100%)
Possible (3) Evidence to suggest this consequence level is possible and may occur in some circumstances (Probability of 10 -
35%)
Unlikely (2) The consequence is not expected to occur but it has been known to occur elsewhere (Probability of 2 -10%)

32
Remote (1) The consequence has never been heard of in these circumstances, but it is not impossible (Probability < 2%)