March 2017 digital realty company overview
74
-
Upload
irdigitalrealty -
Category
Investor Relations
-
view
164 -
download
2
Transcript of March 2017 digital realty company overview


•
•
•
•
•
•
•
•
•
•
•
•
•


••••
•••
•
••
••


Global IP Traffic (2014 – 2019)
60 72
88
109
136
168
30
80
130
180
2014 2015 2016 2017 2018 2019
Mobile Data Traffic (2014 – 2020)
Exabytes Per Month
3 5
8
12
17
24
31
2
12
22
32
2014 2015 2016 2017 2018 2019 2020
Global IP Video Traffic (2014 – 2019)
Exabytes Per Month
62
76
91
110
132 135
40
80
120
160
2014 2015 2016 2017 2018 2019
Global Data Center Traffic (2014 – 2019)
Zettabytes
1.3 ZB 1.7 ZB
2.1 ZB
8.6 ZB
3.4 ZB
10.3 ZB
–
3
6
9
2014 2019
Traditional Cloud


Non-Investment Grade
Investment Grade
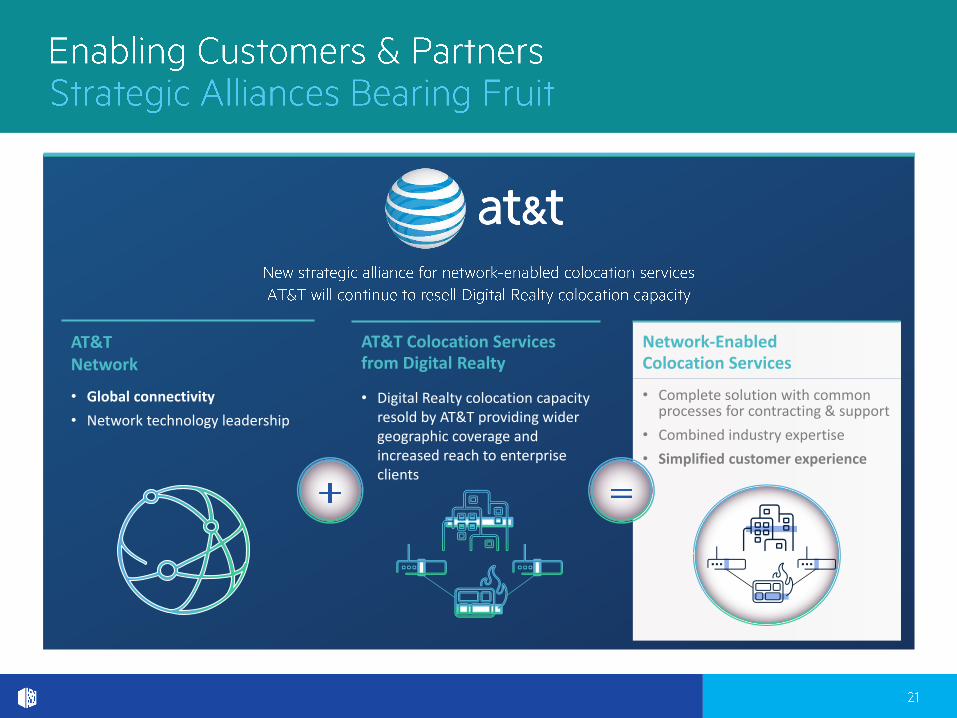
Network-Enabled Colocation Services
• Complete solution with common processes for contracting & support
• Combined industry expertise
• Simplified customer experience
AT&T Colocation Services from Digital Realty
• Digital Realty colocation capacity resold by AT&T providing wider geographic coverage and increased reach to enterprise clients
AT&T Network
• Global connectivity
• Network technology leadership

•
•
•
•
•
•
•
•
•
•
•


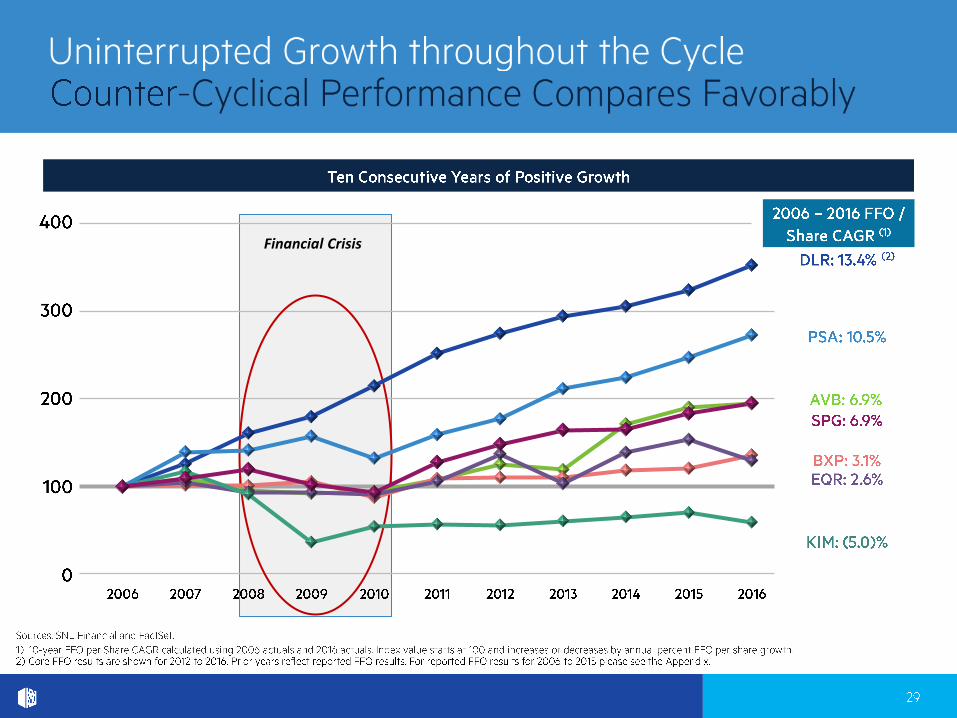
Financial Crisis

••••


05 06 07 08 09 10 11 12 13 14 15 16

✓
✓
✓
✓
✓
✓

▪
▪
▪
▪
▪
▪
▪
▪
▪
▪
▪
▪
▪
▪
▪
▪
▪
▪


•
•
•
•
•
••

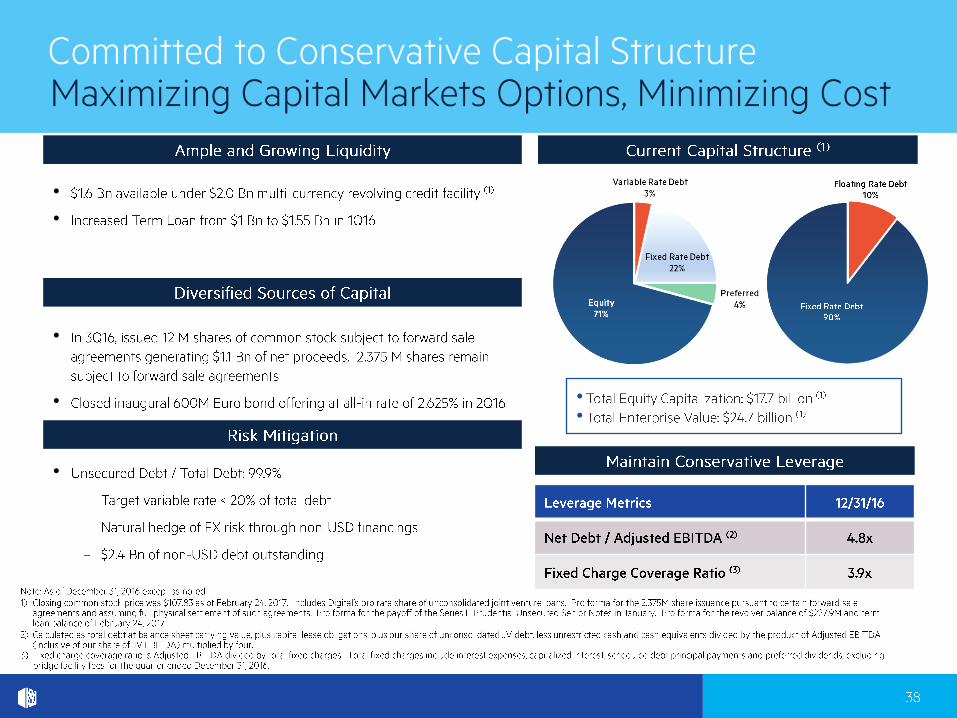
Extended Global Unsecured Revolving Credit Facility and Term Loan Maturities to 2021 and 2023

•
•
•
•
•
•
•
•
•
•
•


3Q16 Call CURRENT Better/
October 25, 2016 February 15, 2017 Worse 2017E 2018E
Global GDP Growth Forecast (1) 2017E: 3.4% 2017E: 3.4% tu 3.4% 3.6%
U.S. GDP Growth Forecast (1) 2017E: 2.2% 2017E: 2.3% p 2.3% 2.5%
U.S. Unemployment Rate (2) 5.0% 4.8% q 4.6% 4.5%
Inflation Rate – U.S. Annual CPI Index (2) 1.5% 2.5% p 2.4% 2.3%
Crude Oil ($/barrel) (3) $50 $53 p $55 $60
Control of White House, Senate and HoR (4) D,D,R R,R,R p R,R,R R,R,R
Three-Month Libor (USD) (2) 0.9% 1.0% p 1.5% n/a
10-Yr U.S. Treasury Yield (2) 1.8% 2.5% p 2.8% n/a
GBP-USD (2) 1.22 1.25 p 1.24 1.28
EUR-USD (2) 1.09 1.06 q 1.05 1.10
S&P 500 (2) 2,143 (YTD 6.7%); P/E: 20.1x 2,349 (YTD 5.2%); P/E: 21.6x p 18.1x 16.2x
NASDAQ 100 (2) 4,891 (YTD 7.6%); P/E: 24.6x 5,302 (YTD 9.2%); P/E: 25.6x p 19.9x 17.5x
RMZ (2) (5)
1,149 (YTD 7.7%); P/FFO: 15.5x 1,153 (YTD 0.8%); P/FFO: 15.9x q15.9x n/a
IT Spending Growth Worldwide (6) 2017E: 2.6% 2017E: 2.7% p 2.7% 2.6%
Server Shipment Worldwide (7) 2017E: 3.7% 2017E: 6.4% p 6.4% 2.3%
Global Data Center to Data Center IP Traffic (8) CAGR 2014 - 2019E: 31% CAGR 2015 - 2020E: 32% pCAGR 2015 - 2020E:
32%
Global Cloud IP Traffic (8) CAGR 2014 - 2019E: 33% CAGR 2015 - 2020E: 30% qCAGR 2015 - 2020E:
30%


Northern Virginia
Atlanta
Miami
Chicago
Los Angeles
Phoenix Dallas
New York
Existing Markets
New Colocation Presence

▪
▪
▪
▪
▪

4Q16 / 4Q15Revenue Growth

USD CAD GBP EURO JPY HKD SGD AUD


✓
✓
✓
✓