Mapping Self-Report Questionnaires for Socio-Emotional ... · MAPPING QUESTIONNAIRES: WHAT DO THEY...
28
MAPPING QUESTIONNAIRES: WHAT DO THEY MEASURE? Mapping Self-Report Questionnaires for Socio-Emotional Characteristics: What do they measure? Ricardo Primi 1 2 Daniel Santos 3 2 Nelson Hauck Filho 1 Filip De Fruyt 4 2 Oliver P. John 5 2 1 Post Graduate Program in Psychology, Universidade São Francisco, Itatiba, Brazil, 2 EduLab21, Ayrton Senna Institute, São Paulo, Brasil, 3 Faculty of Economics, Administration and Accounting of Ribeirão Preto, University of São Paulo, Ribeirão Preto, Brazil, 4 Department of Developmental, Personality and Social Psychology, Ghent University, Gent, Belgium, 5 Department of Psychology, University of California, Berkeley, CA, United States. Paper to be presented in the symposium “Socioemotional characteristics in the United States and Brazil: Structure, measures, change, and school effects” (Oliver P. John and Ricardo Primi, Co- Chairs) at the Annual Meeting of the American Education Research Association, Washington, D.C., April 8-12, 2016. This symposium will be held on Saturday, April 9, 2016, from 12:25 to 1:55 pm in Marriott Marquis, Level Two, Marquis Salon 1 (Division H – Research, Evaluation, and Assessment in Schools/Division H – Section 3: Assessment in schools), Washington, D.C. Correspondence should be addressed to Ricardo Primi, Universidade São Francisco, Laboratório de Avaliação Psicológica e Educacional [Laboratory of Psychological and Educational Assessment], Rua Alexandre Rodrigues Barbosa, 45, CEP 13251-900, Itatiba, São Paulo, Brazil; e-mail: [email protected] Abstract 1
-
Upload
truongxuyen -
Category
Documents
-
view
226 -
download
0
Transcript of Mapping Self-Report Questionnaires for Socio-Emotional ... · MAPPING QUESTIONNAIRES: WHAT DO THEY...
MAPPING QUESTIONNAIRES: WHAT DO THEY MEASURE?
Mapping Self-Report Questionnaires for Socio-Emotional Characteristics:
What do they measure?
Ricardo Primi1 2
Daniel Santos3 2
Nelson Hauck Filho1
Filip De Fruyt4 2
Oliver P. John5 2
1 Post Graduate Program in Psychology, Universidade São Francisco, Itatiba, Brazil, 2 EduLab21,Ayrton Senna Institute, São Paulo, Brasil, 3Faculty of Economics, Administration and Accounting
of Ribeirão Preto, University of São Paulo, Ribeirão Preto, Brazil, 4 Department ofDevelopmental, Personality and Social Psychology, Ghent University, Gent, Belgium, 5
Department of Psychology, University of California, Berkeley, CA, United States.
Paper to be presented in the symposium “Socioemotional characteristics in the United States andBrazil: Structure, measures, change, and school effects” (Oliver P. John and Ricardo Primi, Co-Chairs) at the Annual Meeting of the American Education Research Association, Washington,D.C., April 8-12, 2016.
This symposium will be held on Saturday, April 9, 2016, from 12:25 to 1:55 pm in MarriottMarquis, Level Two, Marquis Salon 1 (Division H – Research, Evaluation, and Assessment inSchools/Division H – Section 3: Assessment in schools), Washington, D.C.
Correspondence should be addressed to Ricardo Primi, Universidade São Francisco, Laboratório de Avaliação Psicológica e Educacional [Laboratory of Psychological and Educational Assessment], Rua Alexandre Rodrigues Barbosa, 45, CEP 13251-900, Itatiba, São Paulo, Brazil; e-mail: [email protected]
Abstract
1

MAPPING QUESTIONNAIRES: WHAT DO THEY MEASURE?
Whereas the structure of individual differences in personal, social, and emotional
attributes is well understood in adults, much less work has been done in children and
adolescents. On the assessment side, numerous instruments are in use for children but they
measure a wide array of seemingly different attributes, ranging from one single factor (self-
esteem; grit) to three factors (social, emotional, and academic self-efficacy) to five factors
(strength and difficulties; Big Five personality domains). The main goals of this research were to
specify the major content domains that are assessed across multiple instruments in research in the
US and Europe, to test them in a less developed contexts with considerable educational
challenges, and to eventually construct a comprehensive measure for large-scale studies in
Brazilian schools. We selected the 5 most promising instruments and studied their structure at the
item level (N= 3,023). The resulting factor structure captured the major domains of child
differences represented in these instruments and resembled the Big Five personality dimensions.
Discussion focuses on the contribution to socio-emotional research in education and its
measurement as well as on limitations and suggestions for future research.
Keywords: Response Styles, Big Five, Person Differential Functioning, Large-Scale
Educational Assessment, 21st Century Skills, Socio-Emotional Learning
2

MAPPING QUESTIONNAIRES: WHAT DO THEY MEASURE?
Mapping self-report questionnaires for socio-emotional characteristics: What do they measure?
Learning is a valuable resource for societies. It produces the secondary abilities, that is,
secondary new brain systems of abilities formed from cultural needs via schooling (Geary.
2007). Learning is multi-determined phenomena. For instance, Carroll’s (1963) model of school
learning postulates that degree of learning is related to the extent students spend the amount of
time needed to learn. He breaks down time needed as inversely related to cognitive ability and
quality of instruction. Time spend is directly related to the opportunity to learn and socio-
emotional factors such as desire to learn and perseverance - defined as the amount of time a
learner is willing to be engaged actively in learning. This illustrates that learning is a complex
product of cognitive, motivational, and socio-emotional factors as well as environmental socio-
cultural factors (such as family and school, economy and culture), all of which can influence
opportunities to learn and the quality of learning experiences.
Recent developments in the fields of education, economics, psychology, and
neuroscience have emphasized that social-emotional skills (SE) are as important as cognitive
measures in predicting not only learning but various important life outcomes (OECD, 2015). SE
are also frequently referred to as 21st Century Skills, personal characteristics that are considered
crucial for individual’s life and work adaptation (Trilling & Fadel, 2009; Partnership for 21 st
Century Skills, 2015). The topic of socio emotional skills has become increasingly important for
education and policy makers. Several frameworks have proposed definitions, measures,
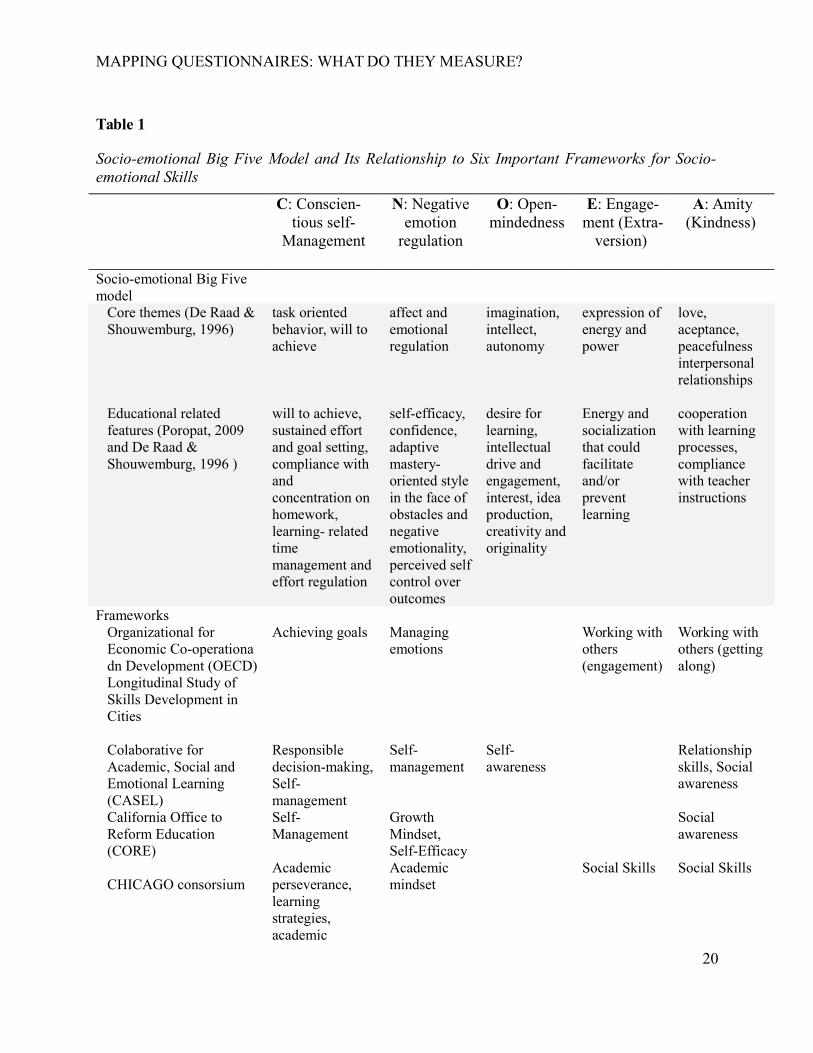
interventions and applications in educational systems. Table 1 lists seven important frameworks
that define constructs and measures for SE (lines 6 to 10): Organization for Economic Co-
operation and Development (OECD, 2016), Collaborative for Academic, Social and Emotional
Learning (CASEL; 2012), California Office to Reform Education (CORE; 2014), CHICAGO
consortium (Farrington et al., 2012), National Research Council (2012), Partnership for 21st
Century Skills (ww.p21.org), and Strive Task Force on Measuring Social and Emotional
Learning (2013).
In the absence of a comprehensive and explicitly specified taxonomic framework, SEs
have been operationalized by an amalgam of different constructs and measures as it is illustrated
in Table 1. One potential problem is that different frameworks can use different “construct
3

MAPPING QUESTIONNAIRES: WHAT DO THEY MEASURE?
names” or measures that access one single psychological construct or propose one measure that
comprises a complex mix of more than one psychological construct. The National Research
Council (2012) describes this problem using the known term of “jangle fallacy” and points out
that “today measurement experts continue to struggle with the question of whether various
constructs represent different names for the same underlying psychological phenomenon or are
truly different dimensions of human competence” (p. 25).
For instance, Marsh et al. (2006) reported a study of 14-scales measure of Students’
Approaches to Learning (SAL) assessing broad SE skills, such as self-regulated learning,
motivational preferences, self-regulated cognitions, effort and persistence and learning
preferences used in the Program for International Student Assessment (PISA) in 2000. Although
14 supposedly distinct SE skills were measured, some of them were highly overlapping (i.e.,
correlated), such as math self-concept and interest in math (r =.86), effort/persistence and self-
efficacy (r=.73), or academic self-concept with self efficacy (r=.72). Such results illustrate the
fact that presumably distinct SE skills being measured might be indicators of a smaller set of
underlying constructs.
But what constructs? What taxonomic framework could shed light on the underlying
variables of SE skills ? In line with recent research in the literature (Kyllonen, Lipnevich, Burrus,
& Roberts, 2014; National Research Council, 2012; Roberts, Martin, & Olaru, 2015) we propose
that a socio-emotional Big Five model is a potentially rich and useful taxonomic framework to
organize the conceptual space of SE skills and measures (John & De Fruyt, 2016; Primi, Santos,
Fruyt, & John, in press). As De Raad and Schouwenburg (1996) suggested, individual
differences can be broadly classified into systems of knowing (cognition), feeling (affection),
and willing (motivation). Individual performance in schools and work is determined by
capacities to perform (cognition) and willingness to perform (motivation and affection), as well
by opportunities to perform, which are determined by environmental factors - family, school,
social and socio-economic resources (Poropat, 2009). Thus, according to DeFruyt, Wille, & John
(2015) and John & DeFruyt (2016), SE skills refers to consistent patterns of thoughts, feelings
and behaviors specially those derived from the domains of motivation and feeling – reason why
some historically researchers have used the term non-cognitive factors - that influence important
socioeconomic outcomes throughout the individual’s life. Also SE skills are those traits that are
4

MAPPING QUESTIONNAIRES: WHAT DO THEY MEASURE?
potentially malleable and whose development is shaped by environmental factors, that is, formal
and informal learning experiences.
This broad definition is borrowed from contemporary personality psychology and
focused on those person attributes that can be taught and learned during the school years and that
predict important outcome, both in school and later in life. By approximating the definition of SE
skills with personality psychology, one could use the extensive knowledge about that Big Five
taxonomic framework as a conceptual anchor space to help classify SE skills and measures. In
the context of education, the Big Five domains organize a set of core themes of socio emotional
functioning that allow us to locate distinct skills and anchor various conceptions and measures of
SE skills in a integrated, multi-dimensional, conceptual space. The two first lines in Table 1
present these core themes for each of the five domains (i.e., each column): C involves
Conscientious task oriented behavior that rely executive self-management; N involves regulation
of Negative affect and emotions that afford resilience under stress; O involves aspect of Open-
mindedness like imagination, intellect, autonomy, and interest in learning and change that
challenge one’s current understandings; E involves the expression of energy, power, and
engagement (with others); and finally, A involves Amity, the perception and acceptance of others
as allies, friends, and teammates, as loving and loveable, and thus the quality, depth, and
closeness of interpersonal relationships (e.g., John & DeFruyt, 2016).
The Present Research
In Table 1 we also present a preliminary conceptually derived classification of where the
diverse set of SE skills proposed by the seven frameworks can be located within the conceptual
space of the socio-emotional Big Five. But to what extent can these five domains capture
similarities and differences among these broad sets of SE skills measured by the most important
classificatory frameworks and their assessment instruments? One possible way to test this
taxonomic model is to perform structural analyses of a broad set of measures developed or used
by each of these different frameworks, and to test whether the proposed classifications indeed
holds.
The main objective of this research was to perform structural equation modeling to
investigate the self-report SE skill measures that are commonly used in education research.
Specifically, we asked how much of the variance in these measures is related to the Big Five
5

MAPPING QUESTIONNAIRES: WHAT DO THEY MEASURE?
domains. Our main hypothesis is that these measures, even though they have substantively
different names and theoretical origins, are substantially related, at the latent level, to marker
measures of the Big Five.
Method
Participants
Participants were 3,023 students who attended one of 86 classes within 16 schools; these
schools were selected to represent typical levels of performance on standardized achievement in
the State of Rio de Janeiro in Brazil. Students were in the 5th (N=697), 6th (N=710), 9th
(N=674), 10th (N=488), and 12th (454) grades. They were recruited from two distinct
educational systems in Brazil, one funded by the local municipality (student N=2,081) and the
other funded by the state (N=942). The number of students who completed each of the
instruments studied here (see list in Table 2 below) was as follows. Locus of Control: N=1026,
BFI: N=927, SDQ: N=1055, Self-efficacy: N=1011, BFC: N=920, Grit: N=985, Rosenberg Self-
esteem: N=602 (only 4-6th) and CORE Self-Evaluation: N=409 (only 10-12th).
Measures: Seven Self-report Questionnaires
The seven instruments included in this study can be found in Table 2 (for the present
analyses, we used six of them, that is all except the BF-C). Santos and Primi (2014) carefully
reviewed measures that assess social and emotional characteristics and were available in Brazil
or could be translated into Portuguese. They included measures that satisfied four criteria
(predictive power, feasibility, malleability and robustness). This provided a initial set of
measures of personality traits, self-concepts, self-esteem, motivation, attitudes, and beliefs about
the locus of control over events and personal outcomes (i.e., attributing control internally or
externally), and socio-emotional adaptation issues.
Data Collection: Balanced Incomplete Block Design
In order to conduct factor analysis, it is necessary to estimate the full inter-scale
correlation matrix. Ideally this is accomplished by having all student participants answer all
items of all instruments. However, in practice, with 199 items, this is not feasible because
diminished concentration and fatigue are likely to occur when children have to answer more than
even 100 items.
6

MAPPING QUESTIONNAIRES: WHAT DO THEY MEASURE?
In order to obtain a full correlation matrix, a Balanced Incomplete Block design was
employed (BIB; Sailer, 2005). We created booklets of two instruments for 5th and 6th grade
students and three instruments for the 9th, 10th and 12th grades. We systematically produced
combinations of instruments in booklets in a way to balance all pairwise combinations of the
eight scales, such that each pair was included in at least one booklet, and instruments were
equally distributed among students. These combinations generated 20 booklets for younger
children and seven for older students. Each booklet had an average of 67 items.
At the time the data were collected in the classrooms, each student was administered one
booklet. Booklets were systematically distributed within classes, always returning to the first
booklet after the 20th student (younger children) or the 7th student (older children) had received
a booklet. This spiraling strategy produced equivalent random samples of respondents for each
booklet. Therefore, for each pair of items, we had a random sample of children allowing the
calculation of the full inter-item correlation matrix. Considering a statistical power of 0.80 for
the detection of correlations with a magnitude of 0.30 (that is, an 80% chance of detecting a
correlation with a magnitude of 0.30 or more as being statistically significant), it was established
that samples of 85 students would be necessary (Cohen, 1992) for each booklet of items. In the
final sample the number of students answering each booklet ranged from 93 to 252, so final
numbers were well beyond those indicated by the power analysis.
Adaptation of Instruments to Brazilian Context
Translation of items and adaptation of instruments aimed to adapt item content to the
Brazilian target culture in a manner that preserved the intended relationships between indicators
and construct (Borsa, Samásio, & Bandeira, 2012). To do so five steps were followed: (a)
Translation: Two to four researchers prepared independent translations of the instruments. When
a Portuguese version of an instrument already existed, this version was included as an additional
translation. (b) Sensitivity analysis: Two groups of school administrators from the Rio de Janeiro
state and the municipal education systems examined the items and the available translations to
check their suitability for the target population and evaluate possible negative reactions to
particular items by teachers, school directors, and parents. (c) Consensus translation: A final
translation was produced summarizing and implementing all suggestions obtained in the
previous phases. (d) Pilot study: A qualitative pilot study was conducted with 48 children from
7

MAPPING QUESTIONNAIRES: WHAT DO THEY MEASURE?
5th to 9th grades, divided into groups of four or five children each. In some sessions, students
read the items with the help of researchers; in others, they just responded to the items and
explained afterwards to the researchers how they interpreted the items. Researchers checked
whether children understood the items and properly used the Likert five-point rating scale. They
also evaluated whether the item content was suitable for the respective age groups and
understandable within the socio-cultural experience of these Brazilians children. The information
obtained from this careful piloting served to further review the items. (e) Back translation: After
the revisions suggested during previous phases had been implemented, a final version of each
instrument was prepared, translated back into English, and sent to the original authors for
approval.
Length of Questionnaires in School-based Assessment of Socio-emotional Characteristics
Little is known about how many items children as young as 10 years can answer during a
40-minute period, within the usual 50-minute classroom teaching period (10 minutes were
reserved for instructions and demographic and socio-economic background questions). To find
out, a sample of 228 children (5th grade: N=60, 6th grade: N=42 and 10th grade: N=126)
responded to the seven instruments (with their order randomly distributed) until the class period
ended. They were told to answer items in the order in which they were listed in the booklet. Start
and end times of each instrument were recorded for each individual student. While the students
answered items, researchers timed the progress of the sessions and had students switch to a
different-colored pen every ten minutes, thus enabling us to measure the number of items
completed in ten minutes intervals. On average, students answered 4.1 items per minute but, as
expected, we found substantial age differences: The youngest students (5th grade) answered only
2.4 items per minute and a subgroup of slower students answered even fewer (1.5 items per
minute). In terms of the total number of items answered in 40 minutes, this pilot study suggested
three conclusions: (a) the slowest younger children would answer about 60 items, (b) the
average-speed younger children up to 94 items, and (c) the typical 7th and 8th graders up to
about 160 items. Taking into account the slower students, the booklets were limited to 60 items
for 5th graders, and to 120 items for 9th to 12th graders. These thresholds formed the constraints
for the BIB design.
8

MAPPING QUESTIONNAIRES: WHAT DO THEY MEASURE?
Data Analyses
Our rationale was to first investigate whether the known 5-factor structure of the BFI
(e.g., Soto, John, Gosling, & Potter, 2008) would replicate in a Brazilian sample of children and
adolescents in public schools. If so, we could then regress latent SE skills variables on the BFI-
based Big Five factors using Structural Equation Models (SEM). We approached both questions
using item parcels as indicators because we were not interested in individual items per se and are
aware of the extensive literature showing that item-level analysis of socio-emotional and
personality measures tend to be fraught with error, such as acquiescence bias (e.g., Soto et al.,
2008). BFI items were summed on the basis of their inter-correlations and observed internal
consistency, so that each Big Five factor had three parcels as indicators. This strategy is called
homogenous item composites (HIC) and selects items within a domain items that had similar
level of endorsement and inter-item correlations producing homogenous and internally consistent
subset of items.
As personality data tend to be complex and multidimensional in nature, we tested a
constrained and an unconstrained model for the BFI as a means to establish the best
measurement approach for the further analyses. In the fully constrained version, indicators were
allowed to load only on its hypothesized factor (with no cross-loadings at all). This model was
tested via Confirmatory Factor Analysis (CFA). In the unconstrained version, items were free to
load on each one of the hypothesized five factors. This less prohibitive model was tested via
Exploratory Structural Equation Modeling (ESEM). ESEM can be more suitable for multi-
dimensional personality data where secondary item loadings are expected (Marsh et al., 2010), as
is the case for cross-cultural analyses of BFI data (Cf. Benet-Martinez & John, 1998; Schmitt,
Allik, McCrae, & Benet-Martinez, 2007). Accordingly, we hypothesized the ESEM model would
provide a better fit to our data.
In a second step, we sought to map the SE skills measured by each of the other
instruments onto the Big Five framework (as defined by the BFI analysis). To do so, a latent
variable of each SE skill (again measured with item parcels) was regressed on the Big Five
factors, connecting the two measurement models. By relying solely on latent variables for the
regression analyses, we were able to model only the common, reliable variance of indicators of
the SE skills and the Big Five. For instance, when modeling grit, three item parcels were used as
9

MAPPING QUESTIONNAIRES: WHAT DO THEY MEASURE?
indicators of a grit latent factor, which was in turn regressed on the Big Five. Similarly, parcels
were used for modeling the sub-dimensions of self-efficacy, self-esteem, and strengths and
difficulties. This approach is illustrated in Figure 1. We expected at least one of the Big Five
factors would be able to explain each SE skill—namely, one dimension of grit and of external
locus of control, 3 sub-dimensions of self-efficacy, four sub-dimensions of CORE self-
evaluation, and five sub-dimensions of strengths and difficulties.
Given the non-normal distribution of indicator variables, as revealed by an exploratory
analysis of data, we employed a robust estimator for correcting the chi-square test value, namely
Maximum Likelihood Robust (MLR). Models were tested using software Mplus 7.11 (Muthén &
Muthén, 2014).
Results and Discussion
Testing the Big Five Factor Structure in Brazilian Public School Kids
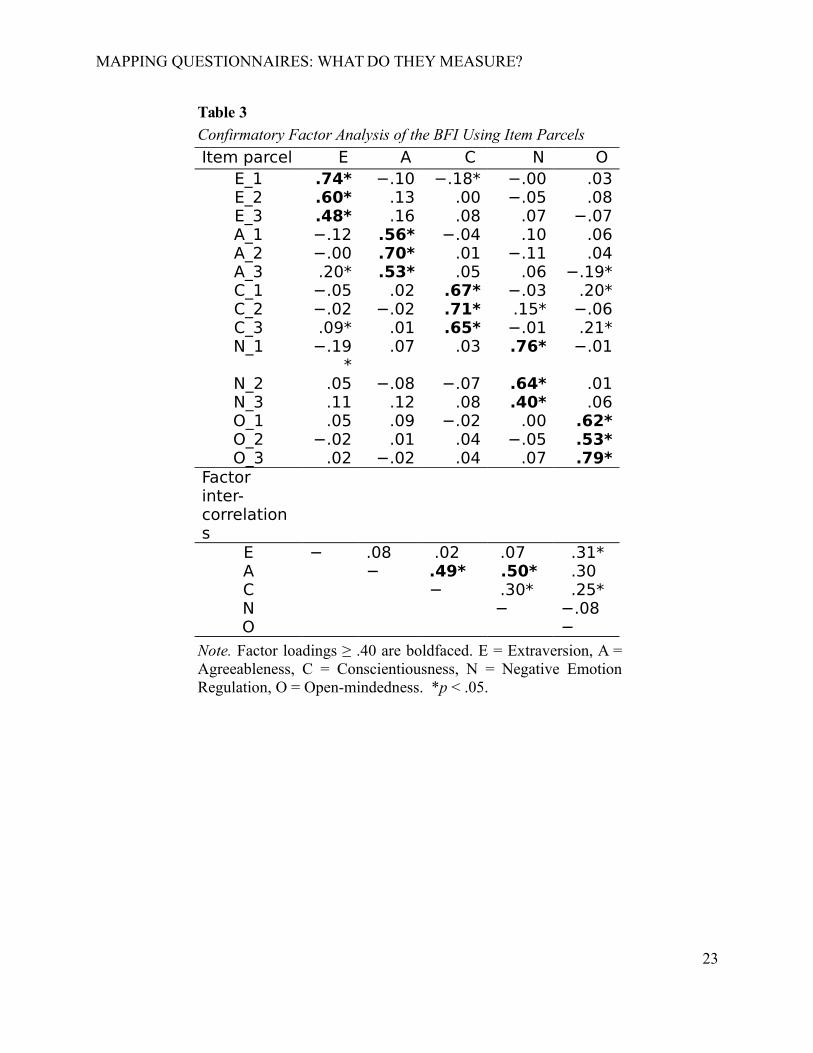
In a first step, we tested the hypothesized five-factor structure of the BFI using HIC item
parcels. Items were summed on the basis of their inter-correlations and observed internal
consistency, so that each Big Five factor had three parcels as indicators. We fitted two models to
the data, a fully constrained and an unconstrained model. In the constrained version, HICs were
specified to load only on their hypothesized factor (no cross-loadings allowed). This model was
tested via Confirmatory Factor Analysis (CFA). In the unconstrained version, items were free to
load on each one of the hypothesized five factors. This less prohibitive model was tested via
Exploratory Structural Equation Modeling (ESEM). Given the non-normal distribution of
indicator variables as revealed by an exploratory analysis of data, in all analyses we employed a
robust estimator for correcting the qui-square test value, namely Maximum Likelihood Robust
(MLR).
The constrained CFA model fitted the data poorly, χ2(80) = 445.91, p < .001, RMSEA = .
070, CFI = .865, TLI = .823, whereas the unconstrained ESEM achieved an excellent fit, χ2(40) =
52.96, p = .082, RMSEA = .019, CFI = .995, TLI = .987. However, when we examined the cross-
loadings that presumably caused the fully constrained model to provide a poor fit to the data, we
found that all the cross-loadings were small in size (≤ .21) when estimated in the ESEM solution.
As shown in Table 3, this ESEM model was entirely consistent with the Big Five factors, as seen
10

MAPPING QUESTIONNAIRES: WHAT DO THEY MEASURE?
in Table 3. Factor inter-correlations ranged from almost null (.02) to more substantial in size
(.50). Specifically, the A factor was more difficult to differentiate from C and N; all the other
correlations remained below .32.
Linking the Big Five Factors to Socio-emotional Skills at the Scale Level
Next, we proceeded to the mapping of SE skills onto the Big Five factors via SEM,
connecting the ESEM model of the BFI and the measurement model of each SE skill via linear
regression. Results from the analyses are presented in Table 4.
As hypothesized, SE skills—grit, locus of control, self-efficacy, self-esteem, and
strengths and difficulties—were linearly related to the Big Five personality factors. Accounted
variance of SE skills by the Big Five factors ranged from a low of 12% for SDQ Peer Problems
to 83% for Grit, with a mean R2 of .50. Grit was strongly and uniquely associated with C, and r
was estimated at .90, suggesting that Grit shared virtually all its reliable variance with the C
factor.
As for locus of control, self-efficacy, self-evaluation, and strengths and difficulties, the
analyses indicated a specific profile of Big Five factors as predictors of each SE skill. External
locus of control was explained by both low E and low N (i.e., more effective Negative Emotion
Regulation). The three self-efficacy scales were all related modestly (about .30) to O, consistent
with the “can do” belief associated with all self-efficacy measures; however, each scale also
showed a substantial correlation with one of the Big Five that differed by the domain in which
self-efficacy beliefs were held: academic self-efficacy was highly related to C (.78), emotional
self-efficacy to N (i.e., negative emotion regulation that is effective), and social self efficacy to
the two interpersonal dimensions in the Big Five, primarily to E ( .62) but also to A (.26).
The CORE elements of Self-evaluation represented various mixes of C, N, and E, which
means that Brazilian school children with positive CORE self-evaluations tended to see
themselves as dedicated and hardworking students (C) that regulate negative emotions well (N)
and are able to engage at school, with their teachers and their peers.
The dimensions from the SDQ revealed a nuanced picture. Prosocial skills (the only non-
problem on the SDQ) were related only to the two interpersonal Big Five factors, primarily A
and to a lesser extent to E, whereas Peer problems were related solely to low E, indicating this
scale captures shy and withdrawn kids who struggle with engaging with their peers and initiating
11

MAPPING QUESTIONNAIRES: WHAT DO THEY MEASURE?
and maintaining contact and friendships. We had expected Emotional Symptoms to be related
substantially and primarily to ineffective regulation of negative emotions, and indeed that
correlations was -.78; however, Emotional symptoms were also negatively related to low A,
indicating that this scale measures emotional problems that interfere with emotional close and
supportive relationships. The Hyperactivity scale, finally, measures a complex construct that
involves three of the Big Five factors. As expected from work on ADHD (Nigg et al. 2002), it
was related to both low C (inability to focus on tasks and school work and sustain attention) and
low N (in effective regulation of negative emotion) as well as to high E, indicating the high
levels energy that accompany hyperactivity in childhood. Overall, these relationships were
conceptually meaningful and consistent with expectations.
Item-Level Analyses of the Multi-Dimensional Socio-emotional Scales
These findings revealed complex Big Five profiles for the three multi-dimensional
instruments (i.e., self-efficacy, self-esteem and strengths and difficulties). It is possible that the
some of the socio-emotional scales (e.g., hyperactivity) have heterogeneous item content (i.e.,
contain a mix of items sampled from different Big Five) which creates their apparent multi-
dimensional profile on the Big Five. Thus, we performed more in-depth, item-level analyses of
the scales on these three instruments. To do so, we tested three ESEM models: a) an ESEM
model regressing the self-efficacy items on the five factors measured by the BFI parcels, b)
another ESEM model regressing the self-evaluation items on the five factors measured by the
BFI parcels, and c) an ESEM model regressing the strengths and difficulties items on the five
factors measured by the BFI parcels. The analyses were designed to test the extent to which the
dimensions from the Big Five can explain the specific socio-emotional skills assessed by the
items on these three inventories.
Results revealed a good approximate fit to the data for the model including items
measuring self-efficacy, χ2(280) = 319.77, p = .051, RMSEA = .009, CFI = .994, TLI = .983,
self-evaluation (CORE), χ2(160) = 263.27, p < .001, RMSEA = .023, CFI = .971, TLI = .937, and
strengths and difficulties (SDQ), χ2(290) = 440.02, p < .001, RMSEA = .017, CFI = .974, TLI = .
930. Tables 4, 5 and 6 present the standardized regression coefficients obtained from the
analyses.
12

MAPPING QUESTIONNAIRES: WHAT DO THEY MEASURE?
Table 5 shows the items from the three self efficacy scales. Most academic self efficacy
items were substantially related to Big Five C, conscientious self-management. Some of these
items had cross-correlations or sole correlations on O, which seem to ask about the ability to tell
other kids about one’s dislikes. Social self efficacy items were associated either with E
(addressing social skills useful for initiating contact or interacting with strangers) or with A
(addressing social skills that result in harmonious and collaborative, rather than conflictual,
interactions). Emotional self efficacy was mostly related to N (effective negative emotion
regulation) but have had some associations with A. In general these items had unique and
coherent links with the Big Five.
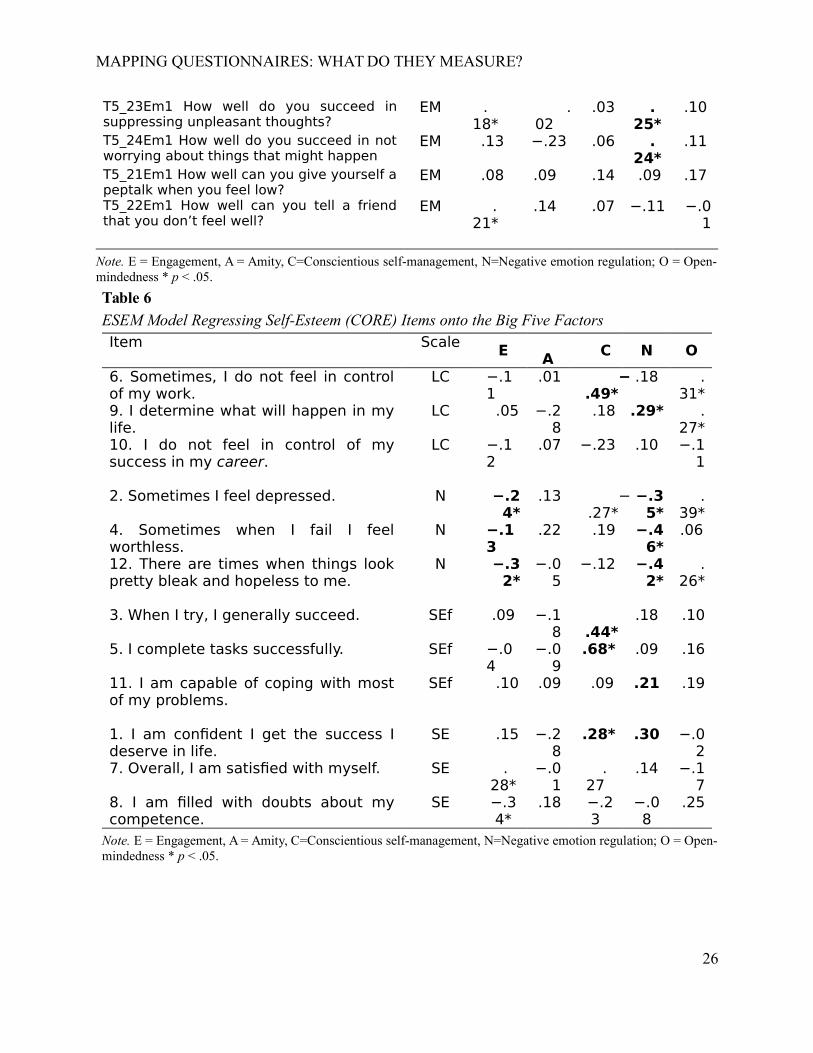
Table 6 shows items loadings of CORE self-evaluation test. Locus of control items were
associated to effective N, O, and C. CORE-Neuroticism items mostly referred to feelings of
sadness, worthlessness, and depression and thus were sensibly related to N but also low E. Some
items had unexpectedly high links with O. Generalized self-efficacy items were most like the
Academic self-efficacy items on the Self-efficacy scale for kids and thus related mainly to C.
Items on self-esteem were related to C and E.
Table 7 shows how the SDQ items were associated with the Big Five. The Conduct
problems items, as we expected, captured a range of different Big Five content, showing
complex but coherent relations: “losing temper” with ineffective emotion regulation (low N) and
high E, “obediently doing as I’m told” with high A, “fighting” with low A and low N, and
“lying” low C. Most emotional symptoms items were, as expected, low on N (problems with
negative-emotion regulation) but 3 items had unexpectedly strong links with A. Peer problems
related mostly to low E and prosocial skills to high A.
Discussion and Conclusions
The present research tested whether a broad set of scales from six instruments commonly
used to assess SE skills in educational settings could be mapped on the space of the socio-
emotional Big Five.
We found that the Grit scale is mainly an expression of the theme of conscientious self-
management. This is consistent with recent findings that empirically grit is the same trait as
Conscientiousness, both genetically and phenotypically (Rimfeld, Kovas, Dale, & Plomin, 2016).
13

MAPPING QUESTIONNAIRES: WHAT DO THEY MEASURE?
Self-efficacy items ask subjects how well they can perform a diverse set of tasks or
behaviors. Our analyses suggest that each task in these measures refers to a specific Big Five
content domain. The “how well” part of the items refers to a general self-perception of being able
to do something. Interestingly the content part, that is, the specific “something” where subjects
report their confidence matched coherently to four of the five core themes of the Big Five: self
management and task oriented behavior (as captured by C) linked to academic self efficacy
items (ability to pay attention, to study, avoiding distractions, do homework). Social self-efficacy
was about interpersonal relationships and so Engagement linked to social task like making
friends, telling funny things to friends, and express opinions, whereas A was linked to social
tasks that involved harmony and getting along (e.g., preventing quarrels). Negative emotion
regulation was related to emotional self efficacy, where the task was to deal with internal,
emotional challenges, like preventing becoming nervous, controlling feelings, or suppressing
unpleasant thoughts.
It is interesting to know that the generalized self efficacy items of the CORE self–
evaluation instrument mapped primarily onto conscientious self management and negative
emotion regulation. The content of the items refers to these two core themes of the Big Five.
Overall, the Big Five model accounted for a high proportion of the variance in the Grit and self
efficacy scales (57% to 83%).
The constructs underlying CORE self esteem, Locus of Control, and SDQ were more
complex representing mixed combination of the core themes. CORE self esteem is comprised of
fundamental traits involved in the evaluation of the self: self-esteem, generalized self-efficacy,
emotional stability and locus of control. We found that generalized self-efficacy was related to C
(self-management) and N (negative emotion regulation). Locus of control was also related to self
management. And self-esteem to engagement and self management. One conclusion is that the
operationalization of self esteem on CORE is a mix of resilience as afforded by the effective
regulation of negative emotion, self-management, and engagement (i.e., energy and positive
emotions).
The Nowicki and Strickland (1973) scale to measure their version of locus of control was
associated with low emotional regulation and low engagement. These results are different from
the associations found on the subscale of the same-named construct in the CORE test. Locus of
14

MAPPING QUESTIONNAIRES: WHAT DO THEY MEASURE?
control refers to “belief that desired effects result from one’s own behavior rather than by fate or
powerful others” (Ferris, Johnson, Rosen, & Tan, 2012, p. 83). Beliefs reflect knowledge inferred
from experiences with particular types of events and thus provide an understanding about the
way the world works, such as beliefs about control, about cognitive growth (i.e., growth mindset)
, and about the chances of succeeding on a undertaking or task (i.e., self-efficacy). Our initial
hypothesis was that these control beliefs would be substantially influenced by the individual’s
traits in the negative emotion regulation (N) domain (De Raad & Schouwenburg, 1996).
However, this influence may be weaker than expected and these SE skills, particularly the beliefs
of control and growth, are not that well represented within the socio-emotional Big Five.
Finally the SDQ is an instrument focused on adaptive versus non-adaptive constructs and
has more scales related to the absence of relevant SE skills than their presence. Its scales were
predicted by specific and coherent core themes: emotional symptoms were linked to low emotion
regulation; hyperactivity symptoms to a combination of low self management, low emotion
regulation, and high engagement (energy); prosocial skills to amity/collaboration and
engagement; and finally peer problems to low engagement and conduct problems to low emotion
regulation.
Overall, the approach taken here illustrates the power afforded by a consensual and
replicable taxonomy of socio-emotional characteristics, such as the Big Five. New constructs and
measures can be described, compared, and understood as combinations of elements that have
long been studied and are well-understood, thus helping us progress as a unified discipline. This
taxonomy can even be helpful when measures are applied in different cultural contexts, like
public school children in Brazil. The present findings give us some hope that knowledge about
socio-emotional characteristics gained in the West can be usefully applied to help solve the
serious problems with education in Brazil.
References
Barbaranelli, C., Caprara, G., Rabasca, A., & Pastorelli, C. (2003). A questionnaire for measuring
the Big Five in late childhood. Personality and Individual Differences, 34 (4), 645-664.
Borsa, J. C., Damásio, B. F. & Bandeira, D. R. (2012). Adaptação e validação de instrumentos
psicológicos entre culturas: algumas considerações. Paidéia (Ribeirão Preto), 22(53),
423-432. DOI: 10.1590/S0103-863X2012000300014.
15

MAPPING QUESTIONNAIRES: WHAT DO THEY MEASURE?
Bandy, T. & Moore, K. (2010). Assessing self-regulation: A guide for out-of-school time
program practitioners. Results-to-Research Brief #2010-23. Child Trends
California Office to Reform Education (2014). Social-Emotional Skills. Retrivied from
http://www.ousd.org/cms/lib07/CA01001176/Centricity/Domain/3154/Social%20and
%20Emotional%20Learning.pdf
Collaborative for Academic, Social, and Emotional Learning. (2012). 2013 Casel Guide:
Effective Social and Emotional Learning Programs. Preschool and Elementary School
Edition. Chicago: KSA-Plus Communications.
Carroll, J. (1963). A model of school learning. The Teachers College Record, 64(8), 723-723.
Cohen, J. (1992). A Power Primer. Psychological Bulletin, 112(1,155-159).
De Fruyt, F., Wille, B., & John, O. P. (2015). Employability in the 21st century: Complex
(interactive) problem solving and other essential skills. Industrial and Organizational
Psychology, 8(02), 276-281.
De Raad, B., & Schouwenburg, H. C. (1996). Personality in learning and education: A review.
European Journal of Personality, 10, 303–336.
Duckworth, A.L, & Quinn, P.D. (2009). Development and validation of the Short Grit Scale
(Grit-S). Journal of Personality Assessment, 91, 166-
Farrington, C.A., Roderick, M., Allensworth, E., Nagaoka, J., Keyes, T.S., Johnson, D.W., &
Beechum, N.O. (2012). Teaching adolescents to become learners. The role of
noncognitive factors in shaping school performance: A critical literature review.
Chicago: University of Chicago Consortium on Chicago School Research.
Ferris, D. L., Johnson, R. E., Rosen, C. C., & Tan, J. A. (2012). Core self-evaluations a review
and evaluation of the literature. Journal of Management, 38(1), 81-128.
Geary, D. C. (2007). An evolutionary perspective on learning disability in mathematics.
Developmental neuropsychology, 32(1), 471-519.
Goodman, R, (1997). The Strengths and Difficulties Questionnaire: A Research Note. Journal of
Child Psychology and Psychiatry, 38, 581-586.
16

MAPPING QUESTIONNAIRES: WHAT DO THEY MEASURE?
John, O. P. & De Fruyt, F. (2016). Framework for the Longitudinal Study of Socio and
Emotional Skills in Cities. Paris: OECD. http://www.oecd.org/callsfortenders/CfT
%20100001311%20Longitudinal%20Study%20of%20Social%20and%20Emotional
%20Skills%20in%20Cities.pdf
John, O. P., Donahue, E. M., & Kentle, R. L. (1991). The Big Five Inventory—Versions 4a and
54. Berkeley, CA: Institute of Personality and Social Research, University of California.
John, O. P., Naumann, L., & Soto, C. J. (2008). Paradigm shift to the integrative Big
Five trait taxonomy: Discovery, measurement, and conceptual issues. In O.P.
John, R.W. Robins, & L.A. Pervin (Eds.), Handbook of personality: Theory and
research (3rd ed., pp. 114-158). New York: Guilford.
Judge, T. A., Erez, A., Bono, J. E., & Thoresen, C. J. (2003). The core self-evaluations scale:
Development of a measure. Personnel Psychology, 56(2), 303-331. doi: 10.1111/j.1744-
6570.2003.tb00152.x
Kyllonen, P. C., Lipnevich, A. A., Burrus, J., & Roberts, R. D. (2014). Personality, motivation,
and college readiness: A prospectus for assessment and development. ETS Research
Report Series, 1-48.
Marsh, H. W., Lüdtke, O., Muthén, B., Asparouhov, T., Morin, A. J., Trautwein, U., &
Nagengast, B. (2010). A new look at the Big Five factor structure through exploratory
structural equation modeling. Psychological Assessment, 22(3), 471.
Marsh, H. W., Hau, K. T., Artelt, C., Baumert, J., & Peschar, J. L. (2006). OECD's brief self-
report measure of educational psychology's most useful affective constructs: Cross-
cultural, psychometric comparisons across 25 countries. International Journal of Testing,
6(4), 311-360.
Muris, P. (2001). A brief questionnaire for measuring self-efficacy in youths. Journal of
Psychopathology and Behavioral Assessment, 23(3), 145-149.
Muthén, L. K. & Muthén, B. O. (2012). Mplus User’s Guide. Seventh Edition. Los Angeles, CA:
Muthén & Muthén.
17

MAPPING QUESTIONNAIRES: WHAT DO THEY MEASURE?
National Research Council. (2012). Education for Life and Work: Developing Transferable
Knowledge and Skills in the 21st Century. Washington, DC: The National Academies
Press.
Nigg, J. T., John, O. P., Blaskey, L., Huang-Pollock, C., Willcutt, E. G., Hinshaw, S. P., &
Pennington, B. (2002). Big Five dimensions and ADHD symptoms: Links between
personality traits and clinical symptoms. Journal of Personality and Social Psychology,
83, 451-469.
Nowicki S. & Strickland B. R. (1973). A locus of control scale for children. Journal of
Consulting and Clinical Psychology. Vol 40(1), 148-154. doi:10.1037/h0033978
OECD (2016) Longitudinal study of social and emotional skills in cities. Paris: OECD
(http://www.oecd.org/callsfortenders/CfT%20100001311%20Longitudinal%20Study
%20of%20Social%20and%20Emotional%20Skills%20in%20Cities.pdf)
Partnership for 21st Century Skills (2015). www.p21.org.
Poropat, A. E. (2009). A meta-analysis of the five-factor model of personality and academic
performance. Psychological bulletin, 135(2), p.322-338.
Primi, R; Santos, D.; Fruyt, F. & John, O. P. (in press). Development of an Inventory Assessing
Social and Emotional Skills in Brazilian Youth. European Journal of Psychological
Assessment, 2015.
Primi, R.; Zanon, C. ; Santos, D.; Fruyt, F. ; John, O. P. (in press). Can Anchoring Vignettes
Make Adolescent Self-reports of Social-emotional Personality Traits More Reliable,
Discriminant, and Criterion-valid?. European Journal of Psychological Assessment,
Rimfeld, K., Kovas, Y., Dale, P. S., & Plomin, R. (2016, February 11). True Grit and Genetics:
Predicting Academic Achievement From Personality. Journal of Personality and Social
Psychology . Advance online publication. http://dx.doi.org/10.1037/pspp0000089
18

MAPPING QUESTIONNAIRES: WHAT DO THEY MEASURE?
Roberts, R., Martin, J. E. & Olaru, G. (2015). A Rosetta Stone for Noncognitive Skills:
Understanding, Assessing, and Enhancing Noncognitive Skills in Primary and Secondary
Education. New York: Asia Society, Professional Examination Service.
Sailer, O. (2005): crossdes: A package for design and randomization in crossover studies. Rnews
5/2, 24-27.
Santos, D., & Primi, R. (2014). Social and emotional development and school learning: a
measurement proposal in support of public policy. Technical report for Organization for
Economic Cooperation and Development (OCDE) Rio de Janeiro State Education
Department (SEEDUC) and Ayrton Senna Institute. São Paulo: Ayrton Senna Institute.
Schmitt, D. P., Allik, J., McCrae, R. R., & Benet-Martinez, V. (2007). The Geographic
Distribution of Big Five Personality Traits: Patterns and Profiles of Human Self-
Description Across 56 Nations. Journal of Cross-Cultural Psychology, 38(2), 173–212.
doi:10.1177/0022022106297299
Strive Task Force on Measuring Social and Emotional Learning (2013). Beyond content:
incorporating social and emotional learning into the strive framework. New York:
Philiber Research Associates (PRA).
Trilling, B., & Fadel, C. (2009). 21st century skills: Learning for life in our times. San Francisco,
CA: Jossey-Bass.
19
MAPPING QUESTIONNAIRES: WHAT DO THEY MEASURE?
Table 1
Socio-emotional Big Five Model and Its Relationship to Six Important Frameworks for Socio-emotional Skills
C: Conscien-tious self-
Management
N: Negativeemotion
regulation
O: Open-mindedness
E: Engage-ment (Extra-
version)
A: Amity(Kindness)
Socio-emotional Big Five model
Core themes (De Raad &Shouwemburg, 1996)
task oriented behavior, will to achieve
affect and emotional regulation
imagination, intellect, autonomy
expression ofenergy and power
love, aceptance, peacefulness interpersonal relationships
Educational related features (Poropat, 2009 and De Raad & Shouwemburg, 1996 )
will to achieve, sustained effort and goal setting, compliance with and concentration on homework, learning- related time management andeffort regulation
self-efficacy, confidence, adaptive mastery-oriented stylein the face of obstacles and negative emotionality, perceived selfcontrol over outcomes
desire for learning, intellectual drive and engagement, interest, idea production, creativity andoriginality
Energy and socialization that could facilitate and/or prevent learning
cooperation with learning processes, compliance with teacher instructions
FrameworksOrganizational for Economic Co-operationa dn Development (OECD)Longitudinal Study of Skills Development in Cities
Achieving goals Managing emotions
Working withothers (engagement)
Working with others (getting along)
Colaborative for Academic, Social and Emotional Learning (CASEL)
Responsible decision-making,Self-management
Self-management
Self-awareness
Relationship skills, Social awareness
California Office to Reform Education (CORE)
Self-Management
Growth Mindset, Self-Efficacy
Social awareness
CHICAGO consorsiumAcademic perseverance, learning strategies, academic
Academic mindset
Social Skills Social Skills
20

MAPPING QUESTIONNAIRES: WHAT DO THEY MEASURE?
C: Conscien-tious self-
Management
N: Negativeemotion
regulation
O: Open-mindedness
E: Engage-ment (Extra-
version)
A: Amity(Kindness)
behaviours
National Research Council Review
Intra-personal: work ethic/conscientiousness Type 1 self-regulation (metacognitive skills, including forethought, performance, andself- reflection)
Intra-personal: Positive CoreSelf-Evaluation Type 2 self-regulation (self- moni-toring, self-evaluation, self- rein-forcement)
Intra-personal: intellectual openness
Inter-personal: leadership
Inter-personal: teamwork and collaboration
Partnership for 21st Century Skills
Initiative and Self-Direction, Productivity and Accountability, Responsibility
Flexibility and Adaptability
Flexibility Leadership, Initiative
Social and Cross-CulturalSkills
Strive Together Network Academic self-efficacy, Grit/ perseverance, Self-regulated learning/ study skills
Growth mindset/ mastery orientation, Emotional competence
21

MAPPING QUESTIONNAIRES: WHAT DO THEY MEASURE?
Table 2
Selected Instruments: Names, Abbreviations, Number of Items and Scales, and ScaleNames
Instrument Items Scales Names of scales
Locus of Control ScaleNowicki & Strickland (1973)
21 1 Locus of control
Strengths and Difficulties Questionnaire (SDQ)Goodman (1997)
25 5
Emotional symptoms,Conduct problems,Hyperactivity, Peer problems,Prosocial skills
Big Five Inventory (BFI)John et al. (1991)
44 5Extraversion, Agreeableness,Conscientiousness,Neuroticism, and Openness
Self-Efficacy Questionnaire for Children (SEQ-C)
Muris (2001)
24 3Academic, Social, and
Emotional self-efficacy
Big Five for Children (BF-C) Barbaranelli et al. (2003)
65 5Neuroticism, Extraversion,Openness, Agreeableness,Conscientiousness
Core Self-Evaluations (CORE)Judge et al. (2003)
12 1
Positive vs. negativeself-evaluation (combinedself-esteem, generalized self-efficacy, locus of control, lowneuroticism)
Grit ScaleDuckworth & Quinn (2009)
8 1 Grit
Total 199 20 16
22
MAPPING QUESTIONNAIRES: WHAT DO THEY MEASURE?
Table 3
Confirmatory Factor Analysis of the BFI Using Item Parcels
Item parcel E A C N OE_1 .74* −.10 −.18* −.00 .03E_2 .60* .13 .00 −.05 .08E_3 .48* .16 .08 .07 −.07A_1 −.12 .56* −.04 .10 .06A_2 −.00 .70* .01 −.11 .04A_3 .20* .53* .05 .06 −.19*C_1 −.05 .02 .67* −.03 .20*C_2 −.02 −.02 .71* .15* −.06C_3 .09* .01 .65* −.01 .21*N_1 −.19
*.07 .03 .76* −.01
N_2 .05 −.08 −.07 .64* .01N_3 .11 .12 .08 .40* .06O_1 .05 .09 −.02 .00 .62*O_2 −.02 .01 .04 −.05 .53*O_3 .02 −.02 .04 .07 .79*
Factorinter-correlations
E − .08 .02 .07 .31*A − .49* .50* .30C − .30* .25*N − −.08O −
Note. Factor loadings ≥ .40 are boldfaced. E = Extraversion, A =Agreeableness, C = Conscientiousness, N = Negative EmotionRegulation, O = Open-mindedness. *p < .05.
23

MAPPING QUESTIONNAIRES: WHAT DO THEY MEASURE?
Table 4
Mapping of Socio-emotional Variables from Major Instruments onto the Big Five Factors
Tests mapped E A C N O R2
1. GritGrit 0.01 0.03 .90* 0.05 −.09 .83
2. LocusExternal Locus -0.28* -0.01 -0.20 -0.41* -0.20 .45
3. Self-efficacy Achievement .00 −.04 .78* −.13 .37* .82
Emotional .24* .03 .07 .57* .27* .57 Social .62* .26* −.07 .12 .30* .78
4. Self-evaluation(CORE)
S-Eff 0.08 −.10 .56* .24* 0.18 .47LC 0.14 −.17 .47* 0.05 0.05 .21N .32* −.09 0.03 .56* −.33* .50SE .39* −.19 .29* 0.24 −.22 .28
5. Strengths and Difficulties (SDQ)Conduct problems 0.16 −.28 −.15 −.32* 0.1 .37Emot. symptoms −.12 .51* −.14 −.73* −.05 .46
Hyperactivity .30* 0.21 −.49* −.42* −.12 .47Peer Problems −.26* −.12 −.07 −.10 0.19 .12Prosocial Skills .22* .58* 0.15 −.30 0.05 .43
Note. E = Engagement, A = Amity, S self management (C Conscientiousness), ER emotional resilience (Em =Emotional Stability), O = Openness, AC = Academic Self-Efficacy, EM = Emotional Self-Efficacy, SC =Social Self-Efficacy, S-Eff= generalized self efficacy, LC = locus of control, N = neuroticism , SE = selfesteem; CP = Conduct Problems, ES = Emotional Symptoms, HA = Hyperactivity, PP = Peer Problems, PS =Pro-Sociality. *p < .05. ** Additionally, we tested a model in which a general factor of self-esteem, measuredby item parcels (GF, GS, LC, N and SE), was regressed on the Big Five factors. The model had a goodapproximate fit to the data, χ2(97) = 204.86, p < .001, RMSEA = .030, CFI = .965, TLI = .938, and thestandardized regression coefficients were: .48 (p < .05) for E, −.24 (p > .05) for A, .53 (p < .05) for C, .48 (p< .05) for Em, and −.22 (p > .05) for O. This general factor of self-esteem had 72% of variance accounted forby the Big Five factors.
24

MAPPING QUESTIONNAIRES: WHAT DO THEY MEASURE?
Table 5
ESEM Regression Model: Using the Big Five Factors to Predict Self-Efficacy Items in ThreeDomains: Achievement (AC), Social (Soc), and Emotional (EM)Item Scal
e
EA C N O
T5_01Ac1 How well can you get teachers tohelp you when you get stuck onschoolwork? (Asstv)
AC .01 .01 .12 −.17 .37*
T5_02Ac1 How well can you study whenthere are other interesting things to do?
AC −.03 −.05 .58*
−.08 .19*
T5_04Ac1 How well do you succeed infinishing all your homework every day?
AC .01 −.11 .54*
−.22 −.09
T5_05Ac1 How well can you pay attentionduring every class?
AC −.08 −.03 .52*
.03 .18
T5_07Ac1 How well do you succeed insatisfying your parents with yourschoolwork?
AC .07 .00 .50*
−.09 .10
T5_03Ac1 How well can you study achapter for a test?
AC −.08 −.11 .38*
.00 .25*
T5_08Ac1 How well do you succeed inpassing a test?
AC .03 .02 .28* −.03 .30*
T5_06Ac1 How well do you succeed inpassing all subjects?
AC .04 −.05 .19 .06 .13
T5_10Sc1 How well can you become friendswith other children?
Soc .50* .10 .05 .07 −.02
T5_14Sc1 How well can you tell a funnyevent to a group of children?
Soc .48* −.01 −.13
.23* .23*
T5_15Sc1 How well do you succeed instaying friends with other children?
Soc .41* .24 .01 .00 .05
T5_11Sc1 How well can you have a chatwith an unfamiliar person?
Soc .28* −.02 −.08
.06 .10
T5_09Sc1 How well can you express youropinions when other classmates disagreewith you? (Asstv)
Soc .21* −.14 .03 .18 .44*
T5_13Sc1 How well can you tell otherchildren that they are doing something thatyou don’t like? (Asstv)
Soc .19* .00 .02 .02 .21*
T5_12Sc1 How well can you work inharmony with your classmates? (A)
Soc .16* .47* .08 −.12 .09
T5_16Sc1 How well do you succeed inpreventing quarrels with other children? (A)
Soc −.04 .40* −.12
−.04 −.01
T5_20Em1 How well can you control yourfeelings?
EM −.21*
−.27* .04 .59*
.32*
T5_19Em1 How well can you prevent tobecome nervous?
EM −.04 .09 −.13
.46*
.02
T5_18Em1 How well do you succeed inbecoming calm again when you are veryscared?
EM .02 .06 −.03
.25*
.20*
25
MAPPING QUESTIONNAIRES: WHAT DO THEY MEASURE?
T5_23Em1 How well do you succeed insuppressing unpleasant thoughts?
EM .18*
.02
.03 .25*
.10
T5_24Em1 How well do you succeed in notworrying about things that might happen
EM .13 −.23 .06 .24*
.11
T5_21Em1 How well can you give yourself apeptalk when you feel low?
EM .08 .09 .14 .09 .17
T5_22Em1 How well can you tell a friendthat you don’t feel well?
EM .21*
.14 .07 −.11 −.01
Note. E = Engagement, A = Amity, C=Conscientious self-management, N=Negative emotion regulation; O = Open-mindedness * p < .05.
Table 6
ESEM Model Regressing Self-Esteem (CORE) Items onto the Big Five FactorsItem Scale
E A
C N O
6. Sometimes, I do not feel in controlof my work.
LC −.11
.01 −.49*
.18 .31*
9. I determine what will happen in mylife.
LC .05 −.28
.18 .29* .27*
10. I do not feel in control of mysuccess in my career.
LC −.12
.07 −.23 .10 −.11
2. Sometimes I feel depressed. N −.24*
.13 −.27*
−.35*
.39*
4. Sometimes when I fail I feelworthless.
N −.13
.22 .19 −.46*
.06
12. There are times when things lookpretty bleak and hopeless to me.
N −.32*
−.05
−.12 −.42*
.26*
3. When I try, I generally succeed. SEf .09 −.18
.44*
.18 .10
5. I complete tasks successfully. SEf −.04
−.09
.68* .09 .16
11. I am capable of coping with mostof my problems.
SEf .10 .09 .09 .21 .19
1. I am confident I get the success Ideserve in life.
SE .15 −.28
.28* .30 −.02
7. Overall, I am satisfied with myself. SE .28*
−.01
.27
.14 −.17
8. I am filled with doubts about mycompetence.
SE −.34*
.18 −.23
−.08
.25
Note. E = Engagement, A = Amity, C=Conscientious self-management, N=Negative emotion regulation; O = Open-mindedness * p < .05.
26

MAPPING QUESTIONNAIRES: WHAT DO THEY MEASURE?
Table 7
ESEM Model Regressing SDQ Items onto the Big Five FactorsItem Fact
or E A C N O
5. I get very angry and often lose mytemper.
CP .22* −.17
.06 −.55
*
−.03
7. I usually do as I am told. CP .0533* 19*
−.18
−.18
12. I fight a lot. I can make otherpeople do what I want.
CP .15
−.25
.08 −.36*
.09
18. I am often accused of lying orcheating.
CP .09 .03.25*
−.17
−.01
22. I take things that are not minefrom home, school or elsewhere.
CP .01
−.12
−.06
.03
−.05
8. I worry a lot. ES .00
.24 .20 −.39*
.06
3. I get a lot of headaches, stomachaches or sickness.
ES −.11
.09 −.06
−.26*
−.04
13. I am often unhappy, down-heartedor tearful.
ES −.11
.05 .09 −.41*
.02
16. I am nervous in new situations. Ieasily lose confidence.
ES −.13
.33* .25*
−.52*
−.08
24. I have many fears, I am easilyscared.
ES −.03
.44*
−.11
−.53 .14
2. I am restless, I cannot stay still forlong.
HA .49*
.03 −.17
−.25*
−.04
10. I am constantly fidgeting orsquirming.
HA .17*
.21 −.08
−.39*
−.13
15. I am easily distracted, I find itdifficult to concentrate.
HA .00 .26* .47*
−.37*
−.04
21. I think before I do things. HA .17* .0529*
.07 .16
25. I finish the work I'm doing. Myattention is good.
HA .03 −.07 43*
.16 .11
6. I am usually on my own. I generallyplay alone or keep to myself.
PP −.33*
.00 −.10
−.09 .10
11. I have one good friend or more. PP .15* −.04
.11 −.09 −.05
14. Other people my age generallylike me.
PP .21*.27*
.06 −.06 −.05
19. Other children or young peoplepick on me or bully me.
PP .15 −.10
.06 −.23 −.06
23. I get on better with adults thanwith people my own age.
PP −.15
−.20
.12 −.07.29*
27

MAPPING QUESTIONNAIRES: WHAT DO THEY MEASURE?
1. I try to be nice to other people. Icare about their feelings.
PS −.03 52*
−.06
−.14 .22*
4. I usually share with others (food,games, pens etc.).
PS .1137*
.05 −.09 −.11
9. I am helpful if someone is hurt,upset or feeling ill.
PS .18* .25*
−.07
−.21*
.11
17. I am kind to younger children. PS .18* .25 .17 −.10 −.13
20. I often volunteer to help others(parents, teachers, children).
PS .07.34*
.20*
−.29*
.13
Note. E = Engagement, A = Amity, C=Conscientious self-management, N=Negative emotion regulation; O= Open-mindedness * p < .05.
Figure 1. Structural Equation Models of interest. SE (socioemotional) latent variables
measured by item parcels are regressed on the Big Five variables. For the sake of
simplicity, the diagram depicts only two indicators (item parcels) per latent variable, and
it suppresses error terms.
28