Manufacturing 2015: The Return of Profitability · 7 Manufacturing 2015: The Return of...
20
$150 USD Manufacturing 2015: The Return of Profitability Executive Summary of Benchmark Data and Analysis from the MPI Manufacturing Study Conducted by The Manufacturing Performance Institute a division of The MPI Group, Inc.
Transcript of Manufacturing 2015: The Return of Profitability · 7 Manufacturing 2015: The Return of...

$150 USD
Manufacturing 2015: The Return of ProfitabilityExecutive Summary of Benchmark Data and Analysisfrom the MPI Manufacturing Study
Conducted by The Manufacturing Performance Institutea division of The MPI Group, Inc.
Introduction | 2
Human Resources | 3
Operations | 5
Supply Chain | 8
Capital Equipment | 10
Information Technology | 11
Internet of Things | 12
Green/Sustainability | 13
Plant Profiles | 14
Methodology | 15
Presentation of Data | 15
About The MPI Group | 16
More Study Data | 16
Contents

The MPI Group / Manufacturing 2015: The Return of Profitability 2
IntroductionM anufacturing 2015: The Return of Profitability
examines plant-level performances and practices for facilities in the United States. The MPI Manufacturing Study was conducted by The MPI Group and is intended to help manufacturing executives benchmark their operations performances; compare best practices; assess management of workforces, equipment, and technologies; and, ultimately, improve.
Manufacturing 2015: The Return of Profitability illustrates the changes underway among U.S. manufacturers and hints at what’s to come:
• Manufacturing employment will rise: Plant employment is likely to pick up in 2015, and manufacturers are taking steps — e.g., higher wages — to retain the em-ployees they have in the face of rising labor turnover rates, as workers leave for opportunities elsewhere. For many plants, labor turnover is problematic, reaching double-digit percentages.
• Operations are now driven by improvement methodologies: Lean manufacturing remains the No. 1 improvement approach in man-ufacturing, especially among executives who value process improvement. Process improvements are boosting profitability for a majority of plants, but production gains are increasingly incremental.
• Supply chains remain focused on cost and qual-ity, rather than collaboration: Manufacturers are struggling to manage global supply chains. Too many still approach customer and supplier relationships as “buy-and-sell” transactions, missing out on the ad-vantages of collaboration and partnering.
• Production capacities are strained: Production volumes have reached their highest levels in years (as a percentage of designed ca-pacity). Many manufacturers are consid-ering expansions or new facilities, while others look for capacity by improving the reliability of their equipment.
• Information technology (IT) effectiveness varies dramatically: Some functions, such as pro-duction and scheduling, are improving thanks to effective IT applications and systems. But others, such as asset man-agement and customer service, exhibit poor IT performances. Human resources and logistics are the most likely targets for upgraded IT this year.
• Plants are getting started with the Internet of Things (IoT): Few manufacturers have an IoT strategy in place. But there is IoT movement: plants have begun to embed intelligence into their equipment and production lines, a first step in getting an IoT strategy off the ground.
• Green and sustainability efforts lag: A majority of manufacturers are mostly ignoring green and sustainability initiatives. Adoption of green practices — and improvements in green metrics — seems to have stalled.
For more information on U.S. manufacturing performance, practices, and trends, read on.
John R. BrandtCEOThe MPI Group

3 Manufacturing 2015: The Return of Profitability / The MPI Group
1 Bureau of Labor Statistics, February 2015.
Human Resources: The War for Talent IntensifiesHiring and retaining employees will be harder in 2015
The last year saw manufacturers across the country hiring at last, amid rising
demand and strained production capaci-ties. In January 2015, U.S. manufacturing employment reached 12.33 million — an increase of nearly 8 percent since January 2010.1 Employment is expected to keep rising in 2015:
• 119 employees per plant in 2014 to 125 employees in 2015 (median)
• 442 employees per plant in 2014 to 476 employees in 2015 (average).
Annual labor turnover rates are increasing as well, to 6% (median) from 5% in recent years. Nearly a quarter of manufacturers had labor turnover rates of 15% or higher, indicating greater employee willingness to change jobs.
Pressure to retain employees is leading to higher wages:
• $18.00 wages (median) in 2014 vs. $17.00 in 2012.
• $13.00 starting wages (median) in 2014 vs. $12.00 in 2012.
Some 71% of plant executives report that employee wages increased in the past 12 months, and 65% report that benefits costs increased.
Developing an engaged, well-trained workforce matters more than ever
About half of plants train each employee more than 20 hours annually. Nearly two-thirds of plants have a formal employee-training program in place, and 60% have a leader/supervisor development program.
Some 38% of plants have a majority of production workers in empowered or self-directed teams, and 80% of plants empower at least some workers.
Among plants that train employees more than 20 hours annually, 48% have empow-ered a majority of their employees — vs. just 21% of plants that train less.
Nearly a quarter of manufacturers had labor turnover rates of 15% or higher, indicating greater employee
willingness to change jobs.
The MPI Group / Manufacturing 2015: The Return of Profitability 4
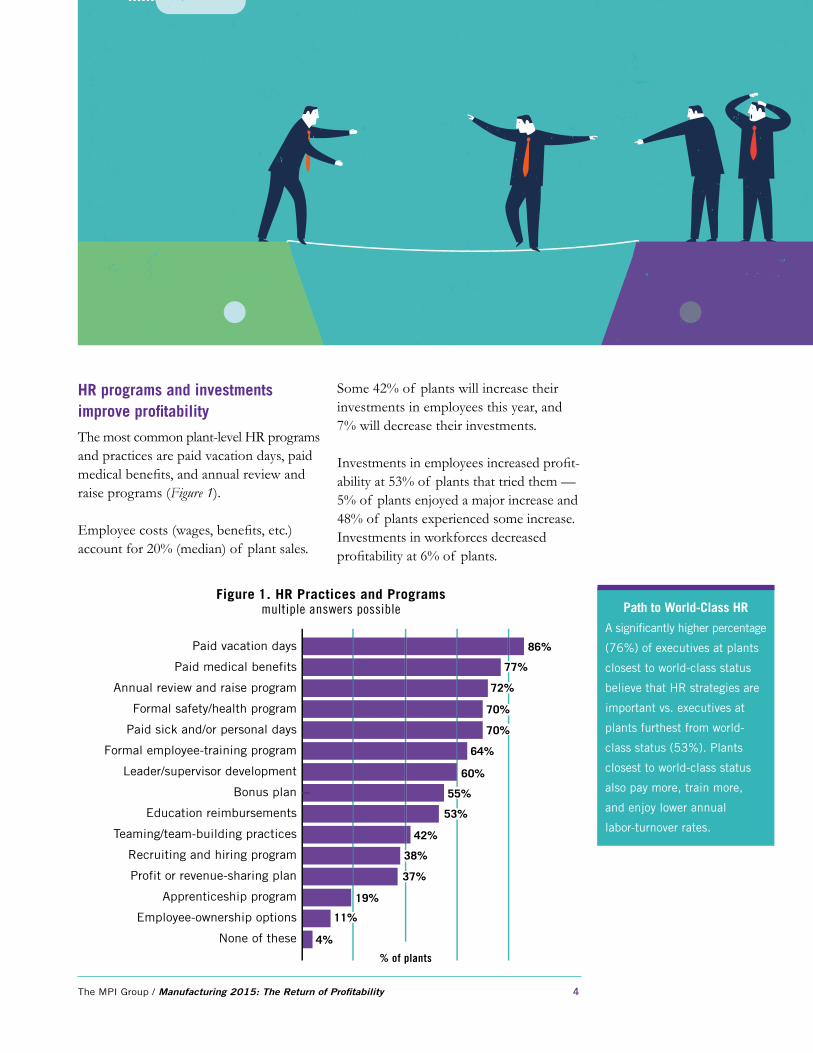
HR programs and investments improve profitability
The most common plant-level HR programs and practices are paid vacation days, paid medical benefits, and annual review and raise programs (Figure 1).
Employee costs (wages, benefits, etc.) account for 20% (median) of plant sales.
Some 42% of plants will increase their investments in employees this year, and 7% will decrease their investments.
Investments in employees increased profit-ability at 53% of plants that tried them — 5% of plants enjoyed a major increase and 48% of plants experienced some increase. Investments in workforces decreased profitability at 6% of plants.
86%Paid vacation days
Paid medical benefits
Annual review and raise program
Formal safety/health program
Paid sick and/or personal days
Formal employee-training program
Leader/supervisor development
Bonus plan
Education reimbursements
Teaming/team-building practices
Recruiting and hiring program
Profit or revenue-sharing plan
Apprenticeship program
Employee-ownership options
None of these
% of plants
77%
72%
70%
70%
64%
60%
55%
53%
42%
38%
37%
19%
11%
4%
Figure 1. HR Practices and Programsmultiple answers possible Path to World-Class HR
A significantly higher percentage
(76%) of executives at plants
closest to world-class status
believe that HR strategies are
important vs. executives at
plants furthest from world-
class status (53%). Plants
closest to world-class status
also pay more, train more,
and enjoy lower annual
labor-turnover rates.

5 Manufacturing 2015: The Return of Profitability / The MPI Group
Operations: Lean Holds Center StageProcess improvement is critical to survival
Lean — characterized by the flow of goods through production, pull systems,
and a continuous effort to find problems and remove waste — is in place at two-thirds of manufacturing plants (Figure 2).
Some 73% of executives report that process improvement is important to their plants’ success over the next five years. Among that group, 75% follow lean manufacturing vs. just 44% of plants that pay less attention to process improvement.
Some 72% of plants report moderate, extensive, or complete adoption of their improvement methodologies (including lean), and have engaged 50% (median) of the workforce in implementing their improvement efforts.
The five most common operations practices and programs are focused on improvement:
• Continuous improvement program: 71% of plants
• Quality certifications: 55%
• Waste elimination: 51%
• Benchmarking: 49%
• Value-stream mapping: 40%
Process improvement investments improve profitability
Process improvement investments accounted for 5% (median) of plant sales; 32% of plants will increase investments this year, and 6% will decrease process-improvement investments.
Improvement methodologies increased profitability at 63% of plants that tried them — 9% of plants enjoyed a major increase and 54% experienced some increase.
Improvement methodologies decreased profitability at 2% of plants.
66%Lean Manufacturing
Six Sigma
Total Quality Management
Theory of Constraints
Toyota Production System
Agile Manufacturing
Other methodology(ies)
No methodology
Figure 2. Improvement Methodology(ies)multiple answers possible
% of plants
36%
31%
12%
10%
6%
13%
17%

The MPI Group / Manufacturing 2015: The Return of Profitability 6
Cost pressures are damaging bottom lines
Production output (unit volume) increased last year at 64% of plants.
Approximately 59% of plants increased sales per employee. Sales per employee was $180,900 (median) in 2014, down slightly from 2012 ($192,000).
Unfortunately, costs (excluding purchased materials) decreased at only 35% of plants over the last three years.
Total inventory turn rate increased at only 45% of plants (see Figure 3 for current inventory turn rates). Many plants are likely buffering production for increased demand with time and labor (overtime), as well as inventories.
Executives plan only modest increases in material and component investments
Material and component costs accounted for 25% (median) of plant sales. Some 33% of plants will increase investments in the next year; 9% will decrease them.
The most common inventory practices are:
• Just-in-time supplier deliveries: 46% of plants
• Pull systems with kanban signals: 34%
• Vendor-managed or -owned inventories: 31%
• Quick equipment changeover: 24%
• One-piece flow techniques: 23%.
14.0%Raw materialinventory turn rate
Work-in-process materialinventory turn rate
Finished goodsinventory turn rate
Total inventory turn rate
Figure 3. Inventory Turn rates
% of plants
96.1%
17.7%
101.8%
84.2%
12.0%
21.5%
97.0%
Median Average

7 Manufacturing 2015: The Return of Profitability / The MPI Group
Production metrics for plants are generally better than “three years ago.” For example, the current scrap and rework rate (as a percentage of sales) is 2% (median) vs. 4% three years ago.
Yet many facilities have put their growth and survival at risk by neglecting key measures. For example, one-third of plants report a scrap and rework rate of 5% or higher.
Production performances vary dramatically
Path to World-Class Operations
Plants closest to world-class status are more likely to use lean (75%) than plants furthest
from world-class status (58%). This focus drives better performances at plants closest to
world-class status vs. those furthest away:
n Sales per employee — $200,000 (median) vs. $164,474 at other plants
n Total inventory turns per year — 12 turns (median) vs. 10 turns
In contrast, 26% of plants furthest from world-class status have no improvement methodology.
Many facilities have put their growth and
survival at risk by neglecting key measures.
12.0 daysManufacturing cycle time
On-time delivery rate
Perfect delivery rate
Finished-product first-pass yield
Scrap and rework rate (% of sales)
Warranty costs (% of sales)
Cost of goods sold as a percentageof plant revenue
Labor as a percentageof cost of goods sold
Overhead as a percentageof cost of goods sold
Materials as a percentageof cost of goods sold
Figure 4. Current-Year Production Performances
% of plants
77.4 days
97.0%
91.8%
60.0%
55.8%
45.0%
44.8%
2.0%
1.0%
4.5%
3.2%
95.0%
95.0%
92.3%
87.8%
25.5%
29.7%
25.0%
25.6%
Median Average

The MPI Group / Manufacturing 2015: The Return of Profitability 8
Supply Chain: Buying and Selling Goes GlobalAre manufacturers overly focused on costs?
Approximately one-third of executives describe their plants’ relationships
with suppliers and with customers as “buy and sell” (Figure 5).
Most executives report that component/material costs rose in the past 12 months (at 64% of plants). Similarly, logistics/transport and utility/fuel costs also rose (at 66% and 63% of plants, respectively).
Unfortunately, only 55% of executives saw prices for their own products rise.
A gap between strategy and execution threatens supply-chain performances
Most executives (74%) believe that supply-chain management is important or highly important to their plants’ success over the next five years. Yet only half have imple-mented certification of major suppliers (53% of plants) or customer-satisfaction surveys (51%).
The most common criteria used in assess-ing suppliers are quality/reliability, delivery, and total cost (Figure 6).
Figure 5. Supply-Chain Relationships
With suppliers% of plants
With customers% of plants
Buy and sell (e.g., cost and quality focus) 36% 33%
Certification (e.g., broad qualifications established) 19% 23%
Cooperation (e.g., sharing product ideas, best practices) 19% 22%
Partnership (e.g., sharing resources, intellectual property, cost savings) 26% 22%
Quality/reliability
Delivery (to schedule)
Total cost
Adherence to specifications
Service/responsiveness
Productivity
Environmental performance
Ethics
Criteria of supplier’s suppliers
Labor practices
Other
No criteria
Figure 6. Which of the following criteria are assessed and documentedfor material and component suppliers?
multiple answers possible
% of plants
80%
80%
67%
66%
51%
29%
23%
20%
15%
14%0%
3%

9 Manufacturing 2015: The Return of Profitability / The MPI Group
Supply chains stretch around the globe
U.S. plants have expanded their global reach. Overseas sales increased to 10% (median) of dollar volume, up from 7% in the 2012 study. Imported material/components account for 10% (median) of purchased volume, up from 8% in the 2012 study (Figure 7).
Approximately 15% of plants generate half or more of their sales overseas, and 13% of plants import half or more of their material/components.
The location of production has remained reasonably stable over the last three years, despite anecdotal reports of onshoring (Figure 8).
Path to World-Class Supply Chain
A significantly higher percentage of executives (83%) at plants closest to world-class
status believe that supply-chain management is important to their plants’ success over the
next five years vs. those at plants furthest from world-class status (65%). These leaders
manage differently and achieve better results:
n 69% of plants closest to world-class status certify major suppliers vs. just 39% of
other plants
n 66% of plants closest to world-class status conduct customer-satisfaction surveys
vs. 37%
n Plants closest to world-class status are less likely to have experienced costs increases in
the past 12 months for material/components, logistics/transport, and utilities/fuel.
Figure 7. Supply-Chain Measures
Median Average
Customer reject rates (parts per million) 10 1,049
Customer retention rate (% of customer retained from previous year 95.0% 86.3%
Overseas sales (% total dollar volume) 10.0% 18.6%
Imported material/components (% dollar volume purchased outside home country 10.0% 17.7%
Figure 8. Location of Company Production Volume (% of production)
This plant Other corporate plant(s) in
United States
External contractor plant(s) in
United States
Corporate plant(s) outside
of the United States
External contrac-tor plant(s)
outside of the United States
Current year
Median 90.0% 0.0% 0.0% 0.0% 0.0%
Average 65.9% 18.4% 3.3% 9.9% 2.6%
Three years ago
Median 90.0% 0.0% 0.0% 0.0% 0.0%
Average 65.3% 19.3% 3.2% 9.3% 3.0%

The MPI Group / Manufacturing 2015: The Return of Profitability 10
Path to World-Class Capital Equipment
Plants closest to world-class
manufacturing status are more
likely to have higher production
volumes, as a percentage of
plant capacity (80% of plants
vs.75% of other plants).
Plants closest to world-class
manufacturing status also are
more likely to have real-time
monitoring of activities:
n 42% of plants closest to
world-class status have real-
time monitoring of safety vs.
just 20% of other plants
n 41% monitor process-
specific quality in real time
vs. just 20%.
Capital Equipment: Rising Demand Strains CapacityEquipment performance is falling behind
P lant production volumes approached their practical limit in 2014: 80%
(median as a percentage of designed capacity) compared to 75% in the 2012 MPI Manufacturing Study and 70% in the 2011 study (Figure 9).
About one in 10 plants report production volumes at 99% of designed capacity or higher.
Additional capacity already exists in many plants: machine availability is 87.5% (median) as a percentage of scheduled uptime, meaning that plants can’t run machinery one out of every eight times they count on it.
Even worse, about one-third of plants report machine availability of 75% or worse. Lost production is compounded by unnecessary maintenance costs: 10% (median) of maintenance costs are unplanned.
Capital investments drive profitability
Capital-equipment spending accounted for 10% (median) of plant sales.
Some 29% of plants plan to increase capital-equipment investments this year, and 14% will decrease them.
New capital equipment increased prof-itability at 63% of plants where it was installed last year —11% major increase and 52% some increase. New equipment decreased profitability at 4% of plants.
Monitoring and measuring plant perfor-mance is critical. A majority of plants have rapid awareness of:2
• Process-specific quality: 60%
• Process-specific safety: 57%
• Process-specific pace or speed: 56%
• Location-specific inventory levels: 56%
• Individual equipment or machine performance: 51%
• Process-specific productivity: 50% of plants.
2 Monitor and measure rated 4 or 5 on a scale of 1 to 5 where 5 equals real-time capability.
Figure 9. Capital-Equipment Measures
Median Average
Production volume (% designed plant capacity) 80.0% 73.3%
Machine availability (% scheduled uptime) 87.5% 78.3%
Overall equipment effectiveness (% machine availability X % quality yield X % of optimal rate) 80.0% 76.2%
Unplanned maintenance as % of total maintenance (% based on annual maintenance expenses) 10.0% 17.3%
Return on invested capital (net operating profit after taxes ÷ by capital invested)
20.0% 30.2%

11 Manufacturing 2015: The Return of Profitability / The MPI Group
Information Technology: The Rise of the CloudIT effectiveness varies by function
A majority of plants have effective applications and systems in place for:
• Production/operations
• Planning/scheduling
• Accounting/finance
• Procurement/purchasing.
Plants need the most IT help with asset management, but only 6% of plants are likely to purchase applications or systems for that function (Figure 10).
Cloud computing
Just 1% (median) of plant IT systems and applications are in the cloud (SaaS).
Yet there are many examples of cloud-computing usage among plants:
• 14.4% (average) of applications and systems are in the cloud
• 13% of plants have half or more of their applications and systems in the cloud.
Larger plants (revenues of $25 million or more) are more likely to use cloud applica-tions and systems: 10% (median) vs. 0% at smaller plants.
Cloud-based applications and systems are most commonly used for human resources (18% of plants), logistics/distribution (13%), and enterprise management (13%).
IT investments drive profitability
IT spending accounted for 5% (median) of plant sales.
Some 22% of plants plan to increase IT investments this year, and 7% will decrease them.
New IT increased profitability at 32% of plants where it was installed last year — 4% major increase and 28% some increase. New IT decreased profitability at 7% of plants.
Path to World-Class IT
Plants closest to world-class
manufacturing status are
more likely to have effective
IT applications and systems:
e.g., 74% effective production/
operations IT vs. 50% of
other plants.
Plants closest to world-class
status also are more likely to:
n Leverage cloud-based
applications and system:
10% (median) vs. 0%
at other plants
n Invest more in IT: 5%
(median percentage of
sales) vs. 2%.
Figure 10. IT Effectiveness and Purchase Plans
Effective IT applications and systems in place
(% of plants)
Application and/or systems likely to be purchased in next 12 months
(% of plants)
Production/operations 62% 13%Planning/scheduling 58% 15%Accounting/finance 57% 8%Procurement/purchasing 56% 5%Enterprise management 43% 12%Supply-chain management 40% 9%Logistics/distribution 40% 14%Human resources 38% 11%Customer service/support 35% 11%Design/development 35% 7%Asset management 28% 6%None of these 12% 52%
The MPI Group / Manufacturing 2015: The Return of Profitability 12
Internet of Things: A Slow Start for the Next Industrial RevolutionIoT plans are only just getting started
Operations and information technologies converge within the Internet of Things
(IoT). Also known as M2M and Industrie 4.0, the IoT consists of self-monitoring and self-correcting machines, machine-to-machine communications, and machine-to-enterprise system communications.
These technologies drive proactive problem identification and resolution, and inform decision-making with real-time insights.
Only 5% of plants have implemented an IoT strategy; another 6% plan to implement an IoT strategy.
A large percentage of plants have no IoT plans (43%), or are led by executives who have not heard of the IoT (46%).
Yet many plants have the operational infra-structure in place to begin leveraging IoT. Fully 10% (median) of plant equipment is already intelligent (i.e., incorporates tech-
nologies that enable machine-to-machine or machine-to-IT system communications).
One-quarter of plants have embedded intelligence in more than 50% of their machines.
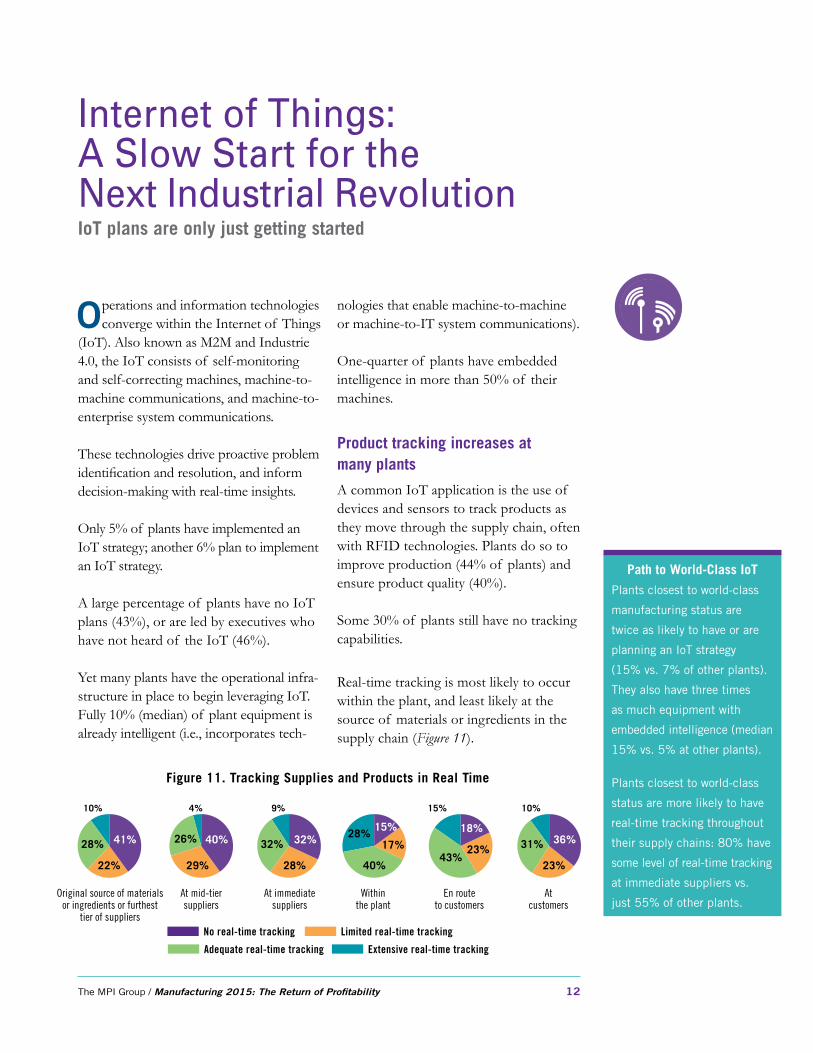
Product tracking increases at many plants
A common IoT application is the use of devices and sensors to track products as they move through the supply chain, often with RFID technologies. Plants do so to improve production (44% of plants) and ensure product quality (40%).
Some 30% of plants still have no tracking capabilities.
Real-time tracking is most likely to occur within the plant, and least likely at the source of materials or ingredients in the supply chain (Figure 11).
Path to World-Class IoT
Plants closest to world-class
manufacturing status are
twice as likely to have or are
planning an IoT strategy
(15% vs. 7% of other plants).
They also have three times
as much equipment with
embedded intelligence (median
15% vs. 5% at other plants).
Plants closest to world-class
status are more likely to have
real-time tracking throughout
their supply chains: 80% have
some level of real-time tracking
at immediate suppliers vs.
just 55% of other plants.
Figure 11. Tracking Supplies and Products in Real Time
No real-time tracking Limited real-time tracking
Adequate real-time tracking Extensive real-time tracking
Original source of materialsor ingredients or furthest
tier of suppliers
At mid-tiersuppliers
At immediatesuppliers
Withinthe plant
En routeto customers
Atcustomers
41% 40% 32%15% 18%
36%
22% 29% 28%
17% 23%23%
28% 26% 32%
40%43%
31%
10% 4% 9%
28%
15% 10%

13 Manufacturing 2015: The Return of Profitability / The MPI Group
Green/Sustainability: Implementation Lags A green disconnect threatens relationships with customers
Some 71% of Americans consider the environment when they shop, and
the percentage is increasing.3 Yet many manufacturing executives aren’t listening: Only 29% report that green/sustainability is important or highly important to their plant’s success over the next five years (down from 35% in 2012 ).
Some 16% of executives say green is not important.
Green performances remain stuck in neutral
A majority of plants have recycle/reuse programs and energy-management programs in place (Figure 12).
Executives report improvement in green performance measures (current year vs. three years ago), yet the current-year measures (Figure 13) are comparable to those reported by executives in the 2012 MPI Manufacturing Study.
Path to World-Class Green
Plants closest to world-class
manufacturing status are
more likely to identify green/
sustainability as important or
highly important to the plant’s
success over the next five years
(43% vs. 16% of other plants).
Plants closest to world-class
manufacturing status also are
more likely to:
n Use green practices: e.g.,
64% have an energy
management program vs.
48% of other plants
n Post better green
performances: e.g., 14%
(median) of purchased
components or materials
are green (recyclable/
regrind) vs. 5%.3 2013 Cone Communications Green Gap Trend Tracker, Cone Communications, April 2013.
77%Recycling/reuse programs
Energy management
Formal green corporate program
Carbon footprinting
Use of renewable energies
None of these
Figure 12. Improvement Methodology(ies)multiple answers possible
% of plants
12%
11%
13%
55%
13%
10.0%
Percentage change to energy per unitof product output in past year
Green products (% of plant productsthat are recyclable/reusable)
Carbon footprints (% of plant productswith documented carbon footprint)
Green components and materials (% of purchasedcomponents or materials that are recycled/regrind/etc.)
Figure 13. Green Performances
% of plants
10.0%
22.3%
-4.9%
-2.0%
0%
12.4%
Median Average
28.7%

The MPI Group / Manufacturing 2015: The Return of Profitability 14
Plant ProfilesFigure 14. Type of Company
% of plants
Public 31%
Private 69%
Figure 15. Nature of Operations
% of plants
Discrete (measured by numeric quantities) 65%
Process (measured by weight or volume) 22%
Both or hybrid 13%
Figure 16. Plant Volume and Mix
% of plants
High volume/high mix 35%
High volume/low mix 19%
Low volume/high mix 34%
Low volume/low mix 12%
Figure 18. Years Since Plant Startup
% of plants
Less than 5 years 4%
5 – 10 years 11%
11 – 20 years 12%
More than 20 years 73%
Figure 17. Corporate and Plant Revenues
Median Average
Corporate parent revenue $60,000,000 $3,511,387,667
Plant revenue 2013 $22,000,000 $206,130,197
Plant revenue 2014 $23,000,000 $236,563,780
Anticipated plant revenue 2015 $24,500,000 $212,341,429

15 Manufacturing 2015: The Return of Profitability / The MPI Group
Figure 19. Percentage of Union Production Workers
% of plants
0% 80%
5 – 25% 2%
26 – 50% 3%
51 – 75% 6%
76 – 99% 4%
100% 5%
Figure 20. Primary Product Produced
% of plants
Computer and electronic product manufacturing 18%
Fabricated metal product manufacturing 13%
Machinery manufacturing 11%
Chemical manufacturing 10%
Transportation equipment manufacturing 7%
Food manufacturing 6%
Plastics and rubber products manufacturing 5%
Miscellaneous manufacturing 5%
Primary metal manufacturing 4%
Paper manufacturing 4%
Furniture and related product manufacturing 4%
Electrical equipment, appliance, and component manufacturing 3%
Printing and related support activities 2%
Nonmetallic mineral product manufacturing 2%
Beverage and tobacco product manufacturing 1%
Textile product mills 1%
Apparel manufacturing 1%
Wood product manufacturing 1%
Textile mills 1%
Leather and allied product manufacturing 0%
Figure 21. Progress toward World-Class Manufacturing Status
% of plants
No progress 10%
Some progress 43%
Significant progress 38%
Fully achieved 10%
The MPI Group / Manufacturing 2015: The Return of Profitability 16
Methodology
Presentation of Data
The MPI Manufacturing Study was conducted using an online questionnaire
promoted by the Manufacturing Performance Institute (a division of The MPI Group, Inc.) and by a panel company to its group of manufacturing plant managers. The MPI Group received 319 valid participants in November and December 2014. Responses were entered into a database,
edited, and cleansed to ensure answers were plausible, where necessary. All respondent answers to the survey are anonymous. As an incentive, respondents who provided contact information after completing the study receive complimentary access to an online benchmarking tool, which contains study data, and this Executive Summary.
MPI Manufacturing Study questions consisted of:
• Directive single-answer questions for which respondents were asked to “check one” answer category
• Directive multiple-answer questions for which respondents were asked to “check all that apply”
• Open-ended numeric questions for which respondents were asked to respond with a number.
Tables and charts for “check one” and “check all” answer categories are present-ed either in the format presented on the survey or, where more meaningful, in descending order based on the percentage
of responses for a particular answer category (i.e., the answer category with the highest percentage is listed first).
Data for directive questions are presented with the percentage of responses for each answer category.
Tables and charts for open-ended questions are presented with the median and average statistics. Note: The median is the “typical” measure, not distorted by a few unusually high or low values that may exist in the sample due to special circumstances. The median figure represents the midpoint of the figures for a particular measure, with one-half of participants reporting figures above it and one-half below.

About The MPI Group
More Study Data
The Manufacturing Performance Institute, a division of The MPI Group, serves leaders with research, advice, and performance-targeted solutions that provide a competitive advantage in today’s fierce marketplace. MPI combines the disciplines of research, strategic advice, knowledge development, and hands-on leadership to create a difference — in performance, in profits, and in the people who make them possible.
P.O. Box 201610Shaker Heights, OH 44120
Phone: 216-991-8390Fax: 216-991-8205www.mpi-group.com
Want more MPI Manufacturing Study data? The MPI Group offers an online benchmarking tool that incorporates the study data — in addition to past years of study data — and allows users to customize their benchmarks (e.g., review data of plants in a given industry and/or employee size). Click here to learn more or visit us online at www.mpi-group.com.