MANUAL & USER’S GUIDE - Psychometrics Canada · MANUAL & USER’S GUIDE CVS-M DONALD MACNAB ......
54
MANUAL & USER’S GUIDE CVS-M DONALD MACNAB SHAWN BAKKER GEORGE FITZSIMMONS
Transcript of MANUAL & USER’S GUIDE - Psychometrics Canada · MANUAL & USER’S GUIDE CVS-M DONALD MACNAB ......
MANUAL & USER’S GUIDE
CVS-M
D O N A L D M A C N A B
S H AW N B A K K E R
G E O R G E F I T Z S I M M O N S

Career Values Scale Manual and User's GuideIncludes bibliographic references.
© 2005 Psychometrics Publishing. All rights reserved. No portion of this publication may be reproduced, stored in a retrieval system, or transmitted inany form or by any means, electronic, mechanical, photocopying, recording, or otherwise, without the prior writtenpermission of the Publisher.
Published and distributed byPsychometrics Canada Ltd.7125-77 Avenue, Edmonton AB T6B 0B5 CANADAwww.psychometrics.com
ISBN 0-929022-42-4
Printed in Canada
Myers-Briggs Type Indicator and MBTI are registered trademarks of the Myers-Briggs Type Indicator Trust in theUnited States and other countries.

Chapter 1 • IntroductionConceptualization of career values in the Career Values scale . . . . . . . . . . . . . . . . . . 1
Overview of the Career Values Scale . . . . . . . . . . . . . . . . . . . . . . . . . . . . . . . . . . . . . 3
Chapter 2 • AdministrationProcedures . . . . . . . . . . . . . . . . . . . . . . . . . . . . . . . . . . . . . . . . . . . . . . . . . . . . . . . . 6
Appropriate Populations for Administration . . . . . . . . . . . . . . . . . . . . . . . . . . . . . . . 7
Chapter 3 • Using the Career Values ScaleScoring and Reporting . . . . . . . . . . . . . . . . . . . . . . . . . . . . . . . . . . . . . . . . . . . . . . . 8
Illustrative Examples . . . . . . . . . . . . . . . . . . . . . . . . . . . . . . . . . . . . . . . . . . . . . . . . . 9
Exercises using the Career Values Scale . . . . . . . . . . . . . . . . . . . . . . . . . . . . . . . . . . 12
Chapter 4 • Development & Norming of the Career Values ScaleDevelopment Process . . . . . . . . . . . . . . . . . . . . . . . . . . . . . . . . . . . . . . . . . . . . . . . 18
Scale development and item writing . . . . . . . . . . . . . . . . . . . . . . . . . . . . . . . . . . . . 18
Norming of the CVS . . . . . . . . . . . . . . . . . . . . . . . . . . . . . . . . . . . . . . . . . . . . . . . . 19
Sten Scores . . . . . . . . . . . . . . . . . . . . . . . . . . . . . . . . . . . . . . . . . . . . . . . . . . . . . . . 21
Means and Standard Deviations . . . . . . . . . . . . . . . . . . . . . . . . . . . . . . . . . . . . . . . 22
Chapter 5 • Reliability and ValidityReliability . . . . . . . . . . . . . . . . . . . . . . . . . . . . . . . . . . . . . . . . . . . . . . . . . . . . . . . . 23
Validity . . . . . . . . . . . . . . . . . . . . . . . . . . . . . . . . . . . . . . . . . . . . . . . . . . . . . . . . . . 25
Concurrent Validity . . . . . . . . . . . . . . . . . . . . . . . . . . . . . . . . . . . . . . . . . . . . . . . . .25
Construct Validity Evidence . . . . . . . . . . . . . . . . . . . . . . . . . . . . . . . . . . . . . . . . . . . 29
Values and Occupational Interests . . . . . . . . . . . . . . . . . . . . . . . . . . . . . . . . . . . . . . 28
Values and Personality . . . . . . . . . . . . . . . . . . . . . . . . . . . . . . . . . . . . . . . . . . . . . . 28
Inter-correlation between WPI Scale . . . . . . . . . . . . . . . . . . . . . . . . . . . . . . . . . . . . 30
Factor Analysis . . . . . . . . . . . . . . . . . . . . . . . . . . . . . . . . . . . . . . . . . . . . . . . . . . . . 31
Feedback Study . . . . . . . . . . . . . . . . . . . . . . . . . . . . . . . . . . . . . . . . . . . . . . . . . . . 32
Bibliography • Research on Values . . . . . . . . . . . . . . . . . . . . . . . . . . . . . . . . . . . . . . . . . . . . . . . . . . . . . . . . . . . . . . . . 33
Appendix A • Sample Report . . . . . . . . . . . . . . . . . . . . . . . . . . . . . . . . . . . . . . . . . . . . . . . . . . . . . . . . . . . . . . . . 35
C O N T E N T S

Chapter 1Figure 1.1 Career Values Scale Factors and Scale . . . . . . . . . . . . . . . . . . . . . . . . . . . . . . 3
Chapter 4Table 4.1 Ethnic Origin of Norming Sample . . . . . . . . . . . . . . . . . . . . . . . . . . . . . . . . 19
Table 4.2 Age Distribution of the Norming Sample . . . . . . . . . . . . . . . . . . . . . . . . . . .19
Table 4.3 Employment Status of Norming Sample . . . . . . . . . . . . . . . . . . . . . . . . . . .20
Table 4.4 Occupational Groups of Norming Sample . . . . . . . . . . . . . . . . . . . . . . . . . . 20
Table 4.5 Highest educational level of Norming Sample . . . . . . . . . . . . . . . . . . . . . . .20
Figure 4.1 Distribution of Sten Scores in a Normal Curve . . . . . . . . . . . . . . . . . . . . . . 21
Table 4.6 Mean Sten Scores Male and Female Norms Group . . . . . . . . . . . . . . . . . . .22
Chapter 5Table 5.1 Internal Consistency of CVS Male and Female Norm Groups . . . . . . . . . . . 24
Table 5.2 Mean Sten Scores for the CVS by Occupational Group . . . . . . . . . . . . . . . . 26
Table 5.3 ANOVAS for the 10 CVS Values Scales by Occupational Groups . . . . . . . . . 27
Table 5.4 Ranking of Average Sten Scores by Occupational Group by Highest to Lowest . . . . . . . . . . . . . . . . . . . . . . . . . . . . . . . . . . . . . . . . . 28
Table 5.5 Correlations – Career Interest Profiler Scale and CVS Scale . . . . . . . . . . . . . 29
Table 5.6 Correlations – Work Personality Index Global Scales and CVS Scale . . . . . . 30
Table 5.7 Correlations – Work Personality Index Factors and CVS Scale . . . . . . . . . . . 30
Table 5.8 Inter-Correlations 10 CVS Scales for the Norm Group . . . . . . . . . . . . . . . . . 31
Table 5.9 CVS Rotated Component Matrix . . . . . . . . . . . . . . . . . . . . . . . . . . . . . . . . 31
Table 5.10 Feedback Ratings for the CVS . . . . . . . . . . . . . . . . . . . . . . . . . . . . . . . . . . 32
T A B L E S & F I G U R E S

1Career Values Scale • Introduction
C H A P T E R • 1
In career development workshops and counselling, one thing is constant; people who are
most satisfied with their work or jobs are in careers where most of their values are being
met. People who are most dissatisfied with their careers have values that clash with their
jobs. Career values are the critical factor in determining satisfaction and dissatisfaction.
It is therefore essential that people who are seeking guidance in their careers benefit from
being clear on what their values are. In the context of career guidance and development,
clarification of career values will assist in providing clients with the self-knowledge that is
often missing and secondly, given a number of career choices, help the client choose the
one that will best lead to a satisfying career.
Conceptualization of career values in the Career Values scale
Since the 1930's motivational concepts such as values, needs, and preferences have
assumed an important role in both the theory and practice of vocational and occupational
psychology. Several instruments have been developed from the theories related to these
concepts. These instruments range from scales concerned with the measurement of the
importance an individual places on such factors as personal development and self-
actualization and which give scores based on one broad construct (e.g. Warr, Cook and
Wall, 1979); to measures based on wide ranging scales offering indices of numerous
different constructs. For example, the Minnesota Importance Questionnaire (Gay, Weiss,
Hendel, Dawis and Loftquist, 1971) measures 20 vocationally relevant needs; or the Work
Aspect Preference Scale (Pryor, 1981) designed to assess preferences individuals have for
13 aspects of their work; or the Values Scale (Fitzsimmons, Macnab, and Casserly, 1986),
which measures 20 values. This latter scale based upon the International Work Importance
Study (Super, 1981) is the basis for the Career Values Scale.
Values have been the subject of extensive psychological and philosophical study for many
years. Yet there is little consensus on any one description of the construct and the
literature is replete with confusing definitions and descriptions. In some definitions there is
little difference between values and interests, values and needs, or values and preferences.
Super (1973, 1995) offers the following definition of values:
Introduction

Traits, values, and interests derive from needs. The need … leads to action, and action
leads to modes of behavior or traits that seek objectives formulated in generic terms
(values) or in specific terms (interests). Traits are ways (styles) of acting to meet a need in a
given situation. Values are objectives that one seeks to attain to satisfy a need. Interests
are the specific activities and objects through which values can be obtained and met.
In a study that used the Canadian version of the Values Scale, the Minnesota Importance
Questionnaire and the Work Preference Aspects Scale, Macnab and Fitzsimmons, 1989
used multi-trait multi-method analysis to provide a logical and empirical basis for the
definition of values. This study helped established that even when values are assessed from
different theoretical perspectives that they can be measured objectively.
In career counselling, values are especially helpful with clients that have flat interest profiles,
whose interests pull them in different directions, or whose immaturity leads to doubt
about the validity of their expressed or even their assessed interests. This is because values
are more fundamental than interests. Ascertaining what it is that a client wants to get out
of life is often helpful in pursuing the question of the field or activity in which to seek it.
It was decided on the basis of national and international literature reviews, that the available
instruments were lacking in terms of their applicability. Many of the most widely used
scales have norms dating back 20 to 30 years and many have not had their item content
updated from this time. The Career Values Scale is designed to provide an individual with
information about what is important in their work or career. It can be used in individual
career counselling and planning to structure the exploration of the relative importance of
client's values. At all ages the Career Values Scale is a useful introduction to the vocabulary
of values. Completing the scale in itself has some educational value, where individuals can
learn more about themselves. The language of values offers a linguistic framework to
express what they are discovering about themselves.
In employment counselling with adults the Career Values Scale is helpful in providing a
standardized description of clients' values. By comparing the qualities of a career as prized
by the client, the requirements of a career opportunity can be examined for discrepancies.
These differences may offer positive opportunities for a review. Topics such as career ladder,
job satisfaction, needs met through career or jobs, and special qualities that can be found
in work environments can be explored.
2Career Values Scale • Introduction
3Career Values Scale • Introduction
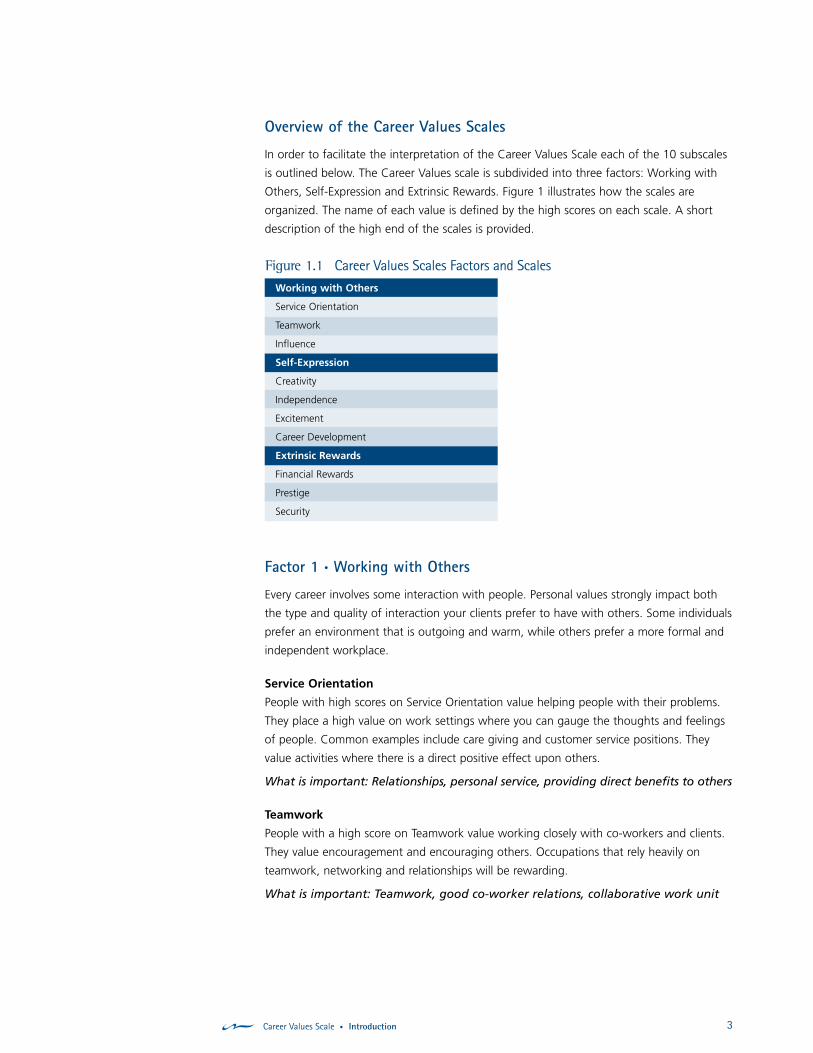
Overview of the Career Values Scales
In order to facilitate the interpretation of the Career Values Scale each of the 10 subscales
is outlined below. The Career Values scale is subdivided into three factors: Working with
Others, Self-Expression and Extrinsic Rewards. Figure 1 illustrates how the scales are
organized. The name of each value is defined by the high scores on each scale. A short
description of the high end of the scales is provided.
Factor 1 • Working with Others
Every career involves some interaction with people. Personal values strongly impact both
the type and quality of interaction your clients prefer to have with others. Some individuals
prefer an environment that is outgoing and warm, while others prefer a more formal and
independent workplace.
Service Orientation
People with high scores on Service Orientation value helping people with their problems.
They place a high value on work settings where you can gauge the thoughts and feelings
of people. Common examples include care giving and customer service positions. They
value activities where there is a direct positive effect upon others.
What is important: Relationships, personal service, providing direct benefits to others
Teamwork
People with a high score on Teamwork value working closely with co-workers and clients.
They value encouragement and encouraging others. Occupations that rely heavily on
teamwork, networking and relationships will be rewarding.
What is important: Teamwork, good co-worker relations, collaborative work unit
Figure 1.1 Career Values Scales Factors and ScalesWorking with Others
Service Orientation
Teamwork
Influence
Self-Expression
Creativity
Independence
Excitement
Career Development
Extrinsic Rewards
Financial Rewards
Prestige
Security

4Career Values Scale • Introduction
Influence
People with a high score on Influence value being directive rather than collaborative and
like to control and manage the work that they are involved with. They will enjoy having a
high level of responsibility and will be satisfied in an organization where they can use a
directive leadership style.
What is important: High level of responsibility, taking control, influencing people
and events
Factor 2 • Self-Expression
Each individual approaches work in a unique way. Differences in self-expression can be
attributed to how individuals value creativity, independence, excitement and personal
development. Values in these areas will influence both the types of tasks and work
environments that clients will find enjoyable and satisfying.
Creativity
People with high scores on Creativity value working in an organization that promotes
ingenuity and creativity. They value developing new ideas, exploring unconventional
approaches and using their imagination. The types of work that will be satisfying will
require creativity and innovation, and will allow the client to use their curiosity to identify
and evaluate new ideas.
What is important: Solving problems, being creative and original
Independence
People with high scores on Independence value the self-reliance and the freedom to set
their own goals and schedule. They value working without supervision and enjoy tasks
that can be worked on independently without having to seek advice from co-workers. The
type of work they enjoy will allow them to do things in their own way most of the time.
What is important: Making independent decisions and being free from the
influence of others
Excitement
People with high scores on Excitement value trying new things. They value environments
where there is uncertainty and where change is expected. The type of work they will enjoy
will include the possibility of trying something new and where they can take risks.
What is important: Variety, risk and fast-paced work
Career Development
People with high scores on Career Development value developing both personally and
professionally. They value learning new skills and expanding their expertise and will enjoy
working in an organization where there is a culture of life-long learning, where there are
constant challenges and where they can have an opportunity to develop new skills.
What is important: Personal and professional development and growth

5Career Values Scale • Introduction
Factor 3 • Extrinsic Rewards
This section looks at the things that motivate people. It examines how the client values
financial rewards, job security and prestige. Recognizing what motivates them is an important
step in identifying ideal occupations and making career exploration and analysis easier.
Financial Rewards
People with high scores on Financial Rewards value having enough income to ensure that
they can afford life's luxuries. Excellent financial rewards are the key to their happiness and
satisfaction. They value working in an organization that values financial incentives and
where they are paid according to their performance.
What is important: High salary and financial security
Prestige
People with high scores on Prestige value recognition and acclaim. They value working in
an organization where they are publicly recognized as a superior performer. They value
working for an organization that in itself is well known or is recognized as being amongst
the best.
What is important: Recognition, admiration and status
Security
People with high scores on Security value a consistent career path and a feeling of job
security. They prefer the steady and the predictable to rapid and unpredictable change and
will enjoy working where they feel that they can plan for the future.
What is important: Security, stability and predictability

6Career Values Scale • Administration
C H A P T E R • 2
AdministrationThis chapter covers the administration guidelines that describe the settings and populations
where the CVS can be used effectively. The most important consideration when having
people complete self-report measures of values is to create an atmosphere where they feel
at ease and are free to accurately report their traits. This is usually best achieved when the
administration is clear and consistent, and respondents’ questions are handled appropriately.
The CVS is largely self-administered, and can be completed individually or in groups.
The administrator should ensure that the assessment environment is relatively free from
distractions, is quiet, and well lit. It is important to create an environment that makes the
individuals taking the CVS as comfortable as possible. While there is no time limit to the
administration, most people complete the 88 items in approximately 20 minutes. Those who
take longer may be encouraged to work more rapidly and not study the items at length.
No rigorous controls are required to establish dependable, reliable results. The CVS has
been used in a variety of conditions, including formal testing, individual administrations,
and take home administrations. While a standard, supervised administration is ideal, the
reliability and validity of individuals’ results have not been negatively affected through less
stringent administration conditions.
Procedures
When conducting a supervised assessment, it is useful to follow the steps below:
Ensure that you have the proper materials to complete the assessment.
Prepare the room by providing enough space for each respondent to feel comfortable and
that they have some privacy while answering the items.
At the beginning of the assessment session give a brief introduction that includes the
following:
• The CVS is a measure of career and personal values, not a test. Therefore, there are noright or wrong answers.
• There is no time limit for completing the CVS, however, most people complete theassessment in 20 minutes.
STEP 1STEP 2
STEP 3

7Career Values Scale • Administration
• When completing the assessment, it is best not to think too long about anyitem. Generally, the person’s first response is the best response.
• Encourage respondents not to omit items. If an individual truly feels unable tomake a choice, instruct them to select N for Neutral.
• Inform the people taking the CVS what will happen with their results. A statement that discusses the purposes of the assessment and how the resultswill be used is helpful in winning the respondents’ attention and motivation.
• Provide respondents with the opportunity to ask questions.
• Emphasize the need for respondents to carefully complete the requiredidentifying information, and tell them to carefully read through the instructionsbefore responding to the items.
• If using a paper-pencil administration, stress the importance of matching thenumbers on the answer sheet to the numbers on the item booklet.
If respondents have questions during the administration about the meaning of a
word or item, the administrator should answer them.
After all the respondents have completed the assessment, review their answer
sheet to ensure that they did not miss items and have completed all the required
identifying information.
Appropriate Populations for Administration
Age
The CVS measures personal and career values. The test items revolve around
typical career experiences, and for people to respond to them correctly they need
to be able to relate to the situations presented in each item. For this reason, the
CVS is appropriate for people in the working population. Younger students may
not have enough work experience to respond to the items in a valid way.
Therefore, it is recommended that the CVS be used with people who are older
than fifteen years of age.
Required Reading Level
The reading level of the CVS questionnaire was assessed using two popular
methods. The Flesch Reading Ease score rates text on a 100-point scale using
the average sentence length and the average number of syllables per word.
The score for the CVS questionnaire was 63.6.
The Flesch-Kincaid Grade level score rates text on a U.S. grade school level.
For most standard documents, a score of approximately 7.0 to 8.0 indicates that
the majority of the population can read it. The CVS questionnaire is rated at 6.5,
meaning that a seventh grader can understand the items.
STEP 4
STEP 5

8Career Values Scale • Using the Career Value Scale
C H A P T E R • 3
As a practitioner it is part of your role to help the client discover and prioritize their values.
This will be useful to clients in a number of spheres: career counselling, retirement
counselling, leisure counselling, team building, organizational planning and other activities
in which this type of self-knowledge is important.
Clients will often have unanswered questions such as: What am I seeking in a job? What
values dominate my career? To help clients achieve long-term career satisfaction, you will
want help them understand the centrality of values in their careers and life. In this process
the Career Values Scale can be used to:
• Explain that values are part of your personal make-up and are relatively stable goals that aperson tries to obtain through work and careers.
• Explain that values are critical in the understanding of satisfaction and dissatisfaction thatone realizes from a particular job.
• Guide career development process by helping the client toward opportunities that willinclude as many important values as possible.
• Identify the values that the client wishes to see satisfied in their careers
• Prioritize the values that the client holds, that is, rank the importance of the values
• Resolve internal conflicts between competing sets of values.
• Discover sources of satisfaction and dissatisfaction.
Scoring and Reporting
The Career Values Scale is only available in a computer scored format. Each client will
receive a report that is between 12 and 16 pages in length. The report is self-explanatory
and should provide clients with a good overview of their career values. It includes a
description of each of the ten values measured by the Career Values Scale, outlines
potential sources of satisfaction and potential sources of dissatisfaction. It also outlines a
number of exercises that will be useful for the client to undertake either alone, with
counsellor guidance or in a workshop situation. These include:
• Working with their career values
• Deciding on their core career values
• Assessing their current situation
An example report can be found in Appendix A.
Using theCareer Values Scales

9Career Values Scale • Using the Career Value Scale
Illustrative Examples
JIM – RETIREMENT COUNSELLING
Jim is a successful entrepreneur in the process of retiring from work. He is asking a
question that people who have spent their entire lives working in one career have:
“Now what?”
Assessing a 59 year-old usually reveals values that have been held for many years. Values
that are in the Sten range 4-7 are in the "average" range. Values from 1-3 and 8-10 are
usually an indication of very important preferences and suggest highly important
principles. Most of Jim's scores were between 4-7, suggesting very few highly held values.
A discussion and validation of each individual value helps him validate and contextualize
the personal meaning of how the value plays itself out in his life. This type of exploration
helped to give him a vocabulary to discuss some of the problems he was having. Jim
decided that there were two core values: Creativity was 3, suggesting that he preferred
practical well-grounded solutions. Security was also 3, suggesting he preferred novelty,
variety and change. In Jim's case, he was looking to find some new ventures or activities
that would be personally attractive. He was encouraged to seek out activities that would
accommodate his "must haves."
Knowledge of the core values, seemingly in conflict, lead to the conclusion that to be
satisfied he would set out to find a number of activities that required some practical
down-to-earth solutions. As a respected entrepreneur in the community, he was able to
find numerous volunteer projects that required organizing, supervising and assistance with
set-up. These two polarized values have been central in his adaptation to the transition
into retirement. He was able to draw upon his experience as a businessman to apply the
practical, down-to-earth solutions to working in a fast changing environment that he
found exciting and satisfying.

10Career Values Scale • Using the Career Value Scale
BETTY – CAREER TRANSITION
Betty had a successful career as a radio host, who, because of budget cuts
was forced to seek a new career. The Career Values Scale was used to help her
identify her values. There were three significant outliers. Service Orientation – 9;
Career development – 1; and Influence – 3.
An analysis of her career history verifies what the scales suggested. She presents as an
altruistic person, generous with her time, enjoying social relationships. Betty mentioned
that after completing high school, she sought employment at a radio station. She soon
was given her own late night show. From that start, she continued as an announcer being
moved to larger audience time slots until she hosted the noon and early afternoon
weekday programming. She spent a number of years abroad working in different settings.
While appearing very informed, aware of current events, and presenting with social poise,
she felt very insecure about her academic ability but not interested in proceeding with
academic upgrading (confirmed by her Career Development score of 1). She needed
assistance in marketing her experiences, work history, and social gifts as they stand.
Finally, there is her Influence Sten of 3. She confirmed no desire to rise in any organization
through management advances. Others could pull the levers of power while she delivered
her competencies directly to the audience. With these delimitations of the most significant
work values in her presentation for employment, we could move on to exploring her work
personality and occupational interests.
In addition to the Career Values Scale Betty completed the Career Interest Profiler - a
measure of the six Holland codes. The occupations that came up through this process
were Broadcast News Analyst, Interpreters and Translators and Foreign Language and
Literature Teachers. The former she was trying to move away from, the latter, given her
Career Development score were not particularly interesting. However, having spent a
number of years abroad, she was interested in something related to this area. She
discovered that all levels of governments hosted foreign trade missions for investors,
scholars, and manufacturers. Having spent a number of years abroad and being acutely
sensitive to the needs of others, she was able to recognize an opportunity that could use
her skills and satisfy her values. She has successfully started a consulting company that
enables her to serve people in the community who wish to do business in foreign
countries, providing them with information about local knowledge, customs, faux-pas,
appropriate gifting, etc. at the same time fulfilling her values.

11Career Values Scale • Using the Career Value Scale
JESSICA – ELEVATED PROFILE
Jessica is a first year university student who has not yet decided on a major.
The most apparent aspect of her profile is that almost all of her scores are high or very
high. This type of profile may indicate a number of things about the client. In this
particular case it pointed to a person who had very little self-knowledge. She indicates that
almost everything is important. Counselling will help her become aware that very few
careers offer such a wide variety of avenues where one can gain satisfaction. It will also
help to make her aware of what is really important to her and what is not.
Occasionally, you might find an elevated profile that is valid. This will usually be a person
who has had a long and successful career and who is tremendously motivated. It is highly
unlikely that you would find such a profile in a self-aware college student.
JOSEPH – LEARNING THE LANGUAGE OF VALUES
Joseph is a Grade 12 student who was part of a group career and life
management workshop.
As part of the workshop participants were asked to outline what they wanted from a
career. Joe wrote: “Good pay”; “Being creative”; and “Being able to work by himself”,
As can be seen from his profile the Career Values Scale reinforces these wishes with
Financial Rewards (Sten 7), Creativity (Sten 8) and Independence (Sten 8). As well
as these the Career Values Profile also indicates that Joseph values Service Orientation
(Sten 8) and Career Development (Sten 9). This illustrates one of the reasons to use
psychometrically derived instruments over self-report. A person in a group workshop
setting may not have the guidance to be able to think of all of the things that are
important to them or have the language skills and vocabulary to adequately portray them.

12Career Values Scale • Using the Career Value Scale
Exercises using the Career Values Scale
The following exercises are designed for small group work (6 to 10 participants). But can
be modified to accommodate larger groups or be used in individual counselling sessions.
Understanding Career Values – Values Review
Sources of Satisfaction and Dissatisfaction Exercise
Self-Awareness Crystallization Exercise
Your Current Career Situation Exercise
EXERCISE 1
EXERCISE 2
EXERCISE 3
EXERCISE 4

13Career Values Scale • Using the Career Value Scale
Understanding Career Values – Values ReviewMaterials: Career Values Scale Reports for each participant.
Overview of career values, needs and preference. Review theory.
Handout personalized Career Values Scale Report (pages 1 -9)
Explain the meaning of Sten scores. Explain that there are no
good or bad results.
The results reflect the way they see themselves. It is not better to have
a higher or lower score on a value. Explain that participants should only
share their results if they feel comfortable.
For each value go through the following procedures
• How did you score on Service Orientation? Please raise your hands if you received a Sten of 1 or 2, 3 or 4, etc.
• Note the lowest Sten and highest Sten. Ask the participants with thelowest and highest scores to read the descriptive comments related to the value.
• Have the participants discuss how this value is playing out in their lives.Where is there satisfaction or disappointment because of this value in their life?
STEP 1
STEP 2
STEP 3
STEP 4
EXERCISE 1

14Career Values Scale • Introduction
Sources of Satisfaction and DissatisfactionMaterials: Career Values Scale Reports for each participant.
Handout personalized Career Values Scale Report (pages 10 – 11)
Beginning on page 10 of the report are Sources of Satisfaction for
the three Factors of Working with Others, Self Expression, and
Extrinsic Rewards.
Invite each person to write a small story about at least one of the joys
identified in each of the three factors. These are affirmations of the
significance of these essential pleasures to be regularly experienced in
their working life. From a career counselling point of view, these are
examples of the "must haves" during the workweek.
On page 11 are the Sources of Dissatisfaction.
Again choose at least one value from each of the three factors to write a
brief vignette indicating how upsetting the violation of these values
actually is in their working life. In the ideal world, the frequency of
occurrence will be low. In reality, they are often quite high.
Talk about stress in relation to dissatisfaction in careers.
Talk about the possibility of finding other ways of satisfying areas that
they find dissatisfying in their careers. Assist participants in finding ways
to deal with any frustrations. A coaching challenge may be to modify the
work environment of the client or to help the client modify their values.
In a group meeting alternate between delights and dismays.
When a participant shares a story of satisfaction, invite group reaction as
they process the meaning for the participant and for themselves. Invite
the same participant to share a negative story from the same factor
revealing a source of dissatisfaction. Since there are usually participants
with opposing scores on the same value, much learning occurs.
Ask to rate their responses as to frequency (1=hourly, 2=daily,
3=weekly, 4=monthly) and amount of distress experienced
because of unsatisfactory situations (light, moderate, severe).
Look for information to shape your intervention strategies if the client is
staying with their employer. If moving on, then identify what to seek next
in a new work environment.
STEP 1STEP 2
STEP 3
STEP 4
STEP 5
STEP 6
EXERCISE 2

15Career Values Scale • Using the Career Value Scale
Self-Awareness Crystallization Exercise
This is an ideal follow-on from the last exercise. Once everyone has
told their stories, you have an excellent perception of the primary
drivers in the work life of each participant.
Materials: Career Values Scale Reports for each participant. (Page 12)
Have the clients complete the exercise on page 12 of the
Career Values Scale report.
The most important career values can be written on page 12 and shared
with the group. It may be that values implicated in some of the tales
heard are not repeated in the Core Values section. That is OK, but the
client is likely to be asked for an explanation by the group.
After clarification, reality checks, and personal validation you can
follow this with Your Current Career Situation exercise.
At this point, these statements have become personally very telling about
the quality of their current career situation. What is satisfactory and what
is not. This is very diagnostic for the coach/counsellor.
STEP 1
STEP 2
EXERCISE 3

16Career Values Scale • Using the Career Value Scale
Your Current Career Situation Exercise
This exercise is extremely useful as an organizational development
exercise or in career counselling with people who are employed.
Materials: Career Values Scale Reports for each participant.
Explain satisfaction and dissatisfaction in careers and how these
are related to their values.
Handout personalized Career Values Scale Report (pages 13 – 14)
Explain that the two pages are a personalized questionnaire
related directly to their results on the Career Values Scale.
Outline the task – read top of page 13.
Have the participants complete the questionnaire.
Work through the questions at the bottom of page 14.
Many people have not often worked from first principles in the career
development or adjustment process. The Career Values Scale helps to
identify, clarify, and articulate what the issues are and why they are
significant for participants.
STEP 1
STEP 2
STEP 3
STEP 4
STEP 5
STEP 6
EXERCISE 4

C H A P T E R • 4
The CVS was designed to provide an efficient and useful measure of values for personal
development applications. To meet this goal, the development of the items and the
creation of test norms followed a specific path. This chapter outlines how the values
model, test items, and norms were developed.
The starting point in the development process was to set design criteria that would guide
the progress of the CVS’s creation. In order to meet the overall goal to develop a career
values measure, 5 key criteria were established.
1 The CVS should only measure values that are directly related to careers.
2 The CVS should be useful for applications such as career development, team building,
and personal development.
3 The application and interpretation of the CVS should not require specialist training in
psychology or personality.
4 The questions should be easy to read and comprehend.
5 Respondents should be able to complete the assessment quickly.
The design criteria guided the development of the CVS in several ways. The values the
CVS measures have been found to relate to job satisfaction in a direct way. This ensures
that users are provided information that directly helps people understand the way their
values relate to their career development and satisfaction.
Development & Norming of the Career Values Scale
Career Values Scale • Development and Norming of the Career Value Scale

18Career Values Scale • Development and Norming of the Career Value Scale
Development Process
The CVS is built upon earlier work on values, specifically, on the research of Donald Super
and the International Work Importance Study (Super and Sverko, 1995), After conducting
an extensive literature review and examination of current values measures, 10 scales were
identified that were considered relevant to clients in the career development process.
These 10 scales provided the foundation of the CVS. Having identified the 10 scales, the
following steps were taken to construct the CVS.
Scale development and item writing
To construct a measure of the 10 scales, a thorough review was conducted of research
studies and current and past values measures to develop objective, operational definitions
for each value. After having created definitions for each career value, items that provided
evidence for the traits were developed. The items were written according to the
following rules:
1 Items should relate directly to careers. The situation presented in the item needed to
examine preferences and motivations for different types of work and work
environments.
2 Items should target a single construct. It was essential for the situation outlined in
each item to be related to only one of the 10 career values.
3 Items should be short, direct, and easy to understand.
4 A five-point Likert scale was developed to allow individuals to register how important
they felt each statement to be. The respondents could indicate their preferences by
choosing one of the five options for each item.
For example:
Work for a well-known company
NOT AT ALL IMPORTANT UNIMPORTANT NEUTRAL IMPORTANT VERY IMPORTANT
Through this process, a first trial of the questionnaire consisting of 120 items (12 items
per scale) was conducted. Examination of the internal consistency and item reliability
resulted in the dropping of 32 items, bringing the total to 88. The items retained
contributed positively to coefficient alpha reliability as well as ensured that the number of
items on the questionnaire remained manageable for users. The number of items per scale
varies from 8 to 10 items with internal consistency reliabilities that range from .75 to .89
(for complete internal consistency results see page 24).

19Career Values Scale • Development and Norming of the Career Value Scale
Norming of the CVS
Norming is a key step in test development. The norms set the baseline which all test
results are measured against, which allows the comparison of different individual’s scores.
Norms identify the below average, average, and above average performance on the test,
and help the test user appropriately interpret a person’s results and make decisions.
The more people that are included in the norm sample helps ensure that the test norms
represent the actual distribution of traits of the people in the population. This in turn allows
the test results to be more accurate and informative when comparing different individuals.
The CVS was standardized on a large sample of over 28000 people. From this group a
matched sample of 7000 males and 7000 females were selected to create North American
norms. The large number of participants involved in the norm sample ensures that the CVS
results effectively measure and identify differences in values. Tables 4.1 to 4.5 illustrate the
basic demographic background of the participants in the norm sample.
Table 4.1 Ethnic Origin of Norming Sample (n=14000)Ethnic Group Number Total % Female % Male %
African American/Canadian 830 5.9 6.3 5.5
Native American/Canadian 796 5.7 5.3 6.1
Asian American/Canadian 573 4.1 4.0 4.2
Caucasian 10531 75.2 75.4 75.1
Latino/Latina 540 3.9 3.8 3.9
Other 730 5.2 5.2 5.2
Total 14000 100.0 100.0 100.0
Table 4.2 Age Distribution of the Norming Sample (n=14000)Age Group Number Total % Female % Male %
15-20 4658 33.3 30.0 36.5
21-25 1895 13.5 16.6 10.5
26-30 1856 13.3 14.3 12.2
31-40 2790 19.9 19.8 20.1
41-50 1977 14.1 14.5 13.7
51-60 748 5.3 4.4 6.3
60+ 76 .5 .4 .7
Total 14000 100.0 100.0 100.0

20Career Values Scale • Development and Norming of the Career Value Scale
Table 4.3 Employment Status of Norming Sample (n=14000)Employment Status Number Total % Female % Male %
Junior High 244 1.7 1.5 2.0
High School 3371 24.1 20.2 28.0
College 1952 13.9 16.6 11.3
Employed 5721 40.9 43.8 37.9
Self-Employed 537 3.8 2.9 4.8
Homemaker 204 1.5 2.8 .2
Job Seeker 1971 14.1 12.2 15.9
Total 14000 100.0 100.0 100.0
Table 4.4 Occupational Groups of Norming SampleOccupational Group Number Percentage
Architecture 879 6.3%
Art/Design 1129 8.1%
Business - Management 2607 18.6%
Business - Sales/Clerical 948 6.8%
Education 1248 8.9%
Journalism 295 2.1%
Law 654 4.7%
Science 596 4.3%
Medicine Health 1048 7.5%
Social Science 687 4.9%
Human Services 973 7.0%
Agriculture 100 0.7%
Transportation 173 1.2%
Machine Trades 143 1.0%
Construction 195 1.4%
Religion 108 0.8%
Entertainment 488 3.5%
Other 1729 12.4%
Table 4.5 Highest educational level of the Norming SampleOccupational Group Number Percentage
High School 1233 8.8%
Trade/Technical School 305 2.2%
Some College 2451 17.5%
Associate Degree 532 3.8%
Community College 364 2.6%
Bachelor's Degree 3685 26.3%
Master's Degree 1600 11.4%
Professional Degree 189 1.4%
Doctorate 184 1.3%
21Career Values Scale • Development and Norming of the Career Value Scale
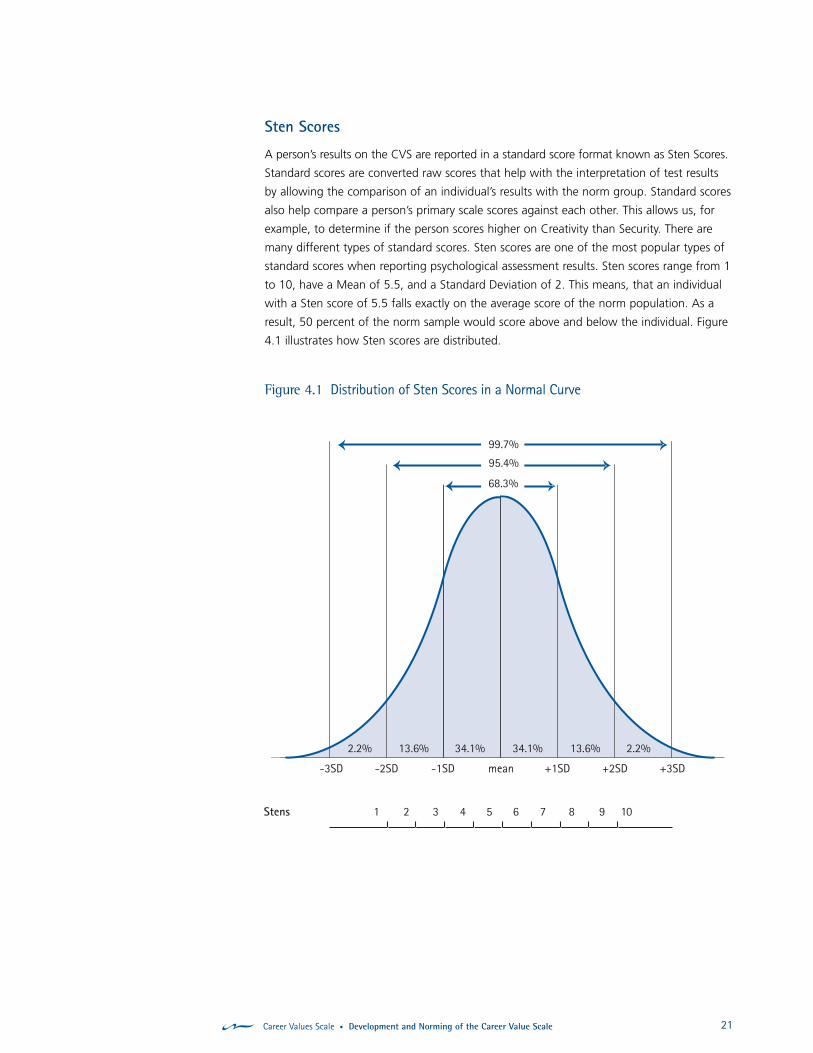
Sten Scores
A person’s results on the CVS are reported in a standard score format known as Sten Scores.
Standard scores are converted raw scores that help with the interpretation of test results
by allowing the comparison of an individual’s results with the norm group. Standard scores
also help compare a person’s primary scale scores against each other. This allows us, for
example, to determine if the person scores higher on Creativity than Security. There are
many different types of standard scores. Sten scores are one of the most popular types of
standard scores when reporting psychological assessment results. Sten scores range from 1
to 10, have a Mean of 5.5, and a Standard Deviation of 2. This means, that an individual
with a Sten score of 5.5 falls exactly on the average score of the norm population. As a
result, 50 percent of the norm sample would score above and below the individual. Figure
4.1 illustrates how Sten scores are distributed.
Figure 4.1 Distribution of Sten Scores in a Normal Curve
68.3%
95.4%
99.7%
2.2% 13.6% 34.1% 34.1% 13.6% 2.2%
-3SD -2SD -1SD mean +1SD +2SD +3SD
Stens 1 2 3 4 5 6 7 8 9 10

22Career Values Scale • Development and Norming of the Career Value Scale
Means and Standard Deviations
Table 4.6 provides a detailed description of the CVS scale scores for the North American
sample. The means and standard deviations shown provide the norms which individual’s
who complete the CVS are compared against. The mean sten score for each scale
represents the “average” score of people in North America. The standard deviation
indicates the spread of scores found among people in the normative sample.
Approximately 68% of the population will obtain scores within one standard deviation
above and below the mean, while 95% of the population will score within two standard
deviations of the mean.
Table 4.6 Mean Sten Scores Male and Female Norms GroupFemale n=7000 Male n=7000
Mean SD Mean SD
Service 5.71 1.86 5.31 1.88
Teamwork 5.69 1.95 5.30 1.97
Influence 5.31 1.96 5.67 1.97
Creativity 5.23 1.97 5.75 1.94
Independence 5.41 1.97 5.60 1.95
Excitement 5.32 1.82 5.75 1.83
Development 5.71 1.97 5.39 1.99
Finance 5.28 1.97 5.76 1.95
Prestige 5.46 1.99 5.64 1.98
Security 5.52 1.91 5.47 2.01

23Career Values Scale • Development and Norming of the Career Value Scale
C H A P T E R • 5
When developing assessments for psychological traits such as values, it is necessary to
conduct research to determine the reliability and validity of the tool. Reliability directly
examines the consistency and stability of the assessment, while validity is concerned with
the types of inferences (e.g. predicting work behavior, choosing satisfying careers) that can
be made from test results. For an assessment to be useful it needs to be both reliable and
valid. The following chapter examines evidence for both the reliability and validity of the CVS.
Reliability
Reliability is concerned with the consistency of test scores, and how free test results are
from external, confounding influences. The higher the reliability of a test, the more likely it
is consistently measuring differences between people. More reliable tests provide results
that remain unaffected by irrelevant variations, or what is commonly called random errors.
We assess the reliability of the CVS by examining how consistently the test measures
values. For example, a test that yields similar scores for a person who repeats the test is
said to be reliable. However, if a person takes the same test twice and receives very
different scores, the test is unreliable. In general, reliability refers to how dependable a test
is. Reliability is measured using correlation coefficients. A reliability coefficient is denoted
by the letter “r”, and is expressed as a number ranging between 0 and 1.00 with r=0
indicating no reliability, and r=1.00 indicating perfect reliability. It is important to recognize
that tests are never 100% accurate, so you will not find a test with a correlation
coefficient of r=1.00. In general you will see the reliability of a test expressed as a decimal,
for example, r=.80 or r=.93. The larger the reliability coefficient the more consistent the
test scores. There are a number of reasons and/or conditions that lead to unreliable test
results. Some of the possible reasons include the following.
Reliability and Validity

24Career Values Scale • Development and Norming of the Career Value Scale
1 Candidate related. Test performance can be influenced by a person’s psychological or
physical state at the time of testing. For example, differing levels of anxiety, fatigue, or
motivation may affect the individual’s test results.
2 Test-related. Item design, instructions, examples and the design of the response
procedure can influence an individual’s test results. For example, confusing items or
complicated instructions, which make understanding the test difficult, can negatively
affect a person’s results.
3 Procedural. Differences in the testing environment, such as room temperature,
lighting, noise, or even the test administrator and scoring procedures can influence an
individual’s test performance.
These three factors are sources of chance or random measurement error in the assessment
process. If there were no random errors of measurement, the individual would get the
same test score, their “true” score, each time. The degree to which test scores are
unaffected by measurement errors is an indication of the reliability of the test. One of the
main approaches used to assess reliability is through measures of internal consistency. A
sophisticated form of internal consistency reliability is Cronbach’s alpha. It effectively splits
the test items in every possible way and computes the average of all combinations.
Consistency should be achieved such that all the items are measuring the same thing to
the same degree, and, therefore, the items for each test scale should have a high degree
of correlation. Most professionals agree that test scales with correlation coefficients above
.70 are useful for most applications. The internal consistency reliability coefficients for each
of the CVS scales are listed in Table 5.1. As shown in the table, the reliability coefficients
range from .75 to .89. This meets or exceeds the .70 level for every scale, indicating the
consistency of CVS test scores is high. The strength of the reliability coefficients indicates
that the CVS is relatively free from external errors that could negatively impact the
measurement of values. This allows the CVS to provide a close estimate of each
individual’s true score on the 10 scales.
Table 5.1 Internal Consistency of CVS Male and Female Norm GroupsFemale Male Total
Service .84 .84 .84
Teamwork .89 .89 .89
Influence .85 .85 .85
Creativity .87 .86 .87
Independence .81 .79 .80
Excitement .76 .75 .75
Development .89 .88 .89
Finance .87 .86 .86
Prestige .84 .83 .84
Security .77 .78 .77

25Career Values Scale • Development and Norming of the Career Value Scale
Validity
When deciding to use a test, validity is the most important consideration. While reliability
focuses on how consistently a test measures, validity examines the extent to which a test
measures what it claims to measure. Validity describes the degree to which you can make
specific conclusions or predictions about people based on their test scores. In short, validity
indicates the usefulness of a test. A test’s validity is established in reference to a specific
purpose; the test may not be valid for different purposes. This means that a test is never
valid or invalid. Instead, how the test is used can be classified as valid or invalid. For
example, a ruler is a valid measure of a person’s height, but an invalid measure of that
individual’s technical proficiency or leadership style.
There are various types of evidence that can indicate the valid uses of a test. Each piece of
validity evidence can help determine how useful the test will be for specific situations, and
with specific populations. While it is common to talk about different types of validity (e.g.
construct validity, content validity, criterion validity), it is better to consider them as sources
of evidence that assess the overall validity of a test, rather than separate measures. A valid
test is supported by various types of evidence. Therefore validity evidence should be able
to tell you if the test measures what you need to measure, indicate which groups the test
is useful for, and inform you of the decisions you can make based on individual’s results.
Concurrent Validity
The CVS was designed for use with a wide variety of individuals, and for a wide variety of
uses. If the CVS can be used validly with different people, research should find similarities
among people, and differences between people where expected. For example, we expect
that people who work in artistic occupations would score higher on the Creativity scale
than people working as clerical staff. We would expect that business managers would
score higher on scales in the Extrinsic Rewards domain than other occupational groups.
We would also expect people working in the human services to score higher on the scales
in the Working with Others domain. The differences between occupational groups’
average scores can provide evidence that the CVS is picking up individual characteristics
that are related to work.
Table 5.2 lists the average sten scores for 16 different occupational groups. The evidence
suggests that the CVS is able to discriminate between occupational groups. One-way
analysis of variance for each scale across all groups showed significant difference for all
values. (See Table 5.3). The data confirm that the CVS can discriminate significantly
between occupations that people are working in or preparing for. Table 5.4 further
illustrates the validity of the CVS in relation to occupational groupings.

26Career Values Scale • Development and Norming of the Career Value Scale
Tabl
e 5.
2M
ean
Sten
Sco
res
for
the
CVS
by O
ccup
atio
nal G
roup
12
34
56
78
910
1112
1314
1516
17
Serv
ice
5.15
4.95
5.64
5.58
6.06
4.89
5.56
4.84
6.21
5.96
6.47
5.42
5.29
5.17
5.12
6.31
5.04
Team
wor
k5.
255.
495.
685.
435.
835.
325.
805.
016.
045.
816.
155.
025.
335.
145.
145.
915.
79
Influ
ence
5.60
5.02
6.34
5.25
5.48
5.07
5.96
4.95
5.48
5.06
5.43
5.38
5.73
5.58
5.72
5.48
5.28
Cre
ativ
ity6.
136.
305.
705.
095.
355.
745.
185.
825.
085.
315.
285.
105.
345.
585.
275.
475.
70
Inde
pend
ence
5.45
6.00
5.46
5.21
5.31
5.77
5.32
5.22
5.13
5.47
5.37
5.82
4.96
5.47
5.74
5.49
5.68
Exci
tem
ent
5.61
5.64
5.79
5.33
5.09
5.64
6.00
5.40
5.51
5.03
5.26
5.78
5.64
5.89
6.08
5.22
5.92
Dev
elop
men
t5.
675.
415.
795.
485.
585.
635.
545.
895.
595.
745.
655.
045.
065.
345.
005.
095.
29
Fina
nce
5.77
5.57
5.99
5.64
4.67
5.29
5.90
5.20
5.48
4.68
4.86
5.19
5.75
5.91
6.00
3.99
5.70
Pres
tige
5.62
5.49
5.75
5.26
5.32
5.37
6.17
5.19
5.80
5.16
5.19
5.17
5.46
5.92
5.66
4.70
5.69
Secu
rity
5.37
5.22
5.11
5.69
5.32
4.92
5.72
5.24
5.96
5.05
5.16
5.62
5.82
6.05
6.02
4.87
5.14
1 =
Arc
hit
ectu
re
3 =
Bu
sin
ess
– M
anag
emen
t 7
= L
aw10
= S
oci
al S
cien
ce
13 =
Tra
nsp
ort
atio
n
16 =
Rel
igio
n
2 =
Art
/Des
ign
4
= B
usi
nes
s –
Sale
s/C
leri
cal
8 =
Sci
ence
11 =
Hu
man
Ser
vice
s14
= M
ach
ine
Trad
es17
= E
nte
rtai
nm
ent
3 =
Bu
sin
ess
6 =
Ed
uca
tio
n9
= M
edic
ine
Hea
lth
12
= A
gri
cult
ure
15
= C
on
stru
ctio
n

27Career Values Scale • Development and Norming of the Career Value Scale
Table 5.3 ANOVAS for the 10 CVS Values Scales by Occupational Groups
Sums of Squares df Mean Squares F Sig.
Service Between Groups 5833.738 16 364.609 116.406 .000
Within Groups 77074.336 24607 3.132
Total 82908.074 24623
Influence Between Groups 5603.158 16 350.197 96.670 .000
Within Groups 89141.051 24607 3.623
Total 94744.209 24623
Independence Between Groups 1395.605 16 87.225 23.360 .000
Within Groups 91880.342 24607 3.734
Total 93275.947 24623
Creativity Between Groups 3504.262 16 219.016 59.089 .000
Within Groups 91206.895 24607 3.707
Total 94711.156 24623
Finance Between Groups 5835.573 16 364.723 101.388 .000
Within Groups 88519.120 24607 3.597
Total 94354.693 24623
Development Between Groups 826.847 16 51.678 13.977 .000
Within Groups 90979.317 24607 3.697
Total 91806.165 24623
Prestige Between Groups 2019.733 16 126.233 32.736 .000
Within Groups 94887.303 24607 3.856
Total 96907.036 24623
Teamwork Between Groups 2207.532 16 137.971 38.952 .000
Within Groups 87160.049 24607 3.542
Total 89367.580 24623
Security Between Groups 2238.290 16 139.893 36.664 .000
Within Groups 93888.722 24607 3.816
Total 96127.012 24623
Risk Between Groups 2065.263 16 129.079 40.298 .000
Within Groups 78818.421 24607 3.203
Total 80883.684 24623

28Career Values Scale • Development and Norming of the Career Value Scale
Tabl
e 5.
4Ra
nkin
g of
Ave
rage
Ste
n Sc
ores
by
Occu
patio
nal G
roup
by
Hig
hest
to L
owes
t
Arc
hit
ectu
reA
rt/D
esig
nM
anag
emen
tSa
les/
Cle
rica
lEd
uca
tio
nJo
urn
alis
mLa
wSc
ien
ceM
edic
ine
Hea
lth
Soci
al
Cre
ativ
ityC
reat
ivity
Influ
ence
Secu
rity
Serv
ice
Inde
pend
ence
Pres
tige
Dev
elop
men
tSe
rvic
eSe
rvic
e
Fina
nce
Inde
pend
ence
Fina
nce
Fina
nce
Team
wor
kC
reat
ivity
Risk
Cre
ativ
ityTe
amw
ork
Team
wor
k
Dev
elop
men
tRi
skRi
skSe
rvic
eD
evel
opm
ent
Risk
Influ
ence
Risk
Secu
rity
Dev
elop
men
t
Pres
tige
Fina
nce
Dev
elop
men
tD
evel
opm
ent
Influ
ence
Dev
elop
men
tFi
nanc
eSe
curit
yPr
estig
eIn
depe
nden
ce
Risk
Team
wor
kPr
estig
eTe
amw
ork
Cre
ativ
ityPr
estig
eTe
amw
ork
Inde
pend
ence
Dev
elop
men
tC
reat
ivity
Influ
ence
Pres
tige
Cre
ativ
ityRi
skSe
curit
yTe
amw
ork
Secu
rity
Fina
nce
Risk
Pres
tige
Inde
pend
ence
Dev
elop
men
tTe
amw
ork
Pres
tige
Pres
tige
Fina
nce
Serv
ice
Pres
tige
Influ
ence
Influ
ence
Secu
rity
Secu
rity
Serv
ice
Influ
ence
Inde
pend
ence
Influ
ence
Dev
elop
men
tTe
amw
ork
Fina
nce
Secu
rity
Team
wor
kIn
fluen
ceIn
depe
nden
ceIn
depe
nden
ceRi
skSe
curit
yIn
depe
nden
ceIn
fluen
ceIn
depe
nden
ceRi
sk
Serv
ice
Serv
ice
Secu
rity
Cre
ativ
ityFi
nanc
eSe
rvic
eC
reat
ivity
Serv
ice
Cre
ativ
ityFi
nanc
e
N =
156
6N
= 2
254
N =
555
9N
= 2
101
N =
240
4N
= 6
56N
= 1
223
N =
127
5N
= 2
106
N =
146
5
Hu
man
Ser
vice
sA
gri
cult
ure
Tran
spo
rtat
ion
Mac
hin
e Tr
ades
Co
nst
ruct
ion
Rel
igio
nEn
tert
ain
men
t
Serv
ice
Inde
pend
ence
Secu
rity
Secu
rity
Risk
Serv
ice
Risk
Team
wor
kRi
skFi
nanc
ePr
estig
eSe
curit
yTe
amw
ork
Team
wor
k
Dev
elop
men
tSe
curit
yIn
fluen
ceFi
nanc
eFi
nanc
eIn
depe
nden
ceC
reat
ivity
Influ
ence
Serv
ice
Risk
Risk
Inde
pend
ence
Influ
ence
Fina
nce
Inde
pend
ence
Influ
ence
Pres
tige
Influ
ence
Influ
ence
Cre
ativ
ityPr
estig
e
Cre
ativ
ityFi
nanc
eC
reat
ivity
Cre
ativ
ityPr
estig
eRi
skIn
depe
nden
ce
Risk
Pres
tige
Team
wor
kIn
depe
nden
ceC
reat
ivity
Dev
elop
men
tD
evel
opm
ent
Pres
tige
Cre
ativ
itySe
rvic
eD
evel
opm
ent
Team
wor
kSe
curit
yIn
fluen
ce
Secu
rity
Dev
elop
men
tD
evel
opm
ent
Serv
ice
Serv
ice
Pres
tige
Secu
rity
Fina
nce
Team
wor
kIn
depe
nden
ceTe
amw
ork
Dev
elop
men
tFi
nanc
eSe
rvic
e
N =
200
4N
= 1
87N
= 3
04N
= 1
80N
= 2
48N
= 1
80N
= 9
12

29Career Values Scale • Development and Norming of the Career Value Scale
Construct Validity Evidence
Another primary source of validity evidence is known as construct validity. Construct
validity evidence shows whether the test is appropriate to measure a particular
psychological construct.
The most popular method of examining construct evidence is to compare two different
tests that are supposed to measure similar or dissimilar constructs.
Values and Occupational Interests
The Career Interest Profiler (Bakker and Macnab, 2004) is a measure of occupational
interests. It measures the 6 Holland factors of Realistic, Investigative, Artistic, Social,
Enterprising and Conventional. Interests form another measure of preferences for
occupations that are different from values. They focus on the activities of work or on
general likes and dislikes about work. In contrast the CVS looks at what is important to
the client. If this is true then there should be few large correlations between the Career
Interest Profiler Scales and those of the Career Values Scale. Table 5.5 show that only ten
of the possible 60 inter-correlations are above).20 and could be considered substantive.
Values and Personality
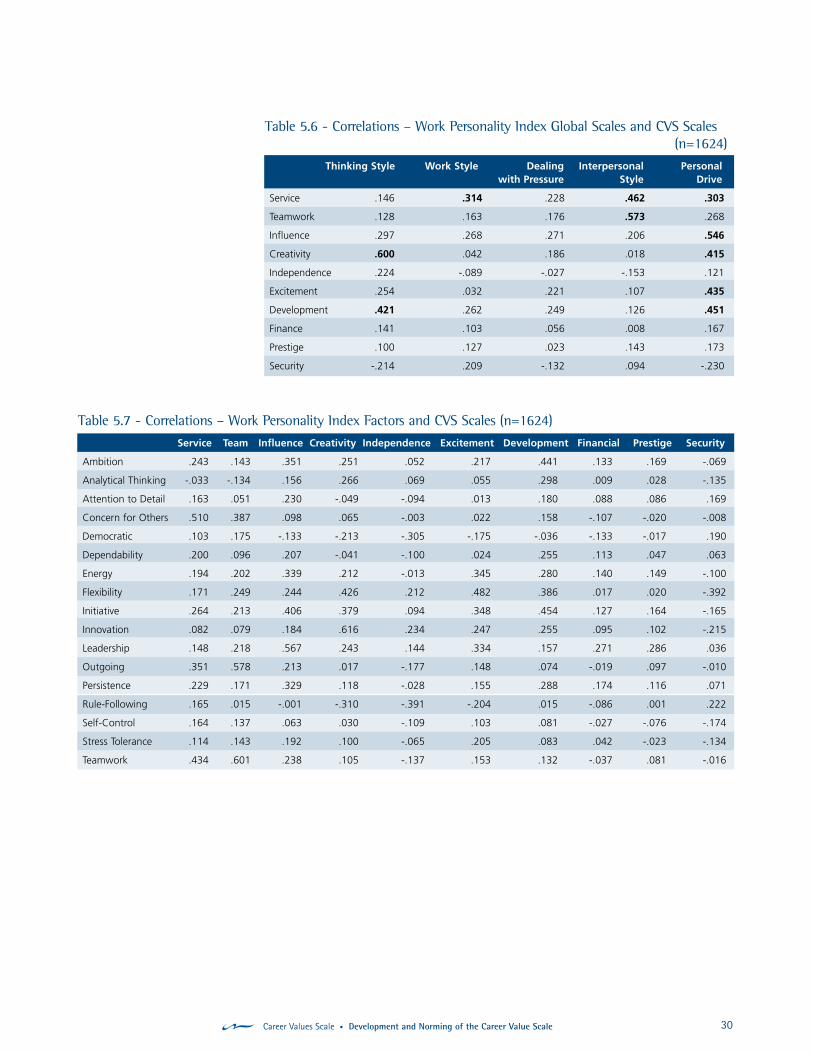
Work Personality Index and the CVS
The Work Personality Index (WPI) (Macnab and Bakker, 2001) is a measure of personality
traits that directly relate to work performance. The WPI assesses 17 primary scales. These
17 scales are categorized into five factors that provide a global view of personality. The
WPI and CVS were administered to 1624 people. The correlations between the two tests
are shown in Tables 5.6 and 5.7. Although they measure two different domains, there are
some substantive correlations between the two scales. These are in a predictable direction.
Table 5.5 Correlations – Career Interest Profiler Scales and CVS Scales (n=737)Artistic Conventional Enterprising Investigative Realistic Social
Service .104 .194 .194 .011 .056 .434
Team .129 .080 .215 -.053 .001 .357
Influence -.025 .025 .055 .003 .007 -.072
Creativity .319 -.063 .240 .219 .168 .067
Independence .163 -.041 .112 .001 -.015 -.048
Excitement .155 -.018 .252 .135 .171 .094
Development .102 .028 .062 .199 .025 .090
Financial .056 .235 .301 -.033 .033 -.057
Prestige .049 .160 .276 .006 .018 .037
Security -.121 .242 .103 -.134 -.015 .014
30Career Values Scale • Development and Norming of the Career Value Scale
Table 5.6 - Correlations – Work Personality Index Global Scales and CVS Scales (n=1624)
Thinking Style Work Style Dealing Interpersonal Personal with Pressure Style Drive
Service .146 .314 .228 .462 .303
Teamwork .128 .163 .176 .573 .268
Influence .297 .268 .271 .206 .546
Creativity .600 .042 .186 .018 .415
Independence .224 -.089 -.027 -.153 .121
Excitement .254 .032 .221 .107 .435
Development .421 .262 .249 .126 .451
Finance .141 .103 .056 .008 .167
Prestige .100 .127 .023 .143 .173
Security -.214 .209 -.132 .094 -.230
Table 5.7 - Correlations – Work Personality Index Factors and CVS Scales (n=1624)Thinking StyleWork Style Service
Service Team Influence Creativity Independence Excitement Development Financial Prestige Security
Ambition .243 .143 .351 .251 .052 .217 .441 .133 .169 -.069
Analytical Thinking -.033 -.134 .156 .266 .069 .055 .298 .009 .028 -.135
Attention to Detail .163 .051 .230 -.049 -.094 .013 .180 .088 .086 .169
Concern for Others .510 .387 .098 .065 -.003 .022 .158 -.107 -.020 -.008
Democratic .103 .175 -.133 -.213 -.305 -.175 -.036 -.133 -.017 .190
Dependability .200 .096 .207 -.041 -.100 .024 .255 .113 .047 .063
Energy .194 .202 .339 .212 -.013 .345 .280 .140 .149 -.100
Flexibility .171 .249 .244 .426 .212 .482 .386 .017 .020 -.392
Initiative .264 .213 .406 .379 .094 .348 .454 .127 .164 -.165
Innovation .082 .079 .184 .616 .234 .247 .255 .095 .102 -.215
Leadership .148 .218 .567 .243 .144 .334 .157 .271 .286 .036
Outgoing .351 .578 .213 .017 -.177 .148 .074 -.019 .097 -.010
Persistence .229 .171 .329 .118 -.028 .155 .288 .174 .116 .071
Rule-Following .165 .015 -.001 -.310 -.391 -.204 .015 -.086 .001 .222
Self-Control .164 .137 .063 .030 -.109 .103 .081 -.027 -.076 -.174
Stress Tolerance .114 .143 .192 .100 -.065 .205 .083 .042 -.023 -.134
Teamwork .434 .601 .238 .105 -.137 .153 .132 -.037 .081 -.016

31Career Values Scale • Development and Norming of the Career Value Scale
Inter-correlation between CVS Scales
The correlations in Table 5.8 show the relationships between the 10 Career Values Scales.
Reviewing the table shows there are significant relationships among some of the scales.
This suggests that scores on some of the scales could be combined to form a broader level
of analysis. In general, the scales that correlate highly together can be grouped into three
global areas. For more information on how these scales relate to each other, read the
following section on Factor Analysis.
Factor Analysis
Factor Analysis is a statistical process used to examine the CVS’s subscale structure and
assess the extent to which the CVS Model is justified. In simple terms, factor analysis helps
determine how the 10 CVS scales hang together. The factor loadings are presented in
Table 5.9. This data justifies the use of an overall three-factor model to organize the 10
CVS scales.
Table 5.8 - Inter-Correlations 10 CVS Scales for the Norm Group (n=14000)Thinking StyleWork Style Service
Teamwork Influence Creativity Independence Excitement Development Finance Prestige Security
Service .59 .45 .23 .11 .23 .36 .09 .23 .23
Teamwork .44 .26 .16 .41 .33 .23 .38 .23
Influence .44 .31 .46 .35 .44 .54 .20
Creativity .49 .48 .51 .31 .29 -.03
Independence .35 .29 .38 .28 .16
Risk .36 .35 .36 .01
Development .22 .27 .078
Finance .60 .43
Prestige .39
Table 5.9 - CVS Rotated Component Matrix (n=14000)Self-Expression Extrinsic Working with Others
Service .888
Influence .485
Teamwork .800
Independence .697
Creativity .852
Risk .685
Development .578
Finance .803
Prestige .735
Security .782

32Career Values Scale • Development and Norming of the Career Value Scale
Feedback Study
8554 people who completed the Career Values Scale rated the accuracy of their test
results and feedback. They were asked to rate how accurately the feedback they were
given described them. 95% of the participants rated the CVSI feedback as quite accurate
to very accurate. Only 4.8% of the sample considered the feedback to be inaccurate. Table
5.6 outlines the results of the feedback study. Since people are often one of the best
sources to rate their own values, this high level of endorsement from test takers provides
strong evidence that the CVS feedback is accurate and valid.
Table 5.10 Feedback Ratings for the CVSFrequency Percent
Very Accurate 2144 25.1
Accurate 3433 40.0
Quite Accurate 2566 30.0
Not Very Accurate 356 4.2
Totally Inaccurate 55 0.6
Total 8556 100.0

33Career Values Scale • Bibliography of Research on Values
Research on Values
B I B L I O G R A P H Y
Allport, G. W. & Vernon, P.E. (1931). The study of values. Boston: Houghton Mifflin.
Andolsek, D.M. & Stebe, J. (2004). Multinational Perspectives on Work Values and Commitment.
(2004). International Journal of Cross Cultural Management, 4, 181-209.
Bakker, S, & Macnab, D. (2004). Career Interest Profiler Manual. Edmonton, Alberta: Psychometrics
Canada Ltd.
Brown, D. (2002). The Role of Work and Cultural Values in Occupational Choice, Satisfaction, and
Success: A Theoretical Statement. Journal of Counselling & Development, 80, 48-56.
Cherrington, D.J., Conde, S.J., & England, J.L. (1979). Age and work values. Academy of
Management Journal, 22, 617–623.
Crosby, L.A., Bitner, M.J., & Gill, J.D. (1990). Organizational structure of values. Special Issue: Social
values. Journal of Business Research, 20, 123–134.
Dawis, R.V. (1991). Vocational interests, values and preferences. In M.D. Dunnette & L.M. Hough
(Eds.), Handbook of industrial & organizational psychology, Vol. 2 (pp.833–872). Palo Alto, CA:
Consulting Psychologists Press.
Dawis, R. V., & Lofquist, L. H. (1984). A psychological theory of work adjustment.Minneapolis,
MN: University of Minnesota Press.
Elizur, D. (1984). Facets of work values: A structural analysis of work outcomes. Journal of Applied
Psychology, 69(3), 379–389.
Elizur, D. (1999). Facets of Personal Values: A Structural Analysis of Life and Work Values. Applied
Psychology: An International Review, 48, 73-88.
Elizur, D., Borg, I., Hunt, R., & Beck, I.M. (1991). The structure of work values: A cross cultural
comparison. Journal of Organizational Behavior, 12, 21–38.
Fitzsimmon, G.W., Macnab, D. & Casserly, C. (1986) Technical manual for the Life Roles Inventory:
Values and Salience. Edmonton, Alberta, Canada: Psychometrics Canada.
Kern, C.W. (1998). Mentoring work values: Implications for counselors. Educational Gerontology, 24,
349-359.
Knoop, R. (1994). Work values and job satisfaction. Journal of Psychology, 128, 683-691.
Macnab, D. (1985). Work related needs, preferences, and values: An empirical integration.
Unpublished doctoral dissertation. University of Alberta, Edmonton.

34Career Values Scale • Bibliography of Research on Values
Macnab, D. & Bakker, S. (2001). Work Personality Index User's Manual. Edmonton, Alberta:
Psychometrics Canada Ltd.
Macnab, D. & Fitzsimmons, G.W. (1987). A multitrait, multimethod study of work-related needs,
values, and preferences. Journal of Vocational Behavior, 30, 1-15.
Nevill, D.D. & Super, D.E. (1989). Manual to the Values Scale (rev. ed.). Palo Alto, CA: Consulting
Psychologists Press.
Plant, P. (1997). Careerist, Wage-Earner, or Entrepreneur: Work Values and Counselling. Journal of
Employment Counselling, 34, 165-171.
Pryor, R.G.L. (1979). In search of a concept: Work values. Vocational Guidance Quarterly, 27, 250-258.
Pryor, R.G.L. (1983). The Work Aspects Preference Scale. Hawthorn, Victoria: Australian Council for
Educational Research.
Pryor, R.G.L. (1999). The Work Aspects Preference Scale: 2nd. Edition. Sydney, Australia,
Conguency Pty Ltd.
Roe, R.A. & Ester, P. (1999). Values and Work: Empirical Findings and Theoretical Perspective. Applied
Psychology: An International Review, 48, 1-21.
Rokeach, M. (1973). The nature of human values. New York: Free Press.
Ros, M., Schwartz, Shalom H. & Surkiss, S. (1999). Basic Individual Values, Work Values, and the
Meaning of Work. Applied Psychology: An International Review, 48, 49-72.
Rounds, J.B., Henley, G.A., Dawis, R.V., Lofquist, L.H., & Weiss, D.J. (1981). Manual for the
Minnesota Importance Questionnaire. Minneapolis: University of Minnesota.
Schwartz, S.H. (1999). A Theory of Cultural Values and Some Implications for Work. Applied
Psychology: An International Review, 48, 23-48.
Super, D.E. (1970). The Work Values Inventory. Boston: Houghton Mifflin.
Super, D.E. (1980 ). A life-span, life-space, approach to career development. Journal of Vocational
Behavior, 16, 282-298.
Super, D.E. (1981). The relative importance of work. Bulletin of the International Association of
Educational and Vocational Guidance, 37, 26-36.
Super, D.E. (1995). Values: Their nature, assessment, and practical use. In Super, D.E. & Sverko, B.
(Eds.) Life Roles, Values, and Careers. San Francisco, CA: Jossey-Bass.
Super, D.E. & Nevill, D.D. (1986). The Values Scale. Palo Alto, CA: Consulting Psychologists Press.
Super, D.E. & Sverko, B. (Eds.) (1995). Life Roles, Values, and Careers. San Francisco, CA: Jossey-Bass.
Sverko, B. (1989). Origin of individual differences in importance attached to work: A model and
contribution to its evaluation. Journal of Vocational Behavior, 34, 28-39.
Sverko, B. (1995). The structure and hierarchy of values viewed cross-nationally. In D.E. Super, & B.
Sverko (Eds.), Life roles, values, and careers: International findings of the work importance study
(pp.225–240). San Francisco, CA: Jossey-Bass, Inc.
Warr, P.B., Cook,J. & Wall, T.D. (1979). Scales of measurement of some work attitudes and aspects
of psychological well-being. Journal of Occupational Psychology, 52, 129-148.
Zytowski, D.G. (1994). A super contribution to vocational theory: Work values. Special Issue: From
vocational guidance to career counselling: Essays to honor Donald E. Super. Career Development
Quarterly 43, 25–31.

35Career Values Scale • Appendix A – Sample Report
A P P E N D I X • A
Sample Report

36Career Values Scale • Appendix A – Sample Report

37Career Values Scale • Appendix A – Sample Report

38Career Values Scale • Appendix A – Sample Report

39Career Values Scale • Appendix A – Sample Report

40Career Values Scale • Appendix A – Sample Report

41Career Values Scale • Appendix A – Sample Report

42Career Values Scale • Appendix A – Sample Report

43Career Values Scale • Appendix A – Sample Report

44Career Values Scale • Appendix A – Sample Report

45Career Values Scale • Appendix A – Sample Report

46Career Values Scale • Appendix A – Sample Report

47Career Values Scale • Appendix A – Sample Report

48Career Values Scale • Appendix A – Sample Report
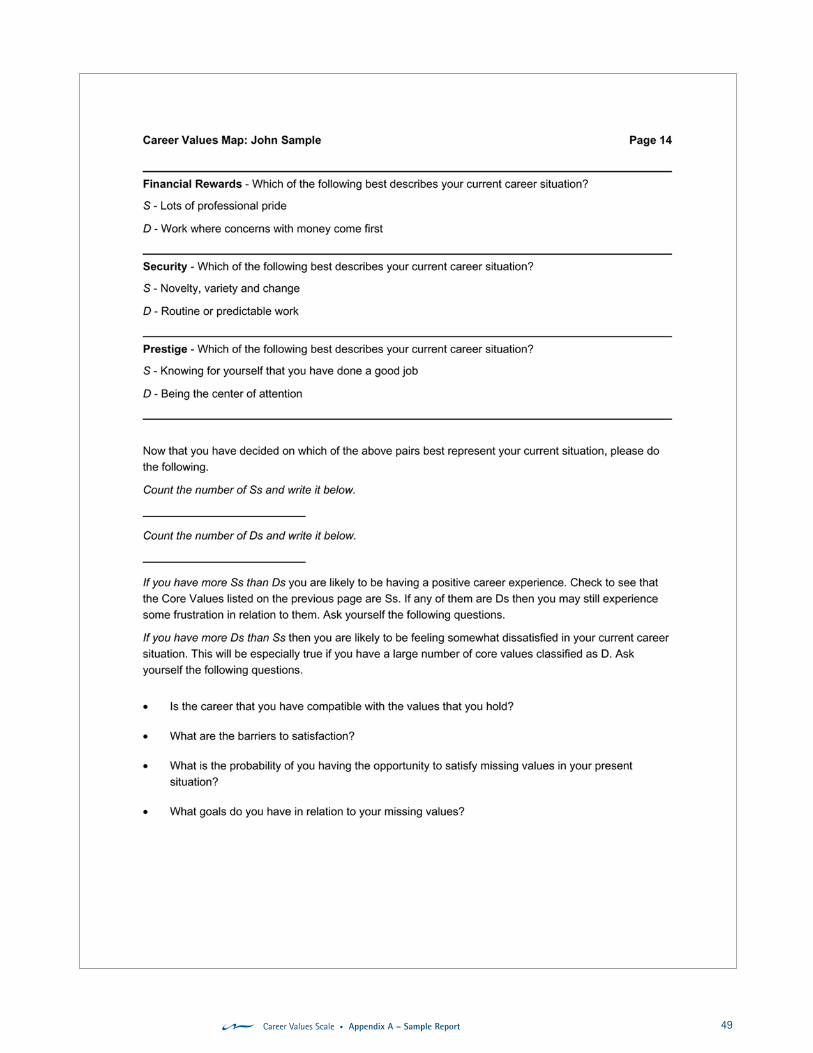
49Career Values Scale • Appendix A – Sample Report

50Career Values Scale • Appendix A – Sample Report