Managing Finance and Budgets Seminar 5. Seminar Five - Activities Preparation: read M & A Chapters...
34
Managing Finance and Budgets Seminar 5
-
Upload
wade-bunyan -
Category
Documents
-
view
214 -
download
0
Transcript of Managing Finance and Budgets Seminar 5. Seminar Five - Activities Preparation: read M & A Chapters...

Managing Finance and Budgets
Seminar 5

Seminar Five - Activities
Preparation: read M & A Chapters 8, 9 and 10 Describe key concepts:
Objectives of cost analysis
Cost definitions
Cost behaviour & Break-even analysis
Full (absorption) costing Exercises 10.4 (page 337) and 10.8 (page 340)

Starting Points (1)
Define what is meant by the following: Historic Cost Past Cost Opportunity Cost Sunk Cost Committed Cost Outlay Cost
.When and in what circumstances can costs be regarded as relevant or irrelevant?.

Summary of the relationship between relevant and irrelevant costs
Costs which are the same irrespective
of which decision is made
Relevant costs
Irrelevant costs
Future costs which vary with the
decision under consideration
Past costs
Costs which were incurred as a result of a past decision
Opportunity costs
The cost of being deprived
of the next best option
Outlay costs
Future cash outflows which vary with the
decision
Future cash outflows which do not vary with
the decisionOutlay costs
Starting Points (2)
Define what is meant by the following: Fixed Cost Variable Cost
Consider a Hairdressing Salon.
Can you give some examples of: Fixed costs Variable costs

The behaviour of costs
Those that stay fixed (the same) when changes occur to the
volume of activity
Those that vary according to the volume of activity
Costs may be broadly classified as:
Fixed
Variable

Starting Points (3)
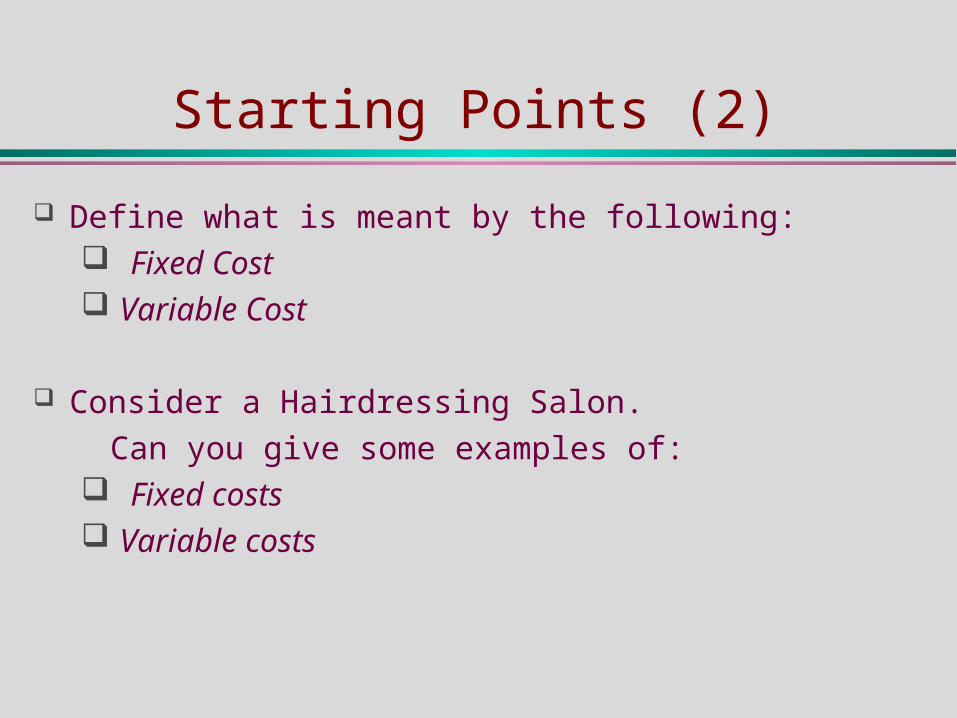
Interpreting Graphs The next three slides show the level of cost against volume
of activity for different types of costs. Explain what the graph shows in each case.
Cost (£)
Volume of activity (units of output)
F
Graph of fixed cost(s) against the level of activity

Rent cost (£)
Volume of activity
R
Graph of rent cost against the level of activity

Cost (£)
Volume of activity 0
Graph of cost of lotions and other materials against the level of activity

Electricity cost (£)
Volume of activity 0
The slope of this line gives the variable cost
per unit of activity
Graph of electricity cost against the level of activity
Fixed cost
element

Break-Even Analysis (1)
Explain what is meant by the ‘Break-Even’ point. The next two slides show various components required to
calculate the ‘Break-Even’ point. What do the slides show? Interpret what is happening.
State the Break-Even Formula. Where does this formula come from?

Cost (£)
Volume of activity (units of output)0
F
Total cost
Fixed costs
Variable costs
Graph of total cost against the level of activity

Cost (£)
Volume of activity (units of output)0
F
Total cost
Fixed costs
Variable costs
Break even point
Total sales service
Break-even chart

Calculating the break - even point
Fixed costs________________ Sales revenue per unit – Variable costs per unit
b =

Profit (£)
Volume of activity0
Loss
Profit
Break even point
Loss (£)
Fixed cost
Profit-volume chart

Break-Even Analysis (2)
Cottage Industries sells 500 baskets per month. Fixed costs are £500 Each basket costs £2 in materials and £10 labour. Baskets are sold at £14 each.
Calculate the ‘Break-Even’ point, in terms of ‘baskets per month.
What is the total profit each month?

Break-even chart for Cottage Industries’ basket making without the machine
Cost (£000)
Volume of activity (number of baskets)
0
1Fixed costs
Totalrevenue5
4
3
2
Totalcosts
100 400300200 500

Break-Even Analysis (2)
A machine costing £3000 per month is available, but reduces the other costs to: Fixed costs are £500 Each basket costs £2 in materials and £5 labour.
Calculate the new ‘Break-Even’ point, in terms of ‘baskets per month.
What is the new total profit each month?

Break-even chart for Cottage Industries’ basket making with the machine
Cost (£000)
1
Fixed costs
Totalrevenue5
4
3
2
Totalcosts
Volume of activity (number of baskets)
0100 400300200 500

Operational Gearing
The Basket-making example highlights the issue of ‘Operational (or Operating) Gearing’. Explain, using the example what this means.
Fill in the blanks, using the words high and low:
If the volume of trade is ____, a company with ___ operational gearing will tend to have ____ profit compared to a company with ____ operational gearing.

The effect of operating gearing
Break-Even Analysis
Describe some of the weaknesses of Break-Even Analysis
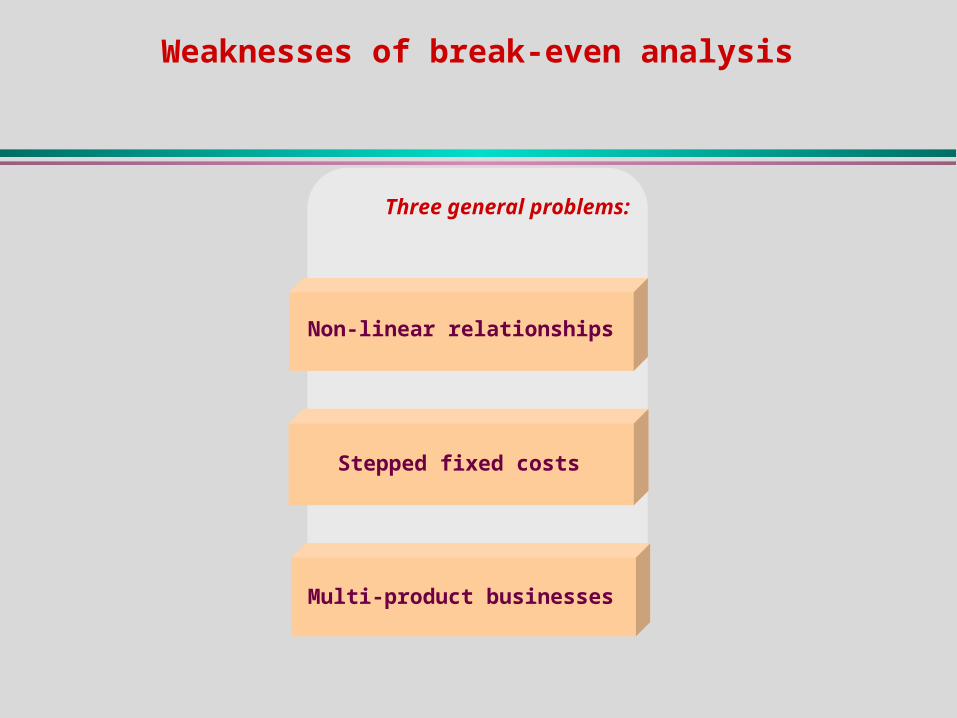
Weaknesses of break-even analysis
Three general problems:
Non-linear relationships
Stepped fixed costs
Multi-product businesses
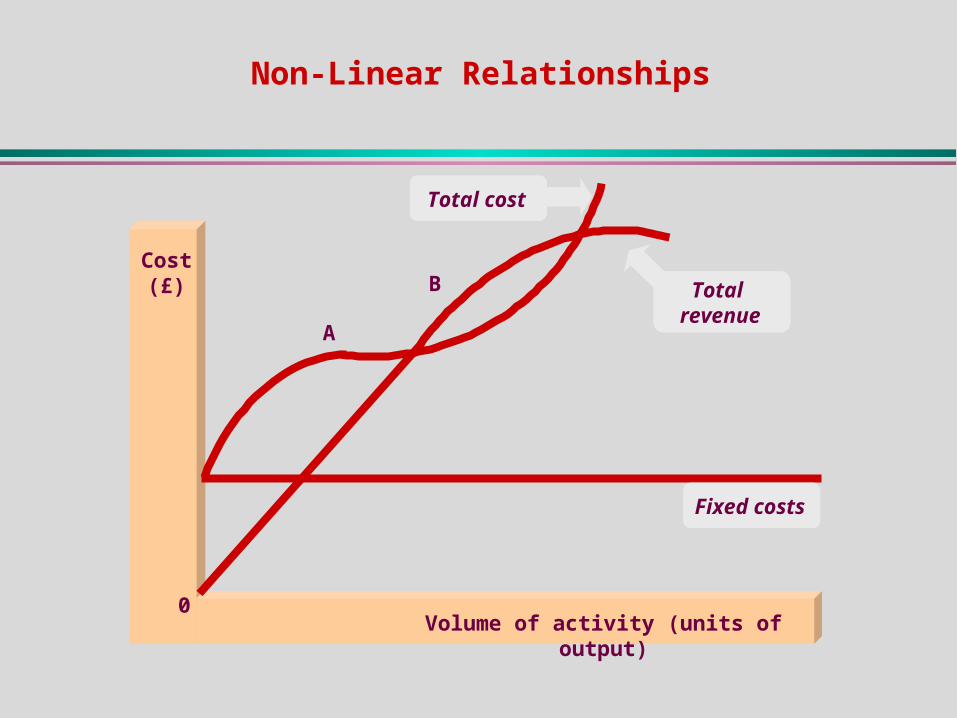
Non-Linear Relationships
Cost (£)
Volume of activity (units of output)0
Fixed costs
A
B
Total cost
Total revenue

Fixed cost (£)
Duration of activity
R
Stepped Fixed Costs

Full Costing
What is ‘Full Costing’? What is it used for? Explain the relationships between Full Costs and:
Direct and Indirect Costs Fixed and Variable Costs
How would you deal with overheads on a departmental basis?

Uses of full cost information
Two main uses:
For pricing purposes
For income measurement purposes

Direct and indirect costs
These are all other costs: That is, those that cannot be directly
measured in respect of each particular unit of output.
Two categories of costs:
Direct costs
Indirect costs or (overheads)
Costs that can be identified with specific cost units – the effect of
the cost can be measured in respect of each particular output.

The relationship between direct costs and indirect costs
Full cost of the unit
Direct costs of the unit
Fair share of indirect costs (overheads)

The relationship between fixed costs, variable costs and total costs
Total (or full) costs
Fixed costsVariable
costs

The relationship between direct, indirect, variable and fixed costs of a particular job
Total (or full) cost of a
particular job
Indirect costs (overheads)
Fixed costs
Direct costs
Variable costs

Preparation department
Finished goods store
Finishing department
Machining department
* Direct materials * Direct labour * A share of thePreparation Department’s overheads
Job A
A cost unit passing through the production process

Costing Jobs
M & A Exercise 10.4 M & A Exercise 10.8