
Managed Care: Present and Future Robert (James) Walling, MRH&T James B. Connor, Pricewaterhouse...
61
Managed Care: Present and Future Robert (James) Walling, MRH&T James B. Connor, Pricewaterhouse Coopers James W Macdonald, Reliance Reinsurance Corp.
-
date post
19-Dec-2015 -
Category
Documents
-
view
218 -
download
2
Transcript of Managed Care: Present and Future Robert (James) Walling, MRH&T James B. Connor, Pricewaterhouse...

Managed Care: Present and Future
Robert (James) Walling, MRH&T
James B. Connor, Pricewaterhouse Coopers
James W Macdonald, Reliance Reinsurance Corp.

Managed Care: A Brief Look at the Past
Robert J. Walling, Consulting Actuary
Miller, Rapp, Herbers, & Terry, Inc.

Why look at “Ancient History”
Those who cannot remember the past are condemned to repeat it.
—George Santayana
That men do not learn very much from the lessons of history is the most important of all the lessons of history.
—Aldous Huxley

Ancient History 1
1910– First prepaid group practice (50¢ /member/mo)– First group health policy issued to Montgomery
Ward
1917– Early medical society opposition to managed care
begins as Pierce County Service Bureau is formed to limit competition from prepaid plans.
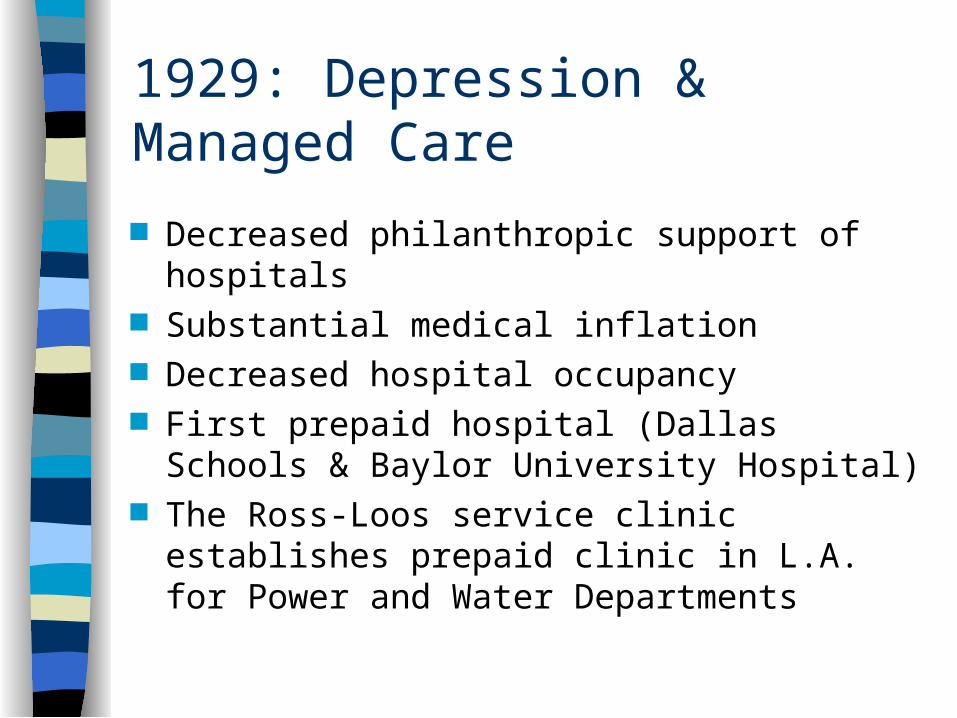
1929: Depression & Managed Care
Decreased philanthropic support of hospitals Substantial medical inflation Decreased hospital occupancy First prepaid hospital (Dallas Schools &
Baylor University Hospital) The Ross-Loos service clinic establishes
prepaid clinic in L.A. for Power and Water Departments

Backlash
1931 - Ross & Loos expelled from L.A.
County Medical Society
1932 - AMA Publishes a strong statement
opposing prepaid medical.
1932 - Blue Cross developed (medical
community responded more favorably to
health insurance than prepaid medical)
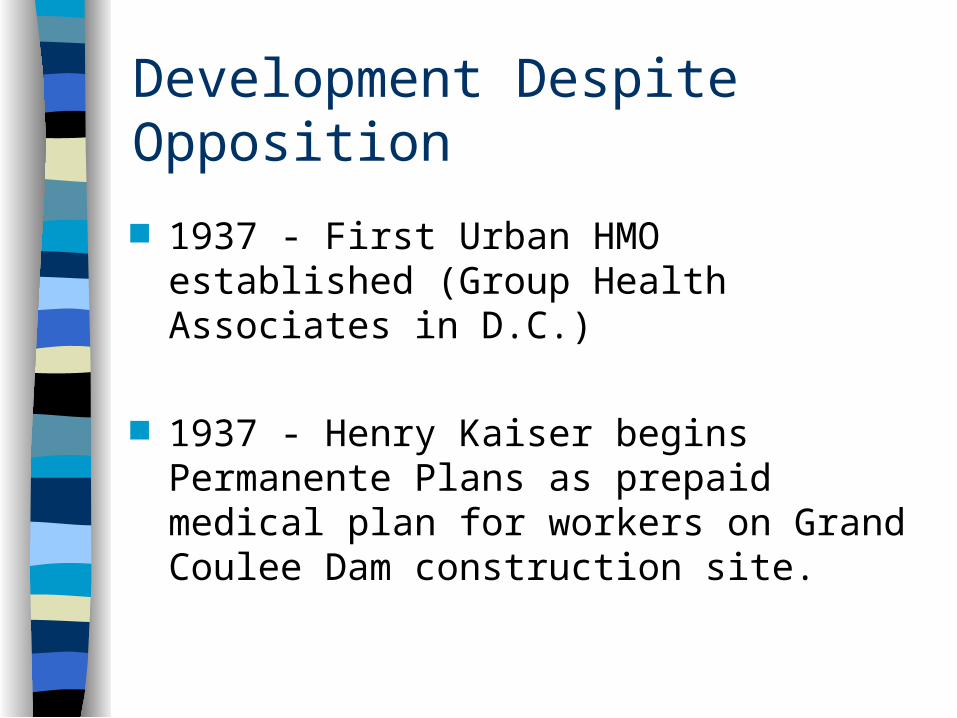
Development Despite Opposition
1937 - First Urban HMO established (Group Health Associates in D.C.)
1937 - Henry Kaiser begins Permanente Plans as prepaid medical plan for workers on Grand Coulee Dam construction site.
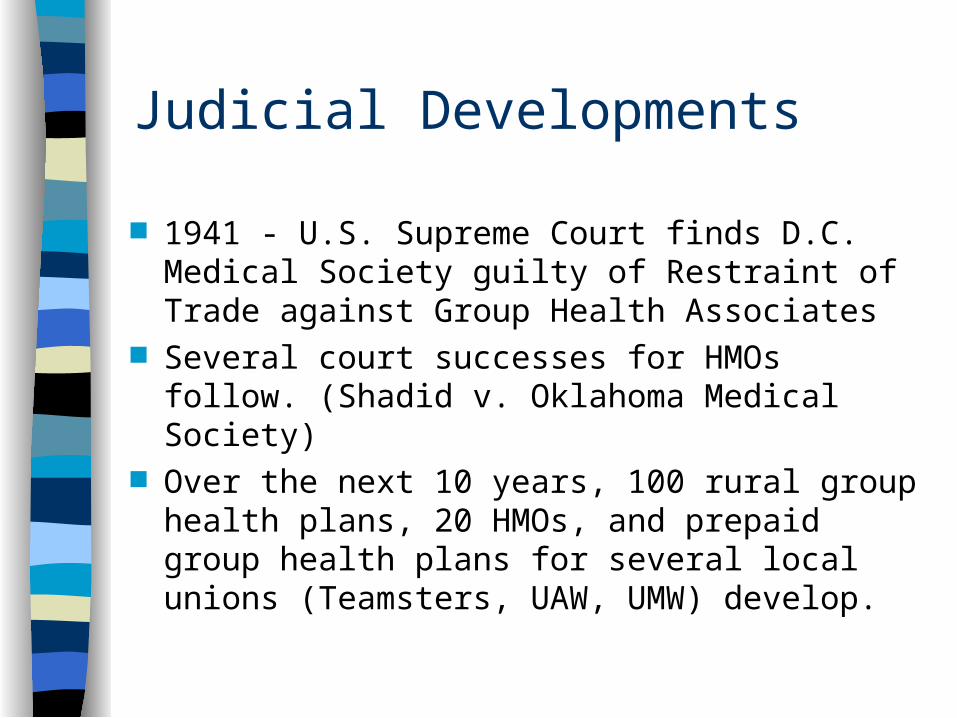
Judicial Developments
1941 - U.S. Supreme Court finds D.C. Medical Society guilty of Restraint of Trade against Group Health Associates
Several court successes for HMOs follow. (Shadid v. Oklahoma Medical Society)
Over the next 10 years, 100 rural group health plans, 20 HMOs, and prepaid group health plans for several local unions (Teamsters, UAW, UMW) develop.
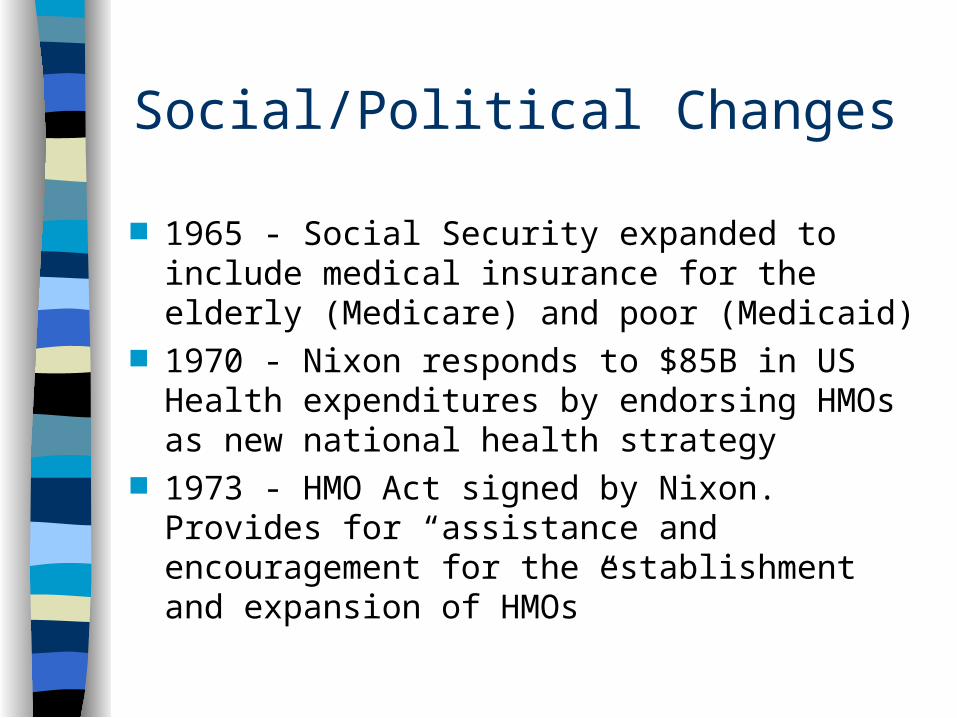
Social/Political Changes
1965 - Social Security expanded to include medical insurance for the elderly (Medicare) and poor (Medicaid)
1970 - Nixon responds to $85B in US Health expenditures by endorsing HMOs as new national health strategy
1973 - HMO Act signed by Nixon. Provides for “assistance and encouragement for the establishment and expansion of HMOs”
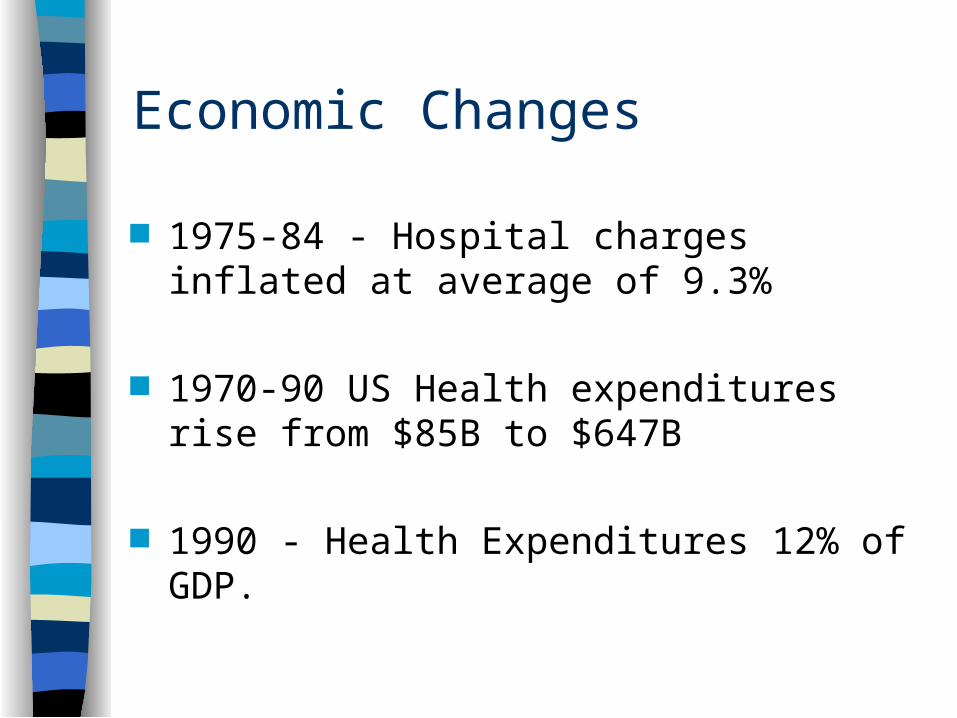
Economic Changes
1975-84 - Hospital charges inflated at average of 9.3%
1970-90 US Health expenditures rise from $85B to $647B
1990 - Health Expenditures 12% of GDP.
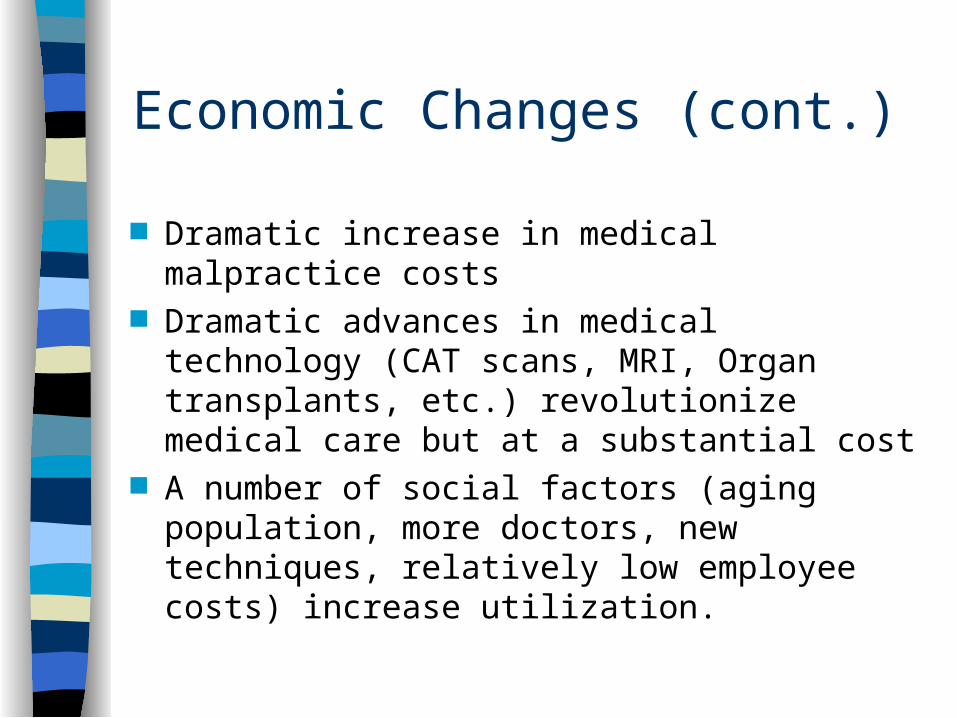
Economic Changes (cont.)
Dramatic increase in medical malpractice costs
Dramatic advances in medical technology (CAT scans, MRI, Organ transplants, etc.) revolutionize medical care but at a substantial cost
A number of social factors (aging population, more doctors, new techniques, relatively low employee costs) increase utilization.
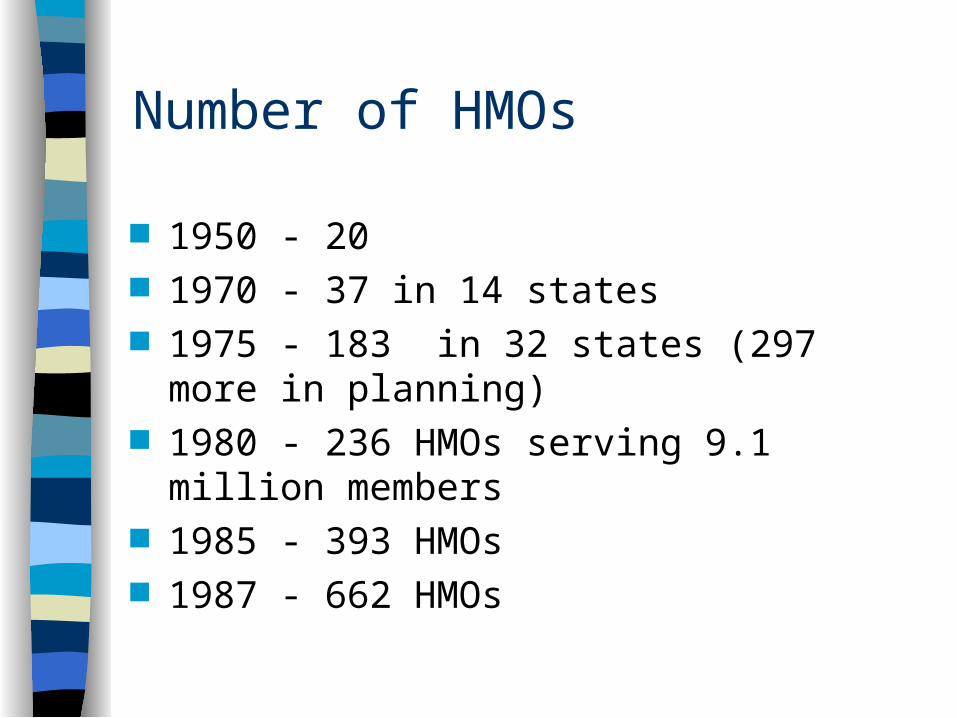
Number of HMOs
1950 - 20 1970 - 37 in 14 states 1975 - 183 in 32 states (297 more in
planning) 1980 - 236 HMOs serving 9.1 million
members 1985 - 393 HMOs 1987 - 662 HMOs

Early Cost Containment Efforts
Controlling Utilization– Utilization Review– Weekend Admissions– Maternity Length of Stay– Preadmission review– Second Surgical Opinion– Case Management– Appropriate Level of Care– Pre-admission Review
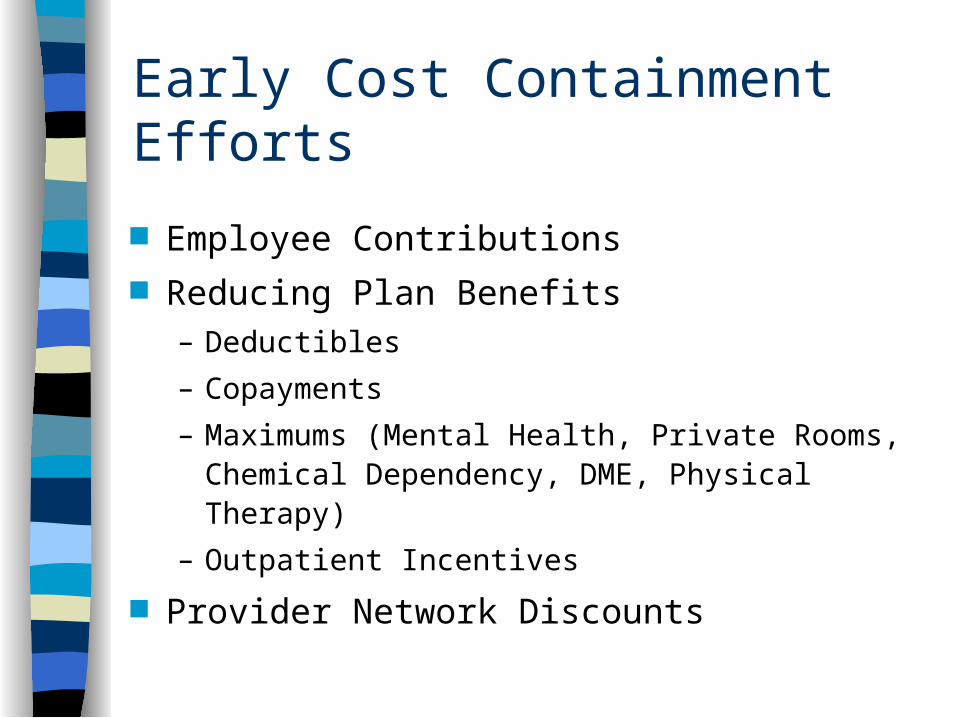
Early Cost Containment Efforts
Employee Contributions Reducing Plan Benefits
– Deductibles
– Copayments
– Maximums (Mental Health, Private Rooms, Chemical Dependency, DME, Physical Therapy)
– Outpatient Incentives
Provider Network Discounts
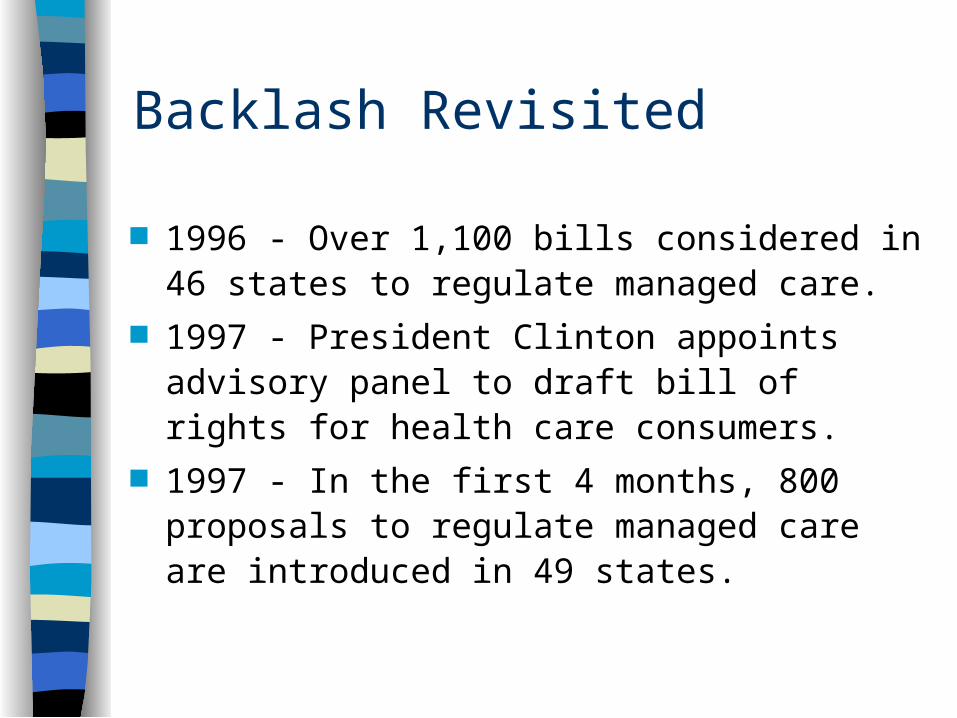
Backlash Revisited
1996 - Over 1,100 bills considered in 46 states to regulate managed care.
1997 - President Clinton appoints advisory panel to draft bill of rights for health care consumers.
1997 - In the first 4 months, 800 proposals to regulate managed care are introduced in 49 states.

Managed Care: Present & Future
Jim Conner
Pricewaterhouse Coopers

Managed Care - Overview Current Environment
– Trend Issues– Overview
Growth Prices Medical Care Costs Margins Mergers Quality of Care Member Satisfaction Government Programs Computer Systems Regulatory
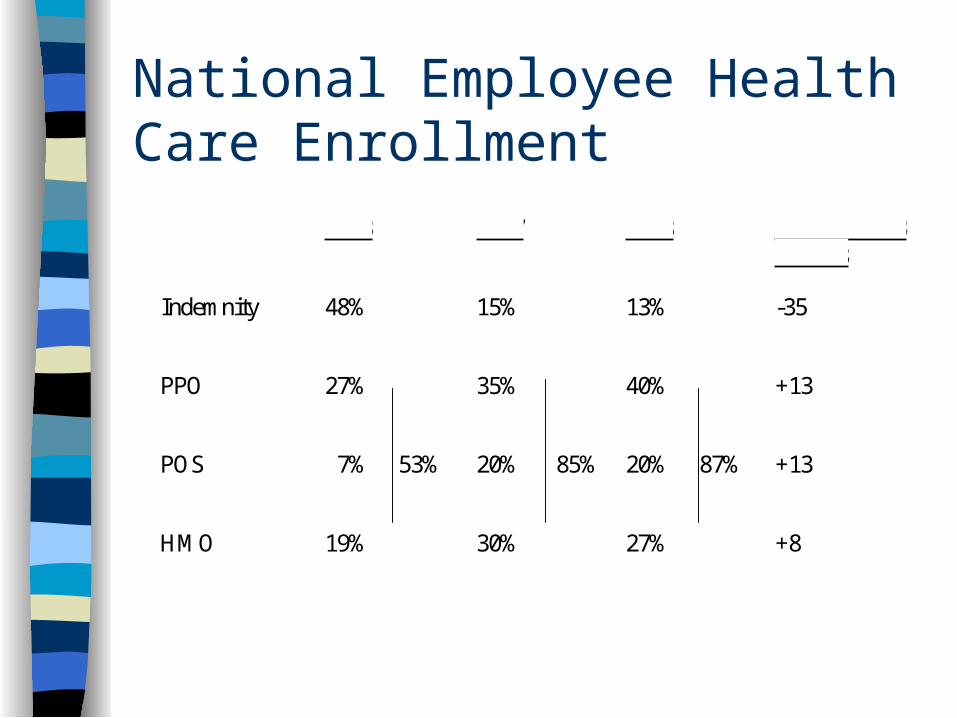
National Employee Health Care Enrollment
1993 1997 1998 Change 1993 to 1998
Indemnity 48% 15% 13% -35
PPO 27% 35% 40% +13
POS 7% 53% 20% 85% 20% 87% +13
HMO 19% 30% 27% +8
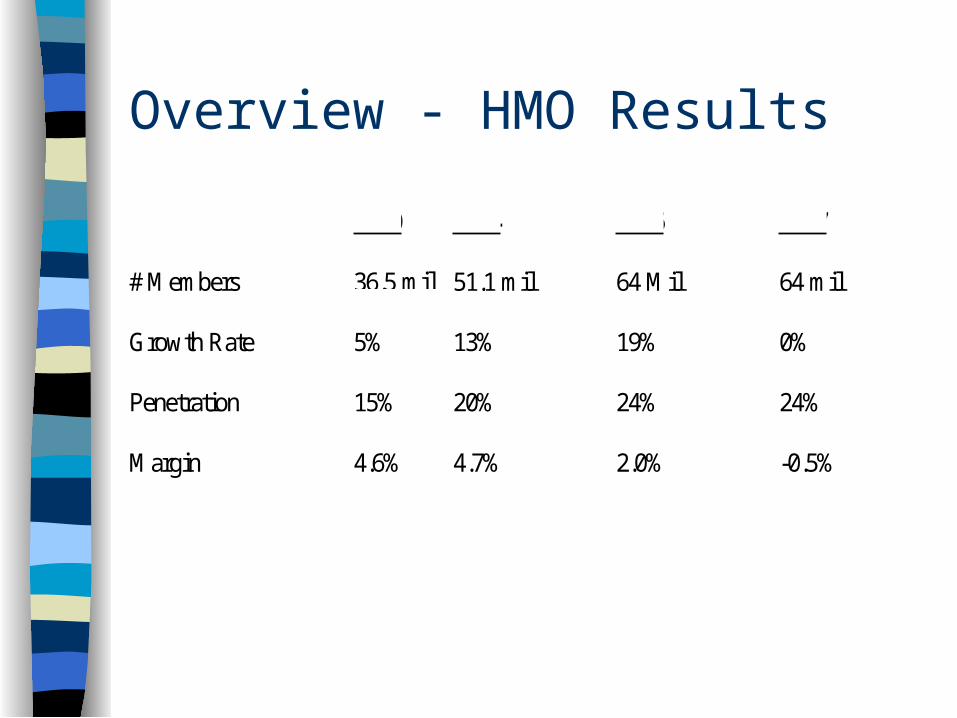
Overview - HMO Results
1990 1994 1996 1997
# Members 36.5 mil 51.1 mil 64 Mil 64 mil
Growth Rate 5% 13% 19% 0%
Penetration 15% 20% 24% 24%
Margin 4.6% 4.7% 2.0% -0.5%

HMO RATE INCREASE
0.80.5
2.62.1
4.6
3.3
8.3
0
1
2
3
4
5
6
7
8
9
1996 1997 1998 1999
ProjectedActual
Sources: Sherlock Co. (Projected); KPMG Peat Marwick (Actural)

Managed Care - Growth
Penetration/Growth Rate
Control Risk
Underwriting Risk
Provider Contracting Leverage

Managed Care - Prices
Price Changes
Market Share Driven
Employer Leveraged
Expectations of Managed Care
Purchasing Coalitions
Underwriting Cycle

Managed Care - Medical Care Costs
Utilization vs. Inflation
Aging Population
Disease Management
Capitation/Risk Sharing
Pharmacy Costs
Complementary & Alternative Medicine (CAM)
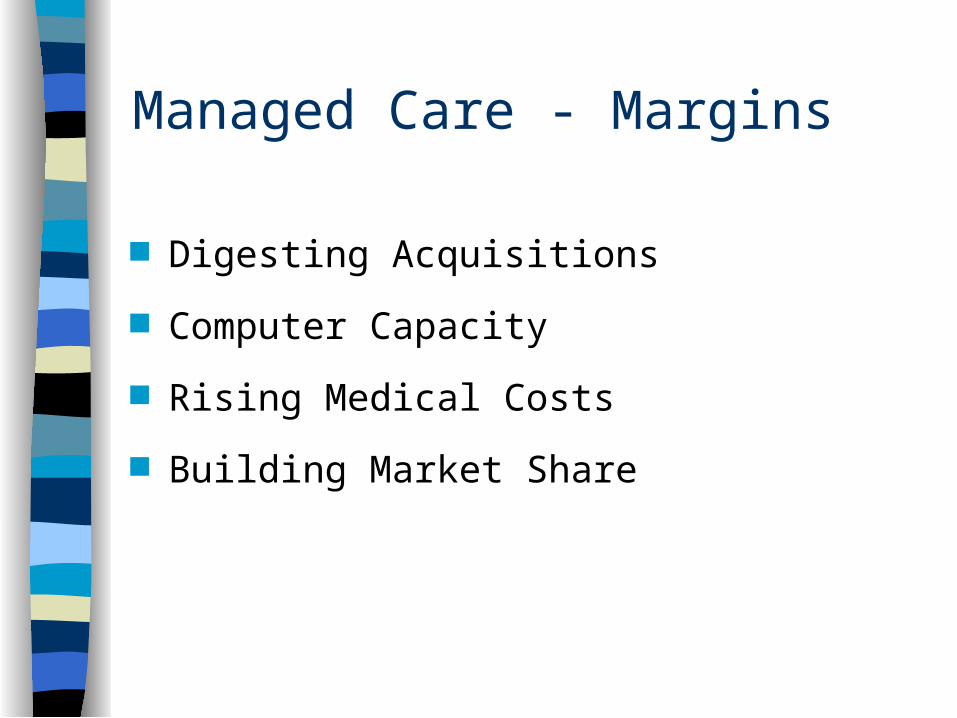
Managed Care - Margins
Digesting Acquisitions
Computer Capacity
Rising Medical Costs
Building Market Share
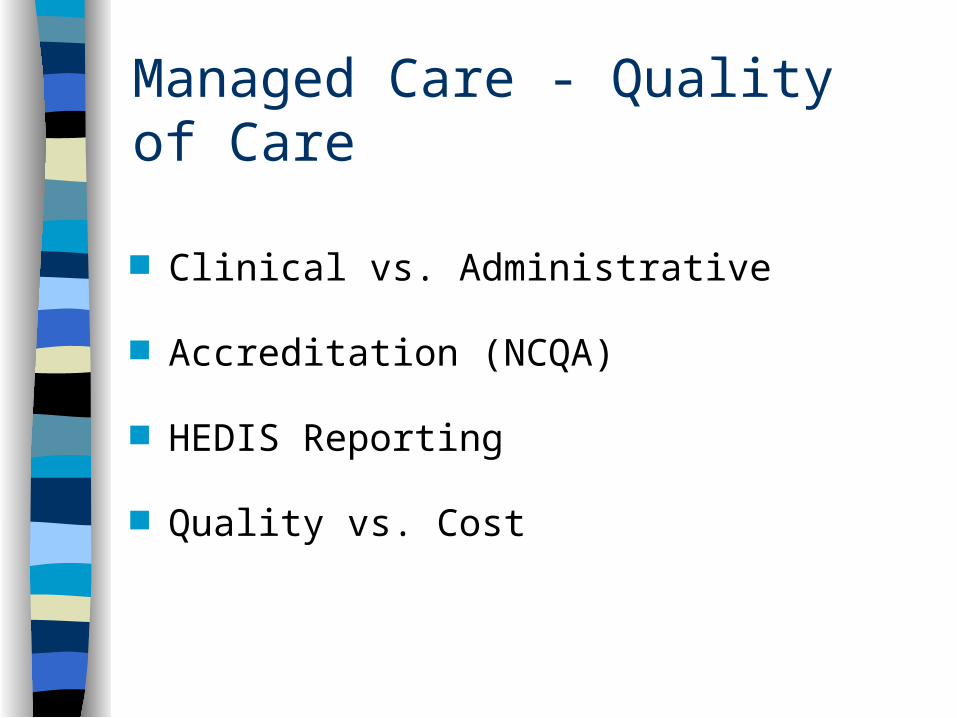
Managed Care - Quality of Care
Clinical vs. Administrative
Accreditation (NCQA)
HEDIS Reporting
Quality vs. Cost
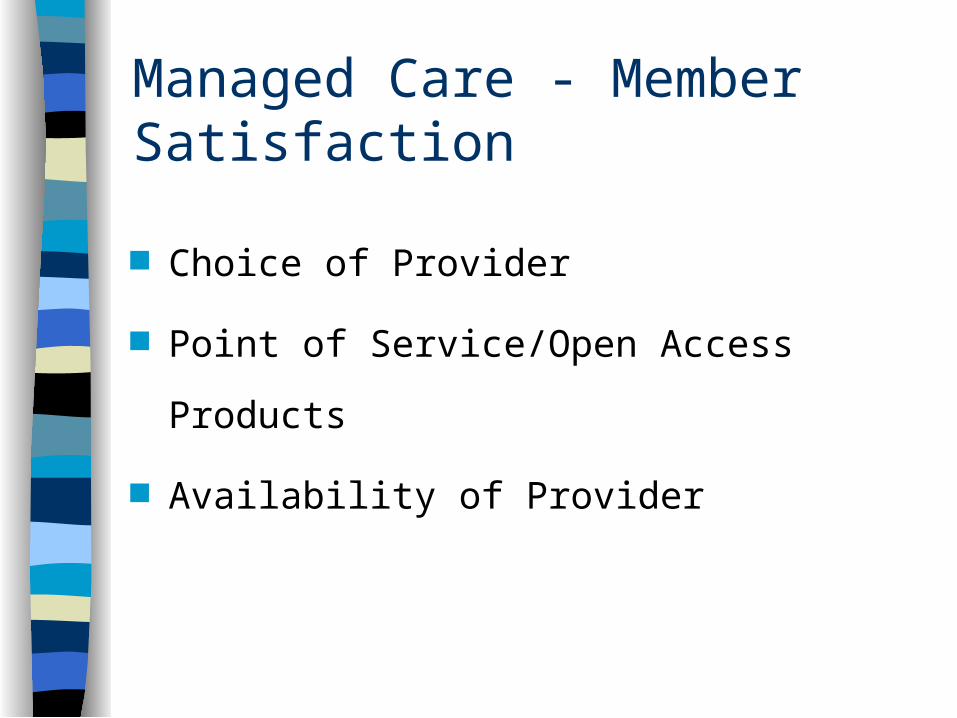
Managed Care - Member Satisfaction
Choice of Provider
Point of Service/Open Access Products
Availability of Provider
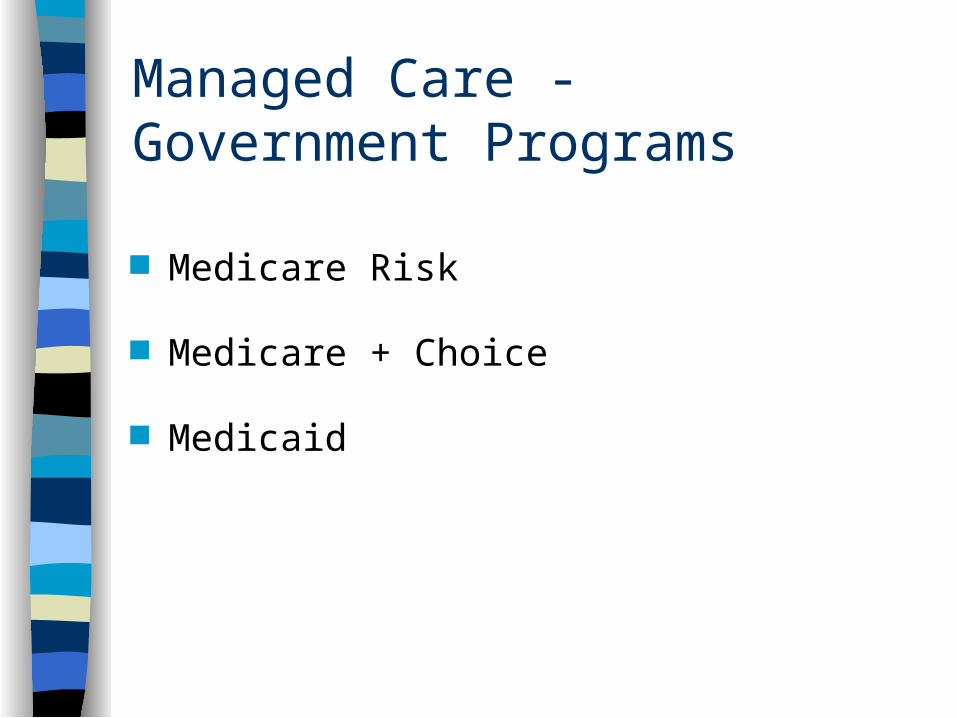
Managed Care - Government Programs
Medicare Risk
Medicare + Choice
Medicaid

Managed Care - Computer Systems
Information Driven Business
Capacity
Medical Management
Integrated Healthcare Systems
Dynamic Industry

Managed Care -Pricing Components
Pricing Grid
Medical Service Categories 20 - 30
Diagnostic Related Groups (DRG)495
Procedure Codes (CPT) 1,000+
Diagnostic Codes (ICD9) 1,000+

Managed Care -Regulatory Consumer Protection Legislation
– Emergency Care– External Appeals– Access to Specialists– Continuity of Care– Right to Sue Health Plan
Medicare Reform– Medicare & Choice– Outpatient Drugs
Medical Record Privacy– Consent Issue– Genetic Data
Uninsured (45 Million)

MANAGED CARE MANAGED HEALTH
Future of Managed Care: The Only Certainty is (Much) More Change
James W Macdonald, Senior Vice President
Reliance Reinsurance Corp.
Important recent developments most likely to define the future
of Managed Care
Consumer Choice is returning rapidly
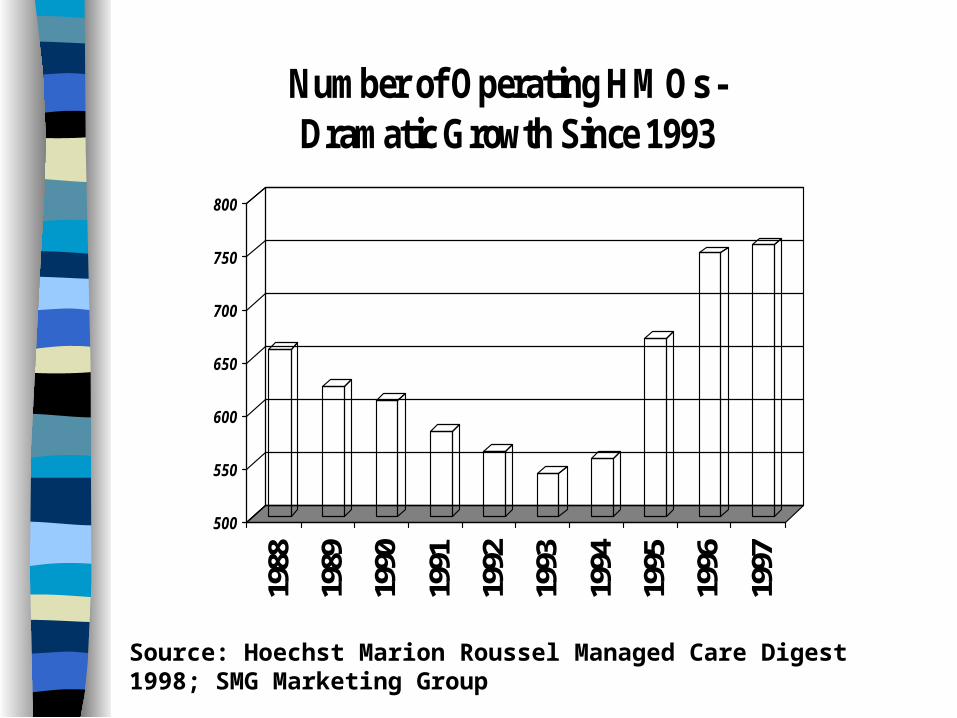
500
550
600
650
700
750
800
1988
1989
1990
1991
1992
1993
1994
1995
1996
1997
Number of Operating HMOs - Dramatic Growth Since 1993
Source: Hoechst Marion Roussel Managed Care Digest 1998; SMG Marketing Group

25
35
45
55
65
75
85
1988
1989
1990
1991
1992
1993
1994
1995
1996
1997
Total Enrollment Approached 84 Million In 1997
0%
10%
20%
30%
40%
50%
60%
70%
80%
90%
100%
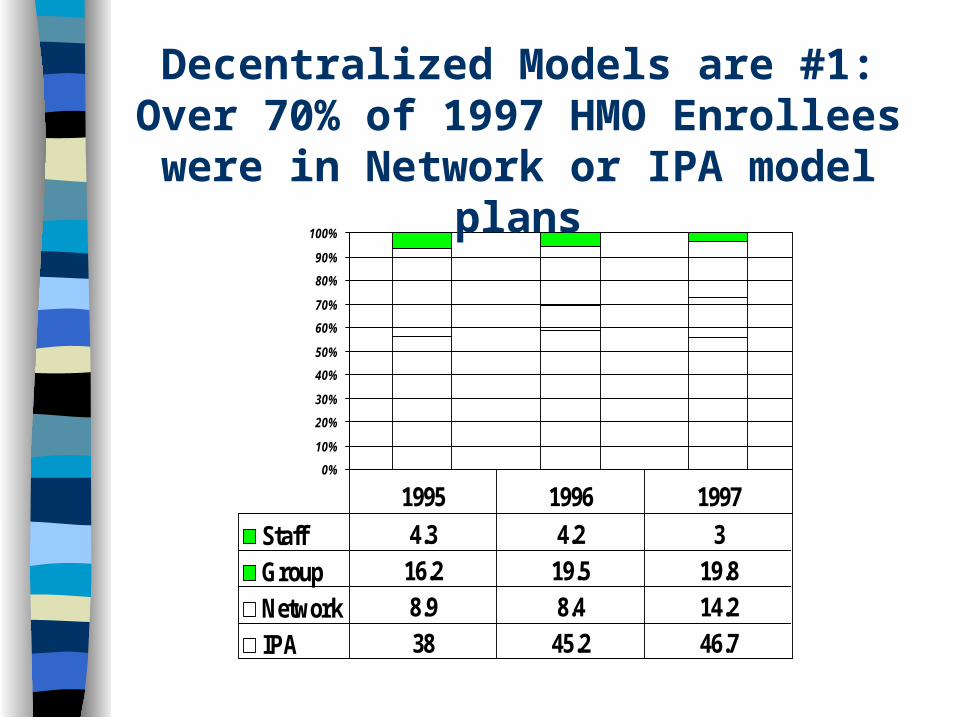
Staff 4.3 4.2 3
Group 16.2 19.5 19.8
Network 8.9 8.4 14.2
IPA 38 45.2 46.7
1995 1996 1997
Decentralized Models are #1: Over 70% of 1997 HMO Enrollees were in Network or
IPA model plans
35.00%
45.00%
55.00%
65.00%
75.00%
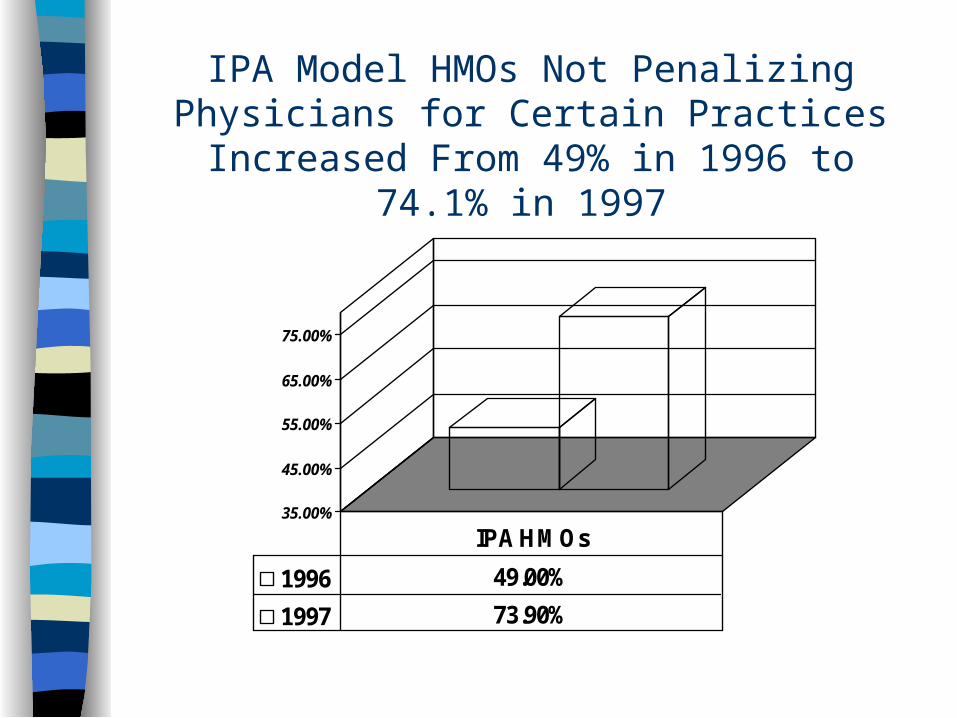
1996 49.00%
1997 73.90%
IPA HMOs
IPA Model HMOs Not Penalizing Physicians for Certain Practices Increased From 49% in 1996 to
74.1% in 1997
38.0%
39.0%
40.0%
41.0%
42.0%
43.0%
44.0%
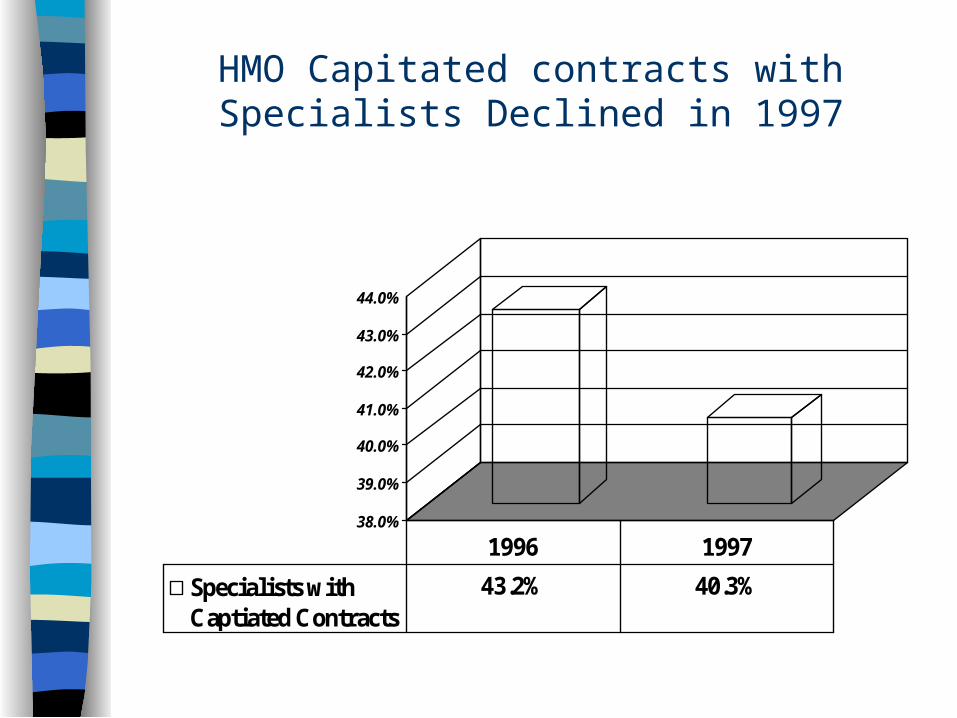
Specialists withCaptiated Contracts
43.2% 40.3%
1996 1997
HMO Capitated contracts with Specialists Declined in 1997
65.0%
67.0%
69.0%
71.0%
73.0%
75.0%
77.0%
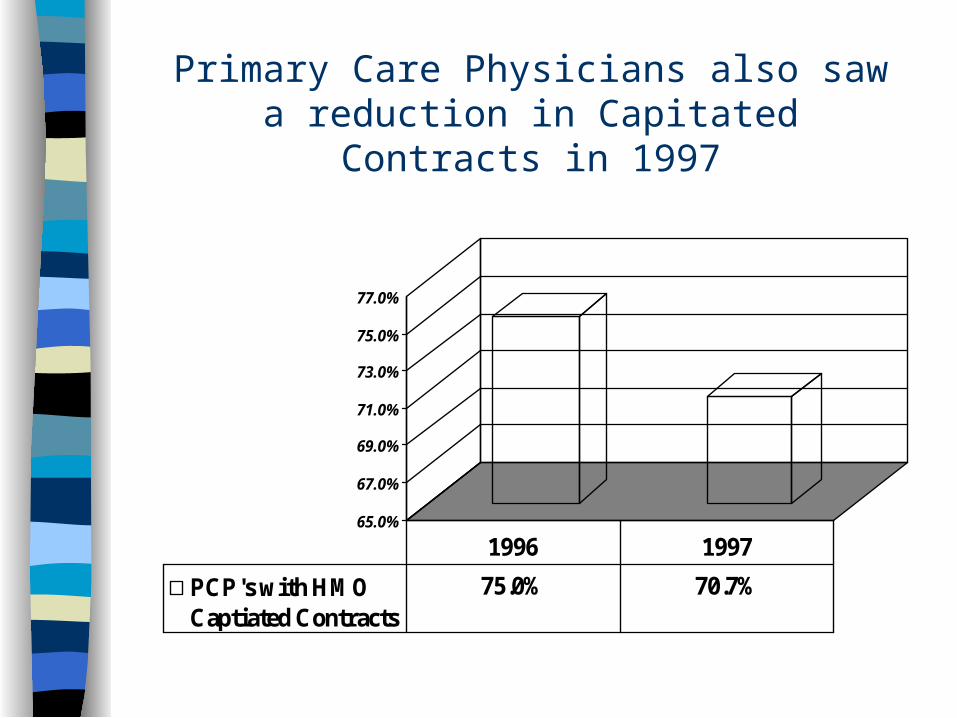
PCP's with HMOCaptiated Contracts
75.0% 70.7%
1996 1997
Primary Care Physicians also saw a reduction in Capitated Contracts in 1997

30.0%
32.0%
34.0%
36.0%
38.0%
40.0%
42.0%
HMO Plans OfferingTriple Options
33.9% 41.4%
1996 1997
Triple-Option HMO plans Jump to over 41% of all HMO plans
Note: Triple Option plans give enrollees choice of HMO, PPO or indemnity.

Important recent developments most likely to define the future
of Managed Care
Consumer Choice is returning rapidly The Cost of Health Care will Re-Accelerate

Health Care Expenditures as a Percent of GDP - New Growth Expected
(Selected Years to 2007)
5
7
9
11
13
15
17
19
1970 1980 1990 1993 1996 1998e 2001e 2007e
Sources: HCFA, Office of the Actuary; US Department of Commerce, Bureau of Economic Analysis
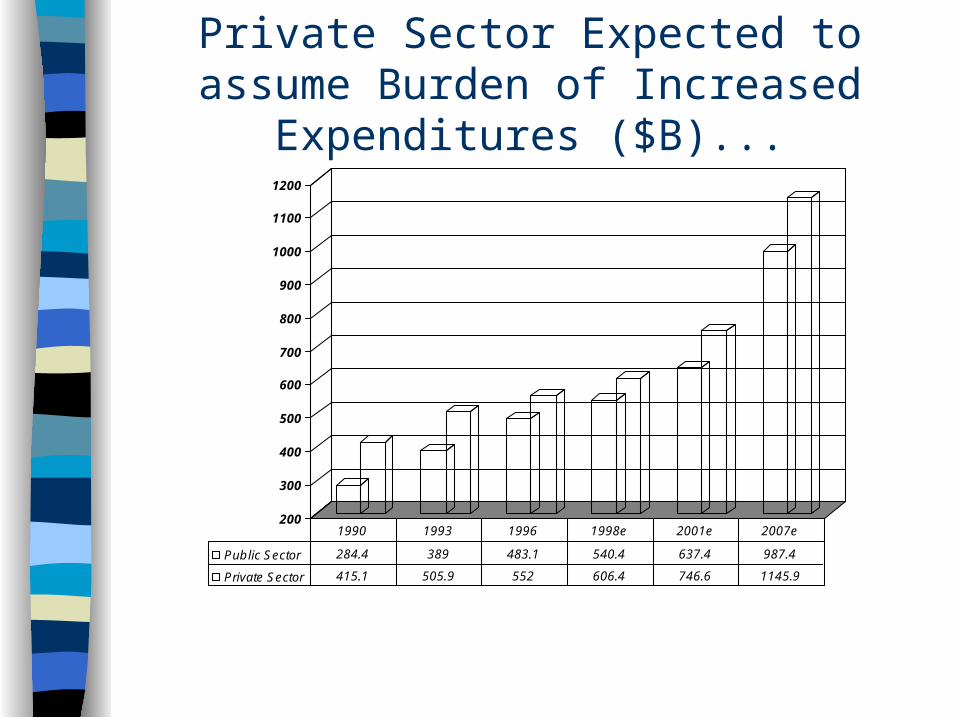
Private Sector Expected to assume Burden of Increased Expenditures ($B)...
200
300
400
500
600
700
800
900
1000
1100
1200
Public Sector 284.4 389 483.1 540.4 637.4 987.4
Private Sector 415.1 505.9 552 606.4 746.6 1145.9
1990 1993 1996 1998e 2001e 2007e
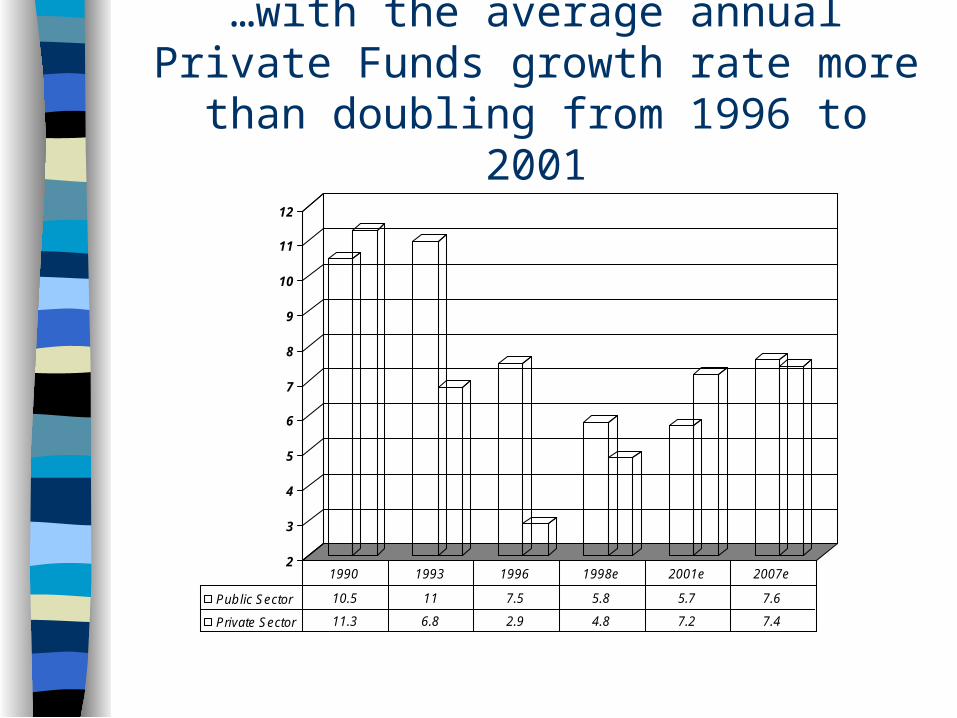
…with the average annual Private Funds growth rate more than doubling from 1996 to
2001
2
3
4
5
6
7
8
9
10
11
12
Public Sector 10.5 11 7.5 5.8 5.7 7.6
Private Sector 11.3 6.8 2.9 4.8 7.2 7.4
1990 1993 1996 1998e 2001e 2007e
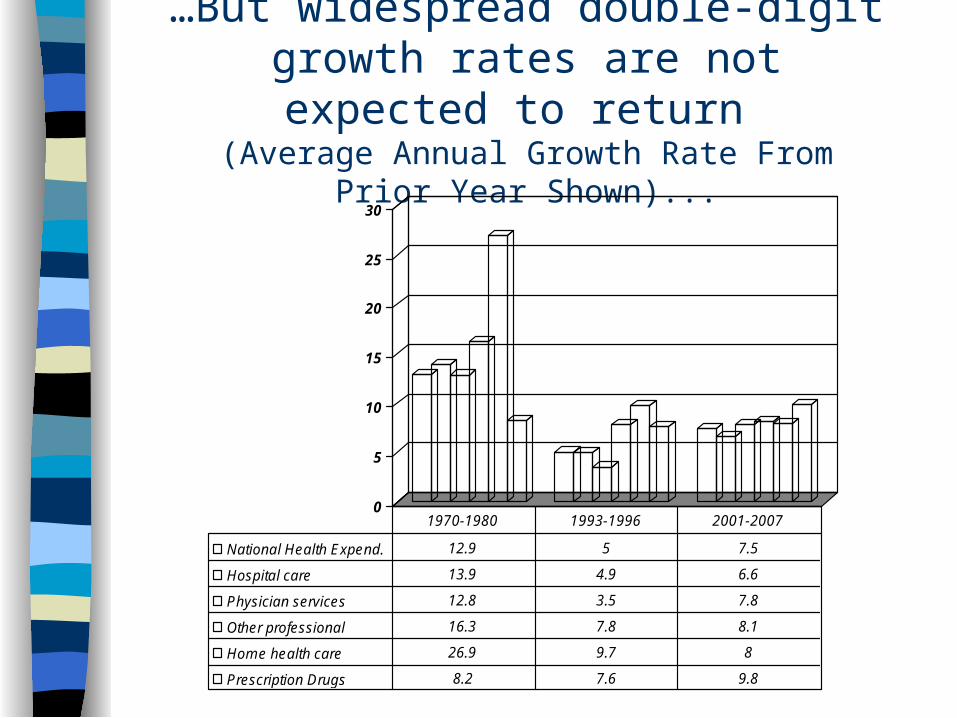
…But widespread double-digit growth rates are not expected to return
(Average Annual Growth Rate From Prior Year Shown)...
0
5
10
15
20
25
30
National Health Expend. 12.9 5 7.5
Hospital care 13.9 4.9 6.6
Physician services 12.8 3.5 7.8
Other professional 16.3 7.8 8.1
Home health care 26.9 9.7 8
Prescription Drugs 8.2 7.6 9.8
1970-1980 1993-1996 2001-2007

Two assumptions critical to these projections ...
Cost savings produced by Managed Care are “primarily one-time” and are not sustainable.
Only a small long term growth rate reduction will result from the impact of managed care on the use of higher cost medical technology.
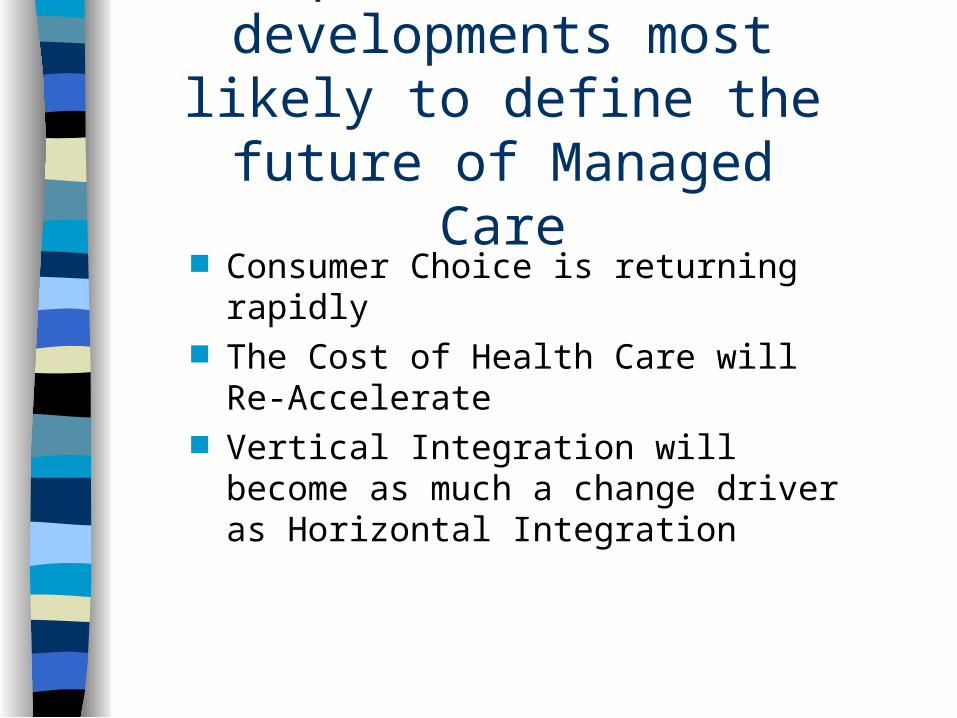
Important recent developments most likely to define the future
of Managed Care
Consumer Choice is returning rapidly The Cost of Health Care will Re-
Accelerate Vertical Integration will become as
much a change driver as Horizontal Integration
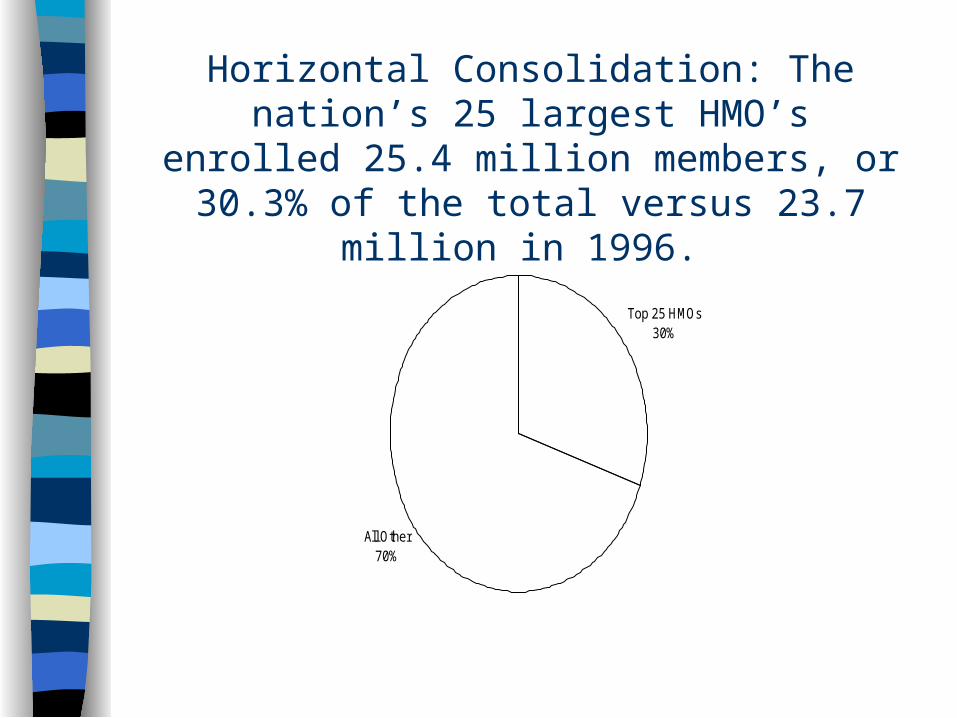
Horizontal Consolidation: The nation’s 25 largest HMO’s enrolled 25.4 million members, or 30.3%
of the total versus 23.7 million in 1996.
Top 25 HMOs30%
All Other70%
40
45
50
55
60
65
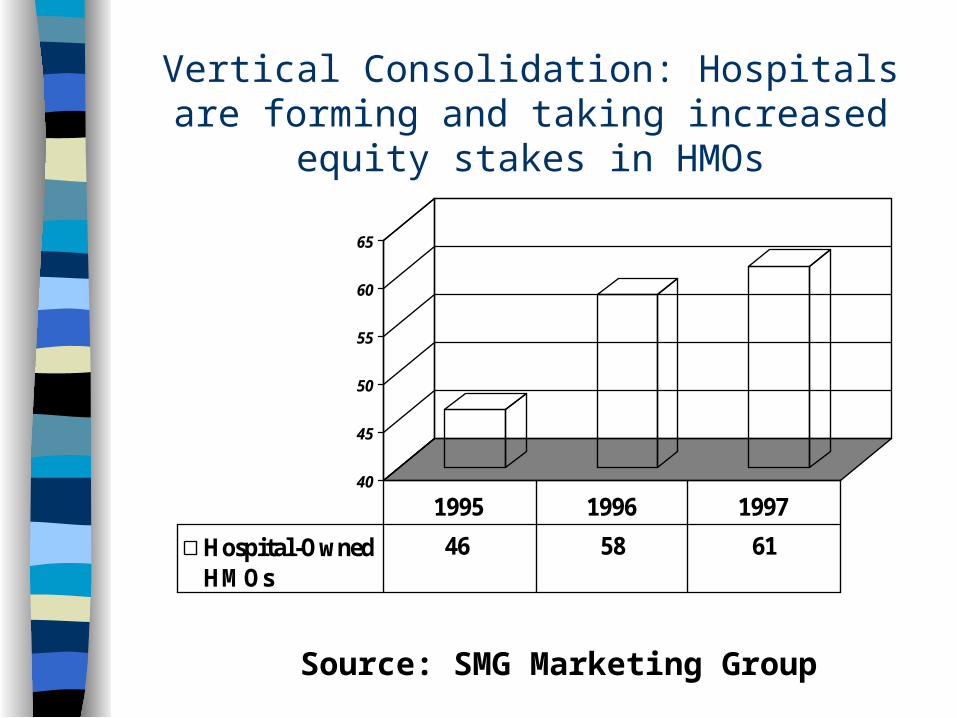
Hospital-OwnedHMOs
46 58 61
1995 1996 1997
Vertical Consolidation: Hospitals are forming and taking increased equity stakes in HMOs
Source: SMG Marketing Group
2200
2700
3200
3700
4200
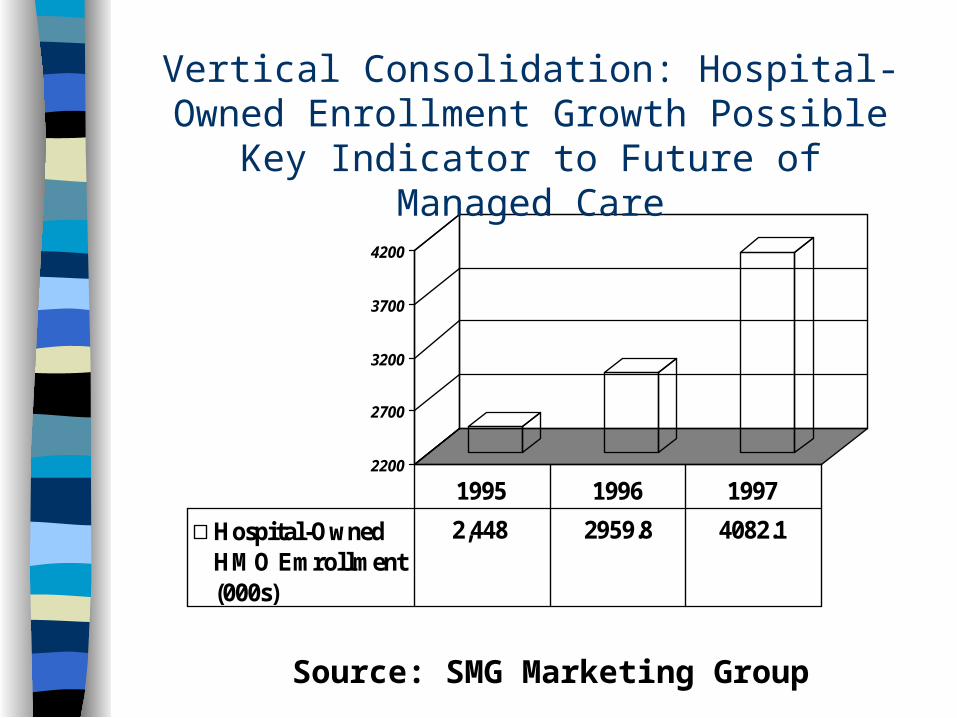
Hospital-OwnedHMO Emrollment(000s)
2,448 2959.8 4082.1
1995 1996 1997
Vertical Consolidation: Hospital-Owned Enrollment Growth Possible Key Indicator to
Future of Managed Care
Source: SMG Marketing Group
30%
40%
50%
60%
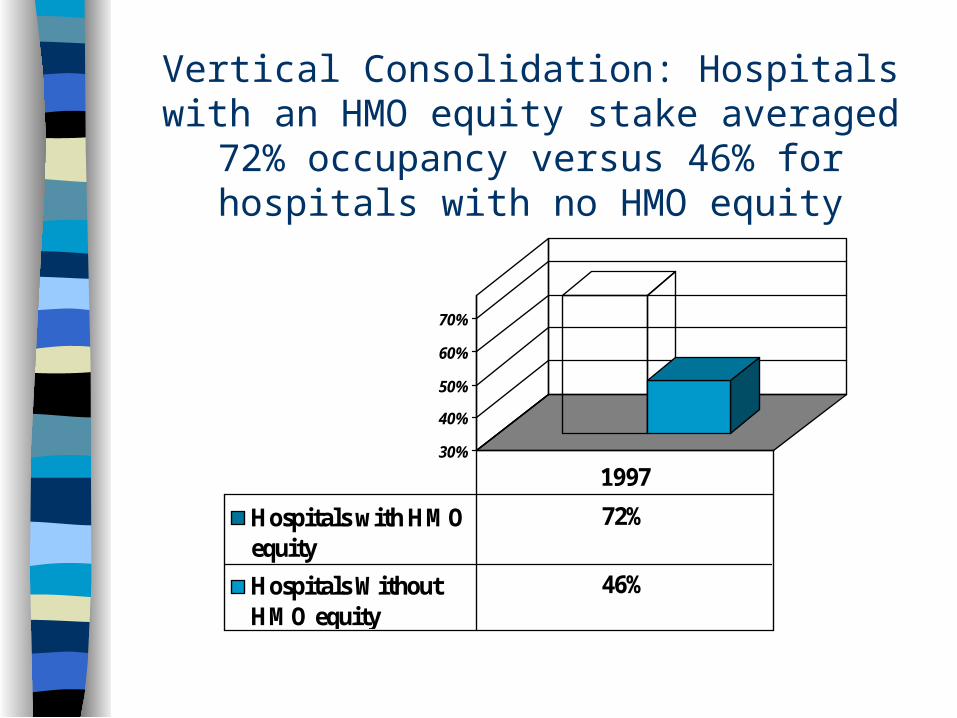
70%
Hospitals with HMOequity
72%
Hospitals WithoutHMO equity
46%
1997
Vertical Consolidation: Hospitals with an HMO equity stake averaged 72% occupancy versus 46%
for hospitals with no HMO equity
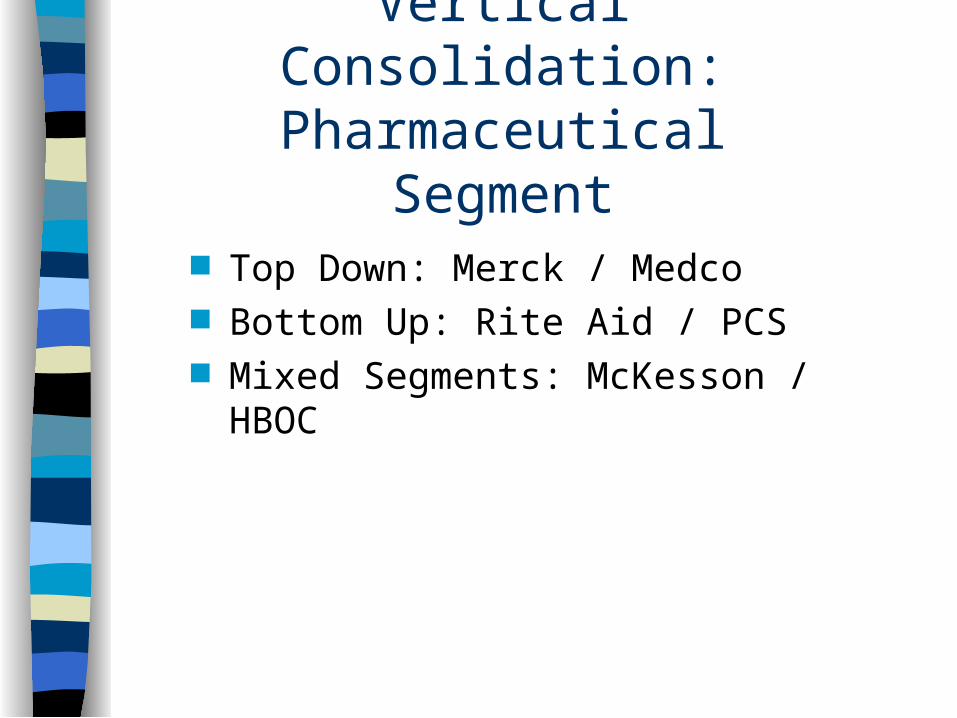
Vertical Consolidation: Pharmaceutical Segment
Top Down: Merck / Medco Bottom Up: Rite Aid / PCS Mixed Segments: McKesson / HBOC

Important recent developments most likely to define the future
of Managed Care
Consumer Choice is returning rapidly The Cost of Health Care will Re-
Accelerate Vertical Integration will become as much
a change driver as Horizontal Integration Future of Managed Care / Health Care

Phase 1:
National expansion & share consolidation
Free Market Ideal: Three Phases to Market Evolution
Source: Andersen Consulting
S eg m en t1 S eg m en t 2 S eg m en t 3
H M OC u s tom ers
Phase 2:
Market Segmentation

Phase: 3
Outcomes Based Product & Service Differentiation
Three Phases to Market Evolution:
Source: Andersen Consulting
“...universally accepted quality standards and measurement capabilities…”
Conclusion: Past Key Health Care Issues Remain Unresolved ...
Aging Baby Boomers (should drive medicare Managed Care Growth)
Uninsured & Underinsured Americans Solvency of Medicare / Medicaid Highest Health Care % of GDP High Cost of New Technology Need for highly informed patient / consumer
(“Demand Management”)
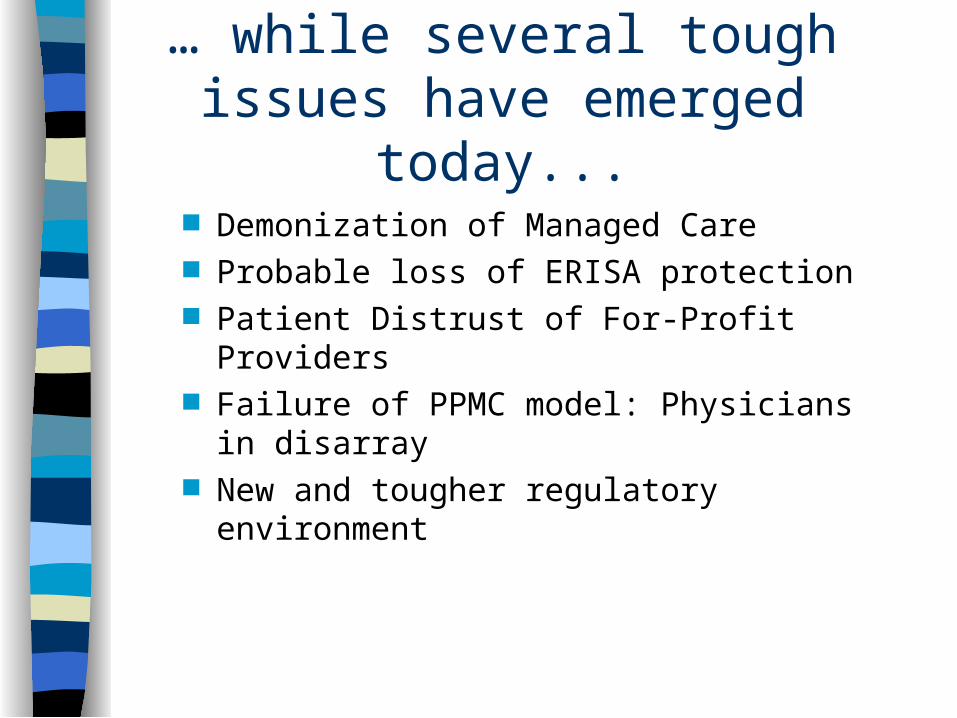
… while several tough issues have emerged today...
Demonization of Managed Care Probable loss of ERISA protection Patient Distrust of For-Profit Providers Failure of PPMC model: Physicians in
disarray New and tougher regulatory
environment

… and new important challenges appear to be on the
horizon. End of low cost malpractice and E&O
Insurance? Payer Dis-intermediation: Large
Employer Direct Contracting (e.g. John Deere)?
Impact of BBA of 1997 prospective payment system

Conclusion: Follow the MoneyTwo Possible Long Term Scenarios
Decentralized, regional payer and provider system– Can consumer bear increased cost?– Can investors achieve adequate ROI?
If not, probable alternative: centralized, single or limited payer system– Strictly tiered, government controlled– Similar to British or Canadian systems

Conclusion: Most Likely Scenario“Tiers - R - Us”
Safety Net
SecureMiddle Market
Elite
1980 1990
Safety Net
UpscaleManaged
CareVulnerable
Middle Market
Elite Elite
Low-End Managed Care
Safety Net
2000+

Q&A


![Ifrs Accounting For Insurance Ashley Patel Pricewaterhouse Coopers [Autosaved]](https://static.fdocuments.net/doc/165x107/557cfca7d8b42a89158b4e1d/ifrs-accounting-for-insurance-ashley-patel-pricewaterhouse-coopers-autosaved-55848fbbd9f33.jpg)