MALAYSIAN CONSTRUCTION RESEARCH - cidb.gov.my · Mohd. Saleh Jaafar, Prof., Dato’, Ir., Dr....
136
Transcript of MALAYSIAN CONSTRUCTION RESEARCH - cidb.gov.my · Mohd. Saleh Jaafar, Prof., Dato’, Ir., Dr....


MALAYSIAN CONSTRUCTION RESEARCH JOURNAL (MCRJ)
Volume 19 | No. 2 | 2016
The Malaysian Construction Research Journal is indexed in
Scopus Elsevier
ISSN No.: 1985 - 3807
Construction Research Institute of Malaysia (CREAM) MAKMAL KERJA RAYA MALAYSIA
1st Floor, Block E, Lot 8, Jalan Chan Sow Lin, 55200 Kuala Lumpur
MALAYSIA


i
Contents
Editorial Advisory Board iii
Editorial vi
RESERVOIR HYDROSTATIC PRESSURE EFFECT ON ROLLER COMPACTED CONCRETE (RCC) DAMSKhaled Ghaedi, Parveen. Khanzaei, Ramin Vaghei, Amir Fateh, Ahad Javanmardi, Meisam Gordan, and Usman Hanif
EXPERIMENTAL STUDY ON SEISMIC BEHAVIOR OF REPAIRED SINGLE AND DOUBLE UNIT TUNNEL FORM BUILDING UNDER IN-PLANE CYCLIC LOADINGShamilah Anudai, Nor Hayati Abdul Hamid and Mohd Hisbany Mohd Hashim
THE BEHAVIOUR OF ROCKING MULTI-COLUMN PIER OF UNSKEWED BRIDGE UNDER SEISMIC PERFORMANCE USING QUASI–STATIC LATERAL CYCLIC LOADINGMuhd Salmizi Jaafar, Nor Hayati Abdul Hamid and Norma Hazira Mahmood
DYNAMIC PROPERTIES OF ELASTOMERIC BEARING VIA FINITE ELEMENT AND EXPERIMENTAL MODAL ANALYSISAhmad Idzwan Yusuf, Norliyati Mohd Amin, Mohd Azmi Yunus and Muhamad Norhisham Abdul Rani
EFFECT OF OIL SPILL ON HYDRAULIC PROPERTIES OF SOIL Harris Ramli and Husnna Aishah Zabidi
PERFORMANCE TESTING ON RAM PUMP – AN ALTERNATIVE SUSTAINABLE WATER SUPPLY SYSTEM FOR RURAL COMMUNITIES IN MALAYSIAZuhairi Abd. Hamid, Maria Zura Mohd. Zain, Foo Chee Hung, Mohamad Fazli Halim, Wan Norhasiah Wan Bidin, Icahri Hj. Chatta and Noor Azme Omar
FLEXURAL STRENGTH PROPERTIES OF KENAF FIBRE REINFORCED PLASTIC (KFRP) COMPOSITE WITH ADDITION OF NANO CALCIUM CARBONATESNik Nurfadzlin Nik Azizan, Zakiah Ahmad, Akmalina Ab. Rahman and Adnie Baharin
1
19
29
39
49
57
75

ii
THE EFFECT OF USING GGBS AND FOAM ON THE MECHANICAL PROPERTIES OF UNFIRED COAL ASH FOAM BRICKMohamad Ezad Hafez Mohd Pahroraji, Hamidah Mohd Saman, Mohamad Nidzam Rahmat and Kartini Kamaruddin
INTERNATIONAL MARKET ENTRY LOCATIONAL FACTORS USING RASCH MODELChe Maznah Mat Isa, Hamidah Mohd Saman, Christopher Nigel Preece, Siti Rashidah Mohd Nasir and Sharifah Abdullah
The contents of the published articles do not represent the views of the Editorial Committee and Construction Research Institute of Malaysia
85
103

iii
Zuhairi Abd. Hamid, Prof. Ir., Dr.,Chief EditorConstruction Research Institute of Malaysia (CREAM)
Mustafa Alshawi, Prof., Dr. University of Salford, UK
Charles Egbu, Prof., Dr.University of Salford, UK
C. S. Poon, Prof., Dr.Hong Kong Polytechnic University, Hong Kong
George Ofori, Prof., Dr.National University of Singapore, Singapore
Vilas Nitivattananon, Dr. Asian Institute of Technology (AIT), Thailand
Abu Bakar Mohamad Diah, Datuk, Dr.Deputy Minister of Science, Technology and Innovation, Malaysia
Khairun Azizi Mohd. Azizli, Prof., Dr.Universiti Teknologi PETRONAS
Roslan Zainal Abidin, Prof., Dr.Infrastructure University Kuala Lumpur
Taksiah Abdul Majid, Prof., Dr.Universiti Sains Malaysia
Joy Jacqueline Pereira, Prof., Dr.LESTARI, Universiti Kebangsaan Malaysia
Muhd Fadhil Nuruddin, Prof., Ir., Dr.Universiti Teknologi PETRONAS
Mohd. Saleh Jaafar, Prof., Dato’, Ir., Dr.Universiti Putra Malaysia
Norwina Mohd. Nawawi, Assoc. Prof., Dr. Ar.International Islamic University Malaysia
Chan Toong Khuan, Ir., Dr.University of Melbourne, Australia
Ahmad Baharuddin Abd. Rahman, Assoc. Prof., Dr.Universiti Teknologi Malaysia
Lee Yee Loon, Prof., Dr.Universiti Tun Hussein Onn Malaysia
Mohamad Omar Bin Mohamad Khaidzir, Dr.Forest Research Institute of Malaysia (FRIM)
Kurian V. John, Prof., Dr.Universiti Teknologi PETRONAS
Paridah Tahir, Prof., Dr.Universiti Putra Malaysia
Roshana Takim, Assoc. Prof., Dr.Universiti Teknologi MARA
Ahmad Fauzi Abdul Wahab, Assoc. Prof., Dr.Universiti Teknologi Malaysia
Siti Hawa Hamzah, Prof., Ir., Dr. Universiti Teknologi MARA
Mohamad Jamil Sulaiman, Ir., Dr.SIRIM Berhad
Megat Azmi Megat Johari, Assoc. Prof., Dr.Universiti Sains Malaysia
Kamaluddin Abdul Rashid, Mr.Jabatan Kerja Raya Malaysia
Md. Abdul Mannan, Prof., Dr.Universiti Malaysia Sarawak
Mahmood Md Tahir, Prof., Ir., Dr.Universiti Teknologi Malaysia
Nasir Shafiq, Prof., Dr.Universiti Teknologi PETRONAS
Editorial Advisory BoardNoraini Bahri, Ir.Construction Industry Development Board (CIDB) Malaysia
Badorul Hisham Abu Bakar, Prof., Dr.Universiti Sains Malaysia
Zulkifli Mohamed Udin, Assoc. Prof., Dr.Universiti Utara Malaysia
Abdul Rashid Abdul Aziz, Prof., Sr, Dr.Universiti Sains Malaysia
Sobri Harun, Assoc. Prof., Dr.Universiti Teknologi Malaysia
Aziz Saim, Assoc. Prof., Dr.Universiti Teknologi Malaysia
Hamimah Adnan, Assoc. Prof., Datin, Sr, Dr. Universiti Teknologi MARA
Abdul Karim Mirasa, Prof., Ir., Dr.Universiti Malaysia Sabah
Wan Hamidon Wan Badaruzzaman, Prof., Ir., Dr.Universiti Kebangsaan Malaysia
Hamidah Mohd. Saman, Assoc. Prof., Dr. Universiti Teknologi MARA
Zainal Arifin Ahmad, Prof., Dr. Universiti Sains Malaysia
Azmi Ibrahim, Prof., Dr.Universiti Teknologi MARA
Mahyuddin Ramli, Prof., Dato’, Ir., Dr.Universiti Sains Malaysia
Hajah Faridah Hj. Ismail, Assoc. Prof., Sr, Dr.Universiti Teknologi MARA

iv
Mohd. Shahir Liew, Assoc. Prof., Ir., Dr.Universiti Teknologi PETRONAS
Low Kaw Sai, Assoc. Prof., Ir., Dr.The Institution of Engineers Malaysia
Narayanan Sambu Potty, Prof., Dr.Mohandas College of Engineering and Technology, India
Padzil Fadzil Hassan, Assoc. Prof., Dr.Universiti Teknologi MARA
Maria Zura Mohd. Zain, Ms. Construction Research Institute of Malaysia (CREAM)
Sugiura, Kunitomo, Dr. Kyoto University, Japan
Itaru Nishizaki, Dr. Public Works Research Institute (PWRI), Japan
Low Sui Pheng, Prof., Dr. National University of Singapore, Singapore
Zhangping You, Prof., Dr. Michigan Technological University, USA
Norhayati Abdul Hamid, Assoc. Prof., Dr.Universiti Teknologi MARA
Ahmad Hazim Abdul Rahim, Mr. Construction Research Institute of Malaysia (CREAM)
Mazlin Mokhtar, Prof., Dr.LESTARI, Universiti Kebangsaan Malaysia
Hassan bin Basri, Prof. Dato’ Ir. Dr.Universiti Kebangsaan Malaysia
Khairuddin Abdul Rashid, Prof. Sr. Dr.International Islamic University Malaysia
Foo Chee Hung, Dr.Construction Research Institute of Malaysia (CREAM)
Dongping Fang, Prof. Dr.Tsinghua University, China
Ibnu Syabri, Prof.Institut Teknologi Bandung, Indonesia
Francis K.W. Wong, Prof.Hong Kong Polytechnic University, Hong Kong
Kobayashi Kiyoshi, Prof. Dr.Kyoto University, Japan
Guest Editor:
Mastura Azmi, Dr.Universiti Sains Malaysia
Ahmad Safuan A. Rashid, Dr.Universiti Teknologi Malaysia
Ahmad Zahirani Ahmad Azhar, Dr.International Islamic University Malaysia
Sulaiman Abdulkareem, Dr.University of Ilorin, Nigeria
Belina Xavier, Dr.Stella Maris College, India
Mohd Hasmizam Razali, Mr. University Malaysia Terengganu
Rosaura Palma-Orozco, Dr.Instituto Politécnico Nacional, Mexico
Clotilda Petrus, Dr.Universiti Teknologi MARA
Fadzil Arshad, Dr.Universiti Teknologi MARA
Ahmad Ruslan Mohd Ridzuan, Assoc. Prof., Dr.Universiti Teknologi MARA
Kay Dora Abd Ghani, Dr.Universiti Teknologi MARA
Abdul Rahman Mohd Sam, Assoc. Prof., Dr.Universiti Teknologi Malaysia
T C Manjunath, Dr.Visvesvaraya Technological University, India
Secretariat:
Tengku Mohd Hafizi Raja Ahmad, Mr.Construction Research Institute of Malaysia (CREAM)
Nurulhuda Mat Kilau, Ms.Construction Research Institute of Malaysia (CREAM)

v
Editorial
Welcome from the Editors
Welcome to the nineteenth (19th) issue of Malaysian Construction Research Journal (MCRJ). In this issue, we are pleased to include nine papers that cover wide range of research area in construction industry. The editorial team would like to express our sincere gratitude to all contributing authors and reviewers for their contributions, continuous support and comments.
In this issue:
Khaled Ghaedi, et. al., investigate the effect of reservoir hydrostatic pressure on Kinta RCC dam in Malaysia which is constructed in 2002, and subsequently evaluate damages and crack propagation. The finite element model (FEM) of the RCC dam is made and bidirectional time history accelerations are applied to the RCC dam with and without considering the hydrostatic pressure effect. The obtained results show that, the hydrostatic pressure increases stress (25%) and change the displacement response of the dam from negative to positive direction. In addition to these, hydrostatic pressure causes damage at heel elements.
Shamilah Anudai, et. al., compare the seismic performance of repaired single and double unit three-storey tunnel form buildings (TFB) in the laboratory. Both specimens were tested starting from ±0.01%, ±0.1%, ±0.25%, ±0.5%, ±0.75%, ±1.0% and ±1.25% drifts until severe damage was observed. The damage single unit TFB was repaired and strengthened using CFRP, steel angle, and steel plate; while the damage double unit TFB was repaired and retrofitted using additional shear wall, steel angle and CFRP. Results show that the lateral strength capacity, stiffness, and ductility of the repaired double unit TFB increases by 54%, 4%, and 2%, respectively, as compared to the repaired single unit TFB, which concluded that the proposed repaired and retrofitted technique and material can be used for damaged tunnel form buildings after the moderate or strong earthquakes.
In order to provide information on how the seismic damages the structure and non-structure, as well as the behaviour of rocking multi-column pier under seismic performance, Muhd Salmizi Jaafar, et. al. establish the semi integral bridge sample with the scale of 1:3 and a post-tensioning on the column was applied. The performance of the multi-column pier was then determined from the maximum load, maximum displacement and the hysteresis loop of the sample when charging and dissipating the energy. Finally, the characteristics of the multi-column pier were obtained based on the ductility and the relationship of specimen stress-strain.
Ahmad Idzwan Yusuf, et. al., determine the dynamic properties of elastomeric bearing in terms of natural frequencies, mode shapes, and damping via finite element
vi
modal analysis and experimental modal analysis. A good agreement was observed between the finite element and the experimental modal analysis results. The study proves that modal analysis is able to enhance the understanding of the dynamic properties of elastomeric bearing and thus, improving the design of elastomeric bearing.
Harris Ramli and Husnna Aishah Zabidi present the soil hydraulic properties of oil-contaminated and uncontaminated soil. They found that the inclusion of diesel had an adverse impact on the geotechnical characteristics of the soil sample, which leads to the conclusion that proper precautions and soil evaluation are required when working with oil-contaminated soil to achieve the design requirement for the related construction project, as changes in physical properties can affect the mechanical properties of soil.
Zuhairi Abd. Hamid, et. al., presents the performance test results of ram pump system, which was to be applied in Kampung Sungai Dua Olak, an indigenous people settlement situated in Bentong, Malaysia, for the establishment of a sustainable rural water supply system that is aimed to be replicated across other rural communities in the tropical region. It was found that ram pump could perform under different variations of water sources parameter. At the laboratory scale, it was confirmed that ram pump had its potential to provide an alternative means of water supply delivery system though not as efficient as conventional supply.
In a study to investigate the possibility of enhancing the kenaf fibre reinforced plastic (KFRP) composites by modifying the resin with the addition of different percentages of calcium carbonate (CaCO3) nanoparticles (0%, 2%, 5%, 7% and 10%), Nik Nurfadzlin Nik Azizan, et. al., found that the flexural properties were the highest when 7% of nano CaCO3 was added. The flexural strength for untreated KFRP has the highest value at 2% of nano CaCO3, and at 7% for the treated KFRP composite. Meanwhile the Modulus of Elasticity (MOE) for both treated and untreated KFRC are the highest when added with 7% nano CaCO3 and there was no much different in the MOE values.
Mohamad Ezad Hafez Mohd Pahroraji, et. al., suggest the use of combined fly ash and bottom ash as main raw material with the incorporation of Hydrated Lime-activated GGBS (HL-GGBS) as binder and foam in developing the unfired coal ash foamed foam brick. They found that brick specimens incorporating HL-GGBS system with or without foam have achieved better value when compared to the traditional clay and sand brick. However, PC-GGBS system shows higher value when compared to the HL-GGBS system.
Through questionnaire survey, Che Maznah Mat Isa, et. al., determine the significant locational factors influencing the entry location (EL) decision of Malaysian construction firms when embracing the international markets. The found that the

vii
significant country factors were related to the host and home government’s attitude and support, while the significant market factors were related to market potential and demand. In addition, the significant firm factors entail firm’s tangible and intangible resources, while the significant project factors constitute project fund, experience and contract types adopted.
Editorial Committee


1Malaysian Construction Research Journal; Vol. 19 | No.2 | 2016
RESERVOIR HYDROSTATIC PRESSURE EFFECT ON ROLLER COMPACTED CONCRETE (RCC) DAMS Khaled Ghaedi1, Parveen. Khanzaei2, Ramin Vaghei3, Amir Fateh3, Ahad Javanmardi1, Meisam Gordan1, Usman Hanif 1
1Department of Civil Engineering, Universiti Malaya (UM), 50603, Malaysia2Institute for Infrastructure Engineering, University of Western Sydney, Australia3Department of Civil Engineering, Universiti Putra Malaysia, 43400, Malaysia
AbstractThe number of Roller Compacted Concrete (RCC) dams has increased substantially during the last two decades primarily due to the advantages of RCC. The main challenging issue in the design of RCC dams is evaluating the RCC dams’ response during earthquake excitations. One of the effective factors in seismic response of RCC dams is hydrostatic pressure due to reservoir water. Therefore, in this paper, an attempt is made to investigate the effect of reservoir hydrostatic pressure on RCC dams and subsequently evaluate damages and crack propagation. For this purpose, Kinta RCC dam in Malaysia constructed in 2002 is considered as an appropriate case study. Seismic analysis is conducted by applying earthquake accelerations. For this purpose, the finite element model (FEM) of the RCC dam is made and a bidirectional time history accelerations are applied to the RCC dam with and without considering the hydrostatic pressure effect. The obtained results show that, the hydrostatic pressure increases stress (25%) and changes the displacement response of the dam from negative to positive direction. In addition to these, hydrostatic pressure causes damage at heel elements.
Keywords: Nonlinear time history analysis, Roller Compacted Concrete (RCC) dam, Hydrostatic Pressure, Crack Pattern, Earthquake.
INTRODUCTION
Use of RCC technology in dams’ construction was started in early 2002. Utilizing this technology has prepared some benefits for dam engineers such as construction speed, manpower, equipment and cost. As a result, due to different construction procedure of such dams compared to other types of dams like gravity and arch dams, there should consider the RCC dam-reservoir interaction, effect of reservoir length, boundary conditions, etc. however such consideration were not either done or thoroughly deliberated. As mentioned above, various models of RCC dams including dam-reservoir interaction, dam-foundation interaction, and dam-reservoir-foundation interaction can be made. Many works regarding dams’ analysis has been done by several researchers. For instant, Fenves and Chopra (1985) presented a simplified procedure to analyse the response of fundamental vibration mode of gravity dams for two main cases including dam-full reservoir interaction supported with rigid foundation and dam-empty reservoir interaction supported by flexible foundation. Analysis of concrete gravity dams using fracture mechanics to investigate the crack propagation has also been carried out (Guanglun et al. 2000; Ayari 1990; Linsbauer 1990; Chuhan et al. 2002). Zhang et al. (2001) used a rigid body-spring element technique to assess the stability of dam foundations or slopes in both static and dynamic conditions. Examples showed the appropriate safety factor which was agree well with theoretic solutions. The approach also made it possible to examine most possible sliding mass. Temperature distribution was simulated by means of 3D Finite Element (FE) relocating mesh method (TDFERMM) used for the third grader RCC (TGRCC) dams (Xie & Chen 2005). In this relation, different thickness and material was conducted for impervious dam layer including grader enrich

2 Khaled Ghaedi, et. al.
concrete (GEVRCC), conventional concrete (CC) and second grader RCC (SGRCC). The computed results showed that the various forms of impervious dam layer had no effect on the distribution of temperature in dam body. Nevertheless, the thickness of impervious dam layer had greatly affected in temperature distribution of the dam, and a decision made that the mid thickness from 3-5 meter of SGRCC impervious dam layer could meet the temperature control demand for TGRCC dam. A study (Zhu & Pekau 2007) employed the Finite Element Model (FEM) and adopted the incremental displacement constraint equations (IDCE) model to dealt with all modes of motions along the crack propagations. Equivalent damping was introduced according to the coefficient concept of restitution which was utilized in clash of point masses. Later on the IDCE model was evaluated in dynamic conditions for flexible and rigid bodies. Computations revealed very interesting results such as happening of jumping and rocking. Moreover, the investigation of the dam-sediment interaction effect on dam analysis were studied for concrete gravity dams (Akköse & Şimşek 2010) and RCC dams (Huda et al. 2010). The seismic stability for a cracked concrete gravity dam was evaluated by Jiang (Jiang & Du 2012). On that study, large deformation and geometric nonlinearity of the Koyna dam model were considered. To study about crack propagation, the Concrete Plastic Damage (CPD) model pursuant to the nonlinear FEM was implemented. The obtained results showed that the dam stability with two sorts of the penetrated cracks was able to be guaranteed in a motion through the Koyna earthquake magnitude. Paggi et al. (2013) studied the crack development in the body of concrete gravity dams as a problem by means of a multi-scale method. A numerical arrangement in accordance with extended finite element method (XFEM) was offered to dealt with numerical estimation of crack development in gravity dams (Zhang et al. 2013). The algorithm validity was discussed by analogy of obtained results from the suggested XFEM with given results in the literature. In addition to these, researches were made from experimental point of view for large concrete gravity dams (Proulx & Paultre 1997; Tarinejad et al. 2014; Jin et al. 2005; Mridha & Maity 2014). The experimental investigations of those researches were verified and examined with numerical analysis using different codes, software and methods. A first order approximate probabilistic analytical method to explore the level of the damage in concrete gravity dams (Xu et al. 2015) was presented. The method constructed stochastic stiffness under aleatory stimulus by means of second order perturbation. Eventually, a numerical instance was given to analyse the convergence and validate the stability of that model. The acquired results showed that the expectable values of the possibility distribution of the aleatory structure under an aleatory stimulus were stable under a second order perturbation.
Through above generic literature review it can be found that, a few investigations in conjunction with RCC dams’ behaviour considering reservoir hydrostatic effect have been done under earthquake motions. In present paper, non-linear behaviour analysis of RCC dams subjected to earthquake excitations with consideration of hydrostatic effects is studied. In order to predict crack propagation of dam body the Concrete Damaged Plasticity (CDP) model is adopted. For this purpose, Kinta RCC dam in Malaysia is selected as a case study.
EFFECT OF EARTHQUAKE AND HYDROSTATIC PRESSURE ON DAMS
In the general, view for dam materials and normal soil layers, the resistance of dynamic shearing is approximately that of static shearing or somewhat greater (Newmark, 1965: Chang et al. 1984). Thus, the normal safety factor is considered as big value to prevent damage in the dam under intensive excitations. However, when normal soil layers experience the ground

3Reservoir Hydrostatic Pressure Effect on Roller Compacted Concrete (RCC) Dams
motions, partial or approximately all the shearing resistance is lost. This may happen either due to the increase of hydrostatic pressure or loss of the shearing strength under earthquake motions which leads to dam sliding. In other words, under seismic loading the main failures may occur due to i) the increase of hydrostatic pressure of the soil under dam foundation, and ii) hydrostatic pressure of the reservoir water which is stored in the upstream side of the dam. Therefore, the reservoir hydrostatic pressure is effective on the behaviour of RCC dam during earthquake vibration and this effect on seismic evaluation of RCC dam must be considered.
CASE STUDY
In this study, Kinta RCC dam built in early 2002 is considered to be a case study for considering the effect of reservoir hydrostatic pressure on the dam body. The structural geometry of the deepest section of Kinta RCC dam is shown in Figure1 (Huda et al. 2010).
Figure 1. Geometry of the Kinta RCC dam
As depicted in Figure 1, the dam includes three sections containing dam body, Conventional Vibrated Concrete (CVC) upstream and downstream facing and CVC foundation.
FINITE ELEMENT DISCRETIZATION
To study about seismic analysis of the dam, the geometry model of the considered dam is improved by means of the Finite Element Modelling Software, ABAQUS. To discretize Kinta RCC dam, two dimensional isoparametric elements is adopted. To model the main section of the dam body and CVCs, the finite element discretization with four nodes bilinear plane stress quadrilateral, reduced integration and hourglass control is implemented. The discretization details of the dam body and CVCs are given in Table 1.
4 Khaled Ghaedi, et. al.
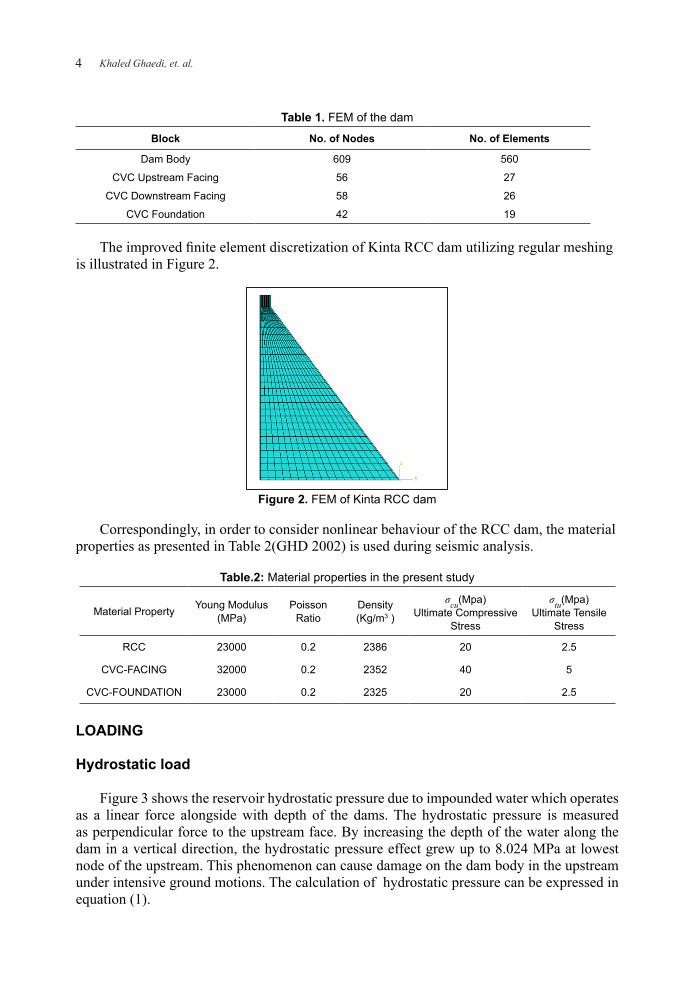
Table 1. FEM of the dam
Block No. of Nodes No. of Elements
Dam Body 609 560
CVC Upstream Facing 56 27
CVC Downstream Facing 58 26
CVC Foundation 42 19
The improved finite element discretization of Kinta RCC dam utilizing regular meshing is illustrated in Figure 2.
Figure 2. FEM of Kinta RCC dam
Correspondingly, in order to consider nonlinear behaviour of the RCC dam, the material properties as presented in Table 2(GHD 2002) is used during seismic analysis.
Table.2: Material properties in the present study
Material Property Young Modulus (MPa)
Poisson Ratio
Density (Kg/m3 )
σcu(Mpa) Ultimate Compressive
Stress
σtu(Mpa)Ultimate Tensile
Stress
RCC 23000 0.2 2386 20 2.5
CVC-FACING 32000 0.2 2352 40 5
CVC-FOUNDATION 23000 0.2 2325 20 2.5
LOADING
Hydrostatic load
Figure 3 shows the reservoir hydrostatic pressure due to impounded water which operates as a linear force alongside with depth of the dams. The hydrostatic pressure is measured as perpendicular force to the upstream face. By increasing the depth of the water along the dam in a vertical direction, the hydrostatic pressure effect grew up to 8.024 MPa at lowest node of the upstream. This phenomenon can cause damage on the dam body in the upstream under intensive ground motions. The calculation of hydrostatic pressure can be expressed in equation (1).

5Reservoir Hydrostatic Pressure Effect on Roller Compacted Concrete (RCC) Dams
p=ρgh (1)
In which, p is the hydrostatic pressure of the water imposed to the dam, ρ is the water density which is considered in this study to be 1000 kg/m3, g is the gravitational acceleration which is 9.81 m/s2 and h is the height of the stored water at the upstream side of the dam which is 81.8 m in this paper. By computation of Equation (1) using above aforementioned values, gives the hydrostatic pressure to be 8.02458 MPa.
Figure 3. Hydrostatic pressure effect on Kinta RCC dam
Seismic loading
In present study, Koyna earthquake accelerations records as indicated in Figure 4 are applied to the model. These horizontal and vertical components of Koyna acceleration are assumed to be imposed on base level of the dam.
Figure 4. Components of Koyna excitations

6 Khaled Ghaedi, et. al.
RESULTS AND DISCUSION
The topmost and the lowest nodes of the dam model at the upstream face are considered to evaluate the relative acceleration and relative displacement for RCC Kinta dam as shown in Figure 5.
Acceleration response
The variation of the nodal horizontal and vertical acceleration along the height of upstream face of the RCC dam with consideration of hydrostatic effect is shown in Figure 6. The maximum values of 3.84 g and 2.04 g, for horizontal and vertical direction can be seen, respectively. As this figure shown, both variations of the horizontal and vertical acceleration are increased relative to the height of the dam along the upstream side.
Figure 5. The location of the topmost and lowest node of the dam at the upstream side
The values of the relative horizontal and vertical acceleration of the topmost node are slightly different with 4 g and 2.02 g respectively as indicated in Figure 7. Moreover, Figure 8 shows the relative acceleration of the topmost node at the crest and the lowest node in heel zone in the upstream face in horizontal direction. In these comparisons, the horizontal accelerations are greater than the vertical accelerations significantly as they are obvious in Figure 8 and Figure 6 as well. Also, the acceleration of the topmost node at crest is noticeably greater than the lowest node at heel region in the upstream face.

7Reservoir Hydrostatic Pressure Effect on Roller Compacted Concrete (RCC) Dams
Figure 6. Peak absolute horizontal and vertical acceleration of the RCC dam along the upstream face
Figure 7. The relative peak horizontal and vertical acceleration of the crest node at the upstream face of the RCC dam
Figure 8. Horizontal acceleration of the crest node and heel node at upstream face
From Figure 9, it can be seen that the relative acceleration response of the dam crest considering hydrostatic pressure effect is not noticeable compared to when there is no effect of hydrostatic pressure. However, hydrostatic pressure effect increases the acceleration response of the crest from 38.38 m/s2 to 39.27 m/s2 in positive direction.

8 Khaled Ghaedi, et. al.
Figure 9. Relative acceleration of dam crest
Displacement response
The variations of the maximum displacement of the dam body in horizontal and vertical directions due to earthquake excitations without and with hydrostatic pressure are depicted in Figures 10 and 11 respectively.
From Figure 10, it can be observed that the peak displacements happened at the base regions of the dam in both directions without considering the hydrostatic effect. But, while the effect of hydrostatic pressure is taken into account, the peak absolute displacements in the horizontal and vertical directions occurred at the crest and middle area of the downstream respectively. The deformation contours of the dam body in two directions with deliberation of the hydrostatic pressure effect are shown in Figure 11. As clearly shown in the contours, by considering reservoir hydrostatic pressure, the crest of the dam experienced the maximum displacement in the horizontal direction. Therefore by comparing the displacements in the horizontal direction for both cases (without and with reservoir effect), it can be understood that the peak horizontal deformation of the dam body increases from 76.5 mm to 86.6 mm by approximately 13% increasing and peak deformation zones is changed from the base to crest zone. In particular, when the reservoir water is shocked by seismic load, this influence is more observable on the dam deformation during analysis.
Figure 10. Peak displacement (m) in dam body without hydrostatic pressure

9Reservoir Hydrostatic Pressure Effect on Roller Compacted Concrete (RCC) Dams
Figure 11. Peak displacement (m) in dam body with hydrostatic pressure
Furthermore, the horizontal time history displacement of the topmost node and lowest node of the upstream face is plotted in Figure 12 with and without hydrostatic force effect. Therefore, the relative horizontal displacement of the Kinta RCC dam subjected to seismic load can be plotted in Figure 13.
Figure 12. Time history horizontal displacement in dam at upstream face
As it is shown in Figure 13, the maximum horizontal relative displacement of the dam crest with hydrostatic effect is 23.24 mm which happens at 4.02 second, whereas, in case of lack of hydrostatic effect, this amount is 24.25 mm in negative direction which occurs at 2.91 second. It can clearly be mentioned that the hydrostatic pressure effect on the dam is signifi-

10 Khaled Ghaedi, et. al.
cant because this effect varies the crest displacement from the negative to positive side.
Figure 13. Relative horizontal displacement of the dam during earthquake excitations
Stress
The variation of the maximum principal stress of the topmost and the lowest element with and without hydrostatic pressure effect is depicted in Figure 14. As it is illustrated in the graph, there is no more stress at the crest element in upstream face in the initial time of applying the earthquake load and by increasing the earthquake acceleration the amount of principal stress increases to peak values of 0.16 MPa for dam without hydrostatic pressure and to about 0.2 MPa for dam with hydrostatic pressure. Therefore hydrostatic pressure causes increasing of 25%of principal stress in crest node. Also similarly, there is no stress at the heel of upstream face for dam without hydrostatic pressure but, when the hydrostatic pressure is considered, the peak principal stress is perceived in the beginning of imposing load and this amount is reduced during earthquake excitation due to the occurrence of the main stresses in other zones.
Figure 14. Time history of the maximum principal stress of the RCC dam at the upstream face

11Reservoir Hydrostatic Pressure Effect on Roller Compacted Concrete (RCC) Dams
(a) Maximum principal stress (b) Minimum principal stress
Figure 15. Principal stresses in the Kinta RCC dam without hydrostatic effect
(a) Maximum principal stress (b) Minimum principal stress
Figure 16. Principal stresses in the Kinta RCC dam with hydrostatic effect
Figures 15 and 16 show the minimum and maximum principal stress counters in Kinta RCC dam body without and with consideration of reservoir hydrostatic effect when dam is subjected to the earthquake excitations. As shown in these plots the maximum principal stress at the crest with hydrostatic effect occurs with value of 0.195 MPa. However, the maximum principal stress at the lowest element of the dam in the heel region is larger than the stress in the dam crest element with value of 2.38MPa. Comparison of the stress value at the dam crest with the heel region indicates that the bottom areas of the dam are exposed to larger stresses in compare to the crest regions. Therefore, the dam may suffer damage at the heel region prior to the crest.
As mentioned, the peak principal stress occurs at base level of the dam body which causes sliding due to the hydrostatic pressure, whereas, the minimum principal stress happens at the downstream sides as illustrated in Figure 15.

12 Khaled Ghaedi, et. al.
Seismic damage of the dam
The evaluation of damage level and assessment of seismic performance of the dam is made using Concrete Damaged Plasticity (CDP) model. The tensile damage of the dam models with and without hydrostatic effect is shown in Figure 17. As it can be seen in Figure 17(a), for dam without hydrostatic pressure the onset of crack pattern is formed in the downstream side which is not consider as destructive damage due to the location of crack occurrence.
However, with consideration of hydrostatic pressure effect on the dam, cracks launches from the lowest location of the upstream face in the heel zone as shown in Figure 17(b) due to the existence of the hydrostatic pressure along the RCC dam height. This generates tensile stresses at the heel zone of the dam body. Besides, when the crack is initiated, it propagates in the horizontal direction toward the downstream side. Although, some attempts are seen in the middle zone of the upstream face of the dam.
The crack propagation in the lowest element in the left most region of the heel at upstream face of the dam during earthquake excitation is plotted in Figure 18 considering hydrostatic pressure effect. As indicated in this figure, there is no damage in the mentioned region up to time 0.137 and by increasing the effect of hydrostatic pressure and intensity of the earthquake motions, the first element of heel zone in the upstream face goes to absorb damage. Therefore, the first tensile damage takes place at time 0.137 second at the lowest element of the dam in the leftmost area of the heel part. This absorption of damage continues to time 2.61 second when the element fully fails. The variations of the damage in the first element of the heel in the upstream side between these two times are clearly illustrated in Figure 18 too.
(a) Without hydrostatic effect (b) With hydrostatic effect
Figure 17. Tensile damage at the end of analysis

13Reservoir Hydrostatic Pressure Effect on Roller Compacted Concrete (RCC) Dams
Figure18: Damage mechanism of the lowest element in the leftmost region of the heel at upstream face at time 0.137 sec
Figure 19 displays the tensile damage process which takes place in relation to cracking pattern progress and failure mechanism of the Kinta RCC dam considering hydrostatic pressure. Different selected times, 0.137, 2.43, 2.61 and 4.03 seconds are considered to evaluate the damage in the dam under seismic loading .From this figure, it can be revealed that the crack propagations at the base level of the RCC dam starts from the lowest element at the upstream face toward the downstream side, by standingat the same level. These cracks can be the consequence of the existance of the tensile stresses or maximum principal stresses at the relatedzone. The cracks are generated due to the hydrostatic pressure.The crack opening from the upstream face allows the water to penetrate inside the dam body and leads failure of the dam.
Also, the selected times are considered to demonstrate the shape deformation of the dam during earthquake loadingas as indicated in Figure 20. This figure illustrates the damage formation along with deformationof the RCC dam for nonlinear analysis under seismic excitations considering hydrostatic pressure effect.

14 Khaled Ghaedi, et. al.
(a) Initial crack formation t = 0.137 sect
(b) Extension of crackt = 2.43 sec
(c) Extension of crack to more number of elements in base
t = 2.61 sec
(d) Extensive crack in baset = 4.03 sec
Figure 19. Tensile damage of the Kinta RCC dam at different time of seismic load by consider of reservoir hydrostatic pressure
(a): T = 2.43 sec (b):T = 2.61 sec (c):T = 5.73 sec (d): T = 10 sec
Figure 20. Deformation of the dam body and formation of crack during earthquake excitations with hydrostatic effect

15Reservoir Hydrostatic Pressure Effect on Roller Compacted Concrete (RCC) Dams
The damage contours of the RCC dam body consist of Tensile damage, Stiffness Degradation(SDEG), Compressive Equivalent Plastic Strain (PEEQ) and Plastic Strain Magnitude (PEMAG) are shown in Figure 21 for time of 6.7 second. The stiffness degradation (SDEG) indicates the effect of the stiffness recovery during seismic loading with consideration of the hydrostatic pressure of the reservoir water. The sequence of yielding of the concrete material and failure is associated with PEEQ and PEMAG on the dam subjected to the reservoir hydrostatic pressure and erathquake. The related contours are presented in Figure 21(c) and Figure 21(d) respectively.
(a): Tensile damage (b):Stiffness degradation
(c): Compressive equivalent plastic strain (d): Plastic strain magnitude
Figure 21: Damage contours for RCC dam at 6.7 sec of earthquake excitations with hydrostatic effect
CONCLUSIONS
In this study, the effect of reservoir hydrostatic pressure on the dam during bidirectional ground motions has been investigated. For this aim, Kinta RCC dam is chosen as a case study and finite element discretization of the dam is made. Later on, the nonlinear seismic accelerations of Koyna excitation, 1967 have been imposed to the dam with and without consideration of

16 Khaled Ghaedi, et. al.
hydrostatic pressure effect. The revealed results in terms of acceleration, deformation and displacement, stress and damage response are presented. Based on the discussed results, followings can be drawn:
• The applied perpendicularly reservoir hydrostatic pressure is highly effective on horizontal acceleration and deformation
• The location of peak displacement in the dam body in horizontal direction increases and changes from the base to the crest while reservoir hydrostatic pressure is considered.
• The maximum principal stresses decrease from base level to the crest regions as hydrostatic pressure decrease from bottom to top zones. Therefore, the stresses at the heel zone of the dam are greater than the upper areas when hydrostatic pressure is taken into account.
• With consideration of hydrostatic effect, the tensile damage initiates at the heel regions and appears in the middle zone of upstream side too.
• The cracks launches in the downstream face near to neck zone of the dam when there is no hydrostatic effect, whereas, by considering he reservoir hydrostatic pressure effect, cracks are formed in the upstream face and heel region of the dam.
REFERENCES
Akköse, M. & Şimşek, E., 2010. Non-linear seismic response of concrete gravity dams to near-fault ground motions including dam-water-sediment-foundation interaction. Applied Mathematical Modelling, 34(11), pp.3685–3700.
Ayari, M.L., 1990. A Fracture Mechanics Based Seismic Analysis Of Concrete Gravity Dams Using Discrete Cracks. Engineering Fracture Mechanics, 35(1/2/3), pp.587–598.
Chang, C.J., Chen, W.F. & Yao, J.T.P., 1984. Seismic displacements in slopes by limit analysis. Journal of Geotechnical Engineering, (110), pp.860–874.
Chuhan, Z. et al., 2002. Experimental Tests of Rolled Compacted Concrete and Nonlinear Fracture Analysis of Rolled Compacted Concrete Dams. Materials In Civil Engineering, (April), pp.108–115.
Fenves, G. & Chopra, A.K., 1985. Simplified Earthquake Analysis of Concrete Gravity Dams: Separate Hydrodynamic and Foundation Interaction Effects. Journal of Engineering Mechanics, 111(6), pp.715–735.
GHD, 2002. Study of restrictions on RCC temperature, Stage 2 development of Ipoh water supply,
Guanglun, W. et al., 2000. Seismic fracture analysis of concrete gravity dams based on nonlinear fracture mechanics. Engineering Fracture Mechanics, 65.
Huda, A.M. et al., 2010. Modelling the Effects of Sediment on the Seismic Behaviour of Kinta Roller Compacted Concrete Dam. Pertanika J. Sci. & Technol, 18(1), pp.43–59.
Jiang, S. & Du, C., 2012. Seismic stability analysis of concrete gravity dams with penetrated cracks. Water Science and Engineering, 5(2007), pp.105–119.
Jin, C., Soltani, M. & An, X., 2005. Experimental and numerical study of cracking behavior of openings in concrete dams. Computers & Structures, 83(8-9), pp.525–535.
Linsbauer, H.N., 1990. Application Of The Methods Of Fracture Mechanics For The Analysis Of Cracking In Concrete Dams. Engineering Fracture Mechanics, 35(l), pp.541–551.
Mridha, S. & Maity, D., 2014. Experimental investigation on nonlinear dynamic response of

17Reservoir Hydrostatic Pressure Effect on Roller Compacted Concrete (RCC) Dams
concrete gravity dam-reservoir system. Engineering Structures, 80, pp.289–297. Newmark, N.M., 1965. Effects of earthquakes on dams and embankments. , pp.139–159.Paggi, M., Ferro, G. & Braga, F., 2013. A multiscale approach for the seismic analysis of
concrete gravity dams. Computers & Structures, 122, pp.230–238. Proulx, J. & Paultre, P., 1997. Experimental and numerical investigation of dam–reservoir–
foundation interaction for a large gravity dam. Canadian Journal of Civil Engineering, 24(1), pp.90–105.
Tarinejad, R., Ahmadi, M.T. & Harichandran, R.S., 2014. Full-scale experimental modal analysis of an arch dam: The first experience in Iran. Soil Dynamics and Earthquake Engineering, 61-62, pp.188–196.
Xie, H. & Chen, Y., 2005. Determination of the type and thickness for impervious layer in RCC dam. Advances in Engineering Software, 36(8), pp.561–566.
Xu, Q. et al., 2015. The dynamic characteristics of the damage probability of a gravity dam. Journal of Applied Mathematics and Mechanics, 79(1), pp.64–70.
Zhang, J.-H., He, J.-D. & Fan, J.-W., 2001. Static and dynamic stability assessment of slopes or dam foundations using a rigid body–spring element method. International Journal of Rock Mechanics and Mining Sciences, 38(8), pp.1081–1090.
Zhang, S., Wang, G. & Yu, X., 2013. Seismic cracking analysis of concrete gravity dams with initial cracks using the extended finite element method. Engineering Structures, 56, pp.528–543.
Zhu, X. & Pekau, O. a., 2007. Seismic behavior of concrete gravity dams with penetrated cracks and equivalent impact damping. Engineering Structures, 29(3), pp.336–345.


19Malaysian Construction Research Journal; Vol. 19 | No.2 | 2016
EXPERIMENTAL STUDY ON SEISMIC BEHAVIOR OF REPAIRED SINGLE AND DOUBLE UNIT TUNNEL FORM BUILDING UNDER IN-PLANE CYCLIC LOADINGShamilah Anudai, Nor Hayati Abdul Hamid and Mohd Hisbany Mohd HashimFaculty of Civil Engineering, Universiti Teknologi MARA, 40450 Shah Alam, Selangor, Malaysia
AbstractOne-third scale single and double unit three-story tunnel form buildings (TFB) were designed, constructed and tested under quasi-static in-plane lateral cyclic loading. Both of the prototype specimens were designed using BS8110 to represent the state-of-the-art reinforced concrete tunnel form buildings in Malaysia. The aim of this paper is to compare the seismic performance of repaired single and double TFB in the laboratory using Carbon Fibred Reinforced Polymer (CFRP), steel angle and steel plate. The repair and retrofit technique is adopted herein to increase the lateral strength capacity, stiffness, ductility and equivalent viscous damping of the TFB so that it can withstand the earthquake excitations. Both specimens were tested starting from ±0.01%, ±0.1%, ±0.25%, ±0.5%, ±0.75%, ±1.0% and ±1.25% drifts until severe damage was observed. Then, the damage single unit TFB was repaired and strengthened using CFRP, steel angle and steel plate. Meanwhile, the damage double unit TFB was repaired and retrofitted using additional shear wall, steel angle and CFRP. In order to assess their seismic performance under in-plane cyclic loading, the experimental results from both specimens before and after repaired were compared with each other. Results show that the lateral strength capacity of repaired double unit TFB increases by 54% as compare to repaired single unit TFB and no significant damage was observed on failure mode for both specimens. The stiffness and ductility for repaired double unit TFB was increased by 4% and 2%, respectively as compared to repaired single unit TFB. It can be concluded that the proposed repaired and retrofitted technique and material used such as CFRP, steel plate, steel angle and additional of shear wall can be used for damaged tunnel form buildings after the moderate or strong earthquakes.
Keywords: Repaired single unit; tunnel form building; repair and retrofit; lateral strength capacity; stiffness; ductility
INTRODUCTION
The tunnel form building is constructed using load-bearing walls by avoiding the construction of columns and beams in the building system by reduction of construction period. The main structural components in this system are shear walls and solid slabs where fresh wet concrete is poured into two half-tunnel forms to form load-bearing walls and floor slabs simultaneously. Just within 24 hours, the next floor can be built up and the existing floor becomes the working platform. Hence, the tunnel form buildings become more attractive as compare with conventional cast-in-situ technique for the construction of medium to high-rise buildings in Malaysia. Commonly, these types of buildings are designed using non-seismic code of practice such as BS8110 without considering any seismic loads. Even though Malaysia is not located in the Pacific Ring of Fire but frequent earthquakes from neighbouring countries which also known as long-distant earthquake can cause the lateral movement and vibration of high rise buildings such as residential condominiums, offices and commercial buildings in highly populated areas.
Several studies have been conducted by many researchers on the repaired and retrofitting of structural components such as beam-column joint (Hamid et al., 2013), single unit and double unit of tunnel form building (Shamilah et al. 2014; Hamid et al., 2014), wall-slab joint of tunnel form building (Hamid and Mohd Ashaari, 2012), masonry and concrete wall (Taghdi

20 Shamilah Anudai, et. al.
et al., 2000) and others. Others study on seismic retrofitting of older shear wall using headed bars and carbon fibre wrapping system also become a very effective technique to improve the ductility and energy dissipation of the existing shear wall (Paterson and Mitchell, 2003). The repaired and retrofitting of the existing damaged structures proves that it is a better option for economic consideration and immediate shelter problem rather than replacing them with new buildings after the earthquakes (Bhai, 2003). It has been observed that a majority of the damaged building can be safely re-occupied if the engineers used the most suitable materials and appropriate method of repair and strengthening for the damaged structural components (Agarwal and Shrikhande, 2007). One of prestige materials is CFRP also known as composite material which composes of carbon fibers bound together in an epoxy matrix. The fibers in the composite provide high characteristic tensile strength while the epoxy matrix distributes the load among the fibers and creates the bond between the composites and the substrate (Kirby and Orton, 2011).
Recent earthquake in Sabah with magnitude of 6.0 scale Richter had caused severe damages to two blocks of teachers’ school quarters, two blocks of hospitals’ quarters, polices’ quarters, mosques, homestays and others. These buildings need to repair and strengthening so that these damage buildings can be re-occupied after the devastating earthquake. Consequently, this research work on repaired and retrofitted technique for damaged tunnel form buildings is to be carried out in order to determine their seismic behaviour in terms of hysteresis loops, lateral strength capacity, stiffness, ductility and equivalent viscous damping subjected to in-plane lateral cyclic loading. Thus, the main intention of this paper is to compare the seismic performance of repaired single unit and repaired double unit TFB subjected to in-plane lateral cyclic loading using different combination of materials and technique for enhancements tunnel form buildings. By conducting the experimental work in the laboratory and analysing the experimental data, the optimum solution can be proposed for repairing the damaged structures which had experienced during the 2015 Sabah Earthquake.
MATERIAL AND RESEARCH METHODOLOGY
The one-third scale of single and double TFB which were designed using BS8110 (non-seismic code of practice), constructed and tested under in-plane lateral cyclic loading at Heavy Structural Laboratory, Faculty of Civil Engineering, Universiti Teknologi Mara, Shah Alam, Selangor. Both prototype specimens were tested under in-plane lateral loading by applying lateral force supplied by the double actuator to reinforced concrete block which located on top of three-story TFB. The single unit TFB was tested using control displacement method starting with ±0.01%, ±0.1%, ±0.25%, ±0.5%, ±0.75% and ±1% drift with severe damaged observed during experimental work. Upon the completion of the first testing, the damaged single unit TFB was repaired and retrofitted using the combination of steel angle, steel plate and CFRP fabric. Figure 1 demonstrates the damaged single unit TFB was repaired only on the cracks regions which located on the first level shear wall, second level shear wall and wall-slab joint. Initially, the cracks on the surface wall were smoothly grinded using grinding machine before applying the Epoxy and resin. Figure 1(a) shows the installation of steel plate and steel angle at the wall-slab joint which experienced the most severe damages of the wall and slab. Meanwhile, Figure 1(b) shows the first and second levels of shear wall were wrapped using two layer of CFRP sheet. Then, the repaired single unit TFB was painted with white colour paint so that any cracks can be marked during experimental work as shown in Figure 1(c). Finally, Figure 1(d) shows the repaired specimen is ready for testing. This specimen was

21Experimental Study On Seismic Behavior Of Repaired Single And Double Unit Tunnel Form Building Under In-Plane Cyclic Loading
tested under in-plane lateral cyclic loading starting from ±0.01%, ±0.1%, ±0.25%, ±0.5%, ±0.75%, ±1% and ±1.25% drift.
Subsequently, the double unit TFB was tested using control displacement method starting with ±0.01%, ±0.1%, ±0.25%, ±0.5%, ±0.75% and ±1% drift until severe damaged were observed. After that, the damaged double unit TFB was repaired and retrofitted using a combination of additional shear wall, steel angle and CFRP sheet. Figure 2 exhibits the repaired and retrofitting technique which had been adopted for damaged double unit TFB. Figure 2(a) shows the construction of additional shear wall attached to the existing shear wall from first level until third level. Meanwhile, Figure 2(b) shows the installation of steel angles at top of wall-foundation joint and top and bottom of wall-slab joint. Whereas, Figure 2(c) demonstrates the wrapping of two layers CFRP sheet around the first level and second level shear wall. Finally, Figure 2(d) shows the repaired double TFB is ready for testing starting from ±0.01%, ±0.1%, ±0.25%, ±0.5%, ±0.75%, ±1%, ±1.10%, ±1.20% and ±1.30%, drift.
Figure 1. Repair and retrofit of single unit tunnel form building
Figure 2. Repair and retrofit of double unit tunnel form building
In order to measure the lateral displacement in pushing and pulling direction, six numbers of LVDTs were placed on the left hand side of the shear wall and foundation beam. Four LVDTs were installed to the centre of wall-slab joint for each floor. Two LVDTs were installed to the foundation beam for detection of uplift and lateral movement of foundation beam during testing. Nine sets of history drift were applied to the tunnel form building starting at ±0.01%, ±0.1%, ±0.25%, ±0.50%, ±0.75% and ±1.0%. Each drift consists of two cycles of lateral displacements which are applied at the top of the tunnel form building.

22 Shamilah Anudai, et. al.
VISUAL OBSERVATION ON THE DAMAGES OF THE SPECIMENS
It is important to observe the damaged and repaired prototype specimens during experimental work subjected to in-plane lateral cyclic loading. Figure 3 shows the visual observation and crack pattern for damaged single unit TFB before retrofit whereas Figure 4 exhibits the visual observation of single unit TFB after retrofit (Shamilah et al. 2014). Figure 3(a) demonstrates the visual observation of horizontal cracks at outer and inner shear wall for the first floor. Meanwhile, Figure 3(b) exhibits the horizontal cracks at outer and inner side of the shear wall closed to the wall-slab joint at second floor. Whereas, Figure 3(c) shows only one crack observed at inner side of wall-slab joint for third floor and this area no need to repair because there is no serious and severe damages at the third floor. Figure 4(a) shows only minor cracks were occurred on the foundation beam at the first floor. Meanwhile, Figure 4(b) and Figure 4(c) display no horizontal cracks and damages at the second and third floor of the repaired single unit TFB. The first crack occurred at -0.1% drift before retrofit captured during initial of testing, but no crack was observed after retrofit as the shear wall was wrapped with CFRP sheet. The first floor shear wall of single unit TFB before retrofitting had sufferred more horizontal cracks as compared to the second and third floor. This differs from the repaired single unit of TFB where no crack was observed at any shear wall for every floor level.
Figure 5 exhibits the horizontal crack patterns at the first, second and third floor of double unit TFB before repair and retrofitting. Figure 5(a) shows a lot of horizontal cracks which occurred on the surfaces of the three shear walls at the first floor due to existing of plastic hinge zone (PHZ) at bottom of wall-foundation interfaces. While, Figure 5(b) shows less horizontal cracks happened on inside and outside at second floor of double unit TFB However, no hairline crack was observed at the third floor of the prototype specimen as shown in Figure 5(c). Figure 6 shows the visual observation damage for repaired double unit. Figure 6(a) shows the hairline cracks occurred on the foundation beam and minor horizontal occurred on the wall at first floor. Meanwhile, no horizontal and diagonal cracks occurred on the repaired specimen at second and third floor as shown in Figure 6(b) and (c), respectively. The initial crack appears at ±0.25% drift on the damaged specimen and ±0.75% drift on repaired specimen. The overall observation shows that the first floor shear wall suffered major crack as compared to the second and third floor. This is because the first floor level is the critical zone which also known plastic hinge zone (PHZ). Diagonal crack started to occur at ±0.75% drift on damaged specimen and no diagonal crack was found on repaired specimen as the shear wall was fully bonded with the CFRP sheet by increase the area of confining concrete in the wall. It can be summarized that the repaired specimen can reduce the occurrences of horizontal crack and the spalling of concrete cover. This is due to the fact that the highly tensile stress which occurred in concrete is transferred to CFRP sheet during testing the repaired double unit of TFB.

23Experimental Study On Seismic Behavior Of Repaired Single And Double Unit Tunnel Form Building Under In-Plane Cyclic Loading
Before retrofit single unit TFB After retrofit single unit TFB
(a) First floor before repair (a) First floor after repair
(b) Second floor before repair (b) Second floor after repair
(c)Third floor before repair (c)Third floor after repair
Figure 3. Visual observation on damages of single unit TFB before repair and retrofitting
Figure 4. Visual observation on damages of single unit TFB after repair and retrofitting.

24 Shamilah Anudai, et. al.
Before retrofit double unit TFB After retrofit double unit TFB
(a) First floor before repair (a) First floor after repair
(b) Second floor before repair (b) Second floor after repair
(c)Third floor before repair (c)Third floor after repair
Figure 5. Visual observation on damage before repair and retrofit of double unit TFB
Figure 6. Visual observation on damage after repair and retrofit of double unit TFB
EXPERIMENTAL RESULTS AND DISCUSSIONS
Lateral strength capacity
Figure 7 shows the comparison of lateral strength capacity for single and double unit of TFB before and after repaired. Previously research work had been conducted by Hamid et. al, (2014) only on the comparison of overall seismic performance on damaged and repaired double TFB under in-plane lateral cyclic loading. The repaired double unit TFB indicates that higher increment value of resisting lateral strength as compared to repaired single unit TFB. The main reason is that the damaged double unit TFB was enlarged the size of shear wall by adding another 50mm shear wall on both side of the damaged specimen. Moreover, the

25Experimental Study On Seismic Behavior Of Repaired Single And Double Unit Tunnel Form Building Under In-Plane Cyclic Loading
repaired single unit TFB gave better result in term of lateral strength capacity as compared to damaged specimen by increasing 19% of its ultimate lateral strength. Nevertheless, the ultimate lateral strength capacity of the repaired double unit TFB increases by 54% higher than repaired single unit TFB.
Figure 7. Comparison of lateral strength capacity of single and double unit TFB before and after repair and retrofitting using different materials and technique.
Stiffness and ductility
Table 1 shows the comparison of stiffness for single and double unit TFB after repair and retrofitting using different technique and materials. The pattern of stiffness values of repaired double unit TFB is different from repaired single unit TFB. The repaired double unit TFB has lower value of stiffness and sharply increased to the peak point at 0.25% drift and gradually decreased until 2.77 kN/mm at 1.0% drift. This phenomenon occurs when a new additional shear wall with BRC-A8 be able to stiffen the repaired double unit TFB even though the specimen is re-tested for second time and lost its stiffness before repair. In contrast, the repaired single unit TFB has higher value at the beginning and decreases constantly ended up with the strength degradation with stiffness of 0.84 kN/mm. Table 2 shows the comparison in term of ductility for repaired single and double unit TFB. In addition, the repaired double unit TFB has higher value of ductility (mD=2.23) than repaired single unit TFB (mD=1.21). However, these values of ductility are insufficient to cater for higher seismic load which associated with the moderate and strong earthquake. Lastly, these types of structures can be categorized as Ductility Class Low (DCL) because the value of displacement ductility less than 3.

26 Shamilah Anudai, et. al.
Table 1. Comparison of stiffness between double and single unit TFB
Drift (%) Double unit stiffness Single unit stiffness
0.01 0.89 7.85
0.1 0.71 5.61
0.25 5.54 4.63
0.5 4.28 3.48
0.75 2.77 0.60
1.0 2.75 0.84
Table 2. Comparison of ductility between double and single unit TFB
Drift (%) Double unit ductility Single unit ductility
0.01 0.02 0.01
0.1 0.14 0.10
0.25 0.45 0.28
0.5 1.00 0.63
0.75 1.60 1.00
1.0 2.23 1.21
Equivalent viscous damping
Figure 8 shows the comparison of equivalent viscous damping (EVD) between repaired single and double unit TFB subjected to in-plane lateral cyclic loading for the first cycle of each drift. It can be noticed that the equivalent viscous damping ratios for repaired single unit is higher than the double unit TFB due to enclosed area in the hysteresis loop of single unit TFB is larger than in the double unit TFB. The EVD of the repaired double unit increases gradually starting from 0.25% drift to 1% drift and increase tremendously starting from 1% drift until 1.3% drift. During this phase, the CFRP sheet had absorbed quite big amount of energy during pushing and pulling direction. However, the energy absorption for repaired single unit seems to increase tremendously starting from 0.1% drift until 1% drift. It is evident that the repaired and retrofitting technique with good combination of materials such as CFRP, steel angle, steel angle and additional shear wall could increase the equivalent viscous damping in both repaired single and double unit TFB. Furthermore, steel plate, steel angle and CFRP sheet could substantial increased the overall energy absorption for the repaired single unit TFB.

27Experimental Study On Seismic Behavior Of Repaired Single And Double Unit Tunnel Form Building Under In-Plane Cyclic Loading
Figure 8. Comparison of equivalent viscous damping (EVD) of repaired single and double unit TFB.
CONCLUSION
The older reinforced concrete wall which designed using BS8110 exhibits insufficient in-plane strength and ductility to behave satisfactorily under moderate and strong earthquakes. Therefore, the strengthening technique is needed by installing additional shear wall on both side of the existing shear wall. Retrofitting or strengthening is a modification of the existing structures by adding some materials such as CFRP, steel plate and steel angle at joints or section enlargement to those existing structures. By using a proper repairing technique and combination of these materials could increase the lateral capacity of the structures, elastic stiffness, displacement ductility and equivalent viscous damping. The comparison of seismic performance between repaired of single and double unit TFB have been improved as compared before repaired and retrofitting take place. The repaired double unit TFB with the combination of additional shear wall, steel angle and CFRP had higher stiffness and ductility by 4% and 2%, respectively as compared to repaired single unit TFB with steel angle, steel plate and CFRP sheet. But contradictory, the repaired single unit TFB has higher value than repaired double unit TFB. Yet, the additional or enlargement of shear wall in repaired double unit TFB can increase almost 54% of the lateral strength capacity as compared to repaired single unit TFB. Based on the overall visual observation, both repaired prototype specimens had reduced tremendous horizontal crack and spalling of concrete cover during testing. Therefore, it is recommended to use this repaired and retrofitting technique with combination of steel plate, steal angle, CFRP and enlargement of existing shear wall for the damaged structures after the devastating earthquake.

28 Shamilah Anudai, et. al.
ACKNOWLEDGEMENT
The authors would like to express their gratefulness and gratitude to e-Science Fund from MOSTI (Ministry of Science, Technology and Innovation), Putrajaya, Malaysia and RMI (Research Management Institute) for the funding of this research. Furthermore, special thanks and obligations are conveyed to all technicians in the Heavy Structural Laboratory, Faculty of Civil Engineering, UiTM for assisting this experimental work successfully.
REFERENCES
Agarwal and Shrikhande (2007) Comparison of CFRP and Alternative Seismic Retrofitting Techniques for Bare and Infilled RC Frames. Journal of Composites for construction, 15:565-577.
Bhai, W. (2003) Challenges on Observational Seismology”, In International Handbook of Earthquake & Engineering Seismology. Amsterdam: Part A, Academic Press, 269-281 pp.
Hamid, N.H., Nur Diyana, H. and Kay Dora, G. (2013) Retrofitting of Beam-Column Joint Using CFRP and Steel Plate. World Academy of Science Engineering and Technology, 783-788.
Hamid, N.H. and Shamilah, A.A. (2014) Comparison of Seismic Performance Between Single and Double Unit Tunnel Form Building Under In-Plane Lateral Cyclic Loading. Applied Mechanics and Materials 567 (1), 687-692.
Hamid, N.H. and Mohd Ashaari M. (2012) Seismic Performance of Wall-Slab Joint in Industrialized Building System (IBS) Under Out-of-Plane Reversible Cyclic Loading. International Journal of Engineering and Technology, 4(1).
Hamid, N.H., Shamilah, A.A. and Nur Liyana, A. (2014) Retrofitting of a Double Unit Tunnel Form Building Using Additional RC Wall, Steel Angle and CFRP. Applied mechanics and materials, 661, 123-127.
Kirby, J.E. and Orton, S.L. (2011) Residual Strength of Impact-Damaged CFRP Used to Strengthen Concrete Structures. Journal of Composites for Construction, ASCE, 15(5):782-789.
Paterson, J. and Mitchell, D. (2003) Seismic Retrofit of Shear Walls with Headed Bars and Carbon Fiber Wrap. Journal of Structural Engineering, 129:606-614.
Shamilah, A.A., Hamid., N.H. and Mohd Hisbany, H. (2014) Retrofitting of Single Unit Tunnel Form Building Using Steel Plate undr Out-of-Plane Lateral Cyclic Loading Applied mechanics and materials, 661, 95-99
Taghdi, M., Bruneau, B. and Saatcioglu, M. (2000) Seismic Retrofitting of Low-Rise Masonry and Concrete Walls Using Steel Strips. Journal of Structural Engineering, 126:1017-1025.
Shamilah, A.A., Hamid, N.H. and Mohd Hisbany, H. (2014) Comparison of Seismic Behaviour for a Single Unit Tunnel Form RC Building before and after Repaired. Advanced Materials Research 905, 254-258.

29Malaysian Construction Research Journal; Vol. 19 | No.2 | 2016
THE BEHAVIOUR OF ROCKING MULTI-COLUMN PIER OF UNSKEWED BRIDGE UNDER SEISMIC PERFORMANCE USING QUASI–STATIC LATERAL CYCLIC LOADINGMuhd Salmizi Jaafar, Nor Hayati Abdul Hamid and Norma Hazira MahmoodFaculty of Civil Engineering, Universiti Teknologi MARA, 40450 Shah Alam, Selangor, Malaysia
AbstractNowadays, the earthquake phenomenon is a common disaster for Southeast Asia Region. Earthquake causes loss of assets and casualties. Moreover, the government needs to cover the losses after the disaster. One of the large and expensive structures is the bridge. The main function of the bridge is to be a connector between two places. Most of the constructions of bridge in Malaysia are not fulfilling the requirement of the Basis Design Earthquake (BDE) and Maximum Considered Earthquake (MCE) under the Performance-Based Earthquake Engineering (PBEE). Therefore, the research provides information on how the seismic damages the structure and non-structure. The research started with the preparation of the semi integral bridge sample with the scale of 1:3 and a post-tensioning on the column was applied. The quasi-static lateral cyclic loading test was applied in this research. Based on the results, the performance of the multi-column pier was determined from the maximum load, maximum displacement and the hysteresis loop of the sample when charging and dissipating the energy. Then, the characteristics of the multi-column pier were obtained based on the ductility and the relationship of specimen stress-strain. The damages of the semi-integral bridge after the testing also were observed by visually to complete the determination of behaviour of rocking multi-column pier under seismic performance.
Keywords: Bridge; Seismic; Rocking pier; Cyclic loading
INTRODUCTION
Almost all the bridges in Malaysia built in previous 30 years is not considering the seismic loading. When the strong earthquake occurs, most of the structures and infrastructures such as bridge is exposed to the vibration and cannot resist the shaking from the earthquake. Some cases of the bridge collapse due to earthquake are Oakland Bay Bridge on 1989 with magnitude of earthquake is 7.1. The strong earthquake was making the side of bridge shifts to the east and caused the bolts of bridge to shear off then some part of the bridge collapsed. Otherwise, the structure use the method in design the structure can resist the vibration from the earthquake such as design seismic criteria and this problem cannot be solved because the knowledge of bridge in seismic condition is very limited.
LITERATURE REVIEW
Most countries have damages in bridge when the earthquake occurs in their country. Past earthquakes have shown that the damage induced in bridges can take many forms depending on the ground motion, site conditions, structural configuration and specific details of bridge. Damage within the superstructure has rarely been the primary cause of collapse. Most of the severe damage to bridges has taken one of the following forms:
• The superstructure is not seating at in-span hinges or simple supports because of inadequate seat lengths or restraint. A skewed, curved, or complex superstructure

30 Muhd Salmizi Jaafar, et. al.
framing configuration further increases the vulnerability.• The brittle failure of column because of deficiencies in shear capacity and inadequate
ductility. In reinforced concrete columns, the shear capacity and ductility is depending on inadequate lateral and confinement reinforcement.
• Unique failures in complex structures.
Based on result using cyclic loading in the journal of “Reinforced Concrete under Cyclic Loading” [2], when the load is closely to the specimen, the vertical crack was occur to the specimen. After that, the failure of concrete cover was followed and the rupture of hoops was accompanied by the buckling of the longitudinal rots. Therefore, the cyclic loading that imposed to the reinforced concrete can be effect to the damages of the reinforced concrete and because of the cyclic loading is same as the vibration of the earthquake, it is very important to make research on that to avoid the damages of reinforced concrete. It is also to provide solution to avoid the damages of the reinforced concrete which imposed by over cyclic loading. For example of the solution is using the steel fibre in reinforced concrete in critical zone such as beam-column joints can avoid damages to the reinforced concrete. Thus, this research was conducted to provide the knowledge about behaviour of rocking multi-column pier under seismic performance and Figure 1 was represent the plan view of the conceptual prototype semi integral bridge used in this study.
Figure 1. Prototype Semi Integral Bridge
The semi integral bridge was designed and constructed using scale 1:3. After that, it was tested by using quasi-static lateral cyclic loading test in laboratory. The objectives were creating to determine the performances and characteristics of multi-column pier of unskewed bridge under seismic condition. Then the, damages also was observed to know the effect of the seismic on the bridge.
METHODOLOGY
The research was started by preparing the sample as shown as in Figure 2 and post-tensioning was applied a compressive force to the concrete at the middle of both column.

31The Behaviour of Rocking Multi-Column Pier of Unskewed Bridge Under Seismic Performance Using Quasi–Static Lateral Cyclic Loading
Then, the sample was installed with strain gauge at the column steel reinforcement to obtain the strain value of the steel reinforcement and was setting with six numbers of linear variable displacement transducers (LVDT) to determine the displacement of the sample during testing. Finally, the sample was tested with load cell as a seismic performance in lateral direction and the machine was setup with ±0.01, ±0.1, ±0.25, ±0.5, ±0.75, ±1.0, ±1.25, ±1.5, ±1.75 and ±2.0 percent of drift. The data of force, displacement and strain was obtained from the testing result in every percent drift.
Figure 2. Semi Integral Bridge Model
Based on the data, the research was interpreted to determine the performance and characteristic of the multi-column pier. The damages on sample which are crack and spalling concrete were due to drift applied. The damages result was taken as visual observation.
INTERPRETATION OF RESULT AND DISCUSSION
Figure 3. Force versus Drift
Maximum load of multi column pier under seismic performance
Based on the table, the graph was plotted for pushing in Figure 3 to show the increasing load until the load decreased. From the observation, the load increased until 1.5% drift with the maximum load of 186.42kN and then, the load started decreasing to 181.74kN at 1.75% drift
32 Muhd Salmizi Jaafar, et. al.
and finally the testing stopped at 2.0% with the load of 177.54kN. This is because the testing shows that the sample can only cater loads until 186.42kN. The maximum load obtained from the experiment represents the limit that the sample can cater from the load cell.
The maximum load for every drift percentage does not depend on the drift percentage. This is because, the load only increases until 1.5% drift. Then, the load decreased after 1.5% drift. It shows that, the maximum load can be obtained when achieving 1.5% drift. Then, at 1.75% and 2.0% drift, the load decreased and shows that the sample cannot resist the applied drift on it. If the testing still continues, the possibility of the sample to fail is high because the ultimate load of the sample is 186.42kN.
Displacement versus Time
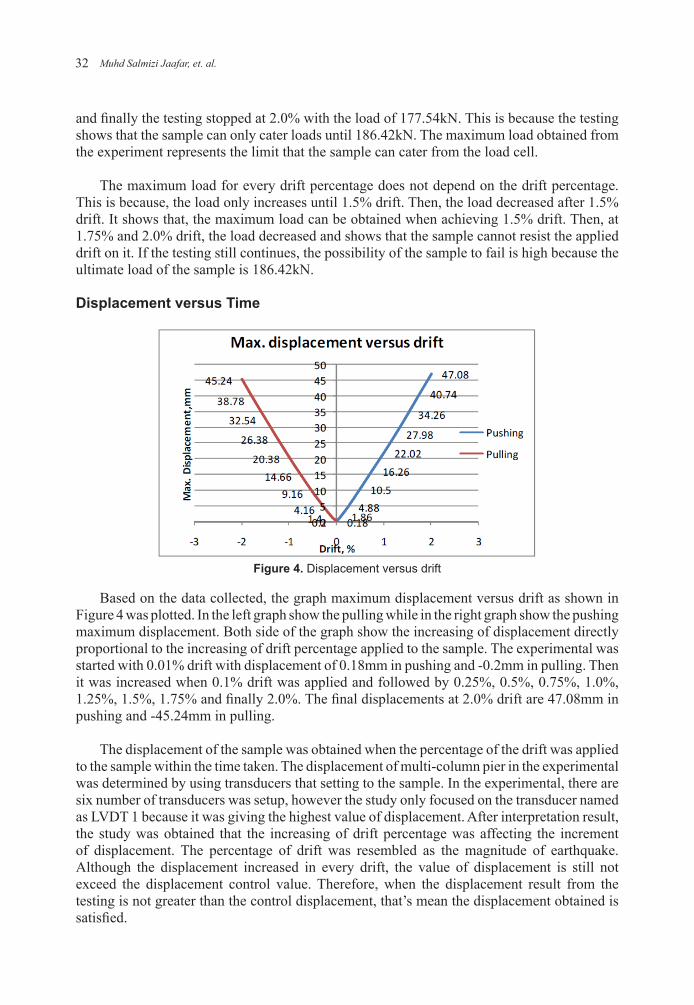
Figure 4. Displacement versus drift
Based on the data collected, the graph maximum displacement versus drift as shown in Figure 4 was plotted. In the left graph show the pulling while in the right graph show the pushing maximum displacement. Both side of the graph show the increasing of displacement directly proportional to the increasing of drift percentage applied to the sample. The experimental was started with 0.01% drift with displacement of 0.18mm in pushing and -0.2mm in pulling. Then it was increased when 0.1% drift was applied and followed by 0.25%, 0.5%, 0.75%, 1.0%, 1.25%, 1.5%, 1.75% and finally 2.0%. The final displacements at 2.0% drift are 47.08mm in pushing and -45.24mm in pulling.
The displacement of the sample was obtained when the percentage of the drift was applied to the sample within the time taken. The displacement of multi-column pier in the experimental was determined by using transducers that setting to the sample. In the experimental, there are six number of transducers was setup, however the study only focused on the transducer named as LVDT 1 because it was giving the highest value of displacement. After interpretation result, the study was obtained that the increasing of drift percentage was affecting the increment of displacement. The percentage of drift was resembled as the magnitude of earthquake. Although the displacement increased in every drift, the value of displacement is still not exceed the displacement control value. Therefore, when the displacement result from the testing is not greater than the control displacement, that’s mean the displacement obtained is satisfied.

33The Behaviour of Rocking Multi-Column Pier of Unskewed Bridge Under Seismic Performance Using Quasi–Static Lateral Cyclic Loading
Hysteresis loop
Figure 5. Force versus Displacement
Refer to the graph in Figure 5, the pattern of hysteresis loop indicate the force was increase in small increment until it was reach the ultimate load at 1.5% drift. However, for the displacement was represent the continuous increasing until the testing stopped. In overall observation, the hysteresis loop curve was increase since the increasing of drift percentage applied. The more areas of hysteresis loop the more ability of sample to store energy.
Figure 6. Equivalent viscous damping for every drift
Based on the graph in Figure 6, it was shown the pattern of equivalent viscous damping for every drift percentage. At 0.01%, the equivalent viscous damping (EVD) is 0.1643 and shows the highest EVD for the testing. After that, at 0.1% to 0.5% drift the EVD was increased to the 0.0548 but at 0.75% drift the EVD was a decrease in the 0.0528. However, the EVD was increased again started at 1.0% drift until the testing was stopped at 2.0% drift with EVD of 0.1116. Hysteresis loop was plotted to determine the energy dissipated that contribute to the calculation of equivalent viscous damping. Equivalent viscous damping (EVD) was determined in purpose of showing the energy dissipated in the vibration cycle of the actual structure under seismic performance.
Based on EVD graph, at 0.01% drift, the EVD is the highest value. It is because the drift applied is smallest drift and the sample is in rigid condition at the initial time. So, the sample is highly resisting the drift applied. After that, starting at 0.1% drift, the EVD of the sample is

34 Muhd Salmizi Jaafar, et. al.
starting to weak because the drift is continuously applied to the sample. However, after 0.1% drift the EVD was increased due to increasing of drift. It is because the strength in the sample tries to resist from oscillates. Based on that, it can be said that the sample has the capacity to restrain the dissipated energy under the cyclic loading test.
Ductility of Semi Integral Bridge
Figure 7. Ductility force-displacement behaviour
By referring to the Figure 7, the elastic phase occurs until the delta yield (Δy) which is 10mm and maximum force at 110kN. Then, the ultimate load for bridge sample occurs at 186.42kN with 33.8mm displacement. Using the value of delta yield, the ductility of the bridge sample in every drift percentage was calculated and it was shows that the increasing of ductility value due to the increasing of drift percentage and displacement. Therefore, the ductility in ultimate of semi integral bridge under seismic performance as in (1).
Ductility in ultimate = ∆ultimate / ∆yield (1) Ductility in ultimate = 33.8 / 10 = 3.38
Ductility is important factor for seismic practice to evaluate the capacity of the structure to resist seismic action. Based on the seismic practice, the suitable ductility factor in the structure should be in between 3 to 6. The study was calculating the ductility for every drift percentage and the ductility factor in ultimate point is 3.38. So, based on the result obtained, it was indicated that the multi column, pier has the ductility factor in the range of ductility factor in seismic condition.
When the study obtained ductility factor in the ductility range under seismic practice, it was defined as the sample able to deform under tensile stress without breaking. So, based on the result obtained, it was indicate that the multi column pier has the ductility factor in range of ductility factor in seismic condition. When the study obtained ductility factor in ductility range under seismic practice, it was defined as the sample able to deform under tensile stress without breaking.

35The Behaviour of Rocking Multi-Column Pier of Unskewed Bridge Under Seismic Performance Using Quasi–Static Lateral Cyclic Loading
Stress-Strain Relationship of the Semi Integral Bridge
Allowable stress = σ Strand + σ Column + σ Concrete (2) = 1395 N/mm² + 437 N/mm² + 13.5 N/mm² = 1845.5 N/mm²
Based on the plotting graph in Figure 8 and Figure 9, the highest stress value for both graphs in pushing is 2685.946 N/mm² and in pulling is -2635.46N/mm². While, the highest strain value at strain gauge 2 is 2085μm/m for pushing and -743μm/m for pulling. Then at strain gauge 7 is 2422μm/m for pushing and -666μm/m for pulling. Therefore, the highest stress obtain was exceed the allowable stress of the sample.
Figure 8. Stress-strain relationship for Strain gauge 2 (Column 1)
Figure 9. Stress-strain relationship for Strain gauge 7 (Column 2)

36 Muhd Salmizi Jaafar, et. al.
Stress-strain relationship occurs in elastic phase of the material. The yield load point is the maximum of the stress occur. Basically, the joint of the structure will have highest stress when load is applied because it was a critical point in the structure. The study was focused on column joint where the strain gauge was installed to determine the strain of the steel reinforcement of column. The strain gauge was installed at the bottom of the column and foundation connection for both of the column. The interpretation result is based on the highest reading that obtained from one of the strain gauge for each column which is strain gauge 2 and strain gauge 7. The data interpret at 0.5% drift because the yield load point of the sample was achieved around 0.5% drift. The study was determined the highest stress that applied to the column is 2685.946 N/mm² for pushing and -2635.46N/mm² for pulling. When the stress applied, as in (2), was exceed the allowable stress which is 1845.5 N/mm², the strain on the sample was over elongated. Consequence of that, the sample was cracked and spalling concrete occurs.
The damages of semi integral bridge after the testing based on visual observation.
The testing was conducted until the load was decrease. If the testing still continues after the load decrease, the sample will fail. During the testing, the damages that occur to the sample are crack and spalling concrete. The first crack was occurring at 0.1% drift and it was only a small crack for the started another crack to occur. Then, at 1.5% drift, the spalling concrete was occur and it can be said that the spalling concrete occur due to the increasing of crack width and at 1.5% drift the force applied to sample is the highest force. In overall, most of the cracks were occur near the columns joint which are bottom and top of the column. However, at the middle of the column there is no crack appear and only several cracks occur at the capping beam and foundation because of extension of the existing crack at the column joint. The cracks more appear when the drift percentage is increase. When the sample was continuously cracking, the spalling start reform but it is still under control situation.
Figure 10. The overall crack and spalling concrete occurs

37The Behaviour of Rocking Multi-Column Pier of Unskewed Bridge Under Seismic Performance Using Quasi–Static Lateral Cyclic Loading
CONCLUSION
Based on the interpretation result and discussion, the first objective of the study is performance of multi-column pier under seismic condition was achieved. It was shows by the result of maximum force which is 186.42kN. The second performance of the sample is all the displacement in every drift percentage which obtained is less than control displacement. Then, the hysteresis loop that produce the equivalent viscous damping of the sample was shows the increasing of the dissipated energy by the drift percentage. Therefore, in overall the first objective was achieve because from the discussion, the result represent the suitable and under the allowable performance. The second objective of the study is the characteristic of the sample which are ductility and stress-strain relationship. The ductility at ultimate load is 3.38 and it is in range of the ductility factor for seismic practice which is 3 to 6. From that, it was shows that ductility of sample in good performance to resist the seismic condition. For stress-strain relationship, the maximum stress applied to the sample which is 2685.946 N/mm² was exceeding the allowable stress, 1845.5N/mm². In the same time, the strain was obtained base on maximum stress at strain gauge 2 is 2085μm/m for pushing and -743μm/m for pulling. While at strain gauge 7 is 2422μm/m for pushing and -666μm/m for pulling. Therefore, the result of experiment was proved by the appearing of crack and spalling concrete. The conclusion for the third objective about the visual observation on damages of sample after undergo the seismic performance was shows the sample can cater the load. It can be proved by the damages occur to the sample and by the characteristic of the sample that obtained in the second objective. Most of the cracks occur at the column joint and only one location for the spalling concrete occurs. The crack occur is within the 2mm to 4mm width and the length is 100mm to 250mm only. Based on the observation, the damages occur is not in bad condition and can be said as the sample can cater the seismic condition. In additional, the ductility of the sample was proved that the sample damage is still under control because the sample experience cracking and just one spalling concrete occur. On the side of stress-strain characteristic, the sample was cracked because of exceeding maximum stress applied. As a conclusion, the experiment successfully proved the multi-column pier under seismic condition was fulfil the performance, characteristic and effect of testing based on theoretically and experimentally.
REFERENCES
Chen, W.F. and Lui, E.M. (2006) Earthquake Engineering for Structural Design. Taylor & Francis Group, LLC CRC Press is an imprint of Taylor & Francis Group.
Joaquim A O Barros, José M S Cruz, Raimundo M Delgado and Aníbal G Costa, (2000). Reinforced Concrete under Cyclic Loading.
Moehle, J.P., Eberhard, M.O. (2000). Earthquake Damage to Bridges. Bridge Engineering Handbook. CRC Press.
The Highway agency, Scottish Executive Development Department, The National Assembly For Wales Cynulliad Cenedlaethol Cymru & The Department For Regional Development Northern Ireland. BD 37/01: Design Manual For Roads And Bridge.
Hellesland, J. and Green, R. (1973) Repeated Loading Tests of Reinforced Concrete Columns. Symposium on Reinforced Concrete Columns, Publication SP-50. American Concrete Institute, Detroit.


39Malaysian Construction Research Journal; Vol. 19 | No.2 | 2016
DYNAMIC PROPERTIES OF ELASTOMERIC BEARING VIA FINITE ELEMENT AND EXPERIMENTAL MODAL ANALYSISAhmad Idzwan Yusuf1, Norliyati Mohd Amin2, Mohd Azmi Yunus3 and Muhamad Norhisham Abdul Rani3
1 Faculty of Civil Engineering, Universiti Teknologi MARA, 40450 Shah Alam, Selangor, Malaysia2 Faculty of Civil Engineering, Institute for Infrastructure Engineering and Sustainable Management (IIESM), Universiti Teknologi MARA, 40450 Shah Alam, Selangor, Malaysia
3 Faculty of Mechanical Engineering, Universiti Teknologi MARA, 40450 Shah Alam, Selangor, Malaysia
AbstractElastomeric bearing is a significant device in structures such as in bridges and buildings. It is a combination of rubber and steel shim plates in alternate layers that provides a very high vertical stiffness, while still maintaining high flexibility in horizontal direction which is required to lengthen the time period of a structure during the seismic events. In improving the design and the failure limit of elastomeric bearing, it is vital to comprehend their dynamic behaviour in terms of natural frequencies, mode shapes and damping. Modal analysis is one of the methods used to determine the dynamic properties of elastomeric bearing. Hence, the main objective of this research is to determine the dynamic properties of elastomeric bearing in terms of natural frequencies, mode shapes and damping via finite element modal analysis and experimental modal analysis. A good agreement was observed between the finite element and the experimental modal analysis results. This modal analysis method had been successfully performed to investigate the dynamic behaviour of elastomeric bearing.
Keywords: Vibration; Natural Frequencies; Mode Shapes; Experimental Modal Analysis; Finite Element Modal Analysis; Elastomeric Bearing
INTRODUCTION
Elastomeric bearing is a device that is used to isolate a structure from seismic load such as harmonic load, periodic load, impulse or pulse load, and transient load. It is a combination of rubber layer and steel shim plate that are laminated together alternately. The elastomeric bearing is also known as laminated rubber bearing (LRB). Rubber layer is an almost incompressible material that gives high horizontal flexibility while steel shim plate is a solid material that gives high vertical stiffness (Derham, Kelly, & Thomas, 1985; Warn & Weisman, 2011). Therefore, the elastomeric bearing provides a very high vertical stiffness, while still maintaining high flexibility in the horizontal direction which is required to lengthen the time period of a structure during the seismic events (Sulaiman & Norliyati, 2013). This behavior is required in isolation of civil engineering structure.
Before the invention of elastomeric bearing, seismic load protections of a structure relied on strengthening the structure which mainly focused on preventing the collapse of the structure and not reducing the load within the structure. It will eventually lead to higher costs during the construction works. With the usage of elastomeric bearing, the construction cost of a structure is reduced while giving better protection to the structure from seismic load as compared to the conventional ways of construction. When the structure is isolated with elastomeric bearing, it will experience a reduction in peak acceleration around the tenfold compared to structure with no elastomeric bearing. Elastomeric bearing not only provides

40 Ahmad Idzwan Yusuf, et. al.
protection to the structure from damage but it also provides protection to the equipment inside the structure when the structure is subjected to seismic load (Derham, Kelly, & Thomas, 1985). Since less maintenance is required and it is easy to install, elastomeric bearing has now been used in almost all structures worldwide especially in the areas that have high level of vibration and high risk of earthquake activity.
The importance of elastomeric bearing in seismic isolated structure has led many researchers in trying to understand the behavior and to improve the design of elastomeric bearing. The key point in the design of an effective base isolation system is the understanding of the isolator characteristics (Chang, 2002). On top of that, there are a number of researchers that had done researches focusing on the stability of elastomeric bearing when subjected to vertical and horizontal load (Pinarbasi & Akyuz, 2004; Kumar, 2012; Osgooei, Tait & Konstantinidis, 2014), the influence of shape factor to elastomeric bearing mechanical properties (Imbimbo & De Luca, 1998; Koo, Lee, Lee, & Yoo, 1999), the effect of the temperature to elastomeric bearing (Othman, 2001; Norliyati et al., 2013), the buckling load capacity of elastomeric bearing (Chang, 2002) and the instability of elastomeric bearing affected by cavitation (Kelly & Marsico, 2013).
When a structure is hit by external dynamic loading such as earthquake loading near its natural frequency, resonance can occur. The resonance will then damage the structure and thus causing the structure to collapse. The exact situation applies to elastomeric bearing. When elastomeric bearing is hit by external dynamic loading near its natural frequency, resonance will happen and thus it will damage the bearing and automatically the structure will collapse. Since elastomeric bearing is a key device in isolating the structure from external dynamic loading such as earthquake loading, it is important to understand the dynamic properties of elastomeric bearing in terms of its natural frequencies, mode shapes and damping. By knowing the dynamic properties of elastomeric bearing, an effective base isolation system can be designed thus the resonance of the bearing can be prevented. Therefore, the main objective of this research is to determine the dynamic properties of elastomeric bearing in terms of natural frequencies, mode shapes, and damping via finite element and experimental modal analysis.
MODAL ANALYSIS
Modal analysis is a process to determine the inherent dynamic properties of a structure or materials in the form of natural frequencies, mode shapes, and damping. On top of that, modal analysis also allows the verification and adjustment of the mathematical model of the structure or materials. There are two types of modal analysis which are; numerical modal analysis and experimental modal analysis. The experimental modal analysis is also known as modal testing, meanwhile the numerical modal analysis is known as finite element modal analysis (Fu & He, 2001; Yusuf & Norliyati, 2014). All the materials are assumed to be linear in both methods. Any nonlinearity is ignored even if it is defined. As far as this study concerns, both the finite element and the experimental modal analysis are used to determine the dynamic properties of elastomeric bearing.

41Dynamic Properties Of Elastomeric Bearing Via Finite Element And Experimental Modal Analysis
Finite element modal analysis
In the finite element modal analysis, free vibration equation of motion for single degree of freedom system without damping can be written as (Fu & He, 2001):
[M]{ẍ} + [K]{x} = {0} (1) Free vibration solution is mathematically non trivial solution. It should take the form as:
{x} = {X} sin ωt (2)
By substituting (2) into (1), it will change into a simple algebraic matrix equation:
([K] – ω2 [M]) {X} = {0} (3)
In equation (3), {X} cannot be 0, so:
ǀ[K] – ω2 [M]ǀ = {0} (4)
ω2 is the eigenvalue that determines the natural frequency of the system and {X} is the eigenvector that determines the mode shape of the system.
Experimental modal analysis
Experimental modal analysis is a test to determine the dynamic characteristic of the real physical structures or materials in terms of natural frequencies, mode shapes and damping. The experimental modal analysis offers real field measurements of the structural dynamic behavior. Also known as modal testing, this test is used to enhance and authenticate the existing numerical models. It is used commonly in vibration engineering in defining the dynamic response characteristics of existing structures as it is known for its ability to calculate the mode shapes and frequencies of a practical structure precisely (Xiaoqing & Jacob, 1997). The rising needs for quality and reliability in almost all engineering structures have making it vital for all structural dynamic characteristics to be estimated correctly.
The fundamental theory of this experimental technique is derived from the correlation between the responses at one location (output) and the excitation at the same or another location (input) which is known as Frequency Response Function (FRF). An FRF is defined by the ratio of the output response to the input signal. Both the input and output signals can be transformed from the time domain to the frequency domain by applying a Fourier Transform and the function produced will be complex. To calculate the magnitude and phase, it can be evaluated from the complex function. The modal parameters (natural frequencies, mode shapes and damping) are then obtained from individual FRF curve or from a set of FRF curve [8]. The relationship of output response and input signal of FRF can be written as:

42 Ahmad Idzwan Yusuf, et. al.
F (ω) + [H (ω)] = X (ω) (5)
and
[H (ω)] = X (ω) / F (ω) (6)
Where F (ω) is the input signal, X (ω) is the output response, and H (ω) represents the dynamic properties of the structure.
METHODOLOGY
In this study, modal analysis method was used to determine the dynamic properties of elastomeric bearing. Modal analysis embraces both numerical and experimental technique. For numerical modal analysis, finite element ANSYS 14.1 software was used whereas for experimental modal analysis, impact hammer testing was used. After the dynamic properties of the elastomeric bearing had been determined from both methods, the results of mode shapes and natural frequencies were compared and validated. First and foremost, the patterns of the mode shapes from both methods were compared. An experiment testing was done repeatedly until the mode shapes were as close as possible to the finite element. The value of the natural frequencies was then compared if the mode shapes from both methods were similar. The values of natural frequencies from the finite element must be higher than experiment because in experimental modal analysis, damping is considered but in the finite element modal analysis, damping is ignored. Damping is a dissipation of energy from the material.
Material
One elastomeric bearing was used in this study. The dimension of the elastomeric bearing is 200mmx230mm and the thickness is 57mm. The elastomeric bearing was laminated with five steel shim plates with a thickness of 5mm each and the dimension of steel shim plate is 188mmx218mm. The thickness of inner rubber plates is 6mm each and the thickness of outer rubber plates is 4 mm respectively. Figure 1 shows the elastomeric bearing used in this study.
Figure 1. Elastomeric Bearing

43Dynamic Properties Of Elastomeric Bearing Via Finite Element And Experimental Modal Analysis
Finite Element
In the finite element modal analysis, elastomeric bearing was modelled and analysed using ANSYS 14.0. The ANSYS 14.0 software consists of two types of computer-aided design (CAD) which are the Mechanical APDL and the Workbench. In this study, the geometry modelling of elastomeric bearing was modelled using the Mechanical APDL. Afterwards, the geometry was exported to the Workbench for analysis. This is due to the complexity of the elastomeric bearing geometry. Both the rubber plate and steel shim plate of the elastomeric bearing were assigned with specific material properties in the ANSYS Workbench. For the steel shim plate, it was assigned to be linear elastic material properties (Young’s modulus 210 GPa; Poisson’s ratio of 0.3; Density of 7850 kg/m3) (Doshin, 2014). Rubber is a hyperplastic material with low shear modulus and very high bulk modulus. The Young’s modulus of 50 MPa, the Poisson’s ratio of 0.49 and a density of 1100 kg/m3 were assigned as the material properties of the rubber plate (Doshin, 2014). The meshing size used to mesh the elastomeric bearing was 5 mm. Figure 2 shows the finite element modal analysis of the elastomeric bearing.
Figure 2. Finite Element Modal Analysis
The elastomeric bearing was then analysed and the results of natural frequencies and mode shapes were extracted. The first six modes were rigid body modes and the values of natural frequencies were zero and no mode shapes was formed from these modes. These first six mode results were not taking into account for comparison. The results of natural frequencies and mode shapes for the next two modes of the elastomeric bearing were used for validation comparison with the experimental modal analysis.
Experiment
In experimental modal analysis, the elastomeric bearing was tested in a free-free boundary condition. It was not exactly possible to simulate a free-free boundary condition in an actual experiment. The only way to simulate a free-free boundary condition is by hanging the model from a fixed place using springs or rubber bands. Since the elastomeric bearing was quite

44 Ahmad Idzwan Yusuf, et. al.
heavy which was of 9.3kg, two springs were used to hang the elastomeric bearing in a vertical direction to get the free-free condition. Figure 3 shows the elastomeric bearing hanged from a fixed place using springs.
Figure 3. Hanged Elastomeric Bearing
Before the elastomeric bearing was hanged, there was a need to select and mark the point that was needed in order to place the accelerometer and to excite the impact hammer. For this testing, 62 points in total were picked based on the nodes from the finite element model. Every point had to be marked and numbered using a marker pen. Since the surface of the elastomeric bearing was rubber, hence it was difficult to place the accelerometer. So, a hard plastic board was cut to small pieces, and then the plastic pieces were glued to the rubber surface based on the selected points that had been marked. Figure 4 shows the marked elastomeric bearing.
Figure 4. Marked Elastomeric Bearing

45Dynamic Properties Of Elastomeric Bearing Via Finite Element And Experimental Modal Analysis
One PCB Piezotronics Impact Hammer Model 086C03 with a medium plastic tip was used for excitation while six accelerometers were used to record the responses. One accelerometer was fixed at one point as a reference point and the other five accelerometers were roving from every point. The force was excited by the impact hammer at one fixed point at the opposite direction of the reference point. When the impact signal received, the FRF of each hit was evaluated instantaneously. An average of 3 hits was calculated to reduce the differences between the hits. After each hit, the average was updated automatically and then the coherence function was calculated. A total of 62 points was measured and the responses were recorded by the accelerometer. All of the responses were then analysed by the PULSE B&K analyser to get the FRF. From the FRF, the dynamic properties which are the natural frequencies, mode shapes, and damping of elastomeric bearing were determined using the PULSE Reflex software. Figure 5 shows the full diagram of the experimental analysis.
Figure 5. Experimental Modal Analysis
RESULTS AND DISCUSSION
Figure 6 shows the frequency response functions (FRF) of the elastomeric bearing from the experimental modal analysis. This FRF was used to extract the results of the natural frequencies, mode shapes and damping of the elastomeric bearing in the experimental modal analysis. The results of natural frequencies and mode shapes for elastomeric bearing from both the finite element and the experimental modal analysis are summarized in Table 1. From the Table 1, different natural frequencies will produce different mode shapes of the elastomeric bearing. In the finite element modal analysis, the natural frequency for the first mode was 447.72 Hz and a mode shape for the first twisting deformation pattern was produced. For the second mode, the natural frequency was 617.07 Hz. This natural frequency produced the first bending deformation pattern of mode shape. No damping values were produced since in the finite element modal analysis, free vibration is considered as in equation (1).

46 Ahmad Idzwan Yusuf, et. al.
Figure 6. Frequency Response Functions (FRF) for Elastomeric Bearing
In the experimental modal analysis, two modes had been extracted from the FRF of the elastomeric bearing. For the first mode, the natural frequency was 370.33 Hz and the damping value obtained was 0.55%. This produced a mode shape for the first twisting deformation pattern. For the second mode, the natural frequency attained was 516.44 Hz with the value of damping was 0.66%. This natural frequency produced the first bending deformation patterns of mode shapes. Based on the Table 1, two mode shapes which are mode no 1 and 2 produced by the experimental modal analysis have shown a good agreement between the finite element modal analyses. It can be seen that only two modes had been successfully extracted from the experimental modal analysis. It is due to the complexity of the elastomeric bearing materials that consist of a combination of rubber layer and steel shim plate that are laminated together alternately.
Table 1. Comparison of Modal Analysis
Mode
No.
Finite Element Modal Analysis Experimental Modal Analysis
Natural Frequen-cy (Hz) Mode Shape Natural Frequen-
cy (Hz) Mode Shape
1 447.72 370.33

47Dynamic Properties Of Elastomeric Bearing Via Finite Element And Experimental Modal Analysis
2 617.07 516.44
Table 2 shows the relative error of natural frequencies from the finite element analysis and the experimental modal analysis. The relative error between the finite element and the experimental modal analysis for the first mode was 17.29% whereas for the second mode was 16.31%. It can be seen that the relative error of natural frequencies from the finite element analysis and the experimental modal analysis of the elastomeric bearing has shown quite large discrepancies for all modes. It is possibly due to the hyperplastic material of the rubber in the elastomeric bearing that has high nonlinearity and high damping capacity.
Table 2. Relative Error between Finite Element and Experimental Modal Analysis
Mode No. Finite Element (Hz) Experimental (Hz) Relative Error (%)
1 447.72 370.33 17.29
2 617.07 516.44 16.31
CONCLUSION
The finite element and the experimental modal analysis had been successfully performed in order to investigate the dynamic behaviour of elastomeric bearing. A good agreement was observed between the finite element and the experimental modal analysis results in terms of natural frequencies and mode shapes. The results will help to enhance the understanding of the dynamic properties of elastomeric bearing and thus, improving the design of elastomeric bearing.
ACKNOWLEDGEMENT
The authors acknowledge that the contribution by Mr. Mohd Fauzi Md Said from the Centre of Dynamic and Control of the Faculty of Mechanical, UiTM Shah Alam as essential and is greatly appreciated. A special thanks to Institute for Infrastructure Engineering and Sustainable Management (IIESM) for sponsoring the funding of this research. Elastomeric bearing was sponsored by Doshin Rubber Product (M) Sdn. Bhd.
REFERENCES
Chang, C. H. (2002). Modeling Of Laminated Rubber Bearings Using An Analytical Stiffness Matrix. International journal of solids and structures, 39(24), 6055-6078.
Derham, C., Kelly, J., & Thomas, A. (1985). Nonlinear Natural Rubber Bearings For Seismic Isolation. Nuclear engineering and design, 84(3), 417-428.
Doshin Rubber Product (M) Sdn.Bhd (2014). E-Catalog. Retrieved March 3, 2015, from http://www.doshinrubber.com/catalog/index.php
Fu, Z.-F., & He, J. (2001). Modal analysis: Butterworth-Heinemann.Imbimbo, M., & De Luca, A. (1998). FE Stress Analysis Of Rubber Bearings Under Axial
Loads. Computers & structures, 68(1), 31-39.

48 Ahmad Idzwan Yusuf, et. al.
Kelly, J. M., & Marsico, M. R. (2013). Tension Buckling In Rubber Bearings Affected By Cavitation. Engineering structures, 56, 656-663.
Koo, G.-H., Lee, J.-H., Lee, H.-Y., & Yoo, B. (1999). Stability Of Laminated Rubber Bearing And Its Application To Seismic Isolation. KSME International Journal, 13(8), 595-604.
Kumar, M. (2012). Analysis of Elastomeric Bearings in Compression. Unpublished Doctoral Dissertation, University at Buffalo, United State.
Norliyati, M. A., Azinahyati, A., & Norhayati, K. (2014). Compressive Strength Of Laminated Rubber Bearing Due To Different Temperature Exposure. Proceedings of the International Civil and Infrastructure Engineering Conference 2013. ISBN 978-981-4585-01-9.
Osgooei, P. M., Tait, M. J., & Konstantinidis, D. (2014). Three-Dimensional Finite Element Analysis of Circular Fiber-Reinforced Elastomeric Bearings under Compression. Composite Structures, 108, 191-204.
Othman, A. B. (2001). Property Profile Of A Laminated Rubber Bearing. Polymer Testing, 20(2), 159-166.
Pinarbasi, S., & Akyuz, U. (2004). Investigation of Compressive Stiffness of Elastomeric Bearings. 6th International Congress on Advances in Civil Engineering, Bogazici University October 6–8, 2004, Istanbul, Turkey.
Sulaiman, W. A. N. W., & Norliyati, M. A. (2013). Seismic Performance of Laminated Rubber Bearing Bridges Subjected to High Intensity Earthquake Time-History Loading. Proceedings of the International Civil and Infrastructure Engineering Conference 2013. ISBN 978-981-4585-01-9.
Warn, G. P., & Weisman, J. (2011). Parametric Finite Element Investigation Of The Critical Load Capacity Of Elastomeric Strip Bearings. Engineering Structures, 33(12), 3509-3515.
Xiaoqing, S., & Jacob, P. (1997). A Study on Experimental Modal Analysis for Seismic Response Assessment of Underground Facilities. Int. J. Rock Mech. & Min. Sci. 34:3-4, paper No. 307.
Yusuf, A. I., & Norliyati, M. A. (2014). Determination of Rayleigh Damping Coefficient for Natural Damping Rubber Plate Using Finite Element Modal Analysis. Proceedings of the International Civil and Infrastructure Engineering Conference 2014. ISBN 978-981-287-289-0.

49Malaysian Construction Research Journal; Vol. 19 | No.2 | 2016
EFFECT OF OIL SPILL ON HYDRAULIC PROPERTIES OF SOILHarris Ramli and Husnna Aishah ZabidiSchool of Civil Engineering, Engineering Campus, Universiti Sains Malaysia, 14300 Nibong Tebal, Penang, MALAYSIA.
AbstractOil contamination due to accidental spillage or leakage leads to the substantial destruction of the surrounding environment. It diffuses steadily into the subsurface and pollutes soil and aquifers. Hydrocarbon contamination not only impacts the features of the soil but also changes the physical characteristics of oil-contaminated soil. Therefore, this research presents the soil hydraulic properties of oil-contaminated and uncontaminated soil. Samples of silty and clayey soils were used in this study. The soil specimens were contaminated with diesel based on the optimum moisture content for the maximum dry density of the samples. Based on the results, the permeability of the contaminated soil was lower than that of the uncontaminated soil. The inclusion of diesel had an adverse impact on the geotechnical characteristics of the soil sample. As changes in physical properties can affect the mechanical properties of soil, proper precautions and soil evaluation are required when working with oil-contaminated soil to achieve the design requirement for the related construction project.
Keywords: Oil spill; hydraulic conductivity; soil compaction; silty soil; clayey soil
INTRODUCTION
The discharge of oil into the ground or surface water has gained global attention due to its possible threat to the ecosystem. The quantity of oil spilled varies from a small amount to a million or over a hundred million gallons. Oil spills due to accidents occur most frequently during transportation, or due to the leakage of underground storage or an oil pipeline blowing out, or even on a drilling site (Khamechiya et al. 2007). There are also cases when oil might have been spilled purposely, as happened during the Persian Gulf War in 1991 (Tajik 2014). However, these are rare cases that normally only occur during war. An even worse spillage scenario, if the contamination discharge occurs underground, such as in the case of leaking underground storage tanks. The leakage will remain unnoticed until a nearby drinking water well becomes contaminated (Nadim et al. 2000). Such cases usually occur with old underground tanks that were built without secondary containment (Harman et al. 2001) and are subject to poor maintenance.
Underground tanks usually stored gasoline, diesel and heating oil, which are immiscible and lighter than water. Underground tanks are preferred to above-ground storage tanks due to uncomplicated requirement in compliance with fire safety codes (Gayer 2012), good storage temperature (Berrios et al. 2012), and better appearance and space considerations. Among the millions of underground tanks worldwide, around 95 percent is made of steel and 5 percent of glass-reinforced plastic (McConnell 2007). Both types are vulnerable to weeping or leaking. Under natural fluctuating groundwater, steel is prone to corrosion, which may lead to leakage problems.
The proportions of contamination depend on the configuration of the contamination and properties of the soil (Fine et al. 1997). The impact oil spill may contribute negative effect on soil properties such as reduce pore space, saturated hydraulic conductivity and higher bulk density (Aboseda 2013). Hydraulic conductivity, K is an indication of being as velocity, which

50 Harris Ramli and Husnna Aishah Zabidi
is time period taken for the replacement made. As a result, the coefficient of permeability is governed by the time holding. By referring to the principal permeability equation, it has specified that K is influenced through the dimension of specimen and also duration of time. Subsequently, with the sustained dimension of specimen, time taken is in the consideration in determining the K. These stipulate that shorter time will consequence in higher K.
Hydraulic conductivity of soil is one of the most important soil physical properties. It is directly related to water, which the main component in the soil phase system; solid (soil), water and air. Changes of this physical property definitely would affect the mechanical properties of soil such as soil cohesion and friction angle as both physical and mechanical properties is directly related. In consequently, this will affect other geotechnical properties which very important during construction work such as groundwater seepage, soil compressibility and strength.
For construction projects on contaminated land, reclaimed brownfields, abandoned industrial facilities, factories, mines or other industrial waste sites, geo-environmental work is required prior to construction work. In projects that require geo-environmental work such as soil remediation, understanding the changes in the soil’s hydraulic properties due to contaminated liquid is very crucial. This is to ensure that the remediation work and the post-clean-up earthworks for the formation level can be done effectively and safely. As oil is one of the most widely used commercial chemicals that most frequently contaminates soil, compare to other chemicals, even on typical construction sites due to diesel spills; this study focuses on oil spills. Therefore, the objective of this study is to investigate the effect of oil spills on hydraulic conductivity with respect to variations in oil saturation.
MATERIALS AND METHOD
The main focus of this study is to investigate changes in hydraulic conductivity due to the present of oil in soil pores. The soil samples used in this study were taken from three different places in Nibong Tebal, Penang, Malaysia. The oil used in this study was commercially available diesel liquid. The properties of the diesel used in this study are: density of 0.846 g/cm3 (based on ASTM D-1298), kinematic viscosity of 5.8 mm2/s at 40 °C, and vapour pressure less than 1 hPa at 20°C (<0.75 mmHg).
Prior to the hydraulic conductivity of soil can be tested, the samples need to be classified, in order to choose the most suitable soil characteristic test. The classification test started with sieve analysis, performed according to (BS) 1377: part 2: 1990 for fine and coarse aggregates and the ASTM D422-63 standard for finer material.
The changes in water content can also alter the mechanical properties of a clay material. Therefore, the liquid limit test based on the BS 1377 standard, and the plastic limit test based on the ASTM D4318 standard were conducted on the soil to understand this change in mechanical properties. Based on the information obtained from sieve analysis, liquid limit and plastic limit tests, the soil classification group was determined by using the unified soil classification system (USCS) based on the ASTM D2487 standard of practice for the classification of soils for engineering purposes. The specific gravity of the soil was determined in accordance with the ASTM D854-92 standard test for specific gravity of solids by water pycnometer.

51Effect Of Oil Spill On Hydraulic Properties Of Soil
Once the soil had been classified, and its characteristics were identified, the permeability tests were conducted. Prior to these assessments, the maximum dry density of the sample was determined. The maximum dry density values of the sample are required in order to ensure that the samples prepared for the permeability could simulate the actual compacted soil at the site. The soil maximum dry densities were determined by using the modified proctor test based on the ASTM 1557 standard.
Since the soil samples contained percentages of clay and were classified as silty sand and clayed sand, falling head tests were conducted. Each type of soil sample was categorised into two categories and dried by oven. Then, prior to the permeability test, the dried soil samples were mixed thoroughly with diesel and water at specific optimum moisture content using compaction. The hydraulic conductivity results were obtained from this test. Based on the results, the effects of diesel oil on soil hydraulic conductivity were analysed.
RESULTS AND DISCUSSION
The purpose of this research was to investigate the effect of oil contamination on soil hydraulic properties. Prior to the permeability tests, the soils’ characteristics were tested to classify their type. The particle size distribution of the soil samples was tested, in addition to the necessary soil classification tests. Based on the Unified Soil Classification System (Figure 1), they were classified as silty sand and clayey sand. The basic properties of the soil are shown in Table 1.
Figure 1. Particle size distribution of soil samples

52 Harris Ramli and Husnna Aishah Zabidi
Table 1. Properties of soil samples
Soil TypeSpecific
Gravity
Plasticity
Index
Optimum Moisture content, w (%)
Maximum dry density (Mg/m3)
Silty Sand 2.35 12.9 17.5 1.70
Clayey Sand 1 2.28 27.8 18.5 1.60
Clayey Sand 2 2.40 28.7 13.9 1.85
Silt soil is generally very hard due to its tendency to form a crust. It is capable of being compacted when it is over tilled, which could reduce the capability of water to infiltrate it during wet conditions. In dry conditions, it acts as a hard material and is difficult to till. However, it is generally easy to till and can hold the greatest amount of water.
Clayey sand possesses great ability to move water from deep layers through capillary action. This type of soil can be easily captivated if it is filled with the correct amount of water. The soil risks becoming clods if the conditions are too dry or smearing if too wet.
In order to simulate the soil’s actual condition at the site, the maximum dry density or maximum dry unit weight were obtained prior to the permeability tests. This was to ensure that the samples were prepared for the permeability tests based on the maximum dry density. The maximum dry density of the soil sample is shown in Table 1, and the compaction curve is shown in Figures 2 – 4. The maximum dry density of the compacted soil mixed with diesel was 1.71 Mg/m3 for the silty sand, 1.60 Mg/m3 for clayey sand 1 and 1.85 Mg/m3 for clayey sand 2.
Figure 2. Compaction curve and zero air void curve (Sr = 100%) for Silty Sand

53Effect Of Oil Spill On Hydraulic Properties Of Soil
Figure 3. Compaction curve and zero air void curve (Sr = 100%) for Clayed Sand 1
Figure 4. Compaction curve and zero air void curve (Sr = 100%) for Clayed Sand 2
Figure 5 shows the hydraulic conductivity value, K, for the three soil samples, both uncontaminated (water mixed with soil) and contaminated (diesel mixed with soil), which were prepared based on the soil saturation of the water and optimum moisture content. The hydraulic conductivity of the uncontaminated silty sand was 9.85 x 10⁻⁹ m/s, versus 3.12 x 10⁻⁹ m/s when the soil was contaminated with oil (diesel content if 17.5% based on the optimum moisture content shown in Figure 2). Then, uncontaminated clayey sand 1 had a K value of 5.19 x 10⁻⁹ m/s, versus 1.32 x 10⁻⁹ m/s when the soil was contaminated with oil (diesel content of 18.5% based on the optimum moisture content shown in Figure 3). Lastly, for the uncontaminated clayey sand 2 prepared with moisture content of 13.9% (Figure 4), the hydraulic conductivity value was 5.79 x10⁻⁹, versus 0.23 x 10⁻⁹ m/s when the soil was contaminated with oil.

54 Harris Ramli and Husnna Aishah Zabidi
Figure 5. Hydraulic conductivity of water and oil variation of soil compacted at optimum moisture content
The results clearly show that the reduction of hydraulic conductivity, K, was consistent between the uncontaminated soil and the contaminated soil. This is because the ability of liquid to flow inside soil pores not only relies on the soil’s characteristics, but also on the properties of the liquid. This signifies that a soil tends to behave contrastingly if it is permeated by dissimilar fluids. In this study, the diesel fuel used possessed liquid material properties such as kinematic viscosity of 5.8 mm2/s at 40 °C and density of 846 kg/m3. Meanwhile, water has kinematic viscosity of 1.5 mm2/s at 40 °C and density of 1000 kg/m3.
Viscosity and permeability have the greatest impact on spill propagation because of their huge degrees of alteration across dissimilar fluids and soils. Reducing viscosity has the double consequence of increasing both the propagation rate and the infiltration rate, while decreasing the permeability tends to reduce the infiltration rate. Similar to Keller and Simmons’s (2005) study, the fluid properties meant that the density only contributed little variation, compared to the variation of viscosity.
Proper soil compaction is essential before any construction work can take place. It ensures that the site is ready for construction work and reduces subsequent settlement under working loads. Compaction also increases the shear strength of the soil. During soil compaction work, as water is added to the soil (at low moisture content), it becomes easier for the particles to move past one another during the application of the compacting forces. As the soil compacts, the voids are reduced, which causes the dry unit weight to increase. Initially, as the moisture content increases, so does the dry unit weight. As the state approaches the no air voids line, a maximum dry unit weight is reached, which is considered to be the most compacted condition of the soil. Standard construction practices would require the compacted soil to achieve at least 90% to 95% of this maximum dry unit weight.
In relation to soil compaction, water is known as the main agent that allows soil particles to glide between other particles to rearrange the soil pack, in order to achieve its maximum density. When compaction work is conducted on oil-contaminated soil, higher compaction

55Effect Of Oil Spill On Hydraulic Properties Of Soil
effort is required to obtain at least 90% maximum dry unit weight. This suggestion was based on results, which showed that oil content in soil reduces hydraulic conductivity. This is mainly due to the nature of oil and water, which are immiscible; thus, oil would reduce the water flow in the soil pores. This obstruction of water flow will also reduce the available water that the soil particles require in order to rearrange during compaction work. With the reduction of the maximum dry unit weight, the strength of the soil might also be indirectly reduced, due to oil contaminants in the soil.
Soil contamination can potentially alter the engineering characteristics and properties of soil; thus, it has extensive implications on supporting existing and proposed structures. Its consequence can include the structural and functional failure of existing structures; as a result, the contamination leads to dramatic increases in soil plasticity, reduces bearing capacity, increases settlement and prevents overflow of water. Moreover, the proposed project could have a minimised range or the project could become more expensive. Projects may become more expensive due to needing an extensive number of geotechnical and chemical analyses to determine the migration of the contamination, as well as the need for costly structure foundations to ensure stability, soil remediation costs, or application technologies.
CONCLUSION
A substantial laboratory experiment programme was conducted to investigate the effect of diesel oil contamination on the hydraulic characteristics of three different soil types. The samples were prepared based on the maximum dry density and optimum moisture content to simulate actual site conditions. The hydraulic conductivity values obtained for the Silty Sand were 9.85 x 10⁻⁹ m/s for water and 3.12 x 10⁻⁹ m/s for oil, while the Clayey Sand 1 had 5.19 x 10⁻⁹ m/s for water and 1.32 x 10⁻⁹m/s for oil, and finally the Clayey Sand 2 had 5.79 x 10⁻⁹ m/s for water and 0.23 x 10⁻⁹ m/s for oil. The results show that the permeability of the contaminated soil was lower than that of uncontaminated soil. The inclusion of diesel had an adverse impact on the geotechnical characteristics of the soil sample. As changes in physical properties can affect the mechanical properties of soil, proper precautions and soil evaluation are required when working with oil-contaminated soil to achieve the design requirement for the related construction project.
ACKNOWLEDGEMENTS
I would like to take this opportunity to express my deepest gratitude to Universiti Sains Malaysia for funded this research under Research University (RUI) grant scheme (Grant no. 1001/PAWAM/814261).
REFERENCES
Berrios, M., Martín, M.A., Chica, A.F. and Martín, A. (2012) Storage effect in the quality of different methyl esters and blends with diesel. Fuel, 91:119–125.
Braja M.Das (2010) Principle of Geotechnical Engineering, USA.BS 1377: Part 2: Clause 5 (1990) Determination of Plastic Limit and Plasticity Index, British
Standard Methods for Soils for Civil Engineering Purposes.BS 1377: Part 2: Clause 9 (1990) Determination of Particle Size Distribution, British Standard

56 Harris Ramli and Husnna Aishah Zabidi
Methods for Soils for Civil Engineering Purposes.Ewetola E.Abosede (2013) Effect of Crude Oil Pollution on some Soil Physical Properties.
Journal of Agriculture and Veterinary Science, 6(3):14-17.Fine P., Graber E.R., Yaron B. (1997) Soil Interactions with Petroleum Hydrocarbons: Abiotic
Processes. Soil Technology, 10:133-153.Geyer, W. (2012) Steel tanks: past, present and future, Steel Tank Institute, available at: https://
www.steeltank.com/Publications/PublicationsIndex/tabid/108/Default.aspx (accessed July 2012).
Harman, W.A., Allan, C.J., and Forsythe, R.D. (2001) Assessment of potential groundwater contamination sources in a wellhead protection area. Journal of Environmental Management, 62:271–282.
Keller J.M. and Simmons C.S. (2005) The Influences of Selected Liquid and Soil Properties on the Propagation of Spills Over Flat Permeable Surfaces, Department of Energy, US.
Mashalah Khamehchiyan, Amir Hossein Charkhabi, Majid Tajik (2007) Effect of Crude Oil Contamination on Geotechnical Properties of Clayey and Sandy Soil. Engineering Geology, 89(3-4):220-209.
McConnell, P. (2007) Global underground: the state of composite storage tanks. Reinforced Plastics, 51(6):26-27,29-31.
Nadim, F., Zack, P., Hoag, G.E., Liu, S., and Carley, R.J. (2000) Non-uniform regulations of underground storage tanks in the united states: call for a national-scale revision. Spill Science and Technology Bulletin, 6(5/6):341–348.
Tajik, M. (2004) Assessment of Geoenvironmental Effect of Petroleum Pollution On Coastal Sediments of Bushehr Province-Iran. M.Sc. Thesis, Tarbiat Moderas University. 97 pp.

57Malaysian Construction Research Journal; Vol. 19 | No.2 | 2016
PERFORMANCE TESTING ON RAM PUMP – AN AL-TERNATIVE SUSTAINABLE WATER SUPPLY SYSTEM FOR RURAL COMMUNITIES IN MALAYSIA Zuhairi Abd. Hamid1, Maria Zura Mohd. Zain1, Foo Chee Hung1, Mohamad Fazli Halim1, Wan Norhasiah Wan Bidin1, Icahri Hj. Chatta2 and Noor Azme Omar2
1 Construction Research Institute of Malaysia (CREAM)2 National Hydraulic Research Institute of Malaysia (NAHRIM)
Abstract Ram pump is a rather ‘mature’ technology as it has been used over the last two centuries with many variations to design and basic configurations have been tried. However, following the increasing awareness of the adverse impact of global warming and the needs of sustainable technology, interest in ram pump for water supply purpose has revived. Ram pump is perceived as an ideal sustainable technology as it makes use of the renewable energy source and ensures low running and maintenance cost. It is of great potential to be functioning as a simple and reliable pumping device in those hilly remote areas which are of no water supply coverage. This paper presents the performance test results of ram pump system, which was developed to be applied in Kampung Sungai Dua Olak, an indigenous people settlement situated in Bentong, Malaysia, for the establishment of a sustainable rural water supply system that is aimed to be replicated across other rural communities in the tropical region. The paper starts by drawing the framework for sustainable low-cost water supply system, followed by demonstrating the methodology, testing setup, and the results of a series of seven ram pump performance tests. It was found that ram pump could perform under different variations of water sources parameter. At the laboratory scale, it was confirmed that ram pump had its potential to provide an alternative means of water supply delivery system though not as efficient as conventional supply.
Keywords: Ram pump, sustainable water supply system, rural communities, performance testing, Malaysia
INTRODUCTION
The United Nations has long been addressing the global crisis caused by insufficient water supply. The crucial importance of water to many aspects of human health, development, and wellbeing had led to the inclusion of a specific water-related target in the Millennium Development Goals (MDGs). According to the MDGs Report 2012, 89% of the world’s population in 2010 was using improved drinking water sources including household connections, public standpipes, boreholes, protected dug wells, protected springs, and rainwater collections, as compared to 76% in 1990. If these trends are to continue, 92% of the global population will be covered by 2015. Nevertheless, there were still 783 million people (or 11% of the global population) remains without access to an improved source of drinking water in 2010, and it was estimated that 605 million people will still lack coverage in 2015. Unlike the urban population, where 96% used an improved drinking water source in 2010, coverage for rural populations is still lagging (81%), despite the international community has made advancements in filling this gap. Even where rural supply systems are developed, many are in disrepair or not functioning properly (Brikke and Bredero, 2003; Moe and Rheingans, 2006).
As a rapidly developing country, Malaysia has undergone major physical and economic changes in the past decades. The living standard of the country’s general population

58 Zuhairi Abd. Hamid, et. al.
has improved significantly through continuous socioeconomic and basic infrastructures development. One of the typical examples is the high proportion of population with access to piped water. In 2011, 94.4% of the country’s population has been supplied with piped water as compared to 90.9% in 2008 (Table 1). In certain states/areas such as Melaka, Labuan, and Kuala Lumpur, both urban and rural populations are even reported to have full access to piped water. However, the provision of basic amenities to settlements located in remote area is still a challenging task for the country. Infrastructure development in these areas such as piped water supply, electricity, toilet facility, garbage disposal service etc. continue to lag behind that of the general population, despite the government’s efforts and comprehensive rural development programmes.
Table 1. Percentage of population supplied with piped water by states, 2008 and 2011
Country/State/Area
Year2008 2011
Urban Rural State average Urban Rural State
averageMalaysia 96.5 85.3 90.9 96.8 90.1 94.4Johor 100.0 99.5 99.8 100.0 99.5 99.8
Kedah 100.0 95.0 97.0 100.0 96.3 98.2
Kelantan 56.3 53.2 54.2 56.9 57.4 57.3
Melaka 100.0 100.0 100.0 100.0 100.0 100.0
Negeri Sembilan 100.0 99.5 99.8 100.0 99.8 99.9
Pahang 98.0 89.0 93.0 100.0 96.0 98.0
Perak 100.0 98.9 99.5 100.0 99.2 99.6
Perlis 100.0 99.0 99.4 100.0 99.0 99.5
Pulau Pinang 100.0 99.6 99.9 100.0 99.7 99.8
Sabah 99.0 52.0 76.0 99.5 59.0 80.0
Sarawak 99.0 56.5 78.0 99.5 63.0 93.7
Selangor 100.0 99.0 99.9 100.0 99.5 99.8
Terengganu 98.5 82.0 90.4 98.8 92.8 95.8
W.P. Labuan 100.0 100.0 100.0 100.0 100.0 100.0(Data source: Department of Statistics Malaysia, 2012)
Among the rural population, indigenous peoples – Orang Asli are believed to be the most vulnerable group as most of their settlements located in remote areas. Findings from Mason and Arifin (2005) revealed that about 2% of the Orang Asli villages were located at the vicinity of existing townships, 61% in the outskirt of existing rural villages, and 37% were in the remote areas (Figure 1). In terms of water supply, in year 2000, only 44.5% of the Orang Asli housing units obtained treated piped water either inside the house or through shared piped water outside the house (Department of Statistics Malaysia, 2006). Meanwhile, as high as 55.5% of the housing units were still relying on rivers, rainwater, and deep wells as water sources for drinking, cooking, and washing (Department of Statistics Malaysia, 2006). Given that water supply is an important factor for daily living and most of the Orang Asli are still experiencing a relatively lower living standard, a sustainable and low-cost water supply solution is deemed necessary.

59Performance Testing on Ram Pump – An Alternative Sustainable Water Supply System for Rural Communities in Malaysia
With this respect, the Construction Research Institute of Malaysia (CREAM) embarks on applying ram pump as a water supply system alternative for remote Orang Asli settlements. This rural water supply project is part of a bigger R&D initiative – “Sustainable Village and Affordable House Using Solar Energy for Rural Communities and Remote Areas”, pioneered by the Construction Industry Development Board Malaysia (CIDB) and CREAM, together with other Malaysian construction industry stakeholders, aims to integrate both the dual aims and principles of affordability and sustainability through implementing a green, practical, competitive, and reliable method of construction. The rural water supply project discussed herein was initiated and being tested in Kampung Sungai Dua Olak, an Orang Asli settlement situated in Bentong, Pahang (Figure 2 and Figure 3). The research team included engineer, planner, surveyor, and local community, sought to establish a rural water supply system that will not only meet the sustainability criteria but also can be replicated across other rural communities in the tropical region.
(Data source: Mason and Arifin, 2005)Figure 1. Distribution of Orang Asli villages
Figure 2. Location of case study area - Bentong, Pahang from the map of Peninsular Malaysia

60 Zuhairi Abd. Hamid, et. al.
Figure 3. Kampung Sungai Dua Olak, Bentong, Pahang
FRAMEWORK FOR SUSTAINABLE AND REPLICABLE RURAL WATER SUPPLY SYSTEM
The endurance of a water supply system and its ability to adapt to changing consumer needs or preferences for water quality and quantity, are the defining features of water system sustainability (Carter et al., 1999). The framework for sustainable and replicable rural water supply systems as suggested by Silva et al. (2000) in Figure 4 is adopted in this rural water supply project.

61Performance Testing on Ram Pump – An Alternative Sustainable Water Supply System for Rural Communities in Malaysia
(Source: Adapted from Silva et al., 2000)Figure 4. A framework for sustainable and replicable rural water supply systems
There are various interrelated criteria underlying the features of a sustainable water supply system to avoid the system’s poor performance and periodic failure. In terms of environmental criteria, the system must be tailored to the climatic or environmental conditions of the region in which it is located, and must not deteriorate water or ecosystem surrounding it. In terms of economic criteria, one should ensure the technical, administrative, and financial capacities are properly in-placed for effective operation over time and at a reasonable cost. Technical capacity refers to the availability of equipment for operating the system, people who can be trained to operate equipment, and the quality of construction of the system (Katz and Sara, 1998); while the administrative and financial capacities ensure the system being operated and maintained successfully in the long run (Montgomery et al., 2009), especially for communities that do not have the technical capacity on their own for extensive system repair and performance monitoring. Finally, with the direct participation of local communities, the systems are more likely to be more sustainable than systems that are imposed by the government or donor organizations (Katz and Sara, 1998; Carter et al., 1999; Gleitsmann et al., 2007; Barnes and Ashbolt, 2010) because communities engaged in the planning process are more likely to select supply options that they are willing and able to operate and maintain. Good engineering is only one part of sustainable, economic and equitable water supply system. Without complete community involvement, even a water supply system that is technically perfect is likely to encounter serious problems and may fail altogether. Only by investing sufficient time and care in producing a widely acceptable design, the water supply system can be very appropriate to

62 Zuhairi Abd. Hamid, et. al.
rural areas and be capable of village-level operation and maintenance.
RAM PUMP AS SUSTAINABLE WATER SUPPLY SYSTEM ALTERNATIVE
To ensure meeting the multiple sustainability criteria-social, technical/ administrative/ financial, and environmental – as well as the replicability of the water supply project for other small communities dispersed in rural area, ram pump is chosen as the sustainable water supply system alternative. The selection of ram pump in facilitating this rural water supply project is mainly due to its geographical, economical, and technical suitability as explained bellow.
A ram pump (Figure 5), or hydraulic ram, is a water pump operated with hydropower that relies on the momentum of a relatively large amount of moving water to lift a smaller quantity of water uphill without using fuel or electricity. Wherever a fall of water can be obtained, the ram pump can be used as a comparatively cheap, simple, and reliable means of raising water to considerable heights. However, it is restricted to three main applications: (i) lifting drinking water from springs in valleys to settlements on higher ground; (ii) pumping drinking water from clean streams that have significant slope; and (iii) lifting irrigation water from streams or raised irrigation channels. With its simplicity and reliability, the ram pump has been in used for over two centuries in many parts of the world before the electrical power and the internal combustion engine become widely available (Tessema, 2000). Towards the end of the 19th century, ram pump was gradually replaced as it was thought to have no relevance in the age of national electricity grids and large scale water supplies powered by fossil fuels and electricity. However, following the increasing awareness of the adverse impact of global warming and the needs of sustainable technology, interest in ram pump for water supply purpose has revived. Ram pump is perceived as an ideal sustainable technology as it can operate automatically, makes use of the renewable energy source, imparts no harm to the environment, and ensures low running cost and minimal maintenance. Its potential to be functioning as a simple and reliable pumping device in those hilly remote areas is of particular large as it makes households and farms less depended on unpredictable rainfalls by supplying a continuous flow of water. A typical example is the AID Foundation International in the Philippines, who won an Ashden Award for their work in developing ram pumps that could be easily maintained for use in remote villages.

63Performance Testing on Ram Pump – An Alternative Sustainable Water Supply System for Rural Communities in Malaysia
Figure 5. The ram pump prototype assembly
While ram pumps come in a variety of shapes and sizes, they all have the same basic components. A ram pump normally comprises an adjustable impulse valve, delivery valve, a pressure vessel to smooth out the pulsating delivery flow, and an anchorage or cradle. The mechanism of ram pump is extremely simple; with only two moving parts, namely the waste valve (denoted as “A”) and the delivery check valve (denoted as “B”) (Figure 6). It has a cyclic pumping action that produces their characteristic beat during operation, which can be divided into three phases: “acceleration”, “delivery”, and “recoil”. Initially, the waste valve is open and the delivery valve is closed. Water flows down the drive pipe under the force of gravity and flows out through the waste valve. As it flows, the water starts gaining its speed. When a desired speed is reached, the force of the running water closes the waste valve, forcing the water through a delivery valve into an air chamber. When the pressure increases in the air chamber, the delivery valve closes and the pressurized water is forced out of the pump into a delivery pipe. Since the water is being forced uphill from the source, the flow slows and subsequently reverses, causing the delivery valve closes. The waste valve reopens with the drop in pressure causing the process to begin again. In this way, water from a spring or stream in a valley can be pumped to a village or irrigation scheme on the hillside.
Since a ram pump works by transferring the power of a falling drive flow to a rising delivery flow with the water hammer effect, the pump design and the configuration of each of its components are of crucial in ensuring the pump’s efficiency and reliability, as well as limiting the amount of maintenance required. According to Tessema (2000), the following factors need to be considered in ram pump system design: (i) area suitability (head and flow rate); (ii) flow rate and head requirement; (iii) floods consideration; (iv) intake design; (v) drive system; (vi) pump house location; (vii) delivery pipes routing; and (viii) distribution system. The major design aim is to achieve a large head of water between the drive tank and pump, while using a short drive pipe to connect them. Hence, to obtain a good delivery flow, the efficiency of the pump should be high, there should be a large drive flow, and the delivery head should not be too many times the drive head. Apart from that, the drive pipe should be of constant diameter and material, and should be as straight as possible. Where bends are necessary, they should be smooth, large diameter curves. Failure to deliver sufficient water may be due to improper adjustment of the waste valve, having too little air in the pressure vessel, or simply attempting to raise the water higher than the level of which the ram is capable.
B

64 Zuhairi Abd. Hamid, et. al.
Figure 6. How a ram pump works
B
B
B
A
A
A

65Performance Testing on Ram Pump – An Alternative Sustainable Water Supply System for Rural Communities in Malaysia
RAM PUMP PERFORMANCE TEST
While there are some examples of successful ram pump installation in developing countries, these applications to date merely scratched at the surface of their potential (Tessema, 2000). This is mainly due to the lack of wide spread local knowledge in the design and manufacture of ram pumps. With this respect, a series of performance tests on ram pump were conducted to ensure the prototype ram pump is practicable for the rural water supply project in Kampung Sungai Dua Olak. There were totally seven tests representing different scenarios to be conducted, with which the objectives are (i) to test the performance of ram pump system with capacity of 40 meters – a total maximum head and 30m3 of water per day (equal to supplying water to 10 houses model); (ii) to test the ram pump supply by river/reservoir/ lakes/dam flow simulation; (iii) to identify optimum sustainable water flow; and (iv) to investigate maintenance input during the performance test. These seven testing scenarios are as shown in Table 2.
Table 2. List of Ram Pump Testing
Test Description Type of Data
Pre-Commissioning Testing The test served as a calibration calibrating test for the prototype pump. Visual
Observation
Pre-Dam Simulation Testing
The test aims to find out exact setting of inverter pump flow rate as to determine minimum workable flow rate for selected size of prototype pump.
Visual Observation
Dam Simulation Testing
The test aims to evaluate whether the prototype pump would require a small dam for the effective and continuous operations during on-site application.
Flow Data
Pre-River Simulation Testing
The test aims to confirm that prototype pump could be operated without the presence of Dam Tank.
Visual Observation
River Simulation Testing
The test aims to confirm whether the prototype pump could be operated without the assistant of Dam Tank at certain inverter setting. Flow Data
The 24 hours Simulation Testing
The test aims to find out whether the prototype pump could operate continuously exceeding 6 hours, 12 hours, and 24 hours. This test will be executed after the River Simulation Testing had completed.
Flow Data
Free Flow simulation Testing
The test aims to determine whether the flow rate of the inverter setting to be applicable as the selecting factors of the prototype pump at actual site condition.
Flow Data
TESTING SETUP AND METHODOLOGY
The set up components for the performance tests include: (i) electrical supply pump with inverter system; (ii) prototype ram pump; (iii) water tanks (as water supply and receiving tank); (iv) PVC pipeline system; (v) flowmeter; and (vi) valves and joints. Electrical supply pump with inverter system was used for supplying water to the Ram Pump with certain flow rate. The flow rate was measured by two units of flow meter, which were factory-calibrated and located before/after the ram pump. Since the testing was carried out in scenarios, two methods were used to simulate different flows: the by-passed method (denoted as M1) was used for river flow simulation, while the static tank method (denoted as M2) was used for dam simulation (Figure 7). Detailed explanation on all the seven tests was given in the following sections.

66 Zuhairi Abd. Hamid, et. al.
Figure 7. Schematic diagram for ram pump performance test
Pre-Commissioning Testing
Pre-Commissioning Testing means to ensure pump system operates smoothly. As such, no testing data was recorded during the test run. Water was supplied to the prototype pump with flow rate around 0 to 10m3/hr for about 5 to 10 minutes, and the pump’s optimum operation was observed. Once the prototype pump was started and squirting water consistently, valve located after the prototype pump was opened slowly. The prototype pump was allowed to perform under a stable pressure for 5 to 10 minutes of each flow rate setting. The inverter setting was then increased to observe which setting make the ram pump shut down (unperformed), consistent performed, and strongly performed. When the prototype pump had performed at consistent inverter setting, it was run for few hours continuously as to oversee if any breakdown occurs to the prototype pump.
Pre-Dam Simulation Testing
Pre-Dam Simulation Testing is a tuning test for the Pre-Commissioning Testing, which is to determine the minimum workable flow rate for the prototype pump and the designed factors at the application site. The test was started by operating the prototype pump in a steady performance at the inverter, with initial setting at 39 Hertz. The pump’s performance was recorded every hour for eight hours continuously until it stopped operating. The prototype pump is then restarted with reducing setting from 39 Hertz to 30 Hertz with one (1) Hertz interval. Similar to the Pre-Commissioning Testing, no testing data was recorded during the test run.
Dam Simulation Testing
Dam Simulation Testing was conducted by setting the inverter at 39.0 Hertz. Water level in the dam tank was observed after a few hours of prototype pump’s continual operation. The whole procedures were repeated with inverter setting at 38.0 Hertz until 37.8 Hertz. Flow data was recorded during the test run.

67Performance Testing on Ram Pump – An Alternative Sustainable Water Supply System for Rural Communities in Malaysia
Pre-River Simulation Testing
A constant flow rate was identified (33.0 Hertz) through trial test by controlling valves and the inverter was set at this constant flow rate. Inverter pump setting was then repeated at both more than and less than this constant flow rate to observe anything happens to the ram pump system.
River Simulation Testing
The aim of River Simulation Testing was to confirm whether the prototype pump could be operated without the assistant of dam tank at certain inverter setting. The constant flow rate of the inverter was set at 43Hertz. Valves were adjusted to ensure only one way flow to the Ram Pump produce. The inverter setting was then repeated at more than 43 Hertz until 50 Hertz and any observation was recorded.
24-hour Simulation Testing
The 24-hour simulation testing was conducted after the completion of the river simulation testing, to find out whether the designed Ram Pump could operate continuously exceeding 6 hours, 12 hours and 24 hours. The setting of this test is similar to the one applied in the river simulation testing.
Free Flow Simulation Testing
The test aims to determine whether the flow rate of the inverter setting to be applicable as the selecting factors of the prototype pump at actual site condition. Rating curve between inverter setting and flow rate measured was produced as a reference for actual site application. Results were recorded when the flow rate was stable. Based on standard operating procedure of current meter in-situ measurement and its tolerant factors, a period of 300 second was selected for each test.
RESULTS
A total of 17 tests were carried out within three-month time. Among the constraints during the testing were (i) modification of pre-commissioning test due to unstable pressure at receiver tank, and (ii) rectification of inverter pump due to damage to rubber bush coupling. Flow data was recorded for all test scenarios, except for Pre-Commissioning Testing and Pre-Dam Simulation Testing, as these two test scenario aims to ensure the entire system operates smoothly. Results of the seven testing scenario are shown in the following sections.
Results from Pre-Commissioning Testing
Through observation, it was found that insufficient pressure at the prototype pump’s pressure vessel can cause start-up problem. As such, small valves needed to be installed few inches after ram pumps to ensure pressure built up produced constant readings before the valve turn to fully open. Besides, the angle of the incoming water to ram pump was found to be much suitable if it was set between 10 to 15 degrees. It was because as observed, the prototype

68 Zuhairi Abd. Hamid, et. al.
pump could not perform smoothly or encounter a sudden stop if the angle of incoming water to the prototype pump was set below and above the suggested range, respectively. Also, water was found not able to be delivered to receiving tank without the presence of pressure chamber. The existing design, thus, needed to be modified by adding a pressure chamber before receiving tank, in order to build up pressure along the delivery pipeline to ram pump.
Results from Pre-Dam Simulation Testing
Water level at Dam Tank was found decreasing slowly with inverter setting less than 37.8 Hertz, resulting less supplied to Ram Pump and eventually stopped the prototype pump from continual operation. However, the pump system was found to be able to operate continuously for eight hours with inverter setting at 37.8 Hz and above. Table 3 shows how the prototype pump operates and the impact of water level at dam tank with varying inverter setting. At setting of 37.8 Hertz, the small retention water structure or dam was filled with small spill over. At this point, Ram Pump had maintained its pressure built up in the pressure vessel at 1.5 bars (30 psi) and delivering 145 m3 water to receiving tank in four hours. The testing processes were repeated for 3 days to reconfirm flow rate performance. The Ram Pump had performed intermittently from range of 36.0 to 37.0 Hertz. From here, one can conclude that the optimum supply flow rate for the Ram Pump was at 37.8 Hertz, and the size of the pressure vessel was the main factor to influence the optimum supply flow rate.
Table 3. Pre-Dam Simulation Testing At Different Setting of Inverter Pump.
Inverter Pump Set-ting (Hz) Impact of Water Level At Dam Tank Ram Pump Operation Status
30.0 Decreased Not Operating
30.5 Decreased Not Operating
31.0 Decreased Not Operating
31.5 Decreased Not Operating
32.0 Decreased Not Operating
32.5 Decreased Not Operating
33.0 Decreased Not Operating
33.5 Decreased Not Operating
34.0 Decreased Not Operating
34.5 Decreased Not Operating
35.0 Decreased Not Operating
35.5 Decreased Not Operating
36.0 Decreased Not Operating
36.5 Decreased Not Operating
37.0 Decreased Not Operating
37.5 Decreased Not Operating
37.8 Constant In Operation
38.00 Constant In Operation
39.00 Constant In Operation

69Performance Testing on Ram Pump – An Alternative Sustainable Water Supply System for Rural Communities in Malaysia
Result from Dam Simulation Testing
From the testing, it was found that certain setting of inverter pump will cause decrease in dam’s water level and subsequently interrupting the pump’s performance. However at setting range from 36.0 to 37.0 Hertz, the pump could operate intermittently for some time. This could be considered as an early warning sign of the pump system failure and indicated that the pump required certain amount of detention water above it, as to give constant water pressure to the pump. This testing scenario proved that the pump system required a small size of retention water structure or mini dam, with a minimum capacity of 2.3 m3 for its continuous operation. Table 4 shows the results for Dam Simulation Testing scenario.
Table 4. Summary result of dam simulation testingInverter Pump Setting Flow Rate
(Hertz)Ram Pump Operation Status
Flow Rate
(m3/h)33.0 Not Operating No Data
33.5 Not Operating No Data
34.0 Not Operating No Data
34.5 Not Operating No Data
35.0 Not Operating No Data
35.5 Not Operating No Data
36.0 Intermittent Operation 151.16
36.5 Intermittent Operation 151.16
37.0 Intermittent Operation 161.7
37.8 In Operation 151.9
38.0 In Operation 137.8
39.0 In Operation 137.0
Results from Pre-River Simulation Testing
It was found that the pump was able to operate without the assistance of retention water with some complicated valves controlling procedures. The pump can deliver certain amount of water consistently without the support from the dam tank with the inverter pump setting from 34.4 Hertz to 40 Hertz.
Results from River Simulation Testing
Table 5 summarizes the results of River Simulation Testing. At the inverter pump setting from 36m3/h to 38.4m3/h, the average of incoming water supply to and from the pump became deteriorated. The pump’s delivery was also found deteriorated even at the highest (40m3/h) and lowest setting (34.4m3/h) of inverter pump. This led to the conclusion that optimum water flowrate to the pump would be a requirement. However, due to the river flows fluctuation, the pump system is recommended to have water retention structure in order to ensure continuous performance.

70 Zuhairi Abd. Hamid, et. al.
Table 5. Summary of river simulation testing resultsInverter Pump Set-
ting Flow Rate
(m3/h)
Average Incoming Water Supply to Ram Pump Flowrate (litre/sec.)
Average Delivery Water Supply from Ram Pump
Flowrate (litre/sec.)
Percentage Differenc-es between Incoming
and Delivery
34.4 2.022 0.079 3.89%
36.0 2.007 0.144 7.17%
37.6 1.933 0.103 5.30%
38.4 1.880 0.065 3.47%
39.2 1.852 0.072 3.87%
40.0 1.784 0.096 5.40%
Results from 24 Hours Simulation Testing
The pump system could operate for more than 6 hours, 12 hours and 24 hours continuously. No breakdown was found after 24 hours, and no heat development that could lead to component ware and tare. The pump system can successfully supply 11.647 m3 water per day, or 0.5 m3/hours, or 0.1388 litre/second. As recorded by the pressure vessel, the pressure decreased by 20 % (from 10 psi to 8 psi) at the end of the testing. Knowing that the water supply (165m3
with flowrate of 1.91 litre/second) to ram pump delivery (0.14 litre/second) flowrate ratio was 1.91:0.14, where the pump was delivery 7% of water from the incoming water, one can conclude that the pump requires 4.5 hours to fill in 2,270 litre seized of water tank if it is located near to a river with flowrate 1.91 litre/second. From these findings, the number of selected sized Ram Pump could be determining by calculation. Table 6 shows the Ram Pump Calculator to be used for determining number of Ram Pump for certain residential usage.
Table 6. Ram Pump Calculator
Resident Population/ Water Demands or Water Supplied 1000 m3 for 100 people
Water should be received by Ram Pump according to ratio formulation (1:10). 10,000 m3
Adjustment For Water Supply In Time of 12 hours or 720 min-utes or 43,200 seconds (Begin 7.00PM to 7.00AM)
The River/ Dam Flowrate Requirement:
= 1000 m3/ 12 hours or 720 minutes
or 43,200 seconds
= 83 m3/h or 1.39 m3/m or
0.023 m3/s 23 l/s
No. of Ram Pump Required based on early finding [Early finding: 5 hours at 7.5 l/s supplying 145 m3 for a unit of Ram Pump at 1.5 Bar or 30 psi]
Option 1: Three (3) unit of Ram Pump at 1.5 Bar or 30psi
Option 2: One (1) unit Ram Pump at 3.0 Bar or 60psi
Results from Free Flow Simulation Testing
In this testing, the ranges of the inverter pump were set from 36 Hertz to 50 Hertz. Due to the distance from the inverter pump to flow meter (before Ram Pump), the amount of the losses were found around 27% - 34%. However, there were only small reading differences

71Performance Testing on Ram Pump – An Alternative Sustainable Water Supply System for Rural Communities in Malaysia
between the flowmeter reading and the inverter pump manufacturer calculation (Figure 8). As such, this free flow testing result can be used as references for acceptable tolerance between inverter pump setting and real flow meter measurement. The summary of free flow testing result was as shown in Table 7.
Figure 8. Findings of inverter pump setting and flowrate measurement
Table 7. Summary of Free Flow Simulation Testing
Inverter Pump (Hertz)
Volume (litre)
Test Period (second)
Flowrate Recorded (litre/s)
Flowrate Calculated (litre/s)
Percentage Differences
36 1703 300 5.7 8.0 29%
37 1756 300 5.9 8.2 28%
38 1819 300 6.1 8.4 27%
39 1843 300 6.1 8.7 30%
40 1858 300 6.2 8.9 30%
41 1900 300 6.3 9.1 31%
42 2027 300 6.8 9.3 27%
43 1966 300 6.6 9.5 31%
44 1956 300 6.5 9.8 34%
45 2009 300 6.7 10.0 33%
46 2032 300 6.8 10.2 33%
47 2099 300 7.0 10.4 33%
48 2115 300 7.1 10.7 34%
49 2199 300 7.3 10.9 33%
50 2201 300 7.3 11.1 34%

72 Zuhairi Abd. Hamid, et. al.
CONCLUSION
Ram pump is a relatively ‘mature’ technology as many variations to its basic configuration have been tried over the last two centuries. One might think that no further significant change was likely in the ram pump itself and in the system in which it is used. However, there are changes occurring in both pumping needs and in materials. Hence, performance test of ram pump is essential as it ensures trouble-free running and maintenance during the application. This study presents the performance test results of ram pump system, which is to be applied in Kampung Sungai Dua Olak, an indigenous people settlement situated in Bentong, Malaysia, for the establishment of a sustainable rural water supply system.
Throughout the study, the prototype ram pump was found to be able to perform under different variations of water sources parameter. The amount of water to be supplied was in a ratio of 1:10; where 1,000 m3 of water will be delivered if there are 10,000 m3 of water go through the pump. In order to ensure continuous and stable water supply to the ram pump, a dam with suitable size has to be constructed before the ram pump. Among the constraints during the testing are: (i) modification of pre-commissioning test due to unstable pressure at receiver tank; and (ii) rectification of inverter pump due to damage to the rubber bush coupling. As such, the selection of material and engineering application for each component of ram pump should be further studied, in terms of the functionality, efficiency, reliability, safety, and durability. Failure to deliver sufficient water may due to improper adjustment of the valves, having too little air in the pressure vessel, or simply attempting to raise the water higher than the level of which the ram is capable. It is not uncommon for an operating ram to require occasional restarts. The cycling may stop due to poor adjustment of the waste valve, or insufficient water flow at the source. Hence, tuning and the adjustment of valves and bolts need to be done more frequently. The need for maintenance is expected to become more often as the delivery head becomes greater.
At the laboratory scale, the ram pump was found to be potential in providing an alternative means of water supply delivery system though not as efficient as conventional supply. However, its success to be functioning as a sustainable water supply system for rural communities depends very much on issues other than technical and design consideration. Concerns should be given on the ram pump maintenance, such as who is available to carry out the maintenance, in which way the necessary maintenance is arranged, is there anybody living locally that can have a look at the ram at least once every week, or is there a technician from somewhere else who can come only at intervals of several weeks. In the case of a larger coverage of rural areas, a network application system of ram pump can be established for the ease of operation and monitoring, provided that further study is carried out on its installation, start up procedure, and troubleshooting i.e. sedimentation which is expected to reduce the pump efficiency.
ACKNOWLEDGEMENT
The authors acknowledge the support given by the Construction Industry Development Board (CIDB) for the provision of funding in undertaking the present study. Acknowledgements are also given to the National Hydraulic Research Institute of Malaysia (NAHRIM) for providing testing equipment and facility.

73Performance Testing on Ram Pump – An Alternative Sustainable Water Supply System for Rural Communities in Malaysia
REFERENCES
Barnes, R. and Ashbolt, N. (2010). Development of a Planning Framework for Sustainable Rural Water Supply and Sanitation: A Case Study of a Filipino NGO. International Studies of Management & Organization, 40(3), 78 – 98.
Brikke, F. and Bredero, M. (2003). Linking technology Choice with Operation and Maintenance in the Context of Community Water Supply and Sanitation. Geneva: World Health Organization and IRC Water and Sanitation Centre.
Carter, R.C., Tyrell, S.F. and Howsam, P. (1999). The Impact and Sustainability of Community Water Supply and Sanitation Programmes in Developing Countries. Water and Environment Journal, 13(4), 292 – 296.
Department of Statistics Malaysia. (2012). Compendium of Environment Statistics. Department of Statistics Malaysia, Kuala Lumpur.
Department of Statistics Malaysia. (2006). Profile of Orang Asli in Peninsular Malaysia. Department of Statistics of Malaysia, Kuala Lumpur.
Gleitsmann, B.A., Kroma, M.M. and Steenhuis, T. (2007). Analysis of a rural water supply project in three communities in Mali: Participation and sustainability. Natural Resources Forum, 31(2), 142 – 150.
Katz, T. and Sara, J. (1998). Making Rural Water Supply Sustainable: Recommendations from a Global Study. UNDP-World Bank Water and Sanitation Program. Washington D.C.
Mason, R., & Arifin, S. M. (2005). The ‘Bumiputera policy’: Dynamics and dilemmas. Special issues of Orang Asli. Journal of Malaysian Studies, 21(1 & 2), 315-329.
Moe, C. and Rheingans, R.D. (2006). Global Challenges in Water, Sanitation and Health. Journal of Water and Health, 4(Supp1), 41 – 57.
Montgomery, M.A., Bartram, J. and Elimelech, M. (2009). Increasing Functional Sustainability of Water and Sanitation Suppplies in Rural Sub-Saharan Africa. Environmental Engineering Science, 26(5), 1017 – 1023.
Silva, F.O.E., Heikkila, T., Souza Filho, F.A. and Silva, D.C. (2012). Developing sustainable and replicable water supply systems in rural communities in Brazil. The International Journal of Water Resources Development, 29(4), 622 – 635.
The Millennium Development Goals Report 2012. (2012). The United Nations, New York. Tessema, A.A. (2000). Hydraulic ram pump system design and application. ESME 5th Annual
Conference on Manufacturing and Process Industry, September 2000.


75Malaysian Construction Research Journal; Vol. 19 | No.2 | 2016
FLEXURAL STRENGTH PROPERTIES OF KENAF FIBRE REINFORCED PLASTIC (KFRP) COMPOSITE WITH ADDITION OF NANO CALCIUM CARBONATESNik Nurfadzlin Nik Azizan1, Zakiah Ahmad2, Akmalina Ab. Rahman1 and Adnie Baharin1
1 Faculty of Civil Engineering, UniversitiTeknologi MARA (UiTM), Shah Alam, 40000, Selangor.2 Institute of Infrastructure Engineering and Sustainable Management (IIESM), UniversitiTeknologi
MARA (UiTM) Shah Alam, 40000, Selangor.
AbstractNatural fibre reinforced plastic composite (NFRPC) has been explored by many researchers. However, application of NFRPC is still limited due to low performance compared to synthetic FRPC. As the strength of the composite depends on two main materials, which are fibres and resin, therefore, this study investigated the possibility of enhancing the kenaf fibre reinforced plastic (KFRP) composites by modifying the resin with the addition of different percentages of calcium carbonate (CaCO3) nanoparticles (0%, 2%, 5%, 7% and 10%). Kenaf fibres were treated with sodium hydroxide (NaOH). For epoxy resins, the flexural properties were the highest when added 7% of nano CaCO3. The flexural strength for untreated KFRP has the highest value at 2% of nano CaCO3 and at 7% for the treated KFRP composite. Meanwhile the Modulus of Elasticity (MOE) for both treated and untreated KFRC are the highest when added with 7% nano CaCO3 and there was no much different in the MOE values.
Keywords: calcium carbonates, flexural properties, kenaf fibre reinforced plastic composite, nanoparticles
INTRODUCTION
Since olden times, natural fibres have been used in the preparation of composites. There are many applications of natural fibres which are growing in many sectors such as automobiles, furniture, packaging and construction. The accessibility of natural fibres as well as the ease of process ability is an attractive feature, which earns it a desirable replacement for synthetic fibres that are potentially toxic (Alhuthali et al. 2012).
Subsequently, extensive studies on preparation and properties of thermoplastic and thermosetting composites filled with jute, bamboo, sisal, coir, hemp, flax, and others has been undertaken by many researchers. Furthermore, plant fibres have many advantages over conventional glass fibres or carbon fibres which include renewable, environmental friendly, low cost, lightweight, high specific mechanical performance (Zhang et al. 2005). Despite of the advantages, natural fibres too have poor water resistance, low durability, and poor fibre/matrix interactions.
In improving the properties of fibre reinforced plastic composites, many investigations have focused on the treatment of fibres to improve the bonding between the fibre and resin matrix (Yousif & Ku, 2012). Alkali treatment is a commonly used technique of surface modification in order to improve interfacial adhesion between a natural fibre and a polymeric matrix (Khalid et al., 2010). According to them, the purposes of NaOH treatment onto the fibres were to remove lignin, pectin, wax substances, and natural oils that cover the surface of the fibre cell wall. Paul et al. (2008) explored the effect of NaOH concentrations on the thermo physical properties of the banana fibre composites and they found that thermo

76 Nik Nurfadzlin Nik Azizan, et. al.
physical properties of the composites improved by 2% when treated with 10% NaOH. Edeerozey et al. (2007) investigated the effect of different concentrations of NaOH on the morphological changes of kenaf fibre sand the results exhibited better mechanical properties than untreated fibres with 6% concentration of NaOH.
The properties of fibre reinforced plastic composites depend on the properties of the individual components (matrix and the fibre) as well as and the interaction between the matrix and the fibre. The insufficient of interfacial interactions, poor wettability can lead to porosity, internal strains and environmental degradation. Epoxy resin on its own is considered brittle and need to be toughened, and the natural fibres have lower properties. Hence, to enhance the performance of natural fibre polymer composites, the properties of the resin can be modified. One of the ways to improve the resin properties is by nanoparticles addition.
Many works have been reported on the incorporation of nano particles into thermo sets such as epoxy. There are several types of nanoparticles that are commonly used by several researchers, for example nano-clay (Dewan et al. 2012; Alamri and Low, 2013; Fu et al. 2013; Ferreira et al. 2013), nano-silica (Khater et al. 2012; Jumahat et al. 2010), nano-rubber (Yu et al. 2008) as well as nano CaCO3(Paliwal, 2012). However, the studies on the incorporation of dispersed nano-particles into natural fibre plastic composites are still limited. Therefore, this study investigated the flexural strength properties of kenaf fibre reinforced plastic composite with the addition of different percentages of nano CaCO3 into the epoxy resin.
EXPERIMENTAL
Materials
The main materials used in this study are kenaf fibres supplied by National Kenaf and Tobacco Board Malaysia. The resin used is two parts resin; the base resin, Asasin 8505 and the hardener, Asahard 8505, supplied by ASACHEM (M) SDN. BHD, Malaysia. Calcium carbonates nanoparticles of size 20 nm supplied by R&M Chemicals. There were 5 percentages of nanoparticles used; 0%, 2%, 5%, 7% and 10%.
Preparation of fibres
Two types of fibres were used; treated and untreated fibres. For untreated fibres, the fibres were used as received. The fibres were combed first as to make sure the fibres were straight and untangles between the strands, as well as to remove impurities in the fibres.
For treated fibres, the fibres were first immersed in 0.06M NaOH solution by mixing the solution with distilled water for approximately 3 hours under room temperature. They were then rinsed with distilled water to remove impurities. Then, the fibres were sun-dried for 24 hours before they were further dried in an oven for another 24 hours under the temperature of 100oC. Finally the fibres were also combed to straighten the fibres. Both types of fibres were cut into 250 mm length and weighed according to the design mix as shown in Table 1.

77Flexural Strength Properties of Kenaf Fibre Reinforced Plastic (KFRP) Composite with Addition of Nano Calcium Carbonates
Table 1. Mix design of the compositeWeight
(g)CaCO3
(%)CaCO3
(g)Epoxy + Hardener
(g)
Kenaf fibre untreated
16.7 0 0 32.01
16.7 2 0.97 32.01
16.7 5 2.44 32.01
16.7 7 3.41 32.01
16.7 10 4.87 32.01
Kenaf fibre treated
16.7 0 0 32.01
16.7 2 0.97 32.01
16.7 5 2.44 32.01
16.7 7 3.41 32.01
16.7 10 4.87 32.01
Figure 1. Flexural specimens of epoxy reinforced with different percentages of CaCO3
nanoparticles
Resin preparation
Nano CaCO3 was added into epoxy and mixed well using Daihan Scientific Ez HTS05 stirrer for approximately 20 minutes. Before adding the nanoparticles into the epoxy, the epoxy was first stirred for 5 minutes. Next, hardener with ratio 2:1 (epoxy: hardener) was added and stirred for another 3 minutes. Nano CaCO3 was then added into the mixture and then stirred for 12 minutes. The mix design of the resin is shown in Table 2.
Table 2. Design mix of epoxy resinNano CaCO3 (%) Nano CaCO3 (g) Epoxy + Hardener (g)
0 0 21.34
2 0.43 21.34
5 1.07 21.34
7 1.49 21.34
10 2.13 21.34
Preparation of resin specimens
The mix design for the CaCO3 nanoparticles fitted epoxy resin is shown in Table 2. The resin which was prepared as in C was poured into a mould (250 mm x 20 mm x 4 mm). Before pouring the resin into the mould, Freekote 700-Nc was applied onto the mould’s surface as prevention from the specimen sticking onto the mould. This is also to ease the process of demoulding the specimens. The specimen then was left to cure for about 24 hours in the room temperature. When cured, the specimens were cut into plates of 80 mm length, 12.5 mm wide and 4 mm thick according to BS EN ISO178:2003. Three (3) replicates were prepared for each types of resin as shown in Figure. 1.

78 Nik Nurfadzlin Nik Azizan, et. al.
Preparation of KFRP composites specimens
Figure 2. The bundle of fibres were put into the mould for seven layer
Figure 3. Flexural test of set up
The composites were prepared using a stainless steel mould which is rigid enough to prevent deformation of the specimens. It was manufactured in such a way that the specimens will be easily taken out from the mould without any damage. Before placing the kenaf fibres into the mould, the mould was coated again with Freekote 700-Nc. The weight of kenaf fibres used was measured by the volume ratio of 70:30. (Kenaf: epoxy resin). For each mix, the kenaf fibres were divided into seven portions. They were placed into the mould layer by layer as shown in Figure. 2. After the first layer bundle placed into the mould, the epoxy resin was poured into the mould in zig-zag pattern over the fibres. The pattern was used as to ensure that the epoxy resin covers all the fibres thoroughly(Aziz et al. 2005). The process was then repeated until all the seven bundles of fibres have been placed. There is no resin was applied at the top and bottom of the fibre bundles. Thus, to get a uniform thickness of a sample, a spacer of 4mm thickness was placed into the mould. The sample was then left in between preheated plates in about 5 minutes before applying pressure of 50 bars.
Flexural testing for nanoparticles modified epoxy
In adherence to BS EN ISO178:2003, a three point test to measure the flexure strength of the nanoparticles modified epoxy is done. A three-point load was applied to test specimens using INSTRON 100 kN test machine at a crosshead speed of 2mm/min. the width, thickness, length of support span and speed value were keyed in into the Instron machine computer. The support span is 50 mm. Fig 3 shows the flexural test-set up. The flexural strength was determined following equation (1).
σ= 3FL (1) 2bd2
F is load at the fracture point in Newton, σ is the stress in outer fibres at midpoint in MPa, L is the length of support span in millimetres, b and d is the width and thickness of the sample, respectively.

79Flexural Strength Properties of Kenaf Fibre Reinforced Plastic (KFRP) Composite with Addition of Nano Calcium Carbonates
RESULTS AND DISCUSSION
Flexural strength and modulus of elasticity of epoxy resinwith different per-centages of calcium carbonate nanoparticles.
Based on Table 3, it can be seen as general, the addition of CaCO3 nanoparticles increases the flexural strength and the modulus of elasticity of the resin up to 7% and then decreases.
Table 3. Flexural strength and modulus of elasticity of epoxy resin with different percentages of calcium carbonates nanoparticles
Sample Percentage of Calcium Carbonates Nanoparticles (%)
Flexural Strength (MPa)
Modulus of Elasticity (MPa)
Epoxy Resin
0 3.9 135.9
2 33.2 789.5
5 51.6 2018.9
7 90.6 4036.9
10 50.5 2163.1
Epoxy resin with the addition of 7% CaCO3 achieved the best flexural strength and modulus of elasticity, which is 90.6 MPa and 4036.9 MPa, respectively. The flexural strength of epoxy resin with 7% CaCO3 improved tremendously (2223% for flexural strength and 2870% for MOE) compared to the control specimens. The flexural strength and MOE decreases when 10% of the nanoparticles were added to the resin. However, its flexural strength and MOE values are still higher than the control specimen. It can be clearly seen that by adding the nanoparticles, the flexural strength of the epoxy itself has increased.
Flexural strength and modulus of elasticity of KFRP composites with different percentages of calcium carbonate nanoparticles
The comparison of flexural properties between the untreated and the treated KFRP nano-composites is shown in Table 4. For the untreated KFRP, it is clear that the specimens with 2% CaCO3 have the highest flexural properties with the flexural strength of 156.2 MPa. The addition of 2% CaCO3 has increased the flexural strength of the untreated KFRP by 61.5% compared to the control specimens. The flexural strength declines as the percentages of the nanoparticles declines. However, the flexural strength of untreated KFRP composites with 5%, 7% and 10% CaCO3 are still higher than the control specimens.
The modulus of elasticity of untreated KFRP increases until the addition of 7% of CaCO3 nanoparticles and decreases at 10% content of CaCO3 nanoparticles. The modulus of elasticity untreated KFRP with 7% CaCO3 improved by 327.5% compared to the control specimens.

80 Nik Nurfadzlin Nik Azizan, et. al.
Table 4. Flexural strength and modulus of elasticity of kenaf fibre reinforced plastic composites with different percentages of calcium carbonates nanoparticles.
Sample Percentage of Calcium Carbonates Nanoparticles (%)
Flexural Strength (MPa)
Modulus of Elasticity (MPa)
Untreated KFRP composites
0 96.7 4013.9
2 156.2 16738.9
5 130.1 17131.8
7 116.8 18965.8
10 111.8 15013.5
Treated KFRP composites
0 60 1415.3
2 124.2 16332
5 153.4 18036
7 155.1 19051
10 66.2 6038
For treated KFRP nano-composites, the trend is different with the untreated KFRP nano-composites. It is observed that the highest flexural strength is reached when 7% of CaCO3 added to the specimen. It is higher than the control specimens by 158.5%. The flexural strength decreases when 10% of CaCO3 added.
The modulus of elasticity of treated KFRP is the highest with the addition of 7% of CaCO3 nanoparticles. It decreases when 10% of CaCO3 nanoparticles added. The modulus of elasticity treated KFRP with 7% CaCO3 is 1246.1% higher compared to the control specimens. Both untreated and treated samples with no addition of nano CaCO3 exhibit the lowest flexural properties. This proved that the incorporation of the nanoparticles enhances the flexural properties of KFRP composites.
Figure 4. Flexural strength of epoxy resin and KFRP composites with different percentages of
CaCO3 nanoparticles.
Figure 5. Modulus of elasticity of epoxy resin and KFRP composites with different percentages
of CaCO3 nanoparticles.
When comparison was made between the untreated and treated KFRP nano composites, there was not much difference in the flexural strength of untreated KFRP nano-composite with 2% CaCO3 and treated KFRP with 7% CaCO3. Meanwhile, there was not much different in the MOE values for 7% CaCO3 treated and treated KFRP composites. Hence the addition of 7% CaCO3 is the optimum addition.

81Flexural Strength Properties of Kenaf Fibre Reinforced Plastic (KFRP) Composite with Addition of Nano Calcium Carbonates
Modes of failure of epoxy resin
Figure 6. Failure modes of modified epoxy resin with different percentages of CaCO3 nanoparticles; (a) control, (b) 2%, (c) 5%, (d) 7 %, (e) 10%
As displayed in Figure. 6, the control specimen did not fail in brittle manner as the specimens have reached the elastic limit. Meanwhile, for the other epoxy reinforced with CaCO3 nanoparticles samples, it was found that the specimens failed earlier than the control specimens. All the specimens broke into two parts, except for epoxy resin with the addition of 2% of CaCO3.
Based on this result, it shows that the addition of CaCO3 nanoparticles does not improve the ductility of the resin but it improves the strength and stiffness of the resin. The modified epoxy resin specimens are still very brittle. This can be improved by adding fibres into the epoxy resin specimens.
Modes of failure of untreated KFRP composites
Figure 7. Failure modes of untreated KFRP composites with different percentages of CaCO3 nanopar-ticles; (a) control, (b) 2%, (c) 5%, (d) 7 %, (e) 10%

82 Nik Nurfadzlin Nik Azizan, et. al.
Following flexural properties, the failure mode of the untreated KFRP nano-composites (Figure. 7) were analysed. The entire specimens bend at the centre after load applied to them. However, there are slightly different in the fracture pattern based on the crack lines between each types of specimen. The crack lines of the fracture surfaces of the specimens with the addition of CaCO3 are quite smooth showing that the specimens experiences brittle failure, as compared to the control sample.
Modes of failure of treated KFRP composites
Figure 8. Failure modes of treated KFRP composites with different percentages of CaCO3 nanoparticles; (a) control, (b) 2%, (c) 5%, (d) 7 %, (e) 10%
Similar characteristics and behavior was shown in the Figure. 8 on the treated KFRP nano-composites. All of the specimens also crack at the the center as load applied to the specimens. It can be observed that the specimens with CaCO3 have less severe failure than the control sample. However the crack lines on all types of specimens are in the ziz-zag pattern which indicates more ductile failure. The fracture surface of the control sample has deeper zig-zag pattern.
CONCLUSION
The following conclusions can be drawn from this study:
• For epoxy resin, the flexural strength properties increases up until 7% addition of nano CaCO3 and then decreases when added 10% CaCO3.
• The flexural properties of epoxy resin with CaCO3 are higher than the control specimens.• For KFRP nano-composite, the flexural strength properties for untreated KFRP
composites with 2% of nano CaCO3 has similar properties with treated KFRP composites with 7% nano CaCO3.
• The MOE of untreated and treated KFRP composites are the highest when added with 7% CaCO3.
• Both untreated and treated KFRP with the addition of nano CaCO3 have higher flexural properties compared to the control specimens.
• Failure modes of treated KFRP nano-composites indicate better ductility compared to

83Flexural Strength Properties of Kenaf Fibre Reinforced Plastic (KFRP) Composite with Addition of Nano Calcium Carbonates
untreated KFRP nano-composites.• At this point of investigation, the optimum addition of CaCO3 is 7% and treated KFRP
nano-composites with 7% CaCO3 are considered the recommended composites.
ACKNOWLEDGMENT
This research was financially supported by the Research Acculturation Grant Scheme, Ministry of Education Malaysia and is greatly acknowledged. We also like to thank all the technical staff in Composite Laboratory, Faculty of Mechanical Engineering for their assistance. Gratitude also extended to the final year students who helped in manufacturing the samples.
REFERENCES
Alhuthali, A., Low, I. M., & Dong, C. (2012). Characterisation of the water absorption, mechanical and thermal properties of recycled cellulose fibre reinforced vinyl-ester eco-nanocomposites. Composites Part B: Engineering, 43(7), 2772–2781. http://doi.org/10.1016/j.compositesb.2012.04.038
Annie Paul, S., Boudenne, A., Ibos, L., Candau, Y., Joseph, K., & Thomas, S. (2008). Effect of fibre loading and chemical treatments on thermophysical properties of banana fibre/polypropylene commingled composite materials. Composites Part A: Applied Science and Manufacturing, 39(9), 1582–1588. http://doi.org/10.1016/j.compositesa.2008.06.004
Aziz, S., Ansell, M., Clarke, S., & Panteny, S. (2005). Modified polyester resins for natural fibre composites. Composites Science and Technology, 65(3-4), 525–535. http://doi.org/10.1016/j.compscitech.2004.08.005
Dewan, M. W., Hossain, M. K., Hosur, M., & Jeelani, S. (2012). Thermomechanical properties of alkali treated jute-polyester/nanoclay biocomposites fabricated by VARTM process. Journal of Applied Polymer Science, 4110–4123. http://doi.org/10.1002/app.38641
Dixit, S., & Verma, P. (2012). The effect of hybridization on mechanical behaviour of coir/sisal/jute fibres reinforced polyester composite material. Research Journal of Chemical Sciences …, 2(6), 91–93. Retrieved from http://www.isca.in/rjcs/Archives/vol2/i6/15.ISCA-RJCS-2012-069_Done.pdf
Edeerozey, A. M. M., Akil, H. M., Azhar, A. B., & Ariffin, M. I. Z. (2007). Chemical modification of kenaf fibres. Materials Letters, 61(10), 2023–2025. http://doi.org/10.1016/j.matlet.2006.08.006
Ferreira, J. A. M., Borrego, L. P., Costa, J. D. M., & Capela, C. (2013). Composites : Part B Fatigue behaviour of nanoclay reinforced epoxy resin composites. COMPOSITES PART B, 52, 286–291. http://doi.org/10.1016/j.compositesb.2013.04.003
Jumahat, a., Soutis, C., Jones, F. R., & Hodzic, a. (2010). Effect of silica nanoparticles on compressive properties of an epoxy polymer. Journal of Materials Science, 45(21), 5973–5983. http://doi.org/10.1007/s10853-010-4683-1
Khalid, M., Ismail, A. F., Ratnam, C. T., Faridah, Y., Rashmi, W., & Al Khatib, M. F. (2010). Effect of radiation dose on the properties of natural rubber nanocomposite. Radiation Physics and Chemistry, 79(12), 1279–1285. http://doi.org/10.1016/j.radphyschem.2010.07.002
Nagalingam, R., Sundaram, S., & Retnam, B. S. J. (2010). Effect of nanoparticles on tensile, impact and fatigue properties of fibre reinforced plastics. Bulletin of Materials Science,

84 Nik Nurfadzlin Nik Azizan, et. al.
33(5), 525–528. http://doi.org/10.1007/s12034-010-0080-2Paliwal, M. (2012). An Experimental Investigation of Tensile Strength of Glass Composite
Materials With Calcium Carbonate, 6(2), 303–309.Yousif, B. F., & Ku, H. (2012). Suitability of using coir fibre/polymeric composite for the
design of liquid storage tanks. Materials & Design, 36, 847–853. http://doi.org/10.1016/j.matdes.2011.01.063
Yu, S., Hu, H., Ma, J., & Yin, J. (2008). Tribological properties of epoxy/rubber nanocomposites. Tribology International, 41(12), 1205–1211. http://doi.org/10.1016/j.triboint.2008.03.001
Zhang, M., Rong, M., & Lu, X. (2005). Fully biodegradable natural fibre composites from renewable resources: All-plant fibre composites. Composites Science and Technology, 65(15-16), 2514–2525. http://doi.org/10.1016/j.compscitech.2005.06.018

85Malaysian Construction Research Journal; Vol. 19 | No.2 | 2016
THE EFFECT OF USING GGBS AND FOAM ON THE MECHANICAL PROPERTIES OF UNFIRED COAL ASH FOAM BRICK
Mohamad Ezad Hafez Mohd Pahroraji1, Hamidah Mohd Saman2, Mohamad Nidzam Rahmat3 and Kartini Kamaruddin2
1 Faculty of Architecture, Planning and Surveying, Universiti Teknologi MARA, 94300 Kota Samarahan, Sarawak, Malaysia
2 Faculty of Civil Engineering, Universiti Teknologi MARA, 40450 Shah Alam, Selangor, Malaysia3 Faculty of Architecture, Planning and Surveying, Universiti Teknologi MARA, 40450 Shah Alam, Selangor, Malaysia
AbstractCoal ash is an industrial by-product and significant to be utilized as raw material for brick fabrication as substitution to the existing widely used depleting non-renewable natural resources i.e. clay and sand. Furthermore, widely used common binding materials i.e. lime and Portland cement are considered as the non-environmental friendly materials which eventually could damage the environment with its continuous exploitation and its manufacturing process. Alternatively, ground granulated blastfurnace slag (GGBS), which is another industrial by-product from steel manufacturing process could be used as replacement to lime and Portland cement. In this study, coal ash from coal-fired thermal power plant was used as the raw material for the fabrication of brick specimens. As for the binder, Hydrated Lime-activated GGBS (HL-GGBS) and Portland cement-activated GGBS (PC-GGBS) were used at 30% with ratio 20:10, 15:15, and 10:20 to stabilize the coal ash. PC-GGBS system was established for comparison to HL-GGBS system. The amount of water was 30%. Foam at various percentages was injected into the mix for weight reduction. Steel mould size of 215mm x 102.5mm x 65mm was used to shape the brick. The brick specimens were wrapped with cling film and air cured for 48 hours. The compressive strength, ambient density, flexural strength, water absorption and salt attack resistance tests were conducted. Overall, the results indicated that brick specimens incorporating HL-GGBS system with or without foam have achieved better value when compared to the traditional clay and sand brick. However, PC-GGBS system shows higher value when compared to the HL-GGBS system.
Keywords: Fly ash; Bottom ash; Hydrated lime; Portland cement; Ground granulated blastfurnace slag; Foam; Brick
INTRODUCTION
In Malaysia, clay and sand brick were currently being widely used as major building components in construction sector. These materials have been produced from locally available depleting non-renewable natural resources that potentially causing damage to the environment due to their continuous exploitation and during its fabrication processes. Hence, the use of industrial by-product as main raw material is found to be significant for the development of alternative construction components as substitution to the traditional materials (Pappu et al., 2007). It is a challenge and opportunity for the researchers to continuously finding way to utilize the potential industrial by-products into various useful construction materials. There were efforts from previous researchers who have reported positive result in the use of various industrial by-products to produce brick. However, among all the industrial by-products that available worldwide in massive amount and constantly produced is the coal ash which constitutes of fly ash and bottom ash. This ash was produced from the coal-fired electric thermal power plant. The fly ash was captured using the electrostatic precipitator, while bottom ash was obtained from the bottom of the furnace due to heavier solid particles formed. Throughout the world, approximately more than 65% of fly ash produced from coal-

86 Mohamad Ezad Hafez Mohd Pahroraji, et. al.
fired power plant were disposed in landfills (Pradeep, 2011). Due to the increase in landfill costs, limited land available and current interest in sustainable development, the utilization of coal ash has become a great concern. In Malaysia, approximately 1,200 Megawatt or 20% of National electricity are supplied by the thermal power plant using coal as the fuel. The Sultan Abdul Aziz Shah electrical power generator in Kapar, Selangor uses 100 tons of coal per hour to generate electricity for the national grid. It produces about 15 to 20 tons Pulverized Fuel Ash (PFA) per hour (Khairul et al., 2007). The state government of Sarawak is also planning to build more coal-fired thermal power generation plants. This is as back-up to the existing energy sources for the state to complement its hydro power generation to meet high demand of energy intensive industries especially in the Sarawak Corridor of Renewable Energy (SCORE) due to the estimated total of one billion tons of coal reserve in Mukah-Balingian region (“Awang Tengah: Coal-fired power plants needed,” 2010). This measure could increase the production of coal ash in the future. Overall, Malaysia is using approximately about 11.2 million tons of coal per year and produced over 2 million tons of coal ash annually. However only small percentage was utilized. The remain of the ashes were sent for disposal to lagoons or ponds (Kolay and Kismoor, 2009). Study by many researchers has reported on the utilization of fly ash as main raw material for brick production (Chindaprasirt and Pimraksa, 2008; Cicek and Tanriverdi, 2007; Freidin, 2002, 2007; Freidin and Motzafi-Haller, 1999; Kayali, 2005; Lingling et al., 2005). However, there is paucity of published work on the combination use of fly ash and bottom ash as the main raw material incorporating HL-GGBS and PC-GGBS as the binder. There is also less evidence on the research effort carried out in development of a lightweight bricks using industrial by-product (Rahmat et al., 2010). Therefore, this research focus on the utilization of coal ash from coal-fired thermal power plant as the main raw material, stabilize using HL-GGBS and PC-GGBS system as the binder and incorporation of foam for weight reduction in the fabrication of unfired coal ash foamed brick. The effect of binding system ratio and the effect of the increase addition of foam to the properties of the brick were investigated.
MATERIALS AND METHODS
Materials
Prior for the fabrication of brick specimens, the raw materials were procured and used as received from the manufacturer/supplier without any prior treatment. The main raw material used in this study was fly ash and bottom ash. The fly ash used was produced from Sejingkat coal-fired thermal power plant in Sarawak. The bottom ash was collected from Sultan Salahuddin Abdul Aziz Shah Power Plant in Klang, Selangor. Prior to mixing, the bottom ash was dried in the oven at 105 °C for 24 hours. In this study, the quantity of fly ash used was higher than the bottom ash. The fly ash amount used in this study was 60% and bottom ash was 10% out of total dry material. This is because of the production ratio of fly ash is higher at approximately 80% when compare to bottom ash at 20% from the total production of coal ash at the power plant. The determination of the chemical compositions for the raw materials were carried out using wavelength dispersive X-ray fluorescence (XRF) Spectrometer model Bruker S8 Tiger and the result is shown in Table 1.

87The Effect Of Using GGBS and Foam on The Mechanical Properties of Unfired Coal Ash Foam Brick
Table 1. Chemical composition of fly ash (FA), bottom ash (BA), hydrated lime (HL), ground granulat-ed blastfurnace slag (GGBS) and Portland cement (PC)
ParameterPercentage (%)
FA BA HL GGBS PC
SiO2 48.56 59.04 0.18 29.99 18.66
Al2O3 19.56 15.53 0.09 11.42 3.82
Fe2O3 5.82 10.22 0.13 0.32 2.86
CaO 3.35 0.70 57.54 40.72 64.76
K2O 2.93 1.34 0.03 0.35 0.23
MgO 1.84 0.22 1.99 5.13 1.79
Na2O 0.88 0.09 0.02 0.20 -
TiO2 0.88 0.76 0.01 0.49 0.14
P2O5 0.30 0.05 0.02 - 0.10
BaO 0.15 0.03 - 0.08 -
SO3 0.14 0.04 - 2.10 3.59
SrO 0.09 0.02 0.02 0.07 0.02
MnO 0.08 0.27 0.02 0.22 0.08
ZrO2 0.05 0.06 - 0.03 -
Cr2O3 0.02 - - - -
Rb2O 0.01 - - - -
Cl - - 0.02 - 0.01
In accordance to ASTM C618-08a (ASTM, 2008), the fly and bottom ash is categorized as Class F base on its chemical composition in which the sum of silicon dioxide (SiO2), aluminium oxide (Al2O3) and ferric oxide (Fe2O3) exceed 70%. Class F fly and bottom ash are unstable in terms of the ability to bind due to less composition of calcium oxide (CaO). Therefore, stabilizer is required. GGBS was used as the stabilizer to facilitate fly and bottom ash in the binding process during the fabrication of the bricks. The supply of GGBS was sourced from YTL Cement Technical Centre. Hydrated lime (HL) from Brite Tech Corp. Sdn. Bhd. and Portland cement (PC) Tasek Corp. Berhad were selected as the activator to GGBS.
Figure 1. Particle size distribution of fly ash (FA), bottom ash (BA), hydrated lime (HL), ground granu-lated blastfurnace slag (GGBS) and Portland cement (PC)
Hence, the binding system used to stabilize the brick comprises of HL-activated GGBS (HL-GGBS) and PC-activated GGBS (PC-GGBS). Foaming agent used was synthetic type (MEYCO SLF-30) supplied by EcoBlocks Enterprise. The traditional fired clay and sand

88 Mohamad Ezad Hafez Mohd Pahroraji, et. al.
bricks were purchased from the local hardware store and underwent the mechanical properties test procedure for comparison. The tabulation of particle grain size distributions for fly ash, bottom ash, hydrated lime, Portland cement and GGBS were obtained by dry sieving method as per guideline provided by BS 1377-2:1990 (BSI, 1990) using sieve analysis apparatus and the result is shown in Figure 1. The specific gravity of fly ash, bottom ash, hydrated lime and GGBS was determined as per guideline provided by BS 1377-2:1990 (BSI, 1990) : Determination of particle density using small pyknometer method. The specific gravity value was 2.41 for fly ash, 2.26 for bottom ash, 2.40 for hydrated lime, 2.90 for GGBS and 3.21 for Portland cement.
Mixing and preparation of brick specimens
Prior to commence of casting, the steel mould was cleaned for smooth surface by using air compressor and applied with oil. The series of mixture proportions and percentage of material used is shown in Table 2.
Table 2. Mixture proportions series in the first stage of experimental programme
Mix
code
Main Raw Material Binder Foam
(%)
Water
(%)Bottom ash (%)
Fly ash (%)
(HL-GGBS) or (PC-GGBS) (%)HL PC GGBS
HL 10 60 30 - - 0 30
PC 10 60 - 30 - 0 30
GB 10 60 30 0 30
LG-1-0 10 60 10 - 20 0 30
LG-2-0 10 60 15 - 15 0 30
LG-3-0 10 60 20 - 10 0 30
PG-1-0 10 60 - 10 20 0 30
PG-2-0 10 60 - 15 15 0 30
PG-3-0 10 60 - 20 10 0 30
LG-1-25 10 60 10 - 20 25 30
LG-2-25 10 60 15 - 15 25 30
LG-3-25 10 60 20 - 10 25 30
PG-1-25 10 60 - 10 20 25 30
PG-2-25 10 60 - 15 15 25 30
PG-3-25 10 60 - 20 10 25 30
LG-1-50 10 60 10 - 20 50 30
LG-2-50 10 60 15 - 15 50 30
LG-3-50 10 60 20 - 10 50 30
PG-1-50 10 60 - 10 20 50 30
PG-2-50 10 60 - 15 15 50 30
PG-3-50 10 60 - 20 10 50 30
LG-1-75 10 60 10 - 20 75 30
LG-2-75 10 60 15 - 15 75 30
LG-3-75 10 60 20 - 10 75 30
PG-1-75 10 60 - 10 20 75 30

89The Effect Of Using GGBS and Foam on The Mechanical Properties of Unfired Coal Ash Foam Brick
Mix
code
Main Raw Material Binder Foam
(%)
Water
(%)Bottom ash (%)
Fly ash (%)
(HL-GGBS) or (PC-GGBS) (%)HL PC GGBS
PG-2-75 10 60 - 15 15 75 30
PG-3-75 10 60 - 20 10 75 30
LG-1-100 10 60 10 - 20 100 30
LG-2-100 10 60 15 - 15 100 30
LG-3-100 10 60 20 - 10 100 30
PG-1-100 10 60 - 10 20 100 30
PG-2-100 10 60 - 15 15 100 30
PG-3-100 10 60 - 20 10 100 30
For all of the mix series, the content of fly ash and bottom ash amount was fixed at 60% and 10% respectively. The total percentage amount of binder content for both HL-GGBS and PC-GGBS systems were fixed at 30%. The variations in the mixes were the binder percentage content ratio of 10:20, 15:15, 20:10 and the percentage content of foam used was designated at 0%, 25%, 50%, 75% and 100%. The amount of water was 30% constant by total weight of dry material. Pan mixer was used for the mixing of the materials. This is because pan mixer could generally provide convenience access for visual inspection, monitoring and hand stir adjustment to ensure homogeneous blend of materials. The bricks were produce using soft mud method with foaming technique which require high amount of water and forming the shape using steel mould size of 215mm x 102.5mm x 65mm. All materials were weighed using digital balance. During the mixing process, dry materials were placed in the pan mixer and mixed for one (1) minute until homogeneous. Water was poured in gradually until all the materials were uniformly mixed. Mixing continues for 10 minutes for the materials to properly blend before injecting foam into the mix slurry using NCT foam generating machine. The ratio of foaming agent to water was 1:30. The mixing continues for the foam to properly blend into the mix slurry. Then the slurry was poured into the steel mould. The brick specimens were transported and placed at drying area for 48 hours before the mould could be removed. After removal from the steel mould, the brick specimens were wrapped using several layers of cling film and kept at storage rack for air curing for 7, 28 and 56 days before the compressive strength test.
Test methods
The compressive strength of the brick specimens were determined in accordance to BS EN 772-1 (BSI, 2011a). The test was carried out by using ELE compressive strength test machine with maximum load capacity of 1,500kN running at a pace rate of 2.5kN/s. The load is applied to the bed face of the masonry brick sample with the dimension of 215 x 102.5mm2. This method has been done among other researchers as well (Algin and Turgut, 2008; Kayali, 2005; Oti et al., 2009). The compressive strength is calculated by dividing the maximum load with the applied load area of the sample. The ambient density of the brick specimens were determine in accordance to AS/NZS 4456.8 (AS/NZS, 2003). The results were derived by dividing the mass with volume. The flexural strength of the brick specimens were determined in accordance to ASTM C67 (ASTM, 2011). The test was carried out by using IPC Universal Testing Machine (UTM-1000) running at pace rate of 0.067kN/s using three point bending method. The determination of water absorption was referred to BS EN 772-21 using immersion method in cold water for 24 hours (BSI, 2011b). The salt attack

90 Mohamad Ezad Hafez Mohd Pahroraji, et. al.
resistance of the brick sample were determined in accordance to AS/NZS 4456.10 (AS/NZS, 2003). The test was carried out through exposure of the specimens to soaking and drying in sodium sulphate solution for 15 cycles.
RESULT AND DISCUSSION
Class F fly and bottom ash contains high SiO2 to promote strength, but with less contain of CaO in the composition, they requires stabilizer to facilitate in the binding process. Traditional binder such as hydrated lime and Portland cement often used as the stabilizer due to high possession of CaO in both materials. However, hydrated lime and Portland cement were considered as non-environmental friendly materials that eventually could damage the environment due to the continuous exploitation and also in the manufacturing processes. Hence, hydraulic binder i.e. GGBS which is a by-product from steel manufacturing process was found suitable to be used as stabilizer and replacement to hydrated lime and Portland cement because of high contain of SiO2 and CaO in the composition. However, GGBS on its own has only slow cementitious properties in which it requires an alkali to activate and accelerate these properties (Higgins, 2005). Since hydrated lime and Portland cement could provide the necessary alkali, their utilization was inevitable but with reduce amount. In this study, hydrated lime (HL) and Portland cement (PC) were used to provide the necessary alkali to activate the GGBS. Therefore, the binding systems used were HL-activated GGBS (HL-GGBS) and PC-activated GGBS (PC-GGBS).
First stage of experimental programme
In the first stage of experimental programme, compressive strength and density of brick specimens were determined and the result obtained is shown in Table 3. Two hundreds and ninety seven (297) brick specimens from thirty three (33) mixes proportion were tested. For each curing days, three (3) identical specimens were prepared and the average results were taken.
Table 3. Results for compressive strength and density
Mix
Code
Binder
composition
Compressive Strength
(N/mm2)Density
(kg/m3)7 days 28 days 56 days
HL Hydrated lime 3.61 13.98 19.71 1,713.3
PC Portland cement 14.07 26.74 29.60 1,817.6
GB GGBS 4.10 7.40 8.31 1,724.1
LG-1-0 HL-GGBS (10:20) 9.13 20.84 26.18 1,767.7
LG-2-0 HL-GGBS (15:15) 7.62 17.47 24.32 1,769.5
LG-3-0 HL-GGBS (20:10) 5.29 15.89 22.25 1,763.5
PG-1-0 PC-GGBS (10:20) 14.48 29.88 36.75 1,768.6
PG-2-0 PC-GGBS (15:15) 17.69 33.61 39.18 1,755.1
PG-3-0 PC-GGBS (20:10) 20.23 38.19 42.87 1,776.4
LG-1-25 HL-GGBS (10:20) 7.71 19.43 22.29 1,748.2

91The Effect Of Using GGBS and Foam on The Mechanical Properties of Unfired Coal Ash Foam Brick
Mix
Code
Binder
composition
Compressive Strength
(N/mm2)Density
(kg/m3)7 days 28 days 56 days
LG-2-25 HL-GGBS (15:15) 6.04 17.21 21.03 1,734.2
LG-3-25 HL-GGBS (20:10) 4.93 15.78 18.70 1,739.2
PG-1-25 PC-GGBS (10:20) 9.77 27.97 34.50 1,748.0
PG-2-25 PC-GGBS (15:15) 11.90 30.28 36.69 1,759.8
PG-3-25 PC-GGBS (20:10) 12.53 33.07 39.02 1,740.0
LG-1-50 HL-GGBS (10:20) 6.33 15.19 17.62 1,691.5
LG-2-50 HL-GGBS (15:15) 5.64 14.84 16.81 1,675.5
LG-3-50 HL-GGBS (20:10) 4.53 13.88 15.02 1,675.2
PG-1-50 PC-GGBS (10:20) 8.79 19.03 21.63 1,657.3
PG-2-50 PC-GGBS (15:15) 9.20 19.55 24.34 1,650.5
PG-3-50 PC-GGBS (20:10) 10.53 20.61 26.59 1,646.6
LG-1-75 HL-GGBS (10:20) 3.32 10.56 13.26 1,451.7
LG-2-75 HL-GGBS (15:15) 2.41 9.42 11.57 1,453.8
LG-3-75 HL-GGBS (20:10) 1.53 8.41 10.78 1,462.4
PG-1-75 PC-GGBS (10:20) 5.21 11.39 15.22 1,434.9
PG-2-75 PC-GGBS (15:15) 6.17 12.87 16.16 1,454.1
PG-3-75 PC-GGBS (20:10) 7.10 13.60 17.44 1,463.3
LG-1-100 HL-GGBS (10:20) 0.93 2.90 3.85 1,096.1
LG-2-100 HL-GGBS (15:15) 0.85 2.54 3.48 1,115.8
LG-3-100 HL-GGBS (20:10) 0.72 2.16 3.19 1,116.3
PG-1-100 PC-GGBS (10:20) 1.15 3.27 4.34 1,071.6
PG-2-100 PC-GGBS (15:15) 1.38 3.49 4.85 1,085.4
PG-3-100 PC-GGBS (20:10) 1.77 3.82 5.22 1,099.2
Compressive strength
Mix code HL, PC and GB functionate as the control which use totally hydrated lime, Portland cement and GGBS for each mix respectively as the binder to stabilize the bricks and without foam. The rest of the mixes were using HL-GGBS and PC-GGBS system as the binder. From the result observation of HL-GGBS system, the mix code LG-1-0 with binding ratio 10:20 indicates the highest compressive strength of 9.13N/mm2 at 7 days, 20.84N/mm2
at 28 days and 26.18N/mm2 at 56 days. When percentage of hydrated lime content in the HL-GGBS ratio was increased, it caused a decrease in the compressive strength. This is exhibited

92 Mohamad Ezad Hafez Mohd Pahroraji, et. al.
by specimens mix code LG-2-0 with binding ratio 15:15 which recorded 7.62N/mm2 at 7 days, 17.47N/mm2 at 28 days, and 24.32N/mm2 at 56 days and also LG-3-0 with binding ratio 20:10 which recorded 5.29N/mm2 at 7 days, 15.89N/mm2 at 28 days, and 22.25N/mm2 at 56 days as shown in Figure 2.
Figure 2. Compressive strength of brick made of HL-GGBS and PC-GGBS system without foam at 7, 28 and 56 days
This might be due to the lower total content of CaO and SiO2 in the hydrated lime compare to GGBS. The higher total amount of CaO and SiO2 content in GGBS might contribute in the increase of the compressive strength for the brick. The use of hydrated lime on its own as the binder as in the mix code HL recorded lower compressive strength of 3.61N/mm2 at 7 days, 13.98N/mm2 at 28 days and 19.71N/mm2 at 56 days compare to the mixes that were using HL-GGBS system at any ratio. Whereas for the PC-GGBS system, the mix code PG-3-0 with binding ratio 20:10 indicates the highest compressive strength of 20.23N/mm2 at 7 days, 38.19N/mm2 at 28 days and 42.87N/mm2 at 56 days. When percentage of Portland cement content in the PC-GGBS ratio was reduced, it caused a decrease in compressive strength. This is exhibited by specimens mix code PG-1-0 with binding ratio 10:20 which recorded 14.48N/mm2 at 7 days, 29.88N/mm2 at 28 days and 36.75N/mm2 and also PG-2-0 with binding ratio 15:15 which recorded 17.69N/mm2 at 7 days, 33.61N/mm2 at 28 days and 39.18N/mm2 at 56 days as shown in Figure 2. This might be due to the lower total content of CaO and SiO2 in the GGBS compare to PC. The use of Portland cement on its own as the binder as in the mix code PC recorded lower compressive strength of 14.07N/mm2 at 7 days, 26.74N/mm2 at 28 days and 29.60N/mm2 at 56 days compare to the mixes that were using PC-GGBS system at any ratio. Whereas the use of GGBS on its own as the binder as in the mix code PC recorded the lowest compressive strength of 4.10N/mm2 at 7 days, 7.40N/mm2 at 28 days and 8.31N/mm2 at 56 days compare to the mix code HL and PC which is shown in Figure 3.

93The Effect Of Using GGBS and Foam on The Mechanical Properties of Unfired Coal Ash Foam Brick
Figure 3. Compressive strength of brick made of hydrated lime (HL), Portland cement (PC), and GGBS as binder without foam at 7, 28 and 56 days
However, when foam was used, the compressive strength shows reduction. The higher percentage of foam used, the more reduction was recorded. This indicate that the use of foam to lightweight the brick reduce the compressive strength. When 25% of foam was added into the mixes for both system HL-GGBS and PC-GGBS, the compressive strength indicate only a slight decrease compare to mix without foam. When 50% and 75% of foam was added, the reduction in compressive strength becomes more significant. At this percentage, even though the compressive strength reduces but the value at 28 days satisfies the minimum requirement of BS 6073 of 7.3N/mm2. However, when 100% of foam was added, the compressive strength becomes very low and recorded below 4N/mm2 at 28 days. For HL-GGBS system, this is shown in Figure 4 for ratio 20:10, Figure 5 for ratio 15:15 and Figure 6 for ratio 20:10. While for PC-GGBS system, this is shown in Figure 7 for ratio 10:20, Figure 8 for ratio 15:15 and Figure 9 for ratio 20:10. Even with the incorporation of foam at 75% for both binding system, the brick specimens have recorded higher compressive strength compare to the traditional fired clay brick and sand brick. The compressive strength for fired clay and sand bricks are shown in Table 4.
Figure 4. Compressive strength of brick made of HL-GGBS system (ratio 10:20) with different percentage of foam at 7, 28 and 56 days

94 Mohamad Ezad Hafez Mohd Pahroraji, et. al.
Figure 5. Compressive strength of brick made of HL-GGBS system (ratio 15:15) with different percentage of foam at 7, 28 and 56 days
Figure 6. Compressive strength of brick made of HL-GGBS system (ratio 20:10) with different percentage of foam at 7, 28 and 56 days
Figure 7. Compressive strength of brick made of PC-GGBS system (ratio 10:20) with different percentage of foam at 7, 28 and 56 days

95The Effect Of Using GGBS and Foam on The Mechanical Properties of Unfired Coal Ash Foam Brick
Figure 8. Compressive strength of brick made of PC-GGBS system (ratio 15:15) with different percentage of foam at 7, 28 and 56 days
Figure 9. Compressive strength of brick made of PC-GGBS system (ratio 20:10) with different percentage of foam at 7, 28 and 56 days
Density
In this study, foam was used to reduce the weight of the brick. The pre-formed foaming method was applied. The foam agent was diluted with water. The ratio of foaming agent to water used was 1:30 for the foam to be fully expanded (Ismail et al., 2004). The quantity of foam injected into the mix slurry was control by using stop watch. The function is to create pore structures within the bricks. Result shows the density of the brick decrease with the increase in foam in the mixes for both HL-GGBS as shown in Figure 10 and PC-GGBS system as shown in Figure 11.

96 Mohamad Ezad Hafez Mohd Pahroraji, et. al.
Figure 10. Relationship of density with different percentage of foam for brick made of HL-GGBS system
Figure 11. Relationship of density with different percentage of foam for brick made of PC-GGBS system
Table 4. Result for traditional fired clay brick and sand brick for comparison
CodeCompressive
Strength (N/mm2)
Density (kg/m3)
Flexural Strength (N/mm2)
Water Absorption
(%)
Salt Attack Resistance
(%)
Fired clay brick 8.41 1,725.1 1.41 18.0 16.73
Sand brick 7.45 1,807.2 1.76 9.0 5.55
The lower density contributes to lighter in weight. However, a slight decrease in density can be seen for both mixes when only 25% of foam content was used. This indicates that the 25% amount of foam was not sufficient to reduce the weight of the bricks. When the foam percentage was increased to 50%, the density of the brick reduces by approximately 100kg/m3. This is still considered heavy when the density was recorded at approximate 1,600kg/m3. The density of the brick reduces to approximately 1,400kg/m3 when 75% amount of foam was used. This could be considered commensurable within the value of density and compressive strength achieved. The brick specimens was lighter when compare to traditional fired clay and sand brick which recorded density at 1,725.1kg/m3 and 1,807.2kg/m3 respectively as shown in Table 4. By increasing the foam percentage to 100%, the density of the brick reduces to approximately 1,100kg/m3. However, the compressive strength was extremely decreased and achieved below the minimum requirement of BS 6073 (BSI, 2008).

97The Effect Of Using GGBS and Foam on The Mechanical Properties of Unfired Coal Ash Foam Brick
Second stage of experimental programme
In the second stage of experimental programme, based on the compressive strength achieved in the first stage, mix with the highest compressive strength and met the minimum strength requirement in BS6073 from both HL-GGBS and PC-GGBS systems including control mix were selected only and brick specimens were replicated for further testing i.e. flexural strength, water absorption and salt attack resistance. The mix series with 100% of foam content were eliminated from further testing for both binder systems due to lowest compressive strength result achieved. Ninety (90) brick specimens from ten (10) mixes proportion were tested after 28 days of curing age. Three (3) identical specimens were prepared for each test and the average results were taken. The test results are shown Table 5.
Table 5. Results for flexural strength, water absorption and salt attack resistance after 28 days
Mix Code Binder composition
Flexural Strength (N/mm2)
Water Absorption (%)
Salt Attack Resistance (%)
HL Hydrated lime 2.76 12.33 0.84
PC Portland cement 3.23 10.77 0.13
LG-1-0 HL-GGBS (10:20) 2.84 11.29 0.34
PG-3-0 PC-GGBS (20:10) 3.31 9.89 0.10
LG-1-25 HL-GGBS (10:20) 2.52 12.23 1.15
PG-3-25 PC-GGBS (20:10) 2.60 10.95 0.35
LG-1-50 HL-GGBS (10:20) 2.37 13.20 2.31
PG-3-50 PC-GGBS (20:10) 2.45 11.93 1.01
LG-1-75 HL-GGBS (10:20) 2.15 15.21 4.24
PG-3-75 PC-GGBS (20:10) 2.29 14.30 3.36
Flexural strength
The result of flexural strength for the brick specimens is shown in Table 5. For HL-GGBS system, it was found that the mix code LG-1-0 without foam demonstrate the highest flexural strength of 2.84N/mm2. However, when foam was added in the mix and increase at various percentages, the flexural strength shows a decrease. This could be because of the pore structures and voids created by the foam in the bricks might have weaken the flexural strength. When the foam amount was increased to 25%, specimens for mix code LG-1-25 recorded a decrease to 2.52N/mm2. At 50% amount of foam, sample for mix code LG-1-50 recorded further decrease to 2.37N/mm2. At 75% amount of foam, the sample mix code LG-1-75 recorded the lowest value of 2.15N/mm2. The use of hydrated lime on its own as in the mix code HL recorded flexural strength of 2.76N/mm2 which is lower compare to value recorded by HL-GGBS system without foam (LG-1-0) but higher compare to HL-GGBS system with foam at various percentages. As for the PC-GGBS system, the mix code PG-3-0 indicates the highest flexural strength of 3.31N/mm2 at 0% of foam content but when the foam content was increase to 25%, the strength dropped to 2.60N/mm2 as exhibit by sample mix code PG-3-25. At 50% amount of foam, sample mix code PG-3-50 recorded further decrease to 2.45N/

98 Mohamad Ezad Hafez Mohd Pahroraji, et. al.
mm2. At 75% amount of foam, sample mix code PG-3-75 recorded the lowest value of 2.29N/mm2. The use of Portland cement on its own as in the mix code PC recorded flexural strength of 3.23N/mm2 which is also lower compare to value recorded by PC-GGBS system without foam (PG-3-0) but higher compare to PC-GGBS system with foam at various percentages. Generally, PC-GGBS system recorded higher value of flexural strength compare to HL-GGBS system. Although the addition of foam has resulted in the decrease of flexural strength for both binder system but the lowest value achieved at the highest foam content (75%) still recorded above 2N/mm2 as shown in Figure 12. The flexural strength for fired clay brick and sand brick are lower at 1.41N/mm2 and 1.76N/mm2 respectively as shown in Table 4.
Figure 12. Relationship of flexural strength with percentage of foam for brick specimens made of HL-GGBS and PC-GGBS system after 28 days
Water absorption
The result of water absorption for the brick specimens is shown in Table 5. It was observed that the bricks water absorption indicates increment between 1-3% with every 25% addition of foam content. The water absorption for HL-GGBS system indicates 1-2% higher than the PC-GGBS system. Figure 13 shows the effect of binder composition to the water absorption of the brick specimens with multiple increase percentage of foam content. For both binder system used, the water absorption was directly proportional to the amount of foam added to the mix proportion. The increase of foam content contributes to the presence of higher amount of pores and voids in the bricks. As a result, the bricks absorb more water.
Figure 13. Relationship of water absorption with percentage of foam content for brick specimens made of HL-GGBS and PC-GGBS system after 28 days

99The Effect Of Using GGBS and Foam on The Mechanical Properties of Unfired Coal Ash Foam Brick
Figure 14. Relationship of water absorption with density for brick specimens made of HL-GGBS and PC-GGBS system after 28 days
Figure 14 shows water absorption is inversely proportional to the density of the bricks. The water absorption decrease when density increased. The R2 value indicates a degree of correlation exists between water absorption and density. However, the percentage of water absorption for bricks with PC-GGBS system was lower compare to the sample made with HL-GGBS system. The overall percentage of water absorption for all stabilized mix was in between 10% to 15%. This is lower when compare to fired clay brick at 18% and higher than sand brick at 9% as shown in Table 4. The differences in result between specimens could be explained by the differences in the pore structure between specimens that were manufactured from different material (Burgess-Deon, 2001). As shown in Figure 13, the notable observation was that the percentage of water absorption increases proportionally with the amount of foam injected into the brick mixture during the fabrication process. The addition of foam has resulted in the intensification of pores and voids in the brick structure thus cause the higher ability in absorbing water that could contribute in the reduction of strength over time especially when exposed to the aggressive environment. This could possibly cause destruction to the established cementitious bond, thus fail the chemical bonding between stabilized constituents and consequently, reduce the engineering performance (Oti et al., 2009).
Salt attack resistance
The result of salt attack resistance for the brick specimens is shown in Table 5. Malaysia is indeed a tropical country without winter. Therefore, instead of freezing and thawing, salt attack resistance test was selected to be used as a parameter to measure the durability of the brick specimens. Durability refers to the resistance of brick to attack by soluble salt. Sodium sulphate was used in the test as simulation to salty ground water. Figure 15 exhibits the correlation between the amount of foam and mass loss. The mass loss percentage of the brick specimens was found increase exponentially with the addition of foam content for both HL-GGBS and PC-GGBS binding system. As mentioned before, the use of foam has resulted in the existence of pore and void in the brick’s structure. Following to that, the salt attack occurs when the tensile stresses developed within the brick’s capillaries that weaken the brick’s structure which contain pores and voids due to the use of foam. When the brick specimens were exposed to the concentration of salt through immersion in sodium sulphate solution, the soluble salt dissipates inside the capillaries. The salt residue that was left and accumulated in the capillaries of the specimens crystallizes and eventually caused damage when the salt is

100 Mohamad Ezad Hafez Mohd Pahroraji, et. al.
transferred to the surrounding material through water. Salt crystallization depends on porosity, capillaries shape and size distribution (Abu Bakar et al., 2011).
Figure 15. Relationship of mass loss with foam content for brick specimens made of HL-GGBS and PC-GGBS system after 28 days of curing age
During the test process, the specimens were soaked for 2 hours before drain for at least 10 minutes after which the specimens were subjected to oven dry. During the drying process, the water evaporated which caused the salt residuals deposited in the capillaries and variation of temperature could have trigged shift in the crystalline phases. Crystallization could achieved to stable phase when the temperature reach above 32.4°C and shift to unstable phase when temperature drop below 24.4°C and affected as well in humid temperature (Abu Bakar et al., 2011). This rapid change of crystalline phases which cause by variation in temperature and humidity could have led to fatigue in the brick’s pore and void structure. Over the time, the reoccurrence of wetting and drying of specimens could cause a slow but constantly accumulated of salt in the capillaries resulting in a more concentrated salt residue (Burgess-Deon, 2001). This could be the point of time when the crystals were formed. Since the increase of foam content leads to the higher amount of pore and voids, the bricks prone to weaker in terms of resistance to salt attack due to the stress developed in the capillaries. This is coherent with a research reported that the volume of salt solution absorbed into the pores proportion to number of porosity in the masonry unit (Burgess-Deon, 2001). As crystallization grow, the specimens internal structure expands thus exerting internal forces and stresses which eventually could have caused damage. The expansion generated throughout salt crystallization could possibly develop sufficient pressure to cause disintegration of the microstructure (Abu Bakar et al., 2011). From the exponential graph in Figure 15, the R2 values display positive and close to zero. This demonstrates that the percentage of mass loss of the bricks subjected to salt attack was highly dependent on the foam content. However, mass loss recorded by fired clay and sand brick was higher compare to the coal ash brick using HL-GGBS and PC-GGBS system with and without foam as shown in Table 4.
CONCLUSION
This study was carried out with aim for the evaluation of utilizing combination of fly ash and bottom ash as main raw material with the incorporation of HL-GGBS system as binder and foam in developing the unfired coal ash foamed foam brick. In the study, observation was made that the utilization of traditional binder such as hydrated lime and Portland cement

101The Effect Of Using GGBS and Foam on The Mechanical Properties of Unfired Coal Ash Foam Brick
could be reduced and substituted with GGBS, a by-product from steel manufacturing process. However, hydrated lime and Portland cement still required to be used but in reduce and sufficient amount to provide the necessary alkali for GGBS to activate and accelerate its slow cementitious properties. The use of hydrated lime or Portland cement as an activator to GGBS as the stabilizer was able to increase the strength of the brick compare to the use of hydrated lime or Portland cement or GGBS on its own. However, the use of PC-GGBS system has achieved higher compressive strength value compare to HL-GGBS system. In the HL-GGBS system, the ratio of HL to GGBS at 10:20 has recorded higher compressive strength compare to the ratio 15:15 and 20:10. Whereas in the PC-GGBS system, the ratio of PC to GGBS at 20:10 has recorded higher compressive strength compare to the ratio of 15:15 and 10:20. The addition of foam resulted in the decrease of compressive strength and density of the bricks. The addition of foam content by 25% was not significantly sufficient to reduce the density of the brick. On the other hand, the amount of foam to 100% was sufficient to reduce the density of the brick but achieved the lowest compressive strength. Bricks with 75% of foam addition at 28 days satisfy the compressive strength requirements in BS 6073 to be used as building material and the density reduces to approximately 1,400kg/m3. The flexural strength achieved above 2N/mm2. It appears that the increase in the addition of foam at various quantities did not only decrease the density of the bricks but increase the water absorption as well. Apparently, the pore structure in the bricks which created by the foam had allowed the occurrence of water absorption. The more existence of pores and voids had allowed for higher water absorption. The high values of water absorption could suggest that the pores in the brick had provided admission for the water to get access to the inside. In coherent with, it was also observed that the salt attack resistance of the bricks was found weaker with the increase in the addition of foam in the mixes. The accumulated of salt crystallization in the capillaries has triggered expansion and force within the brick’s pore structure which resulted in pressure development to the surrounding and leads to impairment. Overall, it was found that the coal ash brick with HL-GGBS and PC-GGBS binding system achieved better performance in properties even with foam added when compare to traditional fired clay brick and sand brick in terms of compressive strength, density, flexural strength, water absorption and salt attack resistance. For further investigation, it is suggested that the continuation of sustainability could be explored by looking for alternative material of reuse, recycle, residue or by-product that contain high amount of calcium oxide as substitution to hydrated lime and Portland cement for the purpose of GGBS activation and investigate at the effect that might occur on the bricks properties.
ACKNOWLEDGEMENT
The authors wish to express thanks to Gobel industry Sdn. Bhd. for providing fly ash, Kapar Energy Venture for bottom ash, YTL cement for GGBS and gratefully acknowledge Universiti Teknologi MARA for financial support [Excellence Fund Grant No. 600-RMI/ST/DANA5/3/Dst(411/2011)]
REFERENCES
Abu Bakar, B. H., Wan Ibrahim, M. H. and Megat Johari, M. A. (2011). A Review: Durability of fired clay brick masonry wall due to salt attack. International Journal of Integrated Engineering(Issue on Civil and Environmental Engineering), 111-127.
Algin, H. M. and Turgut, P. (2008). Cotton and limestone powder wastes as brick material. Construction and Building Materials, 22(6), 1074-1080. doi: 10.1016/j.

102 Mohamad Ezad Hafez Mohd Pahroraji, et. al.
conbuildmat.2007.03.006AS/NZS. (2003). Masonry units, segmental pavers and flags - Methods of test AS/NZS 4456
Method 8: Determining moisture content, dry density and ambient density: Australian/New Zealand Standard.
ASTM. (2008). C618-08a Standard Specification for Coal Fly Ash and Raw or Calcined Natural Pozzolan for Use in Concrete. Pennsylvanis: American Society for Testing and Materials.
ASTM. (2011). C67-11 Standard Test Methods for Sampling and Testing Brick and Structural Clay Tile. Pennsylvanis: American Society for Testing and Materials.
Awang Tengah: Coal-fired power plants needed. (2010, January 27). http://thestar.com.my/metro.
BSI. (1990). BS 1377 Part 2:Soils for civil engineering purposes Classification tests.BSI. (2008). BS 6073 Part 2:Precast concrete masonry unit Guide for specifying precast
concrete masonry unit.BSI. (2011a). BS EN 772-1 (2011) Methods of test for masonry units Determination of
compressive strength.BSI. (2011b). BS EN 772-21 (2011) Methods of test for masonry units Determination of
water absorption of clay and calcium silicate masonry units by cold water absorption.Burgess-Deon, L. S. (2001). Predicting the resistance of fired clay bricks to salt attack.
(Doctor of Philosophy), Deakin University. Chindaprasirt, P. and Pimraksa, K. (2008). A study of fly ash-lime granule unfired brick.
Powder Technology, 182(1), 33-41. Cicek, T. and Tanriverdi, M. (2007). Lime based steam autoclaved fly ash bricks. Construction
and Building Materials, 21(6), 1295-1300. Freidin, C. (2002). Stability of Cementless Building Units on Oil Shale Fly Ash Binder in
Various Conditions. Construction and Building Materials(16), 23-28. Freidin, C. (2007). Cementless Pressed Blocks from Waste Products of Coal-Firing Power
Station. Construction and Building Materials(21), 12-18. Freidin, C. and Motzafi-Haller, W. (1999). Cementless Building Units Based on Oil Shale and
Coal Fly Ash Binder. Construction and Building Materials(13), 363-369. Higgins, D. D. (2005). Soil Stabilisation with Ground Granulated Blastfurnace Slag: UK
Cementitious Slag Makers Association

103Malaysian Construction Research Journal; Vol. 19 | No.2 | 2016
INTERNATIONAL MARKET ENTRY LOCATIONAL FACTORS USING RASCH MODELChe Maznah Mat Isa1, Hamidah Mohd Saman1, Christopher Nigel Preece2, Siti Rashidah Mohd Nasir1 and Sharifah Abdullah1
1 Faculty of Civil Engineering, Universiti Teknologi MARA, 4045, Shah Alam, Selangor, Malaysia2 College of Engineering, Abu Dhabi University, United Arab Emirates
AbstractMarket expansion into international markets has been increasingly important for Malaysian construction firms. Thus, firms must adopt effective strategies to face various challenges in unfamiliar environments. Entry location (EL) consideration is the first and most critical business strategy for firms to determine “where the markets are”, in order to exploit opportunities available in international markets. However, there are many important factors that must be considered by firms in choosing the location for their projects. The main objective of this study is to determine the significant locational factors influencing EL decision of Malaysian construction firms to enter international markets. Sixty-two managers responded to the questionnaires sent to firms registered under Construction Industry Development Board (CIDB) Malaysia. Fifteen most significant factors grouped under country, market, firm and market were determined and ranked using the logit measure order by employing Rasch Model analysis. It was found that the significant country factors were related to the host and home government’s attitude and support, while the significant market factors were related to market potential and demand. In addition, the significant firm factors entail firm’s tangible and intangible resources, while the significant project factors constitute project fund, experience and contract types adopted. The findings show that the EL decisions are related to various issues, namely the host-home government supports, market conditions, firm’s resources and project funds. These issues have been of particular interest and were found critical for construction firms’ early stage of internationalization. Thus, firms could not afford to make poor or wrong EL decisions in assigning their limited resources to diminishing markets while avoiding the attractive or growing markets.
Keywords: Entry locational factors; International markets; Malaysian construction firms; Rasch Model analysis
INTRODUCTION
International market expansion into foreign markets has become increasingly important for construction firms. As reported by previous researchers, many venture capital firms have progressively turned to foreign countries in search of investment opportunities (Guler & Guillén, 2009; Kunnanatt, 2011) and market potential with high profitability (Head & Mayer, 2004). Despite the fact that the international market offers great contracting opportunities for Malaysian firms, unfortunately Malaysia is still a long way behind other foreign investors especially United States, United Kingdom, Europe, China, Japan, Thailand, Hong Kong and even her close neighbour, Singapore (CIDB Malaysia, 2013). This reflects the lack of overall strategy of Malaysian construction firms to carry out effective entry location (EL) decision into international markets. These are obvious risks and challenges which contribute to the reasons behind the reduction of number of projects undertaken. This situation may be due the firms’ lacking in resources, unsound business plan for working overseas, insufficient information on opportunities abroad and lack of competitive position. There are complexities and difficulties involved in the EL decisions to enter unknown and unfamiliar environments

104 Che Maznah Mat Isa, et. al.
(Papadopoulos & Martín, 2011).
In this paper, various locational factors grouped under country, market, firm and project were firstly identified based on previous studies. Next, the research method and analysis used are explained followed by the discussions and conclusion. The reviews of relevant literature suggest that a model or theory related to EL decision in international markets for construction firms is still lacking. Therefore, this study aims to investigate the significant factors influencing the EL decision of Malaysian construction firms in international markets. A quantitative approach was used using questionnaires, which were sent to top managers of construction firms.
LITERATURE REVIEW
The initial stage of international market expansion requires a firm to assess the right market signals and opportunities in emerging markets. The decision to enter international markets critically depends on various factors related to country, market, firm and project which requires a firm’s proper planning and management as discussed in the following sub-sections.
Country Factors
Previous studies on EL decision have included factors related to home-host country such as travel time and liability of distance (Boeh & Beamish, 2012); geographical distance ((Head & Mayer, 2004; Abdul-Aziz & Wong, 2008; Malhotra, Sivakumar, & Zhu, 2009); cultural distance (Sakarya, Eckman, & Hyllegard, 2007); host country political stability; foreign exchange control and tax discrimination (Sakarya et al., 2007); well-established host country institutions (Lu, Liu, Wright, & Filatotchev, 2014); home government policy towards FDI, and tax incentives of host country ((Lu et al., 2014),(El-higzi, 1999)), local density of home-country affiliates and demand fluctuation ((El-higzi, 1999), (Zhu, Eden, Miller, Thomas, & Fields, 2012)) and also host–home country linkages and specific advantages (Buckley & Casson, 1998). Head and Mayer (Head & Mayer, 2004) developed a theoretical model of EL decision based on market potential and geographical factors. Many recent researchers have further examined the moderating roles of market potential affected between distance factors and EL decision (Malhotra et al., 2009). Thus, it is recommended that firms need to be exposed to strong future market potentials, a manageable level of cultural distance, a supportive and developing local industry and positive customer receptiveness for foreign products and business (Sakarya et al., 2007). These previous studies have proven that market potential of countries compensates and sometimes even overrides the role of distance or geographical factors. A study by El-higzi (1999) on construction firms shows that EL decision was not only the outcome of the host country’s economic, political and structural factors, but also a result of interplay of the firms’ motivations for expansion, and the availability of relevant construction projects. The trade was involved primarily with developing and newly industrialized economies. However, it was suggested that a wide range of locational disadvantages need to be considered by the construction firms before making the go/no-go decision to enter foreign markets (Abdul-Aziz & Wong, 2008). Thus, these locational disadvantages create a market space for international firms with the capabilities to overcome them. A well-established host country institution and supportive home government policies

105International Market Entry Locational Factors Using Rasch Model
also play significant roles in influencing firm’s EL decision into international markets. Lu et al., (2014) examined the moderating effects of home government and host institutions between international experience and foreign direct investment (FDI) location choices of Chinese construction firms. The results show the extent to which home country government support and well-established host country institutions enhanced organizational capabilities to take risks in FDI. This has reduced the need for the firm to accumulate experiential knowledge and capabilities relating to entering host countries based on prior entry experience in a particular country when undertaking follow-up investment projects. Thus, the firm’s EL decision to choose a suitable country depends very much on the stability of the host country’s institutions and host government’s encouragement, similarity in language and culture, amongst other factors (Abdul-Aziz & Wong, 2008).
Firm Factors
Previous researchers also looked into firm-related factors, such as accumulation of experiential knowledge and capabilities based on prior entry experience; enhanced organizational capabilities (Lu et al., 2014); firm’s strategic interactions (Lu et al., 2014); resources and internationalization strategy using market-seeking and labour-seeking strategy (Jain, 2010); financial strength ((Abdul-Aziz & Wong, 2008); ((El-higzi, 1999),(Che Ibrahim, Mohd Baki, Mat Isa, Endut, & Ghani, 2009)); project management skill and international network (Che Ibrahim, Mohd Baki, et al., 2009); local competition; technological capability; trained workforce; connection and degree of business interaction (Abdul-Aziz & Wong, 2008) together with profit repatriation, desire to expand strategically; and company strength in know-how (Abdul-Aziz & Wong, 2008). In addition, project management capabilities are linked with the organizational and managerial processes which include efficiency in the organizational structure, mechanisms of efficient coordination, knowledge and skills of employees and managerial competences (Villaverde & Ortega, 2007). Specialist expertise and technological capabilities refer to the necessary technical and technological abilities needed to transform inputs into products (Villaverde & Ortega, 2007). Ozorhon et al. (2010) developed a Case-Based Reasoning (CBR) Model to support EL decision by improving the quality of decision making in construction firms. Firms should utilize effectively the experiences of their competitors in international markets to assist their EL decision. The EL decisions were also based on the firm’s knowledge that is useful to overcome international market challenges. Cuervo-Cazurra (2011) proposed three type of knowledge that have influenced over the firm’s EL decisions, namely; (1) knowledge to manage complexity, developed by having multiple operations at home; (2) knowledge to manage differences in competitive conditions, developed by operating in business-to-business industries, and (3) knowledge to manage differences in institutional environments, developed by allying to a foreign firm at home.
Project Factors
Some project factors included in the previous studies were project capital requirement (El-higzi, 1999 ; Abdul-Aziz & Wong, 2008;Che Ibrahim, Ayub, Ahzahar, & Hassan, 2009), project nature and future potential (Che Ibrahim, et al., 2009), prior experience in similar projects (Lu et al., 2014), availability of transportation and utilities (Che Ibrahim, Ayub, et al., 2009), ease to get financial funding, infrastructure supports and other related and supporting industries (Abdul-Aziz & Wong, 2008). Globally, the increasing size and number of mega

106 Che Maznah Mat Isa, et. al.
projects and complexity of projects has also increased the need for participation of construction firms in international markets (Comu, Taylor, & Messner, 2015).
Thus, by considering various EL factors, these firms have gained access to foreign countries using combinations of market entry strategies and have been gradually extending their operations. In this study, the EL decision is being considered as one of the more important dimensions (dependent variable) to be measured together with the significant factors (independent variable) influencing this decision.
METHODOLOGY
This section explains the methodology related to the measurement of the independent variables using Rasch Model analysis. A descriptive analysis carried out on the dependent variable (EL decision) is also presented. However, the logistic regression analysis carried out on the dependent variable is not included.
Target Respondents
Since the total population of construction firms working internationally is unknown, a sampling frame of the firms listed under CIDB of Malaysia directory for 2012/13 comprising of 115 firms registered under the Grade 7 and Class A categories was used. The target respondents were the directors, managers and executives in these firms. They were involved in international projects with experience in different countries and in various sectors such as building, infrastructure, branches of engineering, mechanical, electrical and power transmission.
Data Collection and Respondents’ Profile
The findings in this research are presented based only on two parts of the questionnaire. The first part enquires the respondents’ name, designation, firms’ international experience and the business locations(s). Part two enquires the respondents’ opinion of the level of significant influence of the factors on the firm’s EL decision using a 5-point Likert rating. (1 - No Significant Influence; 2 - Less Influence; 3- Moderate Influence; 4- Significant Influence; and 5- Very Significant Influence). The questionnaires were designed based on previous literatures.
Rasch Model Analysis
In this study, the Rasch model analysis was adopted due to its ability to focus on the level of individual analysis. Thus, there is no need to assume that the data follow a normal distribution. Moreover, it gives special emphasis to the model as it is the data that fit a model and not the model that fits data. Thus, the Rasch model analysis is able to analyse a small sample size, as small as 16 with the same precision and does not require for the data to be normally distributed. Thus, it guarantees reliable measurement despite a low response rate, which is a common limitation in international construction management research. In Rasch Model, there are two underpinning principles; first, a high ability person will most likely be able to complete any given task; and secondly, an easy task can be done without difficulties by a person, with any given ability. Thus, to suit Rasch Model principles with this study, it can be

107International Market Entry Locational Factors Using Rasch Model
said that firstly, a highly competent manager will most likely be able to endorse or decide on any entry decision factor. Second, an easy item or a significant entry decision factor can be endorsed without difficulties by any manager, with any given level of competency.
This paper presents the analysis from the Rasch Model based on the summary statistics for validity and reliability of instrument (for both items and persons) and item factor analysis as described in the analysis and results section.
ANALYSIS AND RESULTS
This paper presents the analysis from the Rasch Model based on the summary statistics for validity and reliability of instrument (for both items and persons) and item factor analysis as described in this section.
Respondents’ Background
A multiple method of data collection was employed through e-mail, postal mail and personal contacts. Out of 115 self-administered questionnaires sent to the firms, 62 firms responded. The respondents’ designations are those of the vice president/Chief-Operating-Officer (n=2), general/ senior manager (n=3), managing/project/technical director (n=8), senior project manager (n=3), senior project engineer (n=2), project coordinator (n=2), project manager/ planner (n=6), project engineer (n=15), contract/ quantity surveyor/ financial manager (n=9) and other managerial posts (n=12). The results show that approximately 26% have more than 10 years of international experience, 29% have between 5 to 10 years of international experience and the rest (45%) have less than 5 years of international experience. In terms of the firms’ business locations, 32% of the firms have penetrated the ASEAN regions (Singapore, Indonesia, Thailand, Vietnam, Myanmar, Brunei, Philippines, and Cambodia) while the majority of the firms (68%) have ventured into non-ASEAN regions including Algeria, Austria, Botswana, China, Egypt, France, Hong Kong, Ireland, Germany, Japan, Kuwait, Libya, Mauritius, Mongolia, Nepal, Nigeria, Oman, Pakistan, Qatar, Saudi Arabia, Seychelles, Singapore, Spain, Sudan, Syria, Tobago, United Arab Emirates, United States of America, United Kingdom, Vietnam and Yemen. About 77% of the firms were involved in building and construction activities, while the other 23% were involved in project management activities. Hence, the profile findings indicate that the respondents have the required international construction background to participate and give reliable opinions in the survey.
Rasch Model Analysis
An appraisal of data fit to EL decisions was carried out using Rasch Model analysis as a means of observing the extent to which managers’ responses to each EL decision factor are consistent with the response to other factors on the same assessment (Xu, Bower, & Smith, 2005).
Summary statistics for validity and reliability
Figure 1 shows an excerpt from the Rasch analysis, which summarizes the statistics of the survey instrument for 44 measured items generated from 62 persons using a total of 2728 (44

108 Che Maznah Mat Isa, et. al.
x 62) data points. The figure reports the reliability, quality and validity of the items (factors) influencing the firm’s EL decision to enter international markets. It shows an item reliability of 0.75 (model = 0.77) which is greater than 0.7, indicating the sufficiency of the items spread along the continuum, in general. Hence, the instrument holds a good position of not being dependent on the respondents. It also shows that the instrument has a good measurement model error of + 0.16 logit.
Figure 1. Summary statistics for 44 measured for the EL decision construct
Figure 2 depicts the summary statistics for 62 measured persons for the EL decision construct. The table shows an excellent person reliability of 0.99. Person reliability looks into the respondents’ consistency towards the survey, by means of consistency level if the same set is given again. With a reliability of 0.99, if a similar set of instrument measuring entry decisions were given to this group, then the likelihood of obtaining a similar pattern of ability in the person measure order table and the location of these managers on the person-item distribution map would be fairly similar (Abdul Aziz, 2011). This is also an indication that this instrument is capable of categorizing and distinguishing the level of the EL decision factors endorsed by these managers.
Figure 2. Summary statistics for 62 measured persons for the EL decision construct
A comparison between the Person maximum measure and the Item maximum measure determines whether the instrument contains sufficient items to measure the managers’ latent trait (in endorsing the entry decision factors). Thus, both figures also present the data needed for targeting the spread of both item and person along a continuum (linear scale). The maximum item is at +0.81 logit (Standard model error or S.E. = 0.17), whilst the minimum item measure is recorded at -0.65 logit (S.E. = 0.15), resulting in the spread of the items at 1.46 logit. The maximum person measure is recorded at +3.99 logit (S.E.= 0.20) with

109International Market Entry Locational Factors Using Rasch Model
minimum person measure at -1.25 logit (S.E. = 0.08) resulting in person spread of 5.24 logit.
The next important information from the summary statistics tables are the item and person separations. Figure 1 depicts an item separation of 1.72 (Model = 1.81). Similarly, Figure 2 shows a person separation of 9.07 (Model = 9.82). For an instrument to be useful, the separation should exceed 1.0, with higher values of separation representing greater spread of items and person along a continuum (Green & Frantom, 2002). It means that the instrument is capable of separating the items or persons into 2 or more different strata or profile. An item separation of 3 is an indicative of 3 item strata endorsed by the managers which has “significant influence”, “influence” and “less influence” on the EL factors. The different levels of strata are very much dependent on the responses by the managers on different constructs related to the EL decision factors.
Similarly, in order to assess the 62 managers’ level of competency in determining the entry decision factors, it is necessary to look at the results of the analysis from Figure 2. The mean person is recorded at +0.94 logit. The positive value indicates that these managers have the ability to assess the 44 items in the EL decision, easily and competently. The table reports a person separation index of 9.07. Thus, the number of person strata is 12 indicating that the managers are represented by 12 different levels of competency. In general, the item is sufficient to gauge the level of entry decision factors for all managers regardless of their competency level and has separated respondents into more than 3 groups and can be considered as excellent.
Another important information from Figure 1 and Figure 2 are the mean infit and outfit item square (MnSq) for both item and person. Mean-square fit (MnSq) statistics show the size of the randomness, i.e., the amount of distortion of the measurement system. In Rasch Model context, 1 is the expected value where “Observed” is divided by “Expected” (Linacre, 2011). The results show that for item: MnSq = 0.96; ZStd = - 0.3, and for person: MnSq = 1.00; ZStd = - 0.6. The MnSq values for both item and person are close to 1, which are the expected values as stipulated by the quality item criteria. The mean Z standardized (ZStd) infit and outfit values are found to be close to 0.0. This indicates that it is a good sign of fit and a valid instrument which is able to measure what is intended. Hence, it can be said that the data for this study do fit the Rasch Model reasonably well and the analysis conducted reflected the outcome of this study.
Item Model Fit: Item Factor Analysis
In item factor analysis, in order to determine which item does not fit the Rasch Model, a three-step comparison procedure was performed with reference to the “Measure Order” table. Figure 3 shows an excerpt from the Rasch analysis. It provides a summary of the 44 item validity based on the order of measure together with the MnSq, ZStd and PMC values.

110 Che Maznah Mat Isa, et. al.
Figure 3. Summary of Item Misfits for EL Decisions (44 items)
The first step in identifying the misfit is by looking at the Point Measure Correlation (PMC) value followed by an outfit mean square (MnSq) value and concludes with the outfit standardized (ZStd) value; the criteria are sequentially compared to a specific acceptable range. First, by looking at the PMC column (labeled as PT-MEASURE CORR), it is shown that all items have positive values and are within the acceptable range with a small measurement error mean of SE = +0.16 logit (0.4<PMC value<0.85). Hence, all items are valid and measuring in the right direction as expected. Second, by looking at the ZStd column (labeled as OUTFIT ZSTD), several items were found to have fallen outside the acceptable regions (Outfit Z-standard (ZStd); -2 <ZStd value <+2) for example, Item 68 (PMC = 0.75, MnSq = 0.5, ZStd = 3.4). Finally, by looking at the MnSq column (labelled as OUTFIT MNSQ), one item was found to have fallen out the acceptable regions (Outfit mean square” (MnSq); 0.5 <MnSq value <1.5) which is Item 57 (PMC =0.56, MnSq = 1.55, ZStd = 2.7).
Based on item factor analysis, several items were found to have fallen outside the acceptable region as highlighted and deleted. There were seven misfit items, which were: (1) Item 57 (MnSq=1.55; ZStd=2.7), (2) Item 52 (PMC=0.33), (3) Item 48 (PMC=0.35), (4) Item 75 (MnSq=-2.2), (5) Item 74(MnSq = -2.5), (6) Item 73 (MnSq=-2.8) and (7) Item 68 (MnSq = -3.4).

111International Market Entry Locational Factors Using Rasch Model
Figure 4 shows an excerpt from the Rasch analysis. It reveals 37 significant factors influencing EL decision of the firms. Out of 37 factors, 15 factors have negative measures which indicate that these are the most significant EL decision factors considered by the firms regardless of the managers’ competency and vice-versa.
Figure 4. Summary of Item Measure Order (37 items)
These factors are sequenced from the most significant to least significant and are grouped under country, market, firm and project factors as shown in Figure 5. The following sections discuss the findings based on these four groups of factors.

112 Che Maznah Mat Isa, et. al.
Figure 5. Significant factors influencing the EL decision
DISCUSSION
Based on Figure 5, the overall findings indicate that the most significant EL decision is under the firm factor which is LF23 (financing capacity). On the other hand, the least significant factor is under the country factor which is LC3 (proximity to host country). This finding contradicts to the findings found by Puljeva & Widen, 2007), who suggested that geographical distance influence on EL decision decreased when the company’s resources and knowledge increased. The following discussion is based on the most significant factors influencing the EL decisions which have been grouped under country, market, firm and project factors.
Country factors
Three most significant country factors influencing the firm’s EL decision are: (1) LC1- attitude and intervention of host governments; (2) LC10 - diplomatic relationship between home and host countries; and (3) LC8 - financial support from home country banks.
Distinctively, these items are related to both home and host country factors. Attitude and intervention of host government has been acknowledged as to exert significant influence on the firm’s EL decision to enter a particular country. The specific host country factors emerged due to political stability, taxation and incentive, law and order, government’s delivery system/bureaucratic efficiency, integrity and transparency, encouragement, language and culture similarity and visa requirement (Abdul-Aziz & Wong, 2008). Thus, in relation to the next significant factor which is “diplomatic relationship between home and home countries”, it is important for firms to be aware of and look for such relationships promoted by home and host government agencies. These formal relationships have manifested internationalization opportunities (Kaur & Sandhu, 2014) and is considered as the locational advantages which attract firms to choose certain locations over others for the firm to invest in (Abdul-Aziz & Wong, 2008). Hence, government assistance built on home-host countries connections improved firms’ international export capabilities, thus encouraging international expansion.
The third most significant country factor is having “financial support from home country

113International Market Entry Locational Factors Using Rasch Model
banks” to enhance the firms’ financial strength. The stronger a firm’s financial position, the better its capacity to carry out more extensive and profitable projects to meet its long term strategic planning (Gunhan & Arditi, 2005). Thus, to increase competitiveness in international markets and get more market shares, the firms sought financial support from home banks. This support is crucial to increase the needed financing for purposes of bidding and securing projects and also to fund and manage equipment, materials and resources.
Thus, a solid financial structure further enables firms to make equity investments in projects that are often required in order to secure construction contracts (Bauml, 1997). In addition, with projects extending over several years, clients in the host country seek assurance that they will not have to change contractors in the middle of a project because of financial distress. Thus, it is important for home banks to offer sizeable working capital with affordable or low-interest rates to fund large and complex projects. By having strategic partnerships with banking institutions either from home or host country, the firm has the opportunity to use structured project financing as an effective strategy (Ling, Ibbs, & Chew, 2008).
Market factors
Two most significant market factors influencing the firm’s EL decision are: (1) LM12 - market profit potential/attractiveness and (2) LM17 - construction demand (e.g. finance, labour, material, transport and other utilities) in the host country. These factors are related to the market conditions and construction demand in international markets.
In general, firms that wish to expand internationally need to evaluate the market signals based on its size, growth and the available opportunities. Thus, this factor has a significant effect on the EL decision where firms prefer to invest in faster growing regions rather than in economically stagnant regions (Yavan, 2010). Market potential has also moderately affected the relationship between distance factors and target market selection (Malhotra et al., 2009). The distant, larger and growing foreign markets have attracted the firms’ internationalization into developing countries without economic constraints such as United Arab Emirates (UAE) and Kingdom of Saudi Arabia (KSA). Therefore, firms tend not to commit substantial resources to a foreign market with low potentials or high demand uncertainty and risks. Even though, there were firms that have chosen other developing countries such as India, Bangladesh and Myanmar, which were not as attractive as the developed countries such as United States and Japan, these countries still have sufficient potential and strategic importance to warrant consideration by these firms. Hence, in this study, it has been found that market potentials in host countries have compensated and sometimes even overruled the role of distance or geographical factors. The findings show that the market within the ASEAN and non-ASEAN regions, especially in the Middle East, Central Asia and the Asia-Pacific region have the potential for growth in infrastructures construction, building and project management. The trends have led to new opportunities for the construction industry by attracting more foreign contractors to participate where the majority of the total accessible international construction markets were procured in these developing regions.
The next significant market factor influencing the firm’s EL decision is construction demand related to finance, labour, material, transport and other utilities in the host country. Firms have penetrated overseas markets due to the high volume of construction demand and its growing economy (Ling et al., 2008). The construction demand for complex, large-scale construction projects and the growth in the number of mega projects are increasing globally.

114 Che Maznah Mat Isa, et. al.
Despite the host government’s huge capital allocation to facilitate country development and to create an impetus in driving demand (Memon, Rahman, Asmi, Aziz, & Abdullah, 2012), small- or medium-sized, the local contractors were frequently unable to meet the requirements of such projects which demand more foreign contractors to undertake such projects (Comu et al., 2015).
Firm factors
There are seven most significant firm factors, namely (1) LF23 - financial capacity; (2) LF24 - competencies (project management, specialist expertise and technology); (3) LF20 - international experience; (4) LF34 - track record/competitive advantages; (5) LF25 - knowledge and, research and development; (6) LF31 - international business network; and (7) LF21 - firm’s long term planning and strategic orientation.
The most significant factor influencing the firm’s EL decision is the strong financial capacity to support their export activities. For firms to start international operations, they need a large capital outlay to start an office, acquire resources, build networks and bear with a negative cash flow situation, as there may be no returns earned during the initial years (Curveo & Low, 2003). A strong financial capacity allows a firm to bid for large projects, recruit high quality and specialized staff, and complete projects on time (Curveo & Low, 2003). In addition, a firm with strong financial capacity has many advantages including having a better capacity to carry out far reaching and potential strategic plans; be able to take higher risks and thereby gain higher returns; and be recognized as having strong creditability and reputation among clients, subcontractors and suppliers (Gunhan & Arditi, 2005).
The next most significant firm factor is strong competencies in project management, specialist expertise and technology which was required to survive in international markets (Ling, William Ibbs, & Cuervo, 2005). The finding is consistent with Enshashi et al.’s, who found that specialist technical capabilities and project management competencies would ensure that a project is completed on time, within budget and to a desirable level of quality (Enshassi, Mohamed, & Karriri, 2010).
The third most significant factor is related to the firm’s international experience where fewer number of awarded contracts for international projects were found to have been given to firms with no prior international experience (Jung, Han, Park, & Kim, 2010). Thus, it is affirmed that as firms accumulate international experience, they develop resource-based capabilities for international market expansion by surmounting various obstacles and constraints that exist in the international markets (Guler & Guillén, 2009). Firms were found to have previous international experience with a project-based investment in a country prior to the project in another country (Stevens & Dykes, 2013). This experience provided the firm with the knowledge and skills necessary to operate a new project.
The next significant factor is the firm’s track record/competitive advantages. The firm’s qualification was assessed based on various civil and buildings work undertaken locally and internationally (Chen, 2005). Thus, a firm was selected due to its track record in local projects in Malaysia that complemented its foreign partners that have little experience in a particular type of project. Hence, establishing a good track record and competitive advantages including project management skills, specialist expertise and technological capabilities are very much

115International Market Entry Locational Factors Using Rasch Model
required to handle the complex nature of international projects. In addition, the firm’s EL decision to expand their business into new geographical areas helps to improve the firm’s track record by building up experience and gain a good reputation in international markets.
Knowledge on the chosen locations together with research and development (R&D) intensity play a significant role in the firm’s global operations, for example, knowledge on the host country’s law and regulations and other country factors discussed earlier in this section. In addition, it is a known fact that science and technology contribute towards the improved competitiveness of contractors. However, not many firms have their own research and development departments where the majority of R&D was undertaken by the government-commissioned research institutes and universities (Zhao et al., 2009). Thus, having a R&D department and/or increasing the intensity in R&D enhance the firm’s competitiveness and improve their international operating conditions.
One of the known barriers to international market expansion is a lack of business networks, which is of particular importance in the early stages of internationalization. Having strong international business networks has significantly influenced much of the firms’ market EL decision, and complemented their competitive assets (Abdul-Aziz & Wong, 2011). Hence, the active business network allowed the firms to form relationships which help them gain access to resources and international markets.
The last significant firm factor is the firm’s long-term and strong management strategic orientation/objectives. International operation is normally based on the firm’s strategy, goals, long-term objectives, commitment, financial and personnel resources, experience, technological capabilities as well as competitive advantages (Räsänen, 2010). This factor reflects a strong influence on the firms’ top management commitment and decision to expand into international markets (Tan, Brewer, & Liesch, 2007). A recent study García-Villaverde, Ruiz-Ortega, & Parra-Requena (2012) further supported that the top management firms’ long term planning and their objectives and profitability are also subject to the uncertainty of the market environment and the lack of information related to opportunities.
Project factors
Three most significant project factors influencing the EL decisions are: (1) LP39 - availability of project fund; (2) LP41 - experience of firms in similar projects; and (3) LP40 - contract types/procurement methods.
Availability of project fund is chosen as the most significant project factor influencing the firm’s EL decision to enter the targeted foreign markets. Project funding is obtained through various sources for examples, government loans or financial aid to developing countries, home bank loans or loans from the World Bank or Asian Development Bank (Low & Jiang, 2003). Globally, the increasing size and complexity of projects also increased the need for participation by construction firms in international markets (Comu et al., 2015). These large, complex and one-off nature of projects require provision of critical resources such as operation and capital expenditures (Ofori, 2003). Thus, once a firm secures a project in a host country, funding from these sources have to be allocated and used efficiently (Abdul-Aziz & Wong, 2008). Even though large and complex projects are susceptible to high cost and time over-run, for firms targeting high profits, these projects have attracted them to venture into distant

116 Che Maznah Mat Isa, et. al.
markets such as United States and Germany. Thus, lack of project funding can be considered as a risk for the firm to successfully determine the suitable EL and finally deliver the projects on time and within quality stipulated by the client.
International projects involve heavy construction, building and process industries. Generally, a diverse project mix is preferable as it reduces reliance on a particular end-user market segment (Bauml, 1997). Thus, the “experience of firms in similar projects” is believed to be of great importance in the firm’s EL decision by taking projects both locally and internationally by effectively capitalizing their competitive advantages. In addition, having similar project experience in the same region is estimated to be important to win contracts during the re-boom period (Jung et al., 2012). Thus, firms without prior foreign market experience are likely to have greater problems in managing international operations. They have been observed to overstate the potential risks, while understating the potential returns of operating in a foreign market (Chen, 2005).
International projects involve various types of contracts or procurement methods. However, a primary focus on a sector with sufficiently large contract volumes, adequate profit margins and relative stability is preferred and acceptable (Bauml, 1997). Most international projects are tendered for competitively, on either a “cost plus fixed fee” or a “fixed price/lump sum” basis [27]. Even though, the former method minimizes risk to the contractor, it also limits profit potential. Thus, demonstrated superior cost-estimating abilities hold the prospect for above-average profitability for those firms bidding for fixed-price contracts [27].
CONCLUSIONS
The Rasch Model analysis reveals important locational factors or advantages related to the host government’s attitudes and interventions towards foreign investments. The firm’s EL decisions allow them to gain access to different locations around the world regardless of the geographical proximity of host country. Firstly, the firms seek strong and stable established relationships between home and host countries and secure adequate loans from the home banks before setting footholds in international markets. Second, the firms evaluate the host market signal based on its size, growth and the available opportunities. The market potential and construction demand in the host countries counter balance each other and rule out the role of geographical proximity. Third, the firm’s strategic orientation and objectives govern the firm’s EL decision to expand into the host countries. The EL decision not only requires the commitment on financial and human resources but also the firm’s experience, knowledge and international networks. Finally, with an adequate project fund reinforced by prior experience in similar projects and using appropriate procurement methods, the firms deliver successful projects on time and within quality stipulated by their respective clients. It is hoped that the results can assist the construction firms in their pursuit of global market ventures. This study has made some significant empirical contributions to the international entry location decision strategy for construction firms. However, there are some limitations in terms of the scope of this study. Nevertheless, further research could examine the relationships of the EL decision dimension and factors by determining any causal sequences using structural equation-modelling (SEM) for a larger sample size of firms.
ACKNOWLEDGEMENT
We would like to thank the Faculty of Civil Engineering, UiTM, for giving support and

117International Market Entry Locational Factors Using Rasch Model
to the Research Management Institute, UiTM, Malaysia and Ministry of Science, Technology and Innovation (MOSTI) for providing the financial support (E-science fund :100-RMI/SF 16/6/2 (33/2012)). We are also grateful to the professionals and managers from Malaysian construction firms, CIDB Malaysia and other institutions for their participation in this research.
REFERENCES
Abdul Aziz, A. (2011). Rasch Model Fundamentals: Scale construct and measurement structure. Kuala Lumpur: Integrated Advance Planning Sdn Bhd.
Abdul-Aziz, A.-R., & Wong, S.-S. (2008). Locational Factors and Foreign Market-entry Considerations for Malaysian Contractors. The Australasian Journal of Construction Economics and Building, 9(1), 27–36.
Abdul-Aziz, A.-R., & Wong, S.-S. (2011). Business networks and internationalisation of contractors from developing countries: An explorative study. Engineering, Construction and Architectural Management, 18(3), 282–296. doi:10.1108/09699981111126188
Bauml, S. (1997). Engineering and Construction : Building a Stronger Global Industry. Journal of Management in Engineering, Special Is(September/October), 21–24.
Boeh, K. K., & Beamish, P. W. (2012). Travel time and the liability of distance in foreign direct investment: Location choice and entry mode. Journal of International Business Studies, 43(5), 525–535. doi:10.1057/jibs.2012.10
Buckley, P. J., & Casson, M. C. (1998). Analyzing Extending Foreign the Market Entry Strategies : Internalization Approach. Journal of International Business and Entrepreneurship Development, 29(3), 539–561.
Che Ibrahim, C. K. I., Ayub, A. R., Ahzahar, N., & Hassan, S. H. (2009). Exploring International Construction Projects : Views from Malaysian Construction Firms. Esteem Academic Journal, 5(2), 1–23.
Che Ibrahim, C. K. I., Mohd Baki, A., Mat Isa, C. M., Endut, I. R., & Ghani, M. K. (2009). Mode of Entry into International Construction Contracts: Views from Malaysian Construction Firms. In Second Construction Industry Research Achievement International Conference (CIRIAC2009) (pp. 1–11).
Chen, C. (2005). Entry Strategies for International Construction Markets. The Pennsylvania State University.
CIDB Malaysia. (2013). Construction Industry Development Board Malaysia Record. Retrieved from www.cidb.gov.my
Comu, S., Taylor, J. E., & Messner, J. I. (2015). Two-Dimensional Globalizing Index and Globalizing Self-Assessment Tool for Engineering and Construction Companies. Journal of Management in Engineering, 31(2), 2520–2529. doi:10.1061/9780784412329.253
Cuervo-Cazurra, A. (2011). Selecting the country in which to start internationalization: The non-sequential internationalization model. Journal of World Business, 46(4), 426–437. doi:10.1016/j.jwb.2010.10.003
Curveo, J. C., & Low, S. P. (2003). Ownership advantages/disadvantages of Singapore transnational construction corporations”,. Construction Management and Economics, 21, 80–94.
El-higzi, F. A. (1999). Foreign Market Selection Factors in the Australian Construction Service Sector. Australian Journal of Construction Economics and Buildings, 2(1), 107–120.
Enshassi, A., Mohamed, S., & Karriri, A. El. (2010). Factors affecting the bid/no bid decision

118 Che Maznah Mat Isa, et. al.
in the Palestinian construction industry. Journal of Financial Management of Property and Construction, 15(2), 118–142. doi:10.1108/13664381011063421
García-Villaverde, P. M., Ruiz-Ortega, M. J., & Parra-Requena, G. (2012). Towards a comprehensive model of entry timing in the ICT industry: Direct and indirect effects. Journal of World Business, 47(2), 297–310. doi:10.1016/j.jwb.2011.04.017
Green, K., & Frantom, C. (2002). Survey development and validation with the Rasch model. In International Conference on Questionnaire Development, Evaluation, and Testing (pp. 1–30).
Guler, I., & Guillén, M. F. (2009). Institutions and the internationalization of US venture capital firms. Journal of International Business Studies, 41(2), 185–205. doi:10.1057/jibs.2009.35
Gunhan, S., & Arditi, D. (2005). Factors Affecting International Construction. Journal of Construction Engineering and Management, 131(March), 273–282.
Head, K., & Mayer, T. (2004). Market Potential and the Location of Japanese Investment in the European Union. Review of Economics and Statistics, 86(4), 959–972. doi:10.1162/0034653043125257
Jain, N. K. (2010). Resource , Strategies , Location Determinants , And Host Country Location Choice By Emerging Market Firms. Florida International University. Retrieved from http://digitalcommons.fiu.edu/etd/147
Jung, W., Han, S. H., Koo, B., Jang, W., Asce, M., Koo, B., & Jang, W. (2012). Which Strategies Are More Effective for International Contractors during Boom and Recession Periods ? Journal of Management in Engineering, 28(3), 281–290. doi:10.1061/(ASCE)ME.1943-5479.0000087.
Jung, W., Han, S. H., Park, H., & Kim, D. Y. (2010). Empirical Assessment of Internationalization Strategies for Small and Medium Construction Companies. Journal of Construction Engineering and Management, 136(December), 1306–1316.
Kaur, S., & Sandhu, M. S. (2014). Internationalisation of born global firms: Evidence from Malaysia. Journal of the Asia Pacific Economy, 19(1), 101–136. doi:10.1080/13547860.2013.818426
Kunnanatt, J. T. (2011). Global business chain and twin advantage: Strategic opportunities for developing countries. Competitiveness Review: An International Business Journal Incorporating Journal of Global Competitiveness, 21(4), 352–368. doi:10.1108/10595421111152156
Linacre, J. M. (2011). A users guide to WINSTEPS MINISTEP : Rasch-Model Compuer Programs. Chicago IL: Winsteps. Retrieved from http://ifile.hkedcity.net/1/001/950/public/Secondary/EI0020070012/winsteps.pdf
Ling, F. Y. Y., Ibbs, C. W., & Chew, E. W. (2008). Strategies Adopted by International Architectural , Engineering , and Construction Firms in Southeast Asia. Journal of Professional Issues in Engineering Education and Practice, 134(3), 248–256.
Ling, F. Y. Y., William Ibbs, C., & Cuervo, J. C. (2005). Entry and business strategies used by international architectural, engineering and construction firms in China. Construction Management and Economics, 23(5), 509–520. doi:10.1080/01446190500040141
Low, S. P., & Jiang, H. (2003). Internationalization of Chinese Construction Enterprises. Journal of Construction Engineering and Management, 129(6).
Lu, J., Liu, X., Wright, M., & Filatotchev, I. (2014). International experience and FDI location choices of Chinese firms: The moderating effects of home country government support and host country institutions. Journal of International Business Studies, 1(1), 1–22.

119International Market Entry Locational Factors Using Rasch Model
doi:10.1057/jibs.2013.68Malhotra, S., Sivakumar, K., & Zhu, P. (2009). Distance factors and target market selection:
the moderating effect of market potential. International Marketing Review, 26(6), 651–673. doi:10.1108/02651330911001332
Memon, A. H., Rahman, I. A., Asmi, A., Aziz, A., & Abdullah, N. H. (2012). Using Structural Equation Modelling to Assess Effects of Construction Resource Related Factors on Cost Overrun Faculty of Civil and Environmental Engineering , Faculty of Technology Management , Business and Entrepreneurship ,. World Applied Science Journal: Mathematical Applications in Engineering, 20, 6–15. doi:10.5829/idosi.wasj.2012.20.mae.9995
Ofori, G. (2003). Frameworks for analysing international construction Frameworks for analysing international construction. Construction Management and Economics, 21(4), 37–41. doi:10.1080/0144619032000049746
Ozorhon, B., Arditi, D., Dikmen, I., Birgonul, M. T., Asce, M., Dikmen, I., & Birgonul, M. T. (2010). Performance of International Joint Ventures in Construction. Journal of Management in Engineering, 26(4), 209–222.
Papadopoulos, N., & Martín, O. M. (2011). International market selection and segmentation: perspectives and challenges. International Marketing Review, 28(2), 132–149. doi:10.1108/02651331111122632
Puljeva, A., & Widen, P. (2007). The influence of internal and external factors on entry modes. Lulea University of Technology.
Räsänen, P. (2010). Internationalization path to the United Arab Emirates. Savonia University of Applied Sciences.
Sakarya, S., Eckman, M., & Hyllegard, K. H. (2007). Market selection for international expansion. International Marketing Review, 24(2), 208–238. doi:10.1108/02651330710741820
Stevens, C. E., & Dykes, B. J. (2013). The Home Country Cultural Determinants of Firms’ Foreign Market Entry Timing Strategies. Long Range Planning, 46(4-5), 387–410. doi:10.1016/j.lrp.2013.06.003
Tan, A., Brewer, P., & Liesch, P. W. (2007). Before the first export decision: Internationalisation readiness in the pre-export phase. International Business Review, 16(3), 294–309. doi:10.1016/j.ibusrev.2007.01.001
Villaverde, P. M. G., & Ortega, M. J. R. (2007). Determinants of Entry Timing: Firm Capabilities and Environmental Conditions. Management Research, 5(2), 101–112. doi:10.2753/JMR1536-5433050203
Xu, T., Bower, D. a., & Smith, N. J. (2005). Types of collaboration between foreign contractors and their Chinese partners. International Journal of Project Management, 23(1), 45–53. doi:10.1016/j.ijproman.2004.05.012
Yavan, N. (2010). The Location Choice of Foreign Direct Investment Within Turkey: An Empirical Analysis. European Planning Studies, 18(10), 1675–1705. doi:10.1080/09654313.2010.504350
Zhao, Z. Y., Shen, L. Y., Asce, M., Zuo, J., Asce, M., & Zuo, J. (2009). Performance and Strategy of Chinese Contractors in the International Market. Journal of Construction Engineering and Management, 135(February), 108–118.
Zhu, H., Eden, L., Miller, S. R., Thomas, D. E., & Fields, P. (2012). Host-country location decisions of early movers and latecomers: The role of local density and experiential learning. International Business Review, 21(2), 145–155. doi:10.1016/j.ibusrev.2011.02.004


121Guide to Authors
GUIDE TO AUTHORSAims and Scope:
The Malaysian Construction Research Journal (MCRJ) is the journal dedicated to the documentation of R&D achievements and technological development relevant to the construction industry within Malaysia and elsewhere in the world. It is a collation of research papers and other academic publications produced by researchers, practitioners, industrialists, academicians, and all those involved in the construction industry. The papers cover a wide spectrum encompassing building technology, materials science, information technology, environment, quality, economics and many relevant disciplines that can contribute to the enhancement of knowledge in the construction field. The MCRJ aspire to become the premier communication media amongst knowledge professionals in the construction industry and shall hopefully, breach the knowledge gap currently prevalent between and amongst the knowledge producers and the construction practitioners.
Articles submitted will be reviewed and accepted on the understanding that they have not been published elsewhere. The authors have to fill the Declaration of the Authors form and return the form via fax to the secretariat. The length of articles should be between 3,500 and 8,000 words or approximately 8 – 15 printed pages (final version). The manuscripts should be written in English. The original manuscript should be typed one sided, single-spacing, single column with font of 11 point (Times New Roman). Paper size should be of Executive (18.42 cm x 26.67 cm) with 2 cm margins on the left, right and bottom and 3 cm for the top. Authors can submit the manuscript:
• By e-mail to [email protected] / [email protected] / [email protected]• By hardcopy and softcopy in Microsoft-Word format to MCRJ Secretariat:
Malaysian Construction Research Journal (MCRJ)Construction Research Institute of Malaysia (CREAM)MAKMAL KERJA RAYA MALAYSIA1st Floor, Block E, Lot 8, Jalan Chan Sow Lin, 55200 Kuala LumpurMALAYSIA
Tel. : (6)03 – 9281 0800Fax : (6)03 – 9282 4800Website : www.cream.my

122 Guide to Authors
Type of fonts: All text, drawing, graph must be written using Times New RomanLanguage: Follow the spelling of the Oxford English Dictionary.Size/Page Setup: Executive (18.42 cm x 26.67 cm)Paper title: Arial, 16.
CODIFICATION AND APPLICATION OF SEMI-LOOF ELEMENTS FOR COMPLEX STRUCTURESAuthor’s name (full name): Arial, 9pt. should follow below the title.
Jamalodin Noorzaei1, Mohd. Saleh Jaafar, Abdul Waleed Thanoon, Wong Jern Nee
Affiliation (including post codes): Arial, 9pt. Use numbers to indicate affiliations.
1Department of Civil Engineering, Faculty of Engineering, Universiti Putra Malaysia, 43400 UPM, Serdang, Selangor, Malaysia
Abstract: Arial Bold, 9pt. Left and right indent 0.64 cm.
Abstract: it should be single paragraph of about 100 – 250 words.
Keywords: Times New Roman Bold, 9pt (Italic). Left and right indent 0.64 cm.
Keywords: Cooling tower; Finite element code; Folded plate; Semiloof shell; Semiloof beam
Body Text: Times New Roman, 11 pt. All paragraph must be differentiate by 0.64 cm tab.
Heading 1: Arial Bold + Upper Case, 11pt.Heading 2: Arial Bold + Lower Case, 11pt.Heading 3: Arial Italic + Lower Case, 11pt.
Units: All units and abbreviations of dimensions should conform to SI standards.
Figures: Figures should be in box with line width 0.5pt. All illustrations and photographs must be numbered consecutively as it appears in the text and accompanied with appropriate captions below them.
Figures caption: Arial Bold + Arial, 9pt. should be written below the figures.

123Guide to Authors
151821242730333639
23 25 27 29 31 33 35 37Outdoor temperature oC
Att
ic te
mpe
ratu
re
o C
Predicted temperature before sealing the atticPredicted temperature after sealing the attic
Figure 8. Computed attic temperature with sealed and ventilated attic
Tables: Arial, 8pt. Table should be incorporated in the text.
Table caption: Arial Bold + Arial, 9pt. Caption should be written above the table.
Table Line: 0.5pt.
Table 1. Recommended/Acceptable Physical water quality criteria
Parameter Raw Water Quality Drinking Water Quality
Total coliform (MPN/100ml) 500 0Turbidity (NTU) 1000 5
Turbidity (NTU) 300 15
pH 5.5-9.0 6.5-9.0 (Source: Twort et al. 1985; MWA,1994)
Reference: Times New Roman, 11pt. Left indent 0.64 cm, first line left indent – 0.64 cm. Reference should be cited in the text as follows: “Berdahl and Bretz (1997) found…” or “(Bower et al. 1998)”. References should be listed in alphabetical order, on separate sheets from the text. In the list of References, the titles of periodicals should be given in full, while for books should state the title, place of publication, name of publisher, and indication of edition.
JournalSze, K. Y. (1994) Simple Semi-Loof Element for Analysing Folded-Plate Structures. Journal of
Engineering Mechanics, 120(1):120-134.
BooksSkumatz, L. A. (1993) Variable Rate for Municipal Solid Waste: Implementation, Experience,
Economics and Legislation. Los Angeles: Reason Foundation, 157 pp.
ThesisWong, A. H. H. (1993) Susceptibility To Soft Rot Decay In Copper-Chrome-Arsenic Treated and
Untreated Malaysian Hardwoods. Ph.D. Thesis, University of Oxford. 341 pp.

124 Guide to Authors
Chapter in bookJohan, R. (1999) Fire Management Plan For The Peat Swamp Forest Reserve Of North Selangor and
Pahang. In Chin T.Y. and Havmoller, P. (eds) Sustainable Management of Peat Swamp Forests in Peninsular Malaysia Vol II: Impacts. Kuala Lumpur: Forestry Department Malaysia, 81-147.
ProceedingsSiti Hawa, H., Yong, C. B. and Wan Hamidon W. B. (2004) Butt Joint In Dry Board As Crack Arrester.
Proceeding of 22nd Conference of ASEAN Federation of Engineering Organisation (CAFEO 22). Myanmar, 55-64.