making marston’s THE PLACE TO BE€™s PLC Annual Report and Accounts 2015 making marston’s THE...
132
Marston’s PLC Annual Report and Accounts 2015 making marston’s THE PLACE TO BE
Transcript of making marston’s THE PLACE TO BE€™s PLC Annual Report and Accounts 2015 making marston’s THE...
Marston’s PLC Annual Report and Accounts 2015
making marston’s
THE PLACE TO BE
Marston’s PLC Annual Report and Accounts 2015
making marston’s
THE PLACE TO BE
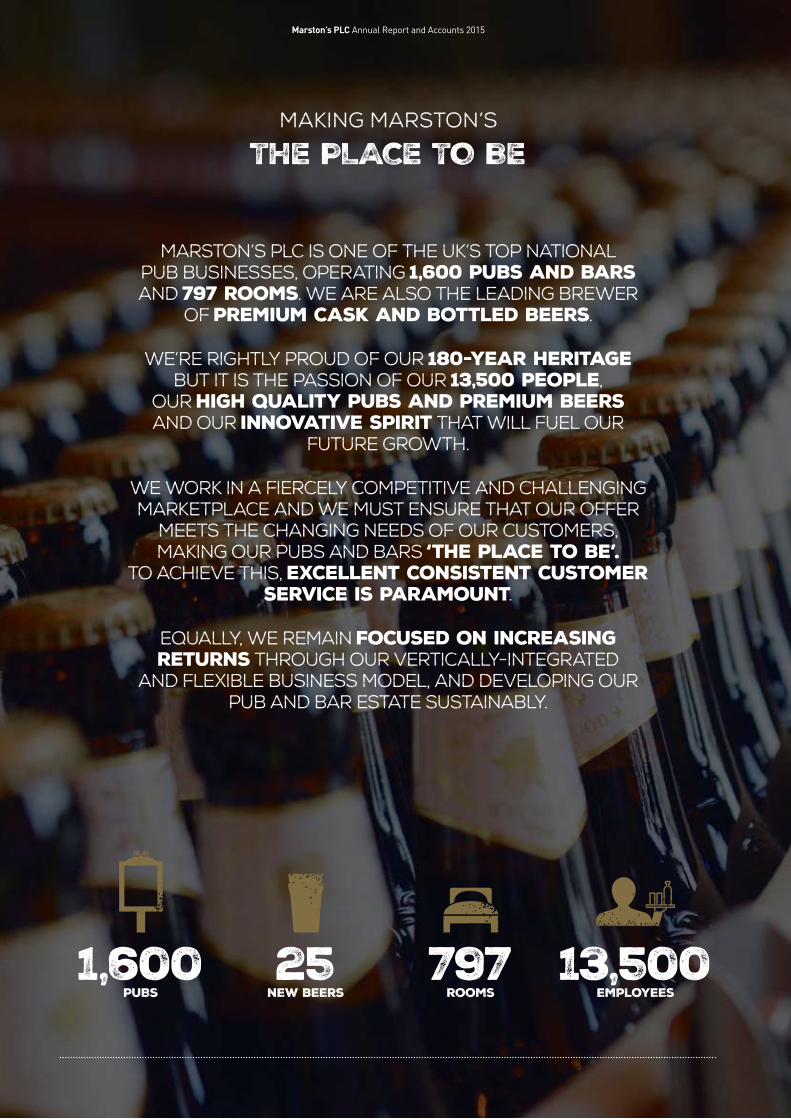
Marston’s PLC is one of the UK’s top national pub businesses, operating 1,600 pubs and bars and 797 rooms. We are also the leading brewer
of premium cask and bottled beers.
We’re rightly proud of our 180-year heritage but it is the passion of our 13,500 people,
our high quality pubs and premium beers and our innovative spirit that will fuel our
future growth.
We work in a fiercely competitive and challenging marketplace and we must ensure that our offer
meets the changing needs of our customers, making our pubs and bars ‘the place to be’.
To achieve this, excellent consistent customer service is paramount.
Equally, we remain focused on increasing returns through our vertically-integrated
and flexible business model, and developing our pub and bar estate sustainably.
1,600 25 797 13,500 PUBS new beers rooms employees
Strategic report Governance Financial statements Additional information
In THIS
REPORT
A snapshot of 2015(52 weeks ended 3 October 2015)
• Strong trading performance, underlying Group revenue up 7%
• transformation of Pub estate well advanced, average profit per pub up to £100k
• market-leading beer business continues to grow strongly
• Underlying earnings per share up 10% to 12.9 pence
• Final dividend, up 4.7% to 4.5 pence, reflecting progress and confidence in strategy
• well positioned for growth in 2016
underlying* revenue underlying* operating profit
£845.5m £165.4munderlying* PROFIT before tax total dividend per share
£91.5m 7.0p* The underlying results reflect the performance of the Group before exceptional and other adjusting items.
The Directors consider that these figures provide a useful indication of the underlying performance of the Group.
THE PLACE TO BE FOR INVESTORS This year we have incorporated material on our people and community
involvement into our main narrative repor t. Additional Corporate Responsibility
information can be found on our website.
For full year-end press release, preliminary results presentation,
webcast and video of summar y of the year, visit:
www.marstons.co.uk/corporate
Strategic Report
A Snapshot of 2015
The Place to Be Chairman’s Statement
Chief Executive’s Statement
Market Overview
Our Business Model
A Clear Strategy
Our Strategic Pillars in Action
Measuring Our Progress (KPIs)
Operating Review
Risks and Risk Management
Principal Risks and Uncertainties
Performance and Financial Review
Governance
Corporate Governance Report
Board of Directors
Audit Committee Report
Nomination Committee Report
Directors’ Remuneration Report
Other Statutory Information
Statement of Directors’
Responsibilities
1 2 – 3
4 5
6 – 7 8 – 9
10 11 – 15 16 – 17 18 – 19 20 – 21 22 – 23 24 – 26
28 – 35 30 – 31 36 – 37
38 39 – 57 58 – 61
62
Financial Statements
Independent Auditors’ Report 64 – 68 Group Accounts 69 – 73 Notes to Group Accounts 74 – 112 Independent Auditors’ Report 113 – 114 Company Balance Sheet 115 Notes to Company Accounts 116 – 124 Five Year Record 125
additional Information
Information for Shareholders 126 – 127 Glossary and Picture Reference 128
1

Marston’s PLC Annual Report and Accounts 2015
The place to be
Across the nation
NATIONAL COVERAGE with a growing, quality estate We operate across the UK and are focused on developing a high quality estate. We have around 1,600 pubs and bars
and are on track to further improve the quality of our estate through planned new-builds and disposals.
Key
397 Destination and Premium
859 Taverns
341 LeasedSweet Chestnut,
Dunfermline 797Rooms
5Breweries Scotland
Penny Hedge, 11 Whitby
54
NORTH of england
89 1 261
129 102
midlands wales
134 2 43029
88 100 217 173 Marston’s Brewery, Burton upon Trent
24 134
2 68
309 42 Pitcher & Piano,
Swansea South of england
25new pub-restaurants
Gunn Inn, opened in 2015 West Sussex
2

Strategic report Governance Financial statements Additional information
The place to be
For drinking, eatingAnd staying
KNOWING WHAT OUR CUSTOMERS WANT – AND ACTING ON IT Our innovative spirit and keen knowledge of customer trends allows us to pioneer new ideas, products and formats
to ensure that we stand out in an increasingly competitive market.
Premium Bottled Ale (PBA) Report Our annual PBA Repor t published in
April 2015 revealed that six bottles of
Premium Bottled Ale are consumed
ever y second in the UK: one in five
is a Marston’s brand.
new-builds driving growth We have further extended our trading
geography to southern England and
Scotland with new pub-restaurants.
75 Rooms added in 2015 Three new lodges opened during the
period and five more are planned
for 2015/16. Look out for our new
Marston’s Inns website.
beer innovation and collaboration Our collaboration with Help for
Heroes, an ale created by three
injured veterans in partnership with
Marston’s, has helped raise in excess
of £100,000.
pub of the future (POTF) The POTF Board has been working
on its recommendations for a pub
that will attract the next generation of
pub-goers. We will be making some of
their ideas a reality.
food innovations/ development We have been developing our food
to suit more informal occasions and
flexible mealtimes. From better
burgers and pizzas to ‘Brinner’ and
mini-dish combinations.
community pub innovation To celebrate our cask ale heritage
our Masters of Cask platform aims to
widen the appeal of cask ale across
our pubs to a younger audience.
drinks range As well as our own-brewed ales,
our wines, spirits, cocktails and
non-alcoholic drinks are evolving
to meet consumer trends. This
includes bottomless soft drinks in
Generous George.
3
Marston’s PLC Annual Report and Accounts 2015
Chairman’s statement
the transformation of our pub portfolio is largely complete and has created significant shareholder value.
Since 2009 we have opened 134 new pub-restaurants.
OVERVIEW Our results demonstrate that we made good progress in 2015,
with turnover up 7.4% to £845.5 million, and underlying profit
before taxation up 10.2% to £91.5 million. In this report we
highlight improved leverage, return on capital and growth,
demonstrating the effectiveness of our strategy.
Our strategy to grow through investment in new-build pub-
restaurants and sell smaller wet-led pubs has been consistent
over several years, and has contributed to the transformation
of the business into a national pub operator. It has also
contributed to a significant improvement in the quality of our
pub estate as reflected in the 40% increase in average profit
per pub since 2012 and, as a consequence, created significant
shareholder value.
This year, we allocated more capital to Premium pubs and
lodges, exploiting skills and assets already present in the
Marston’s business and I anticipate that will continue in 2016.
Investment for the future will remain a key component of
our plans.
In Brewing, our strategy remains consistent with increased
consumer demand for choice, quality and provenance in beer.
The acquisition of Thwaites’ beer business in April 2015 further
strengthened our market-leading ale brand portfolio in a
growing segment of the market.
Operational effectiveness is critical; we continue to work hard to
ensure that our pubs are attractive in a very competitive leisure
market and to build on our excellent portfolio of beers. We have
performed ahead of our peers in pubs and in brewing, so there
is clear evidence that our operational focus is working.
BOARD The appointments of Carolyn Bradley and Catherine Glickman
as Non-executive Directors this year added marketing and
people skills to the Board. This contributed to the development
of our strategic plans, the level of challenge and balance of
the Board. We have a good blend of skills and experience on
the Board and expect all Directors to contribute effectively to
governance matters and our business development.
DIVIDEND We have a progressive dividend policy linked to earnings,
while targeting dividend cover of two times over the medium
term. The proposed final dividend of 4.5 pence per share
provides a total dividend for the year of 7.0 pence per share,
and represents a 4.5% increase on 2014. The proposed 4.5%
increase is supported by strong earnings growth and improved
dividend cover. Dividend cover was 1.8 times (2014: 1.7 times).
PEOPLE These results reflect the hard work of all who have worked for
Marston’s this year and their contributions are appreciated.
We now have around 13,500 employees across the Group; I am
confident that our plans to make Marston’s ‘The Place to Be’
and put people at the heart of all we do will reflect their value
to our business and will offer good opportunities for further
development and training.
OUTLOOK The effective implementation of our clear, differentiated
strategy together with good governance and ensuring that
shareholder interests are paramount are the main areas of
focus for the Board. I am confident that this will lead to the
continued creation of shareholder value and that our strategy is
appropriate for current market conditions.
Roger Devlin Chairman
4
Strategic report Governance Financial statements Additional information
Chief executive’s statement
earnings growth across all of our business segments with a high quality portfolio of pub assets and a market-
leading beer business.
PERFORMANCE OVERVIEW We have achieved earnings growth across all of our business
segments, with double digit growth in underlying earnings,
demonstrating further good progress in implementing our
strategy. The three-year transformation of our pub portfolio
is now largely complete and we enter 2016 with a high quality
portfolio of pub assets which are fit for the future.
STRATEGY OVERVIEW Our strategy has been consistent over a number of years and is
focused on the ongoing improvement in the quality of our pub
estate through the continuation of our new-build programme
and the disposal of lower-end pubs which no longer have a
sustainable future. We operate a pub estate that caters for a
broad range of customers, with flexible operating models.
In Brewing, our focus remains on growing our portfolio of
premium and regional beers, as this is the growth segment
of the market and we believe in the importance of local
provenance backed up by significant distribution capabilities.
People come first at Marston’s: we want Marston’s to be ‘The
Place to Be’ for our customers and for all our employees.
Read more about our strategy in action on pages 10 to 19.
KEY EVENTS During the period we opened 25 pub-restaurants and we
completed the acquisition of Thwaites’ beer division, including
the Wainwright and Lancaster Bomber brands, for a total cash
consideration of £25.2 million before working capital.
Underlying profit before tax was up 10.2% to £91.5 million
(2014: £83.0 million) principally reflecting the contribution from
new pub-restaurants and a strong performance from Brewing.
Basic underlying earnings per share for the period increased by
10.3% to 12.9 pence per share (2014: 11.7 pence per share).
Net debt at the period end was £1,245 million. Excluding property
leases net debt amounted to £1,043 million of long-term,
structured finance with a stable repayment profile and no
exposure to increases in interest rates.
Read more in the Performance and Financial Review on pages
24 to 26.
CURRENT TRADING AND OUTLOOK The year has started well, with both pub trading and beer
volumes in line with expectations. At this early stage in the
year we remain confident of achieving our targets for the full
financial year and are on track to complete the new-build and
lodge expansion plans which, together with the disposal of the
remainder of our identified disposal assets, we expect to further
increase our return on capital employed and to improve the
quality of our business.
In April 2016, the National Living Wage will increase to £7.20
per hour for employees over 25. Approximately 60% of our
people are under the age of 25 and we have previously indicated
that the financial impact, compared to our existing plans, will
be moderate. Our focus will centre on improving the quality of
service to mitigate further the impact of the cost increase.
FINANCIAL OVERVIEW Ralph FindlayTotal underlying revenue increased by 7.4% from 2014 reflecting Chief Executive Officer like-for-like growth in our pubs, the impact of new openings,
growth in our beer brands and the acquisition of Thwaites’
beer business.
5
Marston’s PLC Annual Report and Accounts 2015
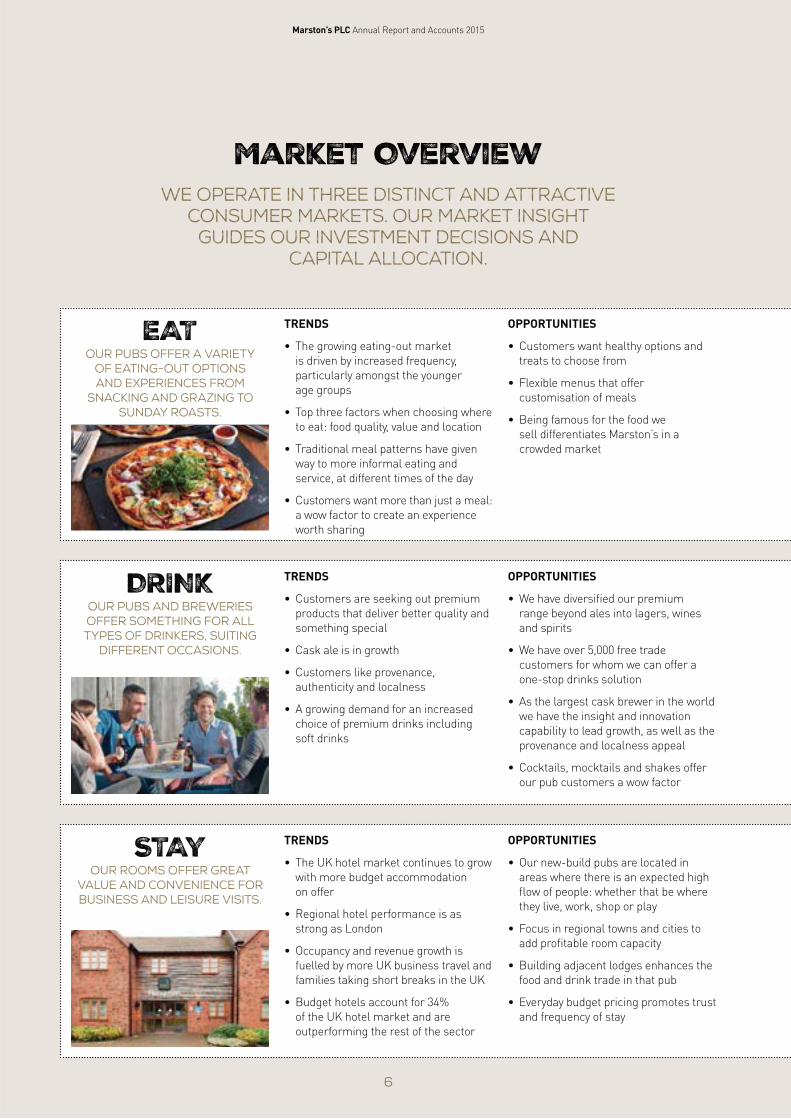
Market Overview we operate in three distinct and attractive
consumer markets. Our market insight guides our investment decisions and
capital allocation.
EAT Our pubs offer a variety
of eating-out options and experiences from
snacking and grazing to Sunday roasts.
TRENDS
• The growing eating-out market
is driven by increased frequency,
particularly amongst the younger
age groups
• Top three factors when choosing where
to eat: food quality, value and location
• Traditional meal patterns have given
way to more informal eating and
service, at different times of the day
• Customers want more than just a meal:
a wow factor to create an experience
worth sharing
OPPORTUNITIES
• Customers want healthy options and
treats to choose from
• Flexible menus that offer
customisation of meals
• Being famous for the food we
sell differentiates Marston’s in a
crowded market
DRINKOur pubs and breweries offer something for all types of drinkers, suiting
different occasions.
TRENDS
• Customers are seeking out premium
products that deliver better quality and
something special
• Cask ale is in growth
• Customers like provenance,
authenticity and localness
• A growing demand for an increased
choice of premium drinks including
soft drinks
OPPORTUNITIES
• We have diversified our premium
range beyond ales into lagers, wines
and spirits
• We have over 5,000 free trade
customers for whom we can offer a
one-stop drinks solution
• As the largest cask brewer in the world
we have the insight and innovation
capability to lead growth, as well as the
provenance and localness appeal
• Cocktails, mocktails and shakes offer
our pub customers a wow factor
STAY Our rooms offer great
value and convenience for business and leisure visits.
TRENDS
• The UK hotel market continues to grow
with more budget accommodation
on offer
• Regional hotel performance is as
strong as London
• Occupancy and revenue growth is
fuelled by more UK business travel and
families taking short breaks in the UK
• Budget hotels account for 34%
of the UK hotel market and are
outperforming the rest of the sector
OPPORTUNITIES
• Our new-build pubs are located in
areas where there is an expected high
flow of people: whether that be where
they live, work, shop or play
• Focus in regional towns and cities to
add profitable room capacity
• Building adjacent lodges enhances the
food and drink trade in that pub
• Everyday budget pricing promotes trust
and frequency of stay
6
Strategic report Governance Financial statements Additional information
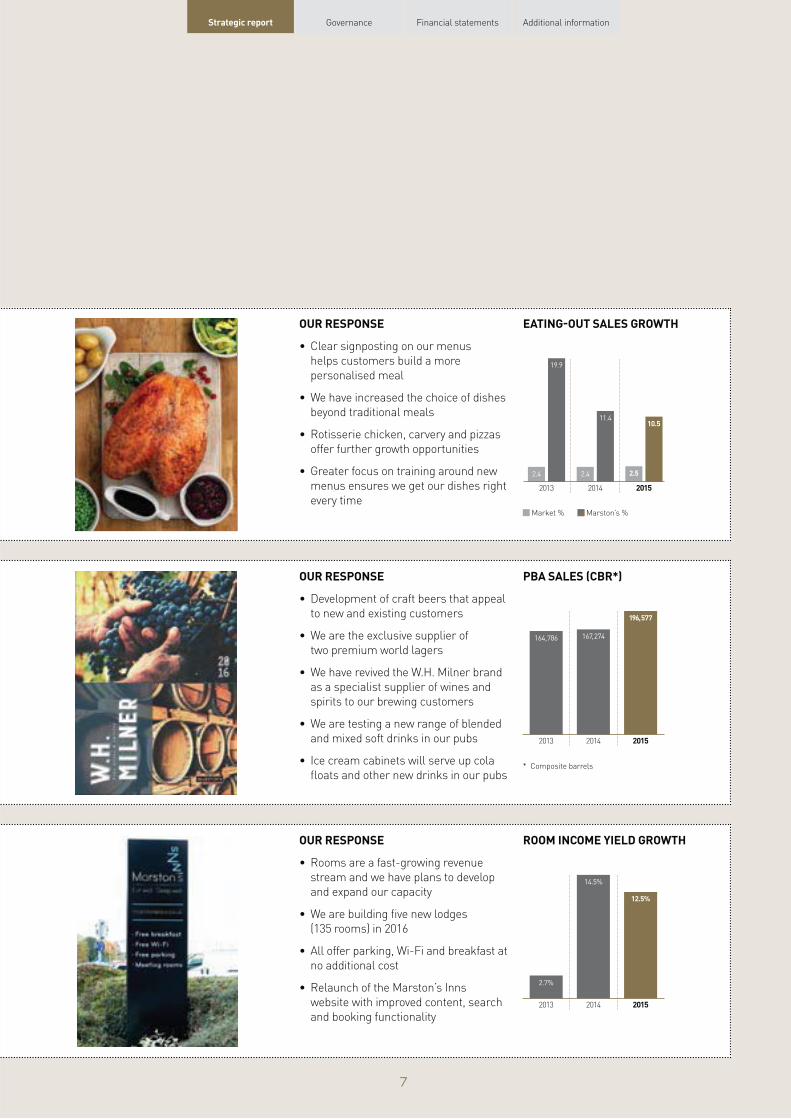
OUR RESPONSE EATING-OUT SALES GROWTH
• Clear signposting on our menus
helps customers build a more
personalised meal
• We have increased the choice of dishes
beyond traditional meals
• Rotisserie chicken, carvery and pizzas
offer further growth opportunities
• Greater focus on training around new
menus ensures we get our dishes right
every time Market % Marston’s %
2014 2015 2013
19.9
11.4 10.5
2.4 2.52.4
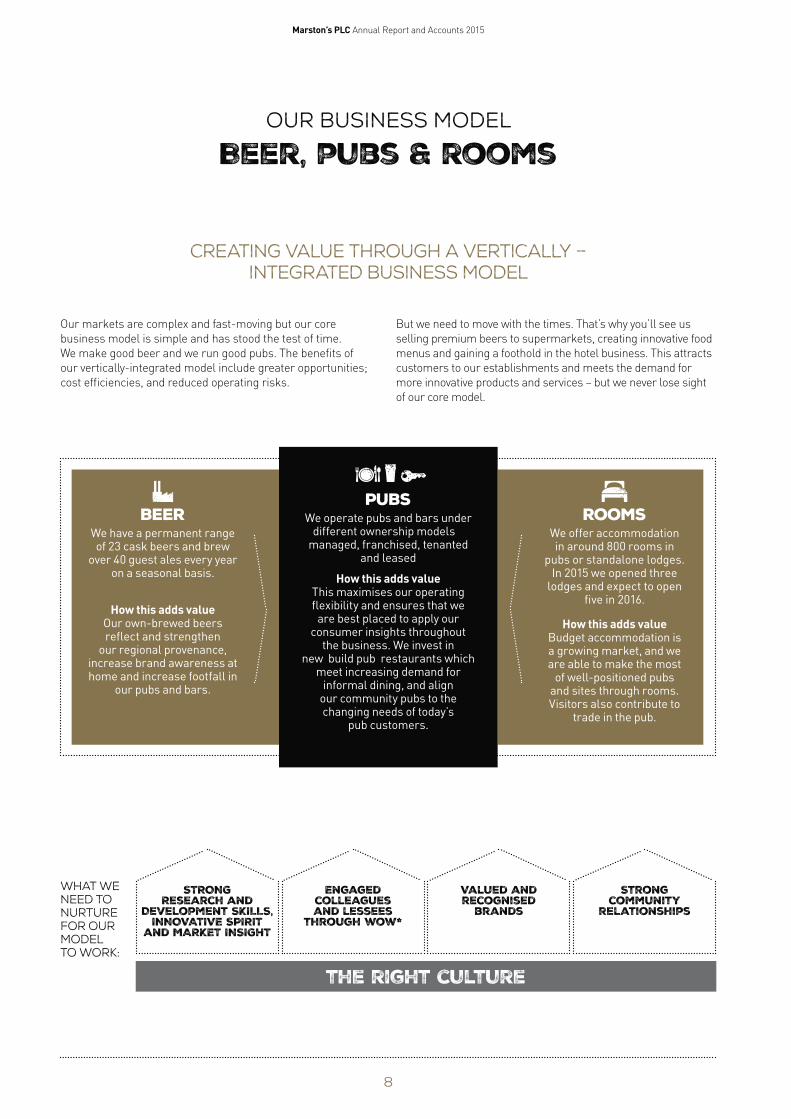
OUR RESPONSE PBA SALES (CBR*)
• Development of craft beers that appeal
to new and existing customers
• We are the exclusive supplier of
two premium world lagers
• We have revived the W.H. Milner brand
as a specialist supplier of wines and
spirits to our brewing customers
• We are testing a new range of blended
and mixed soft drinks in our pubs
164,786
2013
167, 274
196, 577
2014 2015
• Ice cream cabinets will serve up cola * Composite barrels
floats and other new drinks in our pubs
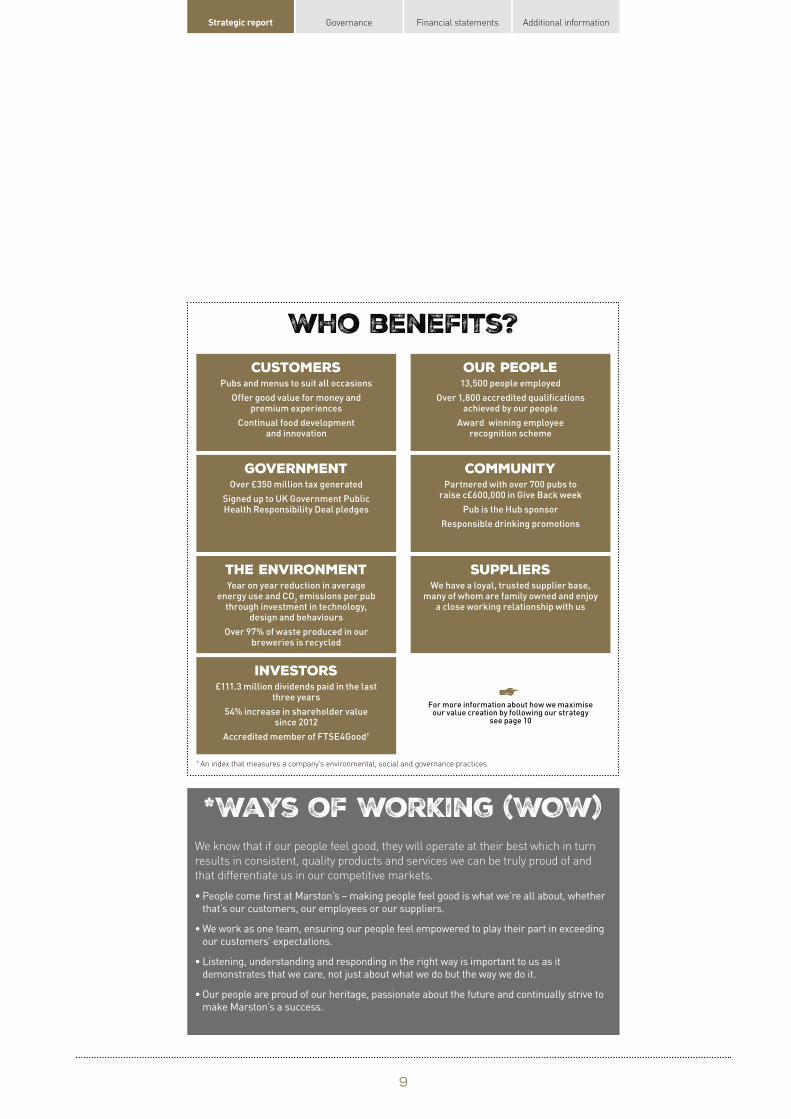
OUR RESPONSE ROOM INCOME YIELD GROWTH
• Rooms are a fast-growing revenue
stream and we have plans to develop
and expand our capacity
• We are building five new lodges
(135 rooms) in 2016
• All offer parking, Wi-Fi and breakfast at
no additional cost
• Relaunch of the Marston’s Inns
website with improved content, search
2.7%
2013
14.5%
12.5%
2014 2015
and booking functionality
7
–
- -
Marston’s PLC Annual Report and Accounts 2015
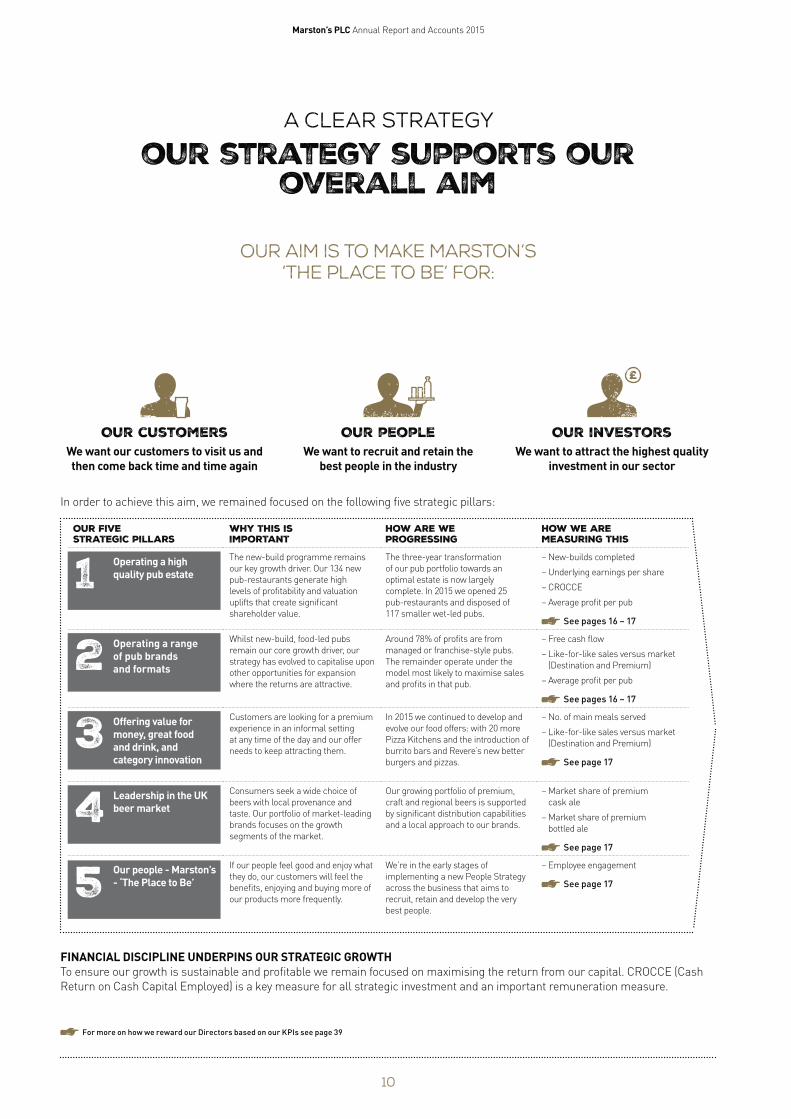
OUR BUSINESS MODEL
Beer, pubs & rooms
Creating value through a vertically – integrated business model
Our markets are complex and fast-moving but our core But we need to move with the times. That’s why you’ll see us
business model is simple and has stood the test of time. selling premium beers to supermarkets, creating innovative food
We make good beer and we run good pubs. The benefits of menus and gaining a foothold in the hotel business. This attracts
our vertically-integrated model include greater opportunities; customers to our establishments and meets the demand for
cost efficiencies, and reduced operating risks. more innovative products and services – but we never lose sight
of our core model.
Rooms We offer accommodation in around 800 rooms in
pubs or standalone lodges. In 2015 we opened three
lodges and expect to open five in 2016.
How this adds value Budget accommodation is a growing market, and we are able to make the most
of well-positioned pubs and sites through rooms. Visitors also contribute to
trade in the pub.
Beer We have a permanent range of 23 cask beers and brew
over 40 guest ales every year on a seasonal basis.
How this adds value Our own-brewed beers reflect and strengthen
our regional provenance, increase brand awareness at home and increase footfall in
our pubs and bars.
PUBS We operate pubs and bars under
different ownership models managed, franchised, tenanted
and leased
How this adds value This maximises our operating flexibility and ensures that we are best placed to apply our
consumer insights throughout the business. We invest in
new build pub restaurants which meet increasing demand for
informal dining, and align our community pubs to the changing needs of today’s
pub customers.
WHAT WE NEED TO NURTURE for our model to work:
STRONG Research and
Development SKILLS,INNOVATIVE SPIRIT
and MARKET INSIGHT
Engagedcolleaguesand lessees
through wow*
Valued and recognised
brands
Strongcommunity
relationships
the right culture
8
-
Strategic report Governance Financial statements Additional information
Who benefits? Customers
Pubs and menus to suit all occasions
Of fer good value for money and premium experiences
Continual food development and innovation
our people 13,500 people employed
O ver 1,8 00 accredited qualifications achieved by our people
Award winning employee recognition scheme
Government Over £350 million tax generated
Signed up to UK Government Public Health Responsibilit y Deal pledges
Community Par tnered with over 70 0 pubs to r aise c£60 0,00 0 in Give Back week
Pub is the Hub sponsor
Responsible drinking promotions
THE Environment Year on year reduction in aver age
SUPPLIERS
energy use and CO2 emissions per pub
through investment in technology, many of w hom are family owned and enjoy
design and behaviours
O ver 97 % of waste produced in our breweries is recycled
We have a loyal, tr usted supplier base,
a close working relationship with us
Investors £111.3 million dividends paid in the last
three years
54% increase in shareholder value since 2012
Accredited member of FTSE4Good†
For more infor mation about how we maximise our value creation by following our str ategy
see page 10
† An index that measures a company’s environmental, social and governance practices.
We know that if our people feel good, they will operate at their best which in turn
results in consistent, quality products and services we can be truly proud of and
that differentiate us in our competitive markets.
• People come first at Marston’s – making people feel good is what we’re all about, whether
that’s our customers, our employees or our suppliers.
• We work as one team, ensuring our people feel empowered to play their part in exceeding
our customers’ expectations.
• Listening, understanding and responding in the right way is important to us as it
demonstrates that we care, not just about what we do but the way we do it.
• Our people are proud of our heritage, passionate about the future and continually strive to
make Marston’s a success.
*Ways of Working (WOW)
9
Marston’s PLC Annual Report and Accounts 2015
A clear strategy
our strategy supports our overall aim
our aim is to make Marston’s ‘The Place to be’ for:
£
Our customers Our people Our investors We want our customers to visit us and We want to recruit and retain the We want to attract the highest quality then come back time and time again best people in the industry
In order to achieve this aim, we remained focused on the following five strategic pillars:
Our five strategic pillars
1
2
3
4
5
Operating a high quality pub estate
Operating a range of pub brands and formats
Offering value for money, great food and drink, and category innovation
Leadership in the UK beer market
Our people - Marston’s - ‘The Place to Be’
Why this is important
The new-build programme remains
our key growth driver. Our 134 new
pub-restaurants generate high
levels of profitability and valuation
uplifts that create significant
shareholder value.
Whilst new-build, food-led pubs
remain our core growth driver, our
strategy has evolved to capitalise upon
other opportunities for expansion
where the returns are attractive.
Customers are looking for a premium
experience in an informal setting
at any time of the day and our offer
needs to keep attracting them.
Consumers seek a wide choice of
beers with local provenance and
taste. Our portfolio of market-leading
brands focuses on the growth
segments of the market.
If our people feel good and enjoy what
they do, our customers will feel the
benefits, enjoying and buying more of
our products more frequently.
How are we progressing
The three-year transformation
of our pub portfolio towards an
optimal estate is now largely
complete. In 2015 we opened 25
pub-restaurants and disposed of
117 smaller wet-led pubs.
Around 78% of profits are from
managed or franchise-style pubs.
The remainder operate under the
model most likely to maximise sales
and profits in that pub.
In 2015 we continued to develop and
evolve our food offers: with 20 more
Pizza Kitchens and the introduction of
burrito bars and Revere’s new better
burgers and pizzas.
Our growing portfolio of premium,
craft and regional beers is supported
by significant distribution capabilities
and a local approach to our brands.
We’re in the early stages of
implementing a new People Strategy
across the business that aims to
recruit, retain and develop the very
best people.
investment in our sector
How we are measuring this
– New-builds completed
– Underlying earnings per share
– CROCCE
– Average profit per pub
See pages 16 – 17
– Free cash flow
– Like-for-like sales versus market
(Destination and Premium)
– Average profit per pub
See pages 16 – 17
– No. of main meals served
– Like-for-like sales versus market
(Destination and Premium)
See page 17
– Market share of premium
cask ale
– Market share of premium
bottled ale
See page 17
– Employee engagement
See page 17
FINANCIAL DISCIPLINE UNDERPINS OUR STRATEGIC GROWTH To ensure our growth is sustainable and profitable we remain focused on maximising the return from our capital. CROCCE (Cash
Return on Cash Capital Employed) is a key measure for all strategic investment and an important remuneration measure.
For more on how we reward our Direc tors based on our KPIs see page 39
10
Strategic report Governance Financial statements Additional information
OUR Strategic Pillars in action
1 Operating a highquality pub estate
BUILDING PUB-RESTAURANTS In our Destination business, we have opened over 130 pub-restaurants since 2009,
offering family dining at reasonable prices. These pubs generate high turnover,
with target sales of £25,000 per week and a food sales mix in excess of 60%.
We have an experienced site acquisition team and a well-established site selection
process. As a consequence this expansionary investment has generated consistent
returns and we have extended our trading geography to include southern England
and Scotland. New pub investment creates significant value for shareholders as
demonstrated in the pub estate valuation that took place in the financial year.
We opened 25 pub-restaurants in 2015, creating 1,250 jobs, and expect to open at
least 20 per annum for the foreseeable future, including our first new-build Taverns
pub in 2016.
BROADER INVESTMENT IN PREMIUM PUBS AND ACCOMMODATION In addition to the investment described above, we believe there is fur ther
oppor tunity to grow both our Premium pub business and accommodation. In 2015
we successfully converted two pubs from the existing estate to our Revere format
and opened three lodges adjacent to new-build pub-restaurants. Organic room
income has been consistently strong with sales growth exceeding 50% over
the last three years and we anticipate similar trends in the future with growth
in leisure and business visitors. Looking forward, we expect to continue this
expansion with two Premium bars and at least five lodges opening per annum.
CONTINUED GROWTH OF THE FRANCHISE MODEL We pioneered the introduction of
franchise-style agreements into the
pub sector. Our view remains that the
franchise operating model improves
the customer experience, attracts
quality franchisees to Marston’s and
enhances earnings in our community
pubs. In 2015, we introduced
franchise-style agreements into
a further 80 pubs. This year our
most successful franchisees have
generated turnover levels similar to
those in the Destination estate and
the first multiple franchisees have
been appointed.
The franchise model now operates in
550 pubs and it remains our intention
to convert the remaining pubs in the
Taverns estate to this model over the
next few years. We are also evaluating
the potential for franchise-style
agreements in the Destination estate.
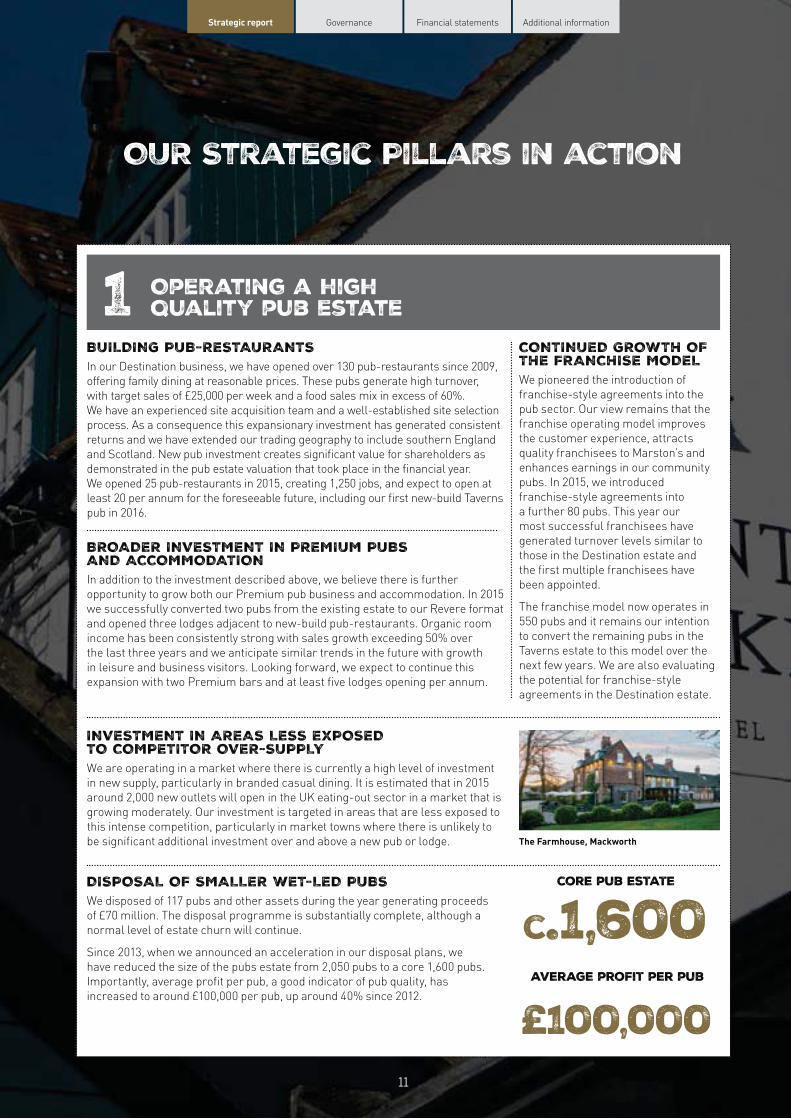
INVESTMENT IN AREAS LESS EXPOSED TO COMPETITOR OVER-SUPPLY We are operating in a market where there is currently a high level of investment
in new supply, particularly in branded casual dining. It is estimated that in 2015
around 2,000 new outlets will open in the UK eating-out sector in a market that is
growing moderately. Our investment is targeted in areas that are less exposed to
this intense competition, particularly in market towns where there is unlikely to
be significant additional investment over and above a new pub or lodge. The Farmhouse, Mackworth
DISPOSAL OF SMALLER WET-LED PUBS We disposed of 117 pubs and other assets during the year generating proceeds
of £70 million. The disposal programme is substantially complete, although a
normal level of estate churn will continue.
Since 2013, when we announced an acceleration in our disposal plans, we
have reduced the size of the pubs estate from 2,050 pubs to a core 1,600 pubs.
Importantly, average profit per pub, a good indicator of pub quality, has
increased to around £100,000 per pub, up around 40% since 2012.
core pub estate
c.1,600 average profit per pub
£100,000 11
Marston’s PLC Annual Report and Accounts 2015
OUR Strategic Pillars in action continued
2 Operating a range of pub brandsand formats
Around 78% of profits from our pubs are now generated by managed or franchise-style pubs in which Marston’s has direct
control over the retail offer ensuring that we are better able to deliver consistent service, standards and value across the
estate. This proportion will continue to increase as we build more pubs and convert most of the remaining tenanted pubs
to franchise-style agreements.
We operate a pub estate that caters for a broad range of customers, with flexible operating models. As a consequence we
ensure we have the right consumer offer, accompanied by the most appropriate operating model to maximise sales and profits
for each individual pub. The key elements of this are as follows:
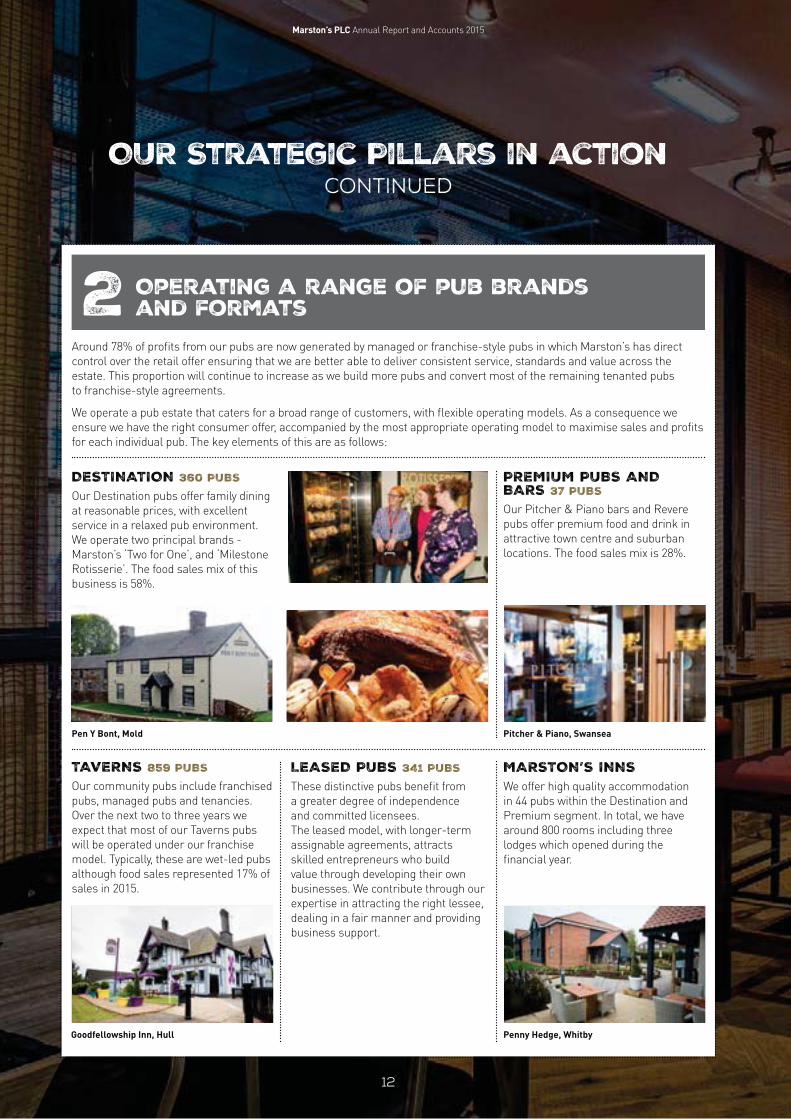
DESTINATION 360 PUBS
Our Destination pubs offer family dining
at reasonable prices, with excellent
service in a relaxed pub environment.
We operate two principal brands
Marston’s ‘Two for One’, and ‘Milestone
Rotisserie’. The food sales mix of this
business is 58%.
Pen Y Bont, Mold
PREMIUM PUBS AND BARS 37 PUBS
Our Pitcher & Piano bars and Revere
pubs offer premium food and drink in
attractive town centre and suburban
locations. The food sales mix is 28%.
Pitcher & Piano, Swansea
TAVERNS 859 PUBS
Our community pubs include franchised
pubs, managed pubs and tenancies.
Over the next two to three years we
expect that most of our Taverns pubs
will be operated under our franchise
model. Typically, these are wet-led pubs
although food sales represented 17% of
sales in 2015.
Goodfellowship Inn, Hull
LEASED PUBS 341 PUBS
These distinctive pubs benefit from
a greater degree of independence
and committed licensees.
The leased model, with longer-term
assignable agreements, attracts
skilled entrepreneurs who build
value through developing their own
businesses. We contribute through our
expertise in attracting the right lessee,
dealing in a fair manner and providing
business support.
MARSTON’S INNS We offer high quality accommodation
in 44 pubs within the Destination and
Premium segment. In total, we have
around 800 rooms including three
lodges which opened during the
financial year.
Penny Hedge, Whitby
12
Strategic report Governance Financial statements Additional information
3 Offering value for money, great foodand drink, and category innovation
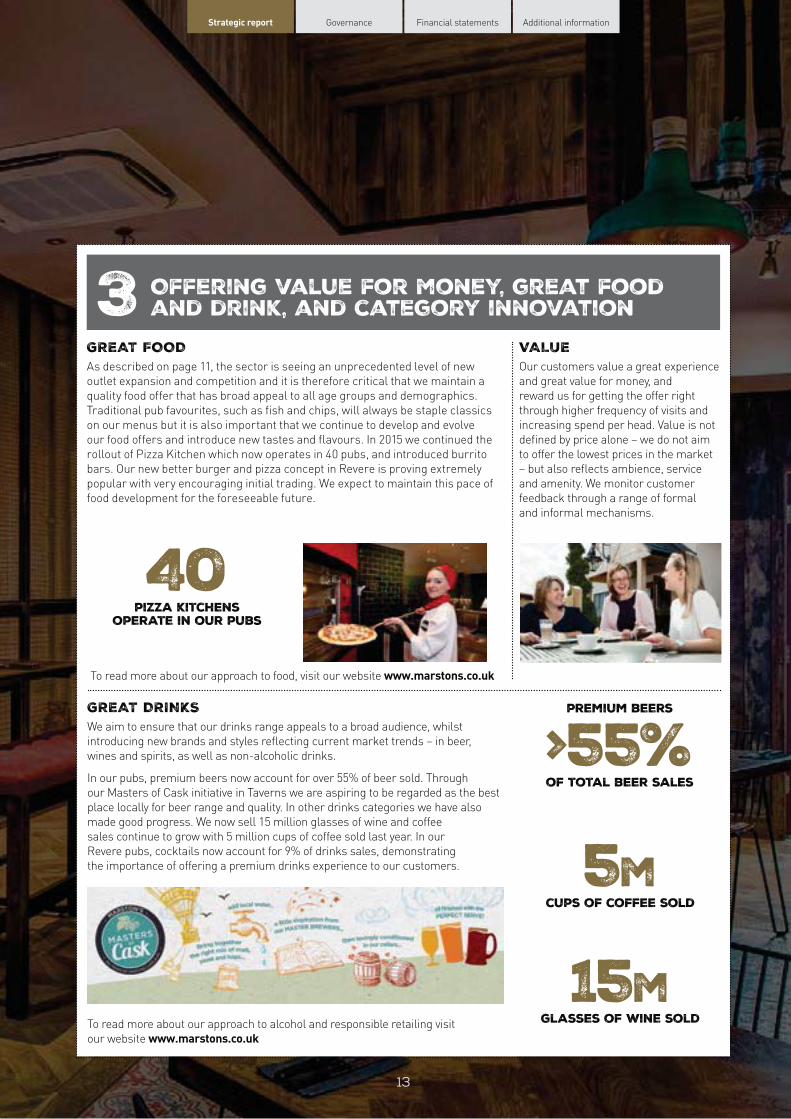
GREAT FOOD As described on page 11, the sector is seeing an unprecedented level of new
outlet expansion and competition and it is therefore critical that we maintain a
quality food offer that has broad appeal to all age groups and demographics.
Traditional pub favourites, such as fish and chips, will always be staple classics
on our menus but it is also important that we continue to develop and evolve
our food offers and introduce new tastes and flavours. In 2015 we continued the
rollout of Pizza Kitchen which now operates in 40 pubs, and introduced burrito
bars. Our new better burger and pizza concept in Revere is proving extremely
popular with ver y encouraging initial trading. We expect to maintain this pace of
food development for the foreseeable future.
40pizza kitchens
operate in our pubs
To read more about our approach to food, visit our website www.marstons.co.uk
VALUE Our customers value a great experience
and great value for money, and
reward us for getting the offer right
through higher frequency of visits and
increasing spend per head. Value is not
defined by price alone – we do not aim
to offer the lowest prices in the market
– but also reflects ambience, service
and amenity. We monitor customer
feedback through a range of formal
and informal mechanisms.
GREAT DRINKS We aim to ensure that our drinks range appeals to a broad audience, whilst
introducing new brands and styles reflecting current market trends – in beer,
wines and spirits, as well as non-alcoholic drinks.
In our pubs, premium beers now account for over 55% of beer sold. Through
our Masters of Cask initiative in Taverns we are aspiring to be regarded as the best
place locally for beer range and quality. In other drinks categories we have also
made good progress. We now sell 15 million glasses of wine and coffee
sales continue to grow with 5 million cups of coffee sold last year. In our
Revere pubs, cocktails now account for 9% of drinks sales, demonstrating
the importance of offering a premium drinks experience to our customers.
To read more about our approach to alcohol and responsible retailing visit
our website www.marstons.co.uk
premium beers
>55% of total beer sales
5mcups of coffee sold
15mglasses of wine sold
13
Marston’s PLC Annual Report and Accounts 2015
OUR Strategic Pillars in action continued
4 Leadership inthe uk beer market
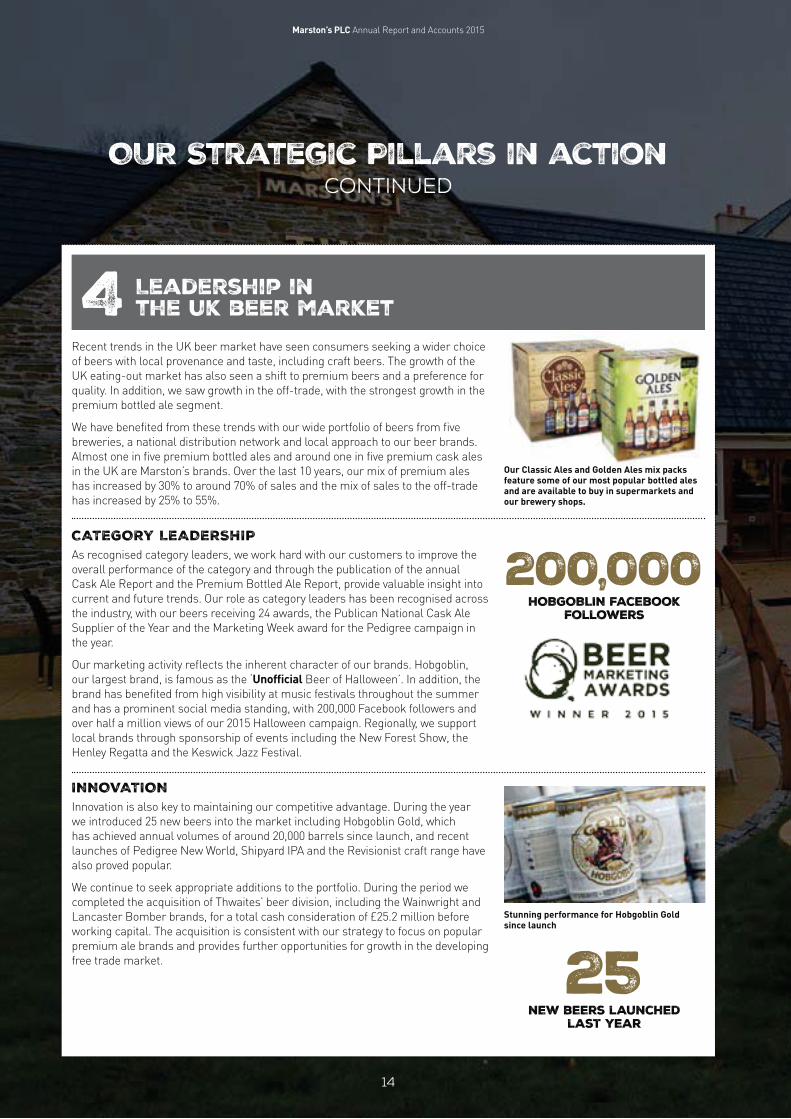
Our Classic Ales and Golden Ales mix packs feature some of our most popular bottled ales and are available to buy in supermarkets and our brewery shops.
Stunning performance for Hobgoblin Gold since launch
premium ale brands and provides further opportunities for growth in the developing
free trade market. 25
Recent trends in the UK beer market have seen consumers seeking a wider choice
of beers with local provenance and taste, including craft beers. The growth of the
UK eating-out market has also seen a shift to premium beers and a preference for
quality. In addition, we saw growth in the off-trade, with the strongest growth in the
premium bottled ale segment.
We have benefited from these trends with our wide portfolio of beers from five
breweries, a national distribution network and local approach to our beer brands.
Almost one in five premium bottled ales and around one in five premium cask ales
in the UK are Marston’s brands. Over the last 10 years, our mix of premium ales
has increased by 30% to around 70% of sales and the mix of sales to the off-trade
has increased by 25% to 55%.
CATEGORY LEADERSHIP As recognised category leaders, we work hard with our customers to improve the
overall performance of the category and through the publication of the annual
Cask Ale Report and the Premium Bottled Ale Report, provide valuable insight into
current and future trends. Our role as category leaders has been recognised across
the industry, with our beers receiving 24 awards, the Publican National Cask Ale
Supplier of the Year and the Marketing Week award for the Pedigree campaign in
the year.
Our marketing activity reflects the inherent character of our brands. Hobgoblin,
our largest brand, is famous as the ‘Unofficial Beer of Halloween’. In addition, the
brand has benefited from high visibility at music festivals throughout the summer
and has a prominent social media standing, with 200,000 Facebook followers and
over half a million views of our 2015 Halloween campaign. Regionally, we support
local brands through sponsorship of events including the New Forest Show, the
Henley Regatta and the Keswick Jazz Festival.
INNOVATION Innovation is also key to maintaining our competitive advantage. During the year
we introduced 25 new beers into the market including Hobgoblin Gold, which
has achieved annual volumes of around 20,000 barrels since launch, and recent
launches of Pedigree New World, Shipyard IPA and the Revisionist craft range have
also proved popular.
We continue to seek appropriate additions to the portfolio. During the period we
completed the acquisition of Thwaites’ beer division, including the Wainwright and
Lancaster Bomber brands, for a total cash consideration of £25.2 million before
working capital. The acquisition is consistent with our strategy to focus on popular
200,000 HOBGOBLIN facebook
followers
new beers launched last year
14
Strategic report Governance Financial statements Additional information
5 Our People– Marston’s – ‘The Place to Be’
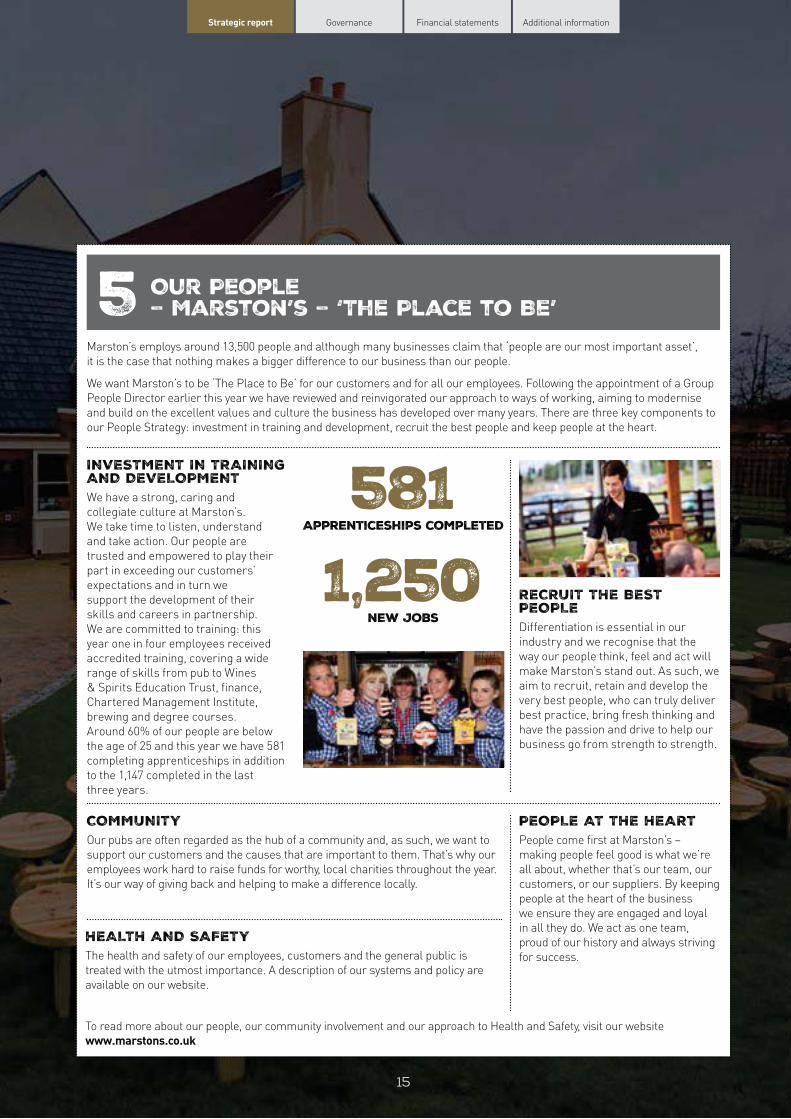
Marston’s employs around 13,500 people and although many businesses claim that ‘people are our most important asset’,
it is the case that nothing makes a bigger difference to our business than our people.
We want Marston’s to be ‘The Place to Be’ for our customers and for all our employees. Following the appointment of a Group
People Director earlier this year we have reviewed and reinvigorated our approach to ways of working, aiming to modernise
and build on the excellent values and culture the business has developed over many years. There are three key components to
our People Strategy: investment in training and development, recruit the best people and keep people at the heart.
INVESTMENT IN TRAINING AND DEVELOPMENT We have a strong, caring and
collegiate culture at Marston’s.
We take time to listen, understand
and take action. Our people are
trusted and empowered to play their
part in exceeding our customers’
expectations and in turn we
support the development of their
skills and careers in partnership.
We are committed to training: this
year one in four employees received
accredited training, covering a wide
range of skills from pub to Wines
& Spirits Education Trust, finance,
Char tered Management Institute,
brewing and degree courses.
Around 60% of our people are below
the age of 25 and this year we have 581
completing apprenticeships in addition
to the 1,147 completed in the last
three years.
581 Apprenticeships completed
1,250new jobs
RECRUIT THE BEST PEOPLE Differentiation is essential in our
industr y and we recognise that the
way our people think, feel and act will
make Marston’s stand out. As such, we
aim to recruit, retain and develop the
very best people, who can truly deliver
best practice, bring fresh thinking and
have the passion and drive to help our
business go from strength to strength.
COMMUNITY Our pubs are often regarded as the hub of a community and, as such, we want to
support our customers and the causes that are important to them. That’s why our
employees work hard to raise funds for worthy, local charities throughout the year.
It’s our way of giving back and helping to make a difference locally.
HEALTH AND SAFETY The health and safety of our employees, customers and the general public is
treated with the utmost importance. A description of our systems and policy are
available on our website.
PEOPLE AT THE HEART People come first at Marston’s –
making people feel good is what we’re
all about, whether that’s our team, our
customers, or our suppliers. By keeping
people at the heart of the business
we ensure they are engaged and loyal
in all they do. We act as one team,
proud of our history and always striving
for success.
To read more about our people, our community involvement and our approach to Health and Safety, visit our website
www.marstons.co.uk
15
Marston’s PLC Annual Report and Accounts 2015
measuring our progress
Our Key Performance Indicators
We have a range of financial and non-financial KPIs to help us stay
focused on our strategy and align remuneration to performance
FINANCIAL KPIS
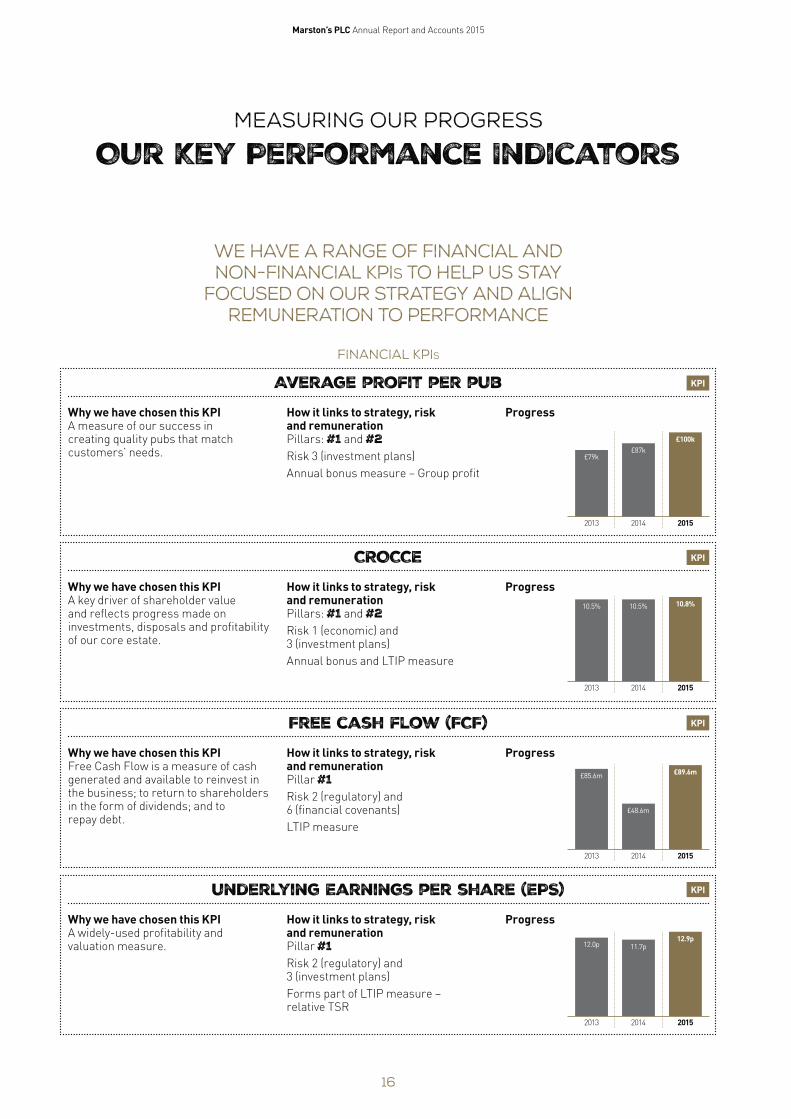
Average profit per pub KPI
Why we have chosen this KPI How it links to strategy, risk Progress A measure of our success in and remuneration creating quality pubs that match Pillars: #1 and #2 customers’ needs. Risk 3 (investment plans)
Annual bonus measure – Group profit
£79k
£100k £87k
2013 2014
CROCCE KPI
Why we have chosen this KPI How it links to strategy, risk Progress A key driver of shareholder value and remuneration and reflects progress made on Pillars: #1 and #2 investments, disposals and profitability Risk 1 (economic) and of our core estate. 3 (investment plans)
Annual bonus and LTIP measure
10.5% 10.8%10.5%
2013 2014
Free cash flow (FCF) KPI
Why we have chosen this KPI How it links to strategy, risk Progress Free Cash Flow is a measure of cash and remuneration generated and available to reinvest in Pillar #1 the business; to return to shareholders Risk 2 (regulatory) and in the form of dividends; and to 6 (financial covenants) repay debt.
LTIP measure
£89.6m
£48.6m
£85.6m
2013 2014 2015
underlying Earnings per share (EPS) KPI
Why we have chosen this KPI A widely-used profitability and valuation measure.
How it links to strategy, risk and remuneration Pillar #1
Progress
Risk 2 (regulatory) and 3 (investment plans)
Forms part of LTIP measure – relative TSR
12.0p 11.7p 12.9p
2013 2014 2015
16
2015
2015
Strategic report Governance Financial statements Additional information
NON-FINANCIAL KPIS
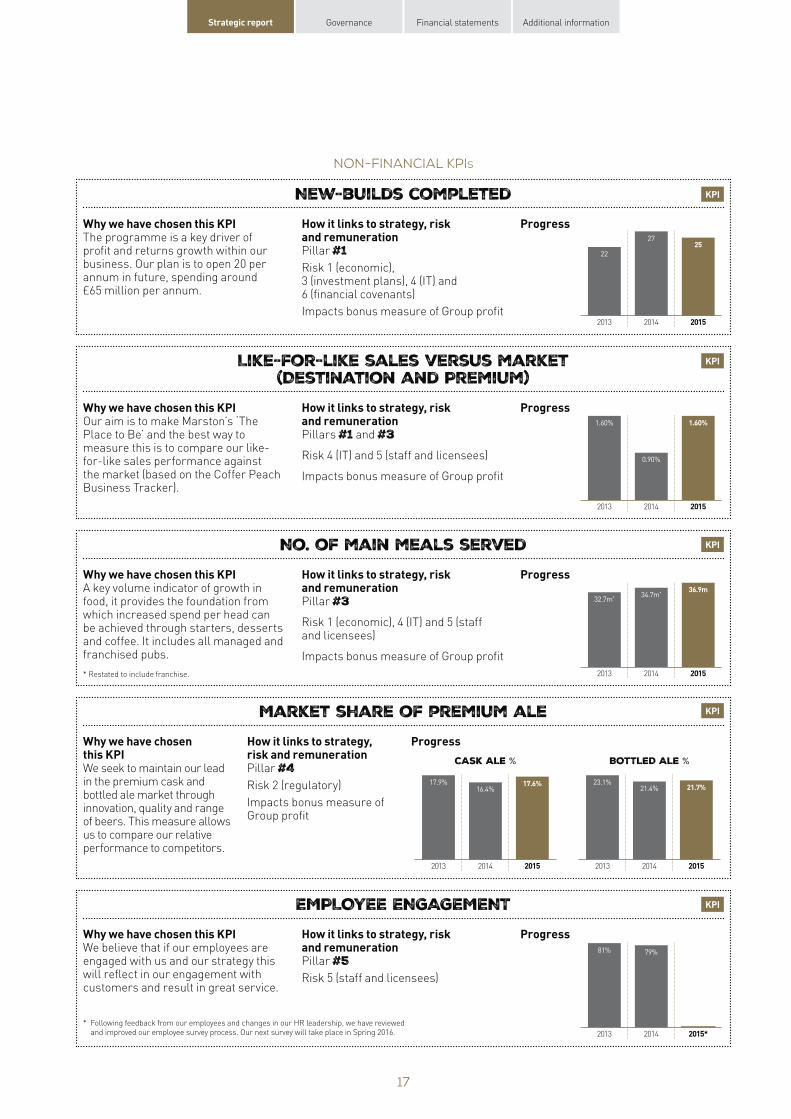
New-builds completed KPI
Why we have chosen this KPI The programme is a key driver of profit and returns growth within our business. Our plan is to open 20 per annum in future, spending around £65 million per annum.
How it links to strategy, risk Progress and remuneration Pillar #1Risk 1 (economic), 3 (investment plans), 4 (IT) and 6 (financial covenants)
Impacts bonus measure of Group profit
22
25 27
2013 2014 2015
Like-for-like sales versus market (Destination and Premium)
KPI
Why we have chosen this KPI How it links to strategy, risk Progress Our aim is to make Marston’s ‘The and remuneration Place to Be’ and the best way to Pillars #1 and #3 measure this is to compare our like-
Risk 4 (IT) and 5 (staff and licensees) for-like sales performance against the market (based on the Coffer Peach Impacts bonus measure of Group profit Business Tracker).
1.60%
0.90%
1.60%
2013 2014
No. of main meals served KPI
Why we have chosen this KPI A key volume indicator of growth in food, it provides the foundation from which increased spend per head can be achieved through starters, desserts and coffee. It includes all managed and franchised pubs.
* Restated to include franchise.
How it links to strategy, risk Progress and remuneration Pillar #3
Risk 1 (economic), 4 (IT) and 5 (staff and licensees)
Impacts bonus measure of Group profit
32.7m*
36.9m34.7m*
2013 2014
Market share of premium ale KPI
Why we have chosen How it links to strategy, Progress this KPI risk and remuneration CASK ALE % BOTTLED ALE %We seek to maintain our lead Pillar #4 in the premium cask and Risk 2 (regulator y) bottled ale market through
Impacts bonus measure of innovation, quality and range
Group profit of beers. This measure allows us to compare our relative performance to competitors.
17.9% 21.7%21.4%
23.1%17.6%16.4%
2013 2014 2015 2013 2014 2015
EMPLOYEE ENGAGEMENT KPI
Why we have chosen this KPI How it links to strategy, risk Progress We believe that if our employees are and remuneration engaged with us and our strategy this Pillar #5 will reflect in our engagement with Risk 5 (staff and licensees) customers and result in great service.
* Following feedback from our employees and changes in our HR leadership, we have reviewed and improved our employee survey process. Our next survey will take place in Spring 2016.
81% 79%
2013 2014 2015*
17
2015
2015
Marston’s PLC Annual Report and Accounts 2015
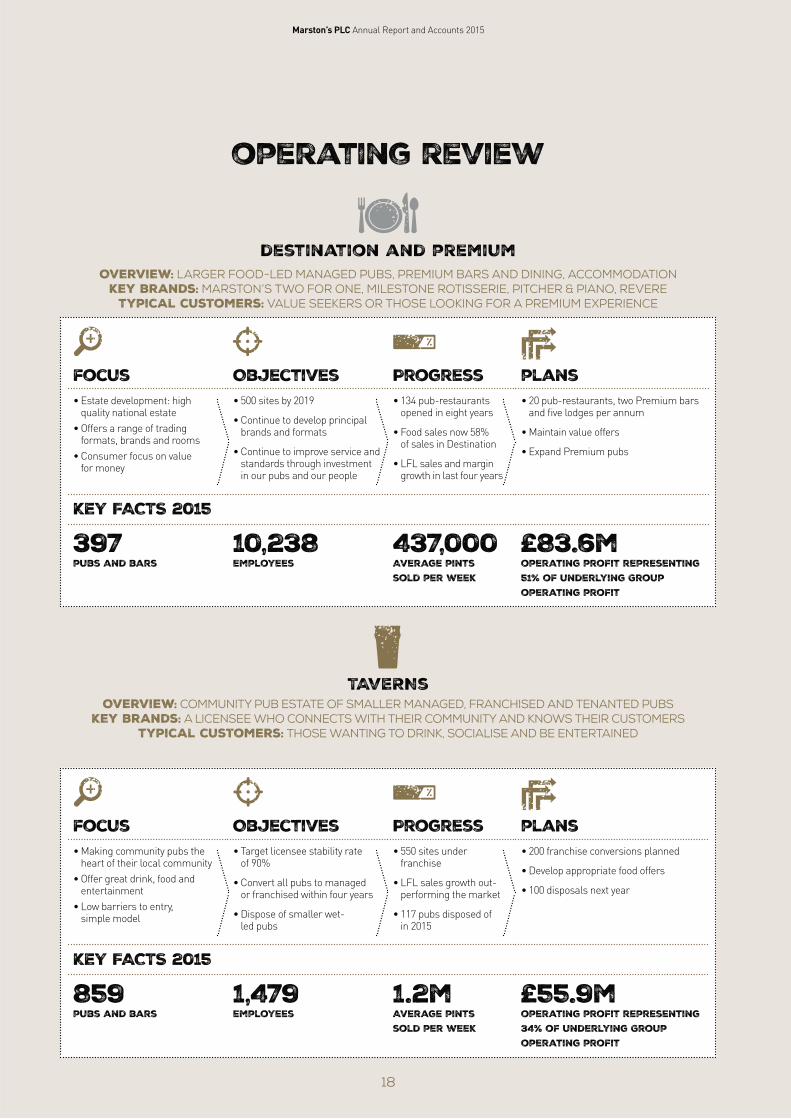
operating review
destination and premium Overview: larger food-led managed pubs, premium bars and dining, accommodation Key brands: Marston’s Two for One, Milestone Rotisserie, Pitcher & Piano, Revere Typical customers: Value seekers or those looking for a Premium experience
focus Objectives Progress plans • Estate development: high
quality national estate
• Offers a range of trading formats, brands and rooms
• Consumer focus on value for money
• 500 sites by 2019
• Continue to develop principal brands and formats
• Continue to improve service and standards through investment in our pubs and our people
• 134 pub-restaurants opened in eight years
• Food sales now 58% of sales in Destination
• LFL sales and margin growth in last four years
• 20 pub-restaurants, two Premium bars and five lodges per annum
• Maintain value offers
• Expand Premium pubs
KEY FACTS 2015
397 10,238 437,000 £83.6m pubs and bars employees Average pints operating profit representing
sold per week 51% of underlying Group operating profit
TAVERNs Overview: community pub estate of smaller managed, franchised and tenanted pubs
Key brands: a licensee who connects with their community and knows their customers Typical customers: those wanting to drink, socialise and be entertained
focus Objectives Progress plans • Making community pubs the • Target licensee stability rate • 550 sites under • 200 franchise conversions planned
heart of their local community of 90% franchise • Develop appropriate food offers
• Offer great drink, food and • Convert all pubs to managed • LFL sales growth out• 100 disposals next year entertainment or franchised within four years performing the market
• Low barriers to entry, • Dispose of smaller wet • 117 pubs disposed ofsimple model
led pubs in 2015
KEY FACTS 2015
859 1,479 1.2m £55.9m pubs and bars employees Average pints operating profit representing
sold per week 34% of underlying Group operating profit
18
Strategic report Governance Financial statements Additional information
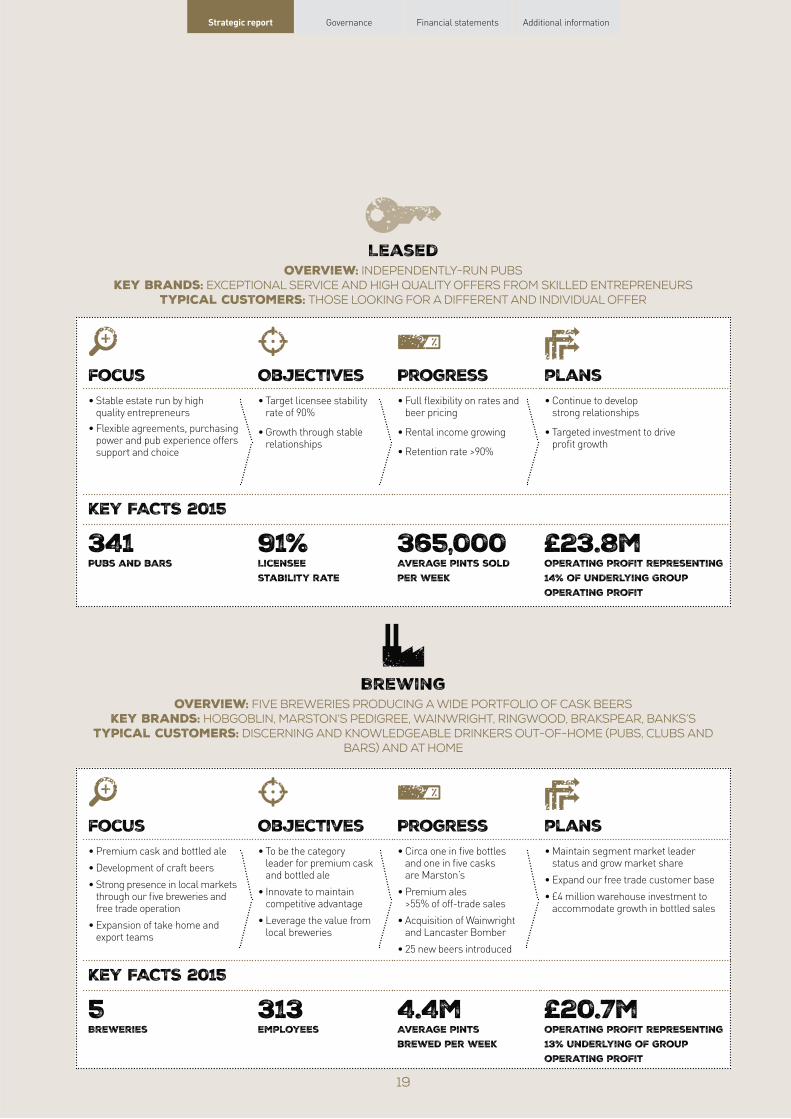
Leased Overview: Independently-run pubs
Key brands: exceptional service and high quality offers from skilled entrepreneursTypical customers: those looking for a different and individual offer
focus Objectives Progress plans • Stable estate run by high • Target licensee stability • Full flexibility on rates and • Continue to develop
quality entrepreneurs rate of 90% beer pricing strong relationships
• Flexible agreements, purchasing • Growth through stable • Rental income growing • Targeted investment to drive power and pub experience offers relationships profit growth
• Retention rate >90% support and choice
KEY FACTS 2015
341 91% 365,000 £23.8m Pubs and bars Licensee Average pints sold Operating profit representing
stability rate per week 14% of underlying Group operating profit
Brewing Overview: five breweries producing a wide portfolio of cask beers
Key brands: Hobgoblin, Marston’s Pedigree, Wainwright, Ringwood, Brakspear, Banks’s Typical customers: discerning and knowledgeable drinkers out-of-home (pubs, clubs and
bars) and at home
focus Objectives Progress plans • Premium cask and bottled ale
• Development of craft beers
• Strong presence in local markets through our five breweries and free trade operation
• Expansion of take home and export teams
• To be the category leader for premium cask and bottled ale
• Innovate to maintain competitive advantage
• Leverage the value from local breweries
• Circa one in five bottles and one in five casks are Marston’s
• Premium ales >55% of off-trade sales
• Acquisition of Wainwright and Lancaster Bomber
• 25 new beers introduced
• Maintain segment market leader status and grow market share
• Expand our free trade customer base
• £4 million warehouse investment to accommodate growth in bottled sales
KEY FACTS 2015
5 313 4.4m £20.7m Breweries employees Average pints operating profit representing
brewed per week 13% underlying of Group operating profit
19
Marston’s PLC Annual Report and Accounts 2015
Risks and Risk Management
Our processes and systems help to ensure that risk management is
continually embedded and understood in the operations of the business.
Jonathan Moore Corporate Risk Director
INTERNAL CONTROL The Board is responsible for the Group’s systems of internal
control and risk management and reviewing their effectiveness.
There is an ongoing monitoring and review process of the risks
facilitated by the Corporate Risk Director. Management are
responsible for monitoring and reporting on the effectiveness of
the controls. Reporting is sufficient for the Board to understand
its risk appetite and the strength of the control environment in
mitigating risk to an acceptable level.
The Executive Directors are responsible for the implementation
of the risk management and internal control system.
The system is designed to manage rather than eliminate risk.
By their nature, such a system provides only a reasonable and
not absolute defence against material errors, losses, fraud or
breaches of the law.
The key features of the risk management and internal control
system are:
• A clearly defined management structure operating
within a framework of policies and procedures covering
authority levels, responsibilities and accountabilities
(detailed opposite).
• A detailed formal budgeting process for all Group activities,
with the annual Group budget and projections for future years
being formally approved by the Board.
• Established procedures for planning, approving and
monitoring capital expenditure and major projects.
• Board approval is needed for all major investment,
divestment and strategic plans and programmes.
• At each meeting the Board reviews financial and non-
financial progress towards the Group’s goals.
The internal audit strategy and compliance testing takes into
account the key business risks and provides assurance to the
Audit Committee on the effectiveness of the management
systems mitigating them to an acceptable level.
PRIORITISING OUR RISKS The principal risks from the Corporate Risk Register are plotted
on the risk heat map opposite and are explained in more detail
on pages 22 to 23.
MANAGING RISK WITHIN THE BUSINESS Day-to-day responsibility for operational risks, at the level of
the pub or brewery, rests with the pub managers and Head
Brewers. The controls operated at each site are part of wider
management systems designed to reduce internal risks,
including food hygiene, health and safety, business continuity
and security.
SUPPORTING COMMITTEES The Corporate Risk Director chairs three committees which
form an essential role in risk management. The committees
are attended by a range of representatives from the business
to ensure that the focus of attention remains relevant
to operations.
Compliance Committee A register of legislation appertaining to Marston’s activities
is maintained and confirmation is given to management that
operations are compliant. Any breaches, or risk of breach are
reported to the Board by the Committee. The Committee also
considers any emerging areas of legislation or any changes in
operations which may impact upon compliance.
Business Continuity Committee Marston’s operates a business continuity management
system to ensure that all contingency plans are regularly
reviewed, remain appropriate and are sufficiently understood.
The Committee reviews the management system, the status of
the contingency plans and the resolution of any incidents that
from time to time may occur.
Corporate Social Responsibility Committee The Committee oversees the CSR targets of the Group and
reports to the Board annually on the activities adopted to
achieve these targets. The Committee is also responsible for
the external reporting of these activities within our Corporate
Responsibility Report and under the Responsibility Deal.
20
-
Strategic report Governance Financial statements Additional information
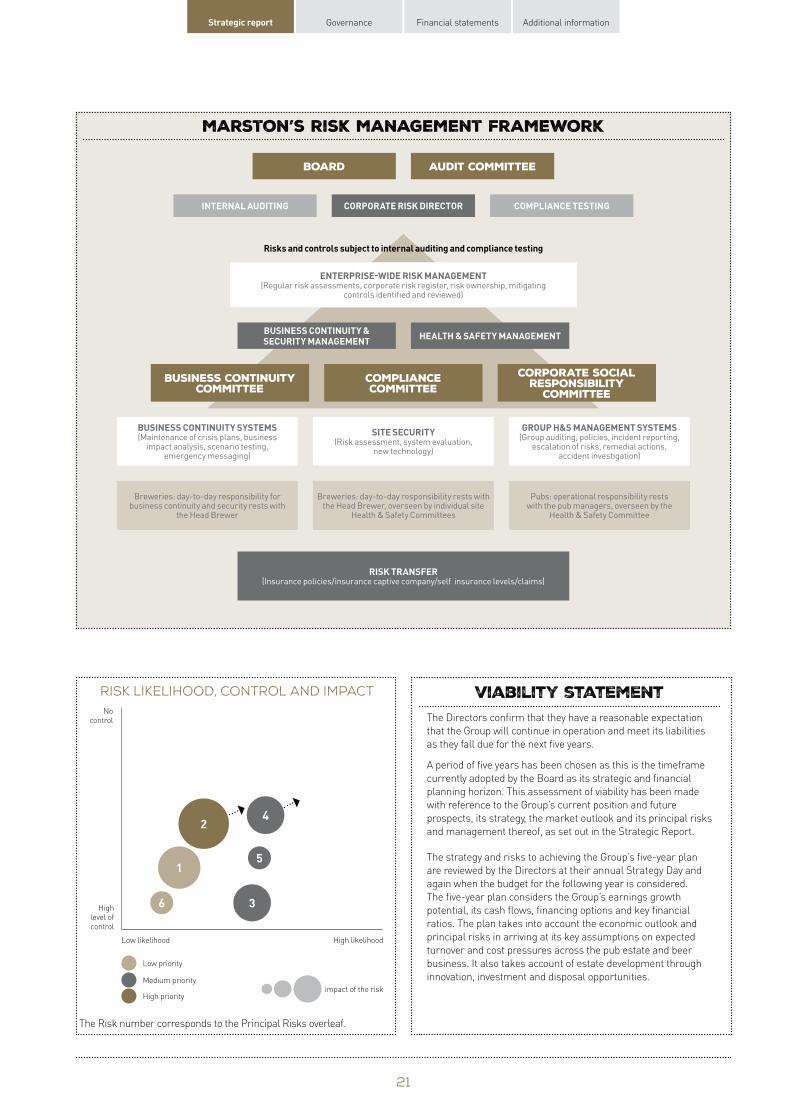
marston’s risk management framework
RISK TRANSFER (Insurance policies/insurance captive company/self insurance levels/claims)
Breweries: day-to-day responsibility for business continuity and security rests with
the Head Brewer
Breweries: day-to-day responsibility rests with the Head Brewer, overseen by individual site
Health & Safety Committees
Pubs: operational responsibility rests with the pub managers, overseen by the
Health & Safety Committee
board audit committee
business continuitycommittee
compliancecommittee
corporate socialresponsibility
committee
COMPLIANCE TESTING INTERNAL AUDITING CORPOR ATE RISK DIRECTOR
HEALTH & SAFETY MANAGEMENT BUSINESS CONTINUIT Y & SECURITY MANAGEMENT
ENTERPRISE-WIDE RISK MANAGEMENT (Regular risk assessments, corporate risk register, risk ownership, mitigating
controls identified and reviewed)
Risks and controls subject to internal auditing and compliance testing
BUSINESS CONTINUITY SYSTEMS (Maintenance of crisis plans, business
impact analysis, scenario testing, emergency messaging)
SITE SECURIT Y (Risk assessment, system evaluation,
new technology)
GROUP H&S MANAGEMENT SYSTEMS (Group auditing, policies, incident repor ting,
escalation of risks, remedial actions, accident investigation)
risk likelihood, control and impact No
control
High level of control
Low likelihood High likelihood
2
1
4
6
5
3
Low priority
Medium priority impact of the risk
High priority
viability statement The Directors confirm that they have a reasonable expectation
that the Group will continue in operation and meet its liabilities
as they fall due for the next five years.
A period of five years has been chosen as this is the timeframe
currently adopted by the Board as its strategic and financial
planning horizon. This assessment of viability has been made
with reference to the Group’s current position and future
prospects, its strategy, the market outlook and its principal risks
and management thereof, as set out in the Strategic Report.
The strategy and risks to achieving the Group’s five-year plan
are reviewed by the Directors at their annual Strategy Day and
again when the budget for the following year is considered.
The five-year plan considers the Group’s earnings growth
potential, its cash flows, financing options and key financial
ratios. The plan takes into account the economic outlook and
principal risks in arriving at its key assumptions on expected
turnover and cost pressures across the pub estate and beer
business. It also takes account of estate development through
innovation, investment and disposal opportunities.
The Risk number corresponds to the Principal Risks overleaf.
21
1
Marston’s PLC Annual Report and Accounts 2015
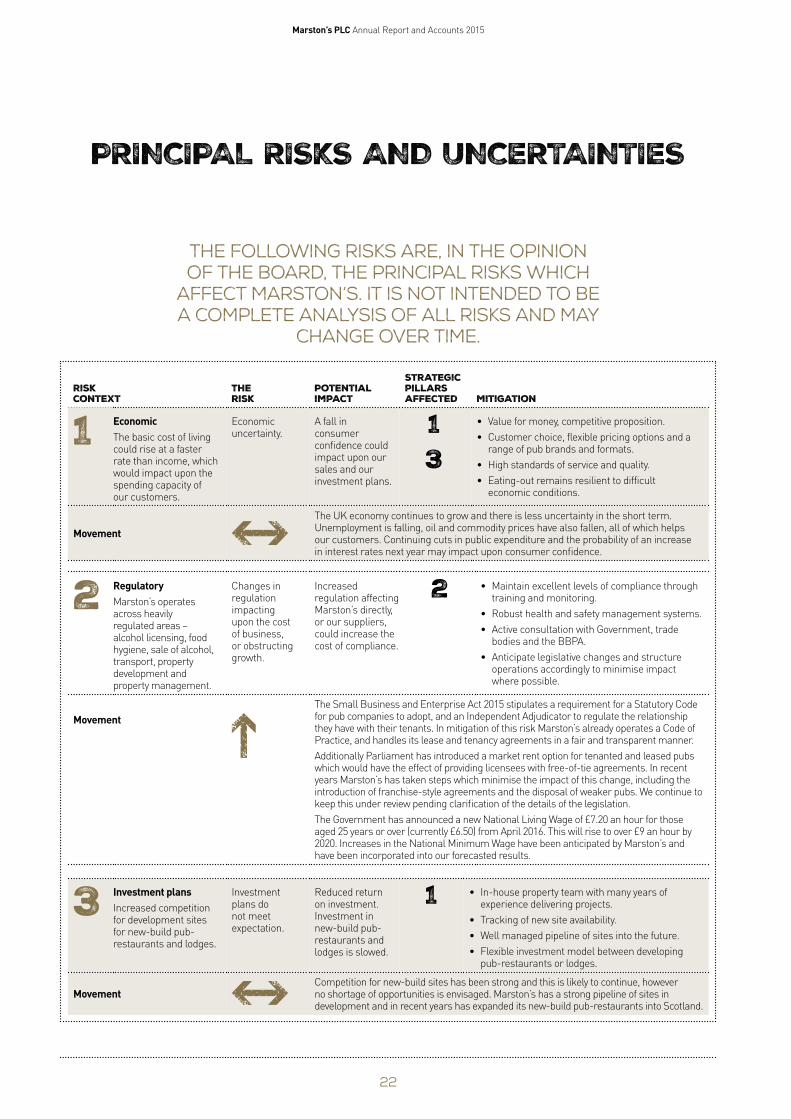
PRINCIPAL RISKS AND UNCERTAINTIES
The following risks are, in the opinion of the Board, the principal risks which
affect Marston’s. It is not intended to be a complete analysis of all risks and may
change over time.
Strategic Risk The Potential pillars context risk impact affected Mitigation
Economic The basic cost of living could rise at a faster rate than income, which would impact upon the spending capacity of our customers.
Movement
2 Regulatory Marston’s operates across heavily regulated areas – alcohol licensing, food hygiene, sale of alcohol, transport, property development and property management.
Movement
Economic uncertainty.
Changes in regulation impacting upon the cost of business, or obstructing growth.
Investment plans do not meet expectation.
A fall in • Value for money, competitive proposition. 1consumer • Customer choice, flexible pricing options and a confidence could range of pub brands and formats. impact upon our 3 • High standards of service and quality. sales and our investment plans. • Eating-out remains resilient to difficult
economic conditions.
The UK economy continues to grow and there is less uncertainty in the short term. Unemployment is falling, oil and commodity prices have also fallen, all of which helps our customers. Continuing cuts in public expenditure and the probability of an increase in interest rates next year may impact upon consumer confidence.
Increased • Maintain excellent levels of compliance through regulation affecting 2 training and monitoring. Marston’s directly, • Robust health and safety management systems. or our suppliers,
• Active consultation with Government, trade could increase the bodies and the BBPA. cost of compliance.
• Anticipate legislative changes and structure operations accordingly to minimise impact where possible.
The Small Business and Enterprise Act 2015 stipulates a requirement for a Statutory Code for pub companies to adopt, and an Independent Adjudicator to regulate the relationship they have with their tenants. In mitigation of this risk Marston’s already operates a Code of Practice, and handles its lease and tenancy agreements in a fair and transparent manner.
Additionally Parliament has introduced a market rent option for tenanted and leased pubs which would have the effect of providing licensees with free-of-tie agreements. In recent years Marston’s has taken steps which minimise the impact of this change, including the introduction of franchise-style agreements and the disposal of weaker pubs. We continue to keep this under review pending clarification of the details of the legislation.
The Government has announced a new National Living Wage of £7.20 an hour for those aged 25 years or over (currently £6.50) from April 2016. This will rise to over £9 an hour by 2020. Increases in the National Minimum Wage have been anticipated by Marston’s and have been incorporated into our forecasted results.
3 Investment plans Increased competition for development sites for new-build pub-restaurants and lodges.
Reduced return • In-house property team with many years of on investment. 1 experience delivering projects. Investment in • Tracking of new site availability. new-build pub
• Well managed pipeline of sites into the future. restaurants and lodges is slowed. • Flexible investment model between developing
pub-restaurants or lodges.
Competition for new-build sites has been strong and this is likely to continue, however no shortage of opportunities is envisaged. Marston’s has a strong pipeline of sites in development and in recent years has expanded its new-build pub-restaurants into Scotland.
Movement
22
Strategic report Governance Financial statements Additional information
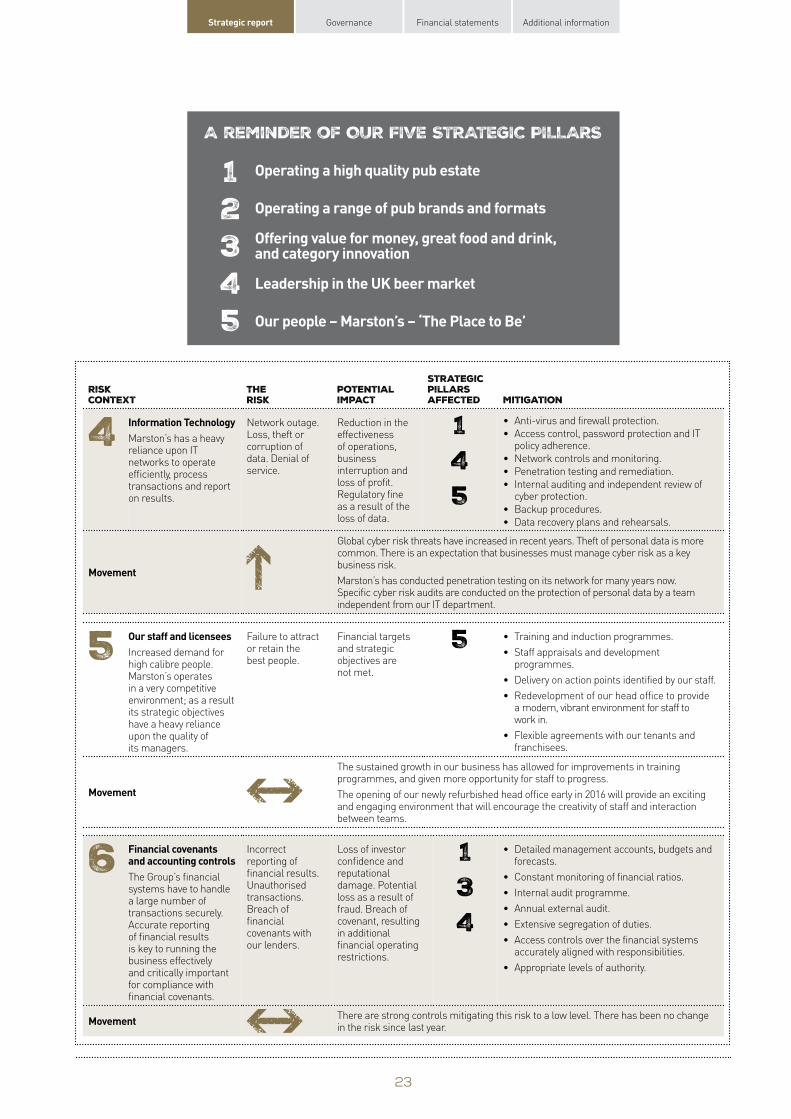
A reminder of OUR FIVE STRATEGIC PILLARS
1 2 3 4 5
Operating a high quality pub estate
Operating a range of pub brands and formats
Offering value for money, great food and drink,and category innovation
Leadership in the UK beer market
Our people – Marston’s – ‘The Place to Be’
4 Information Technology Marston’s has a heavy reliance upon IT networks to operate efficiently, process transactions and report on results.
Strategic Potential pillars impact affected Mitigation
• Anti-virus and firewall protection.
effectiveness Reduction in the 1 • Access control, password protection and IT
of operations, policy adherence.
business • Network controls and monitoring. interruption and 4
• Penetration testing and remediation. loss of profit. • Internal auditing and independent review of Regulatory fine 5 cyber protection. as a result of the • Backup procedures. loss of data. • Data recovery plans and rehearsals.
Global cyber risk threats have increased in recent years. Theft of personal data is more common. There is an expectation that businesses must manage cyber risk as a key business risk.
Marston’s has conducted penetration testing on its network for many years now. Specific cyber risk audits are conducted on the protection of personal data by a team independent from our IT department.
Financial targets • Training and induction programmes. and strategic 5
• Staff appraisals and development objectives are programmes. not met.
• Delivery on action points identified by our staff.
• Redevelopment of our head office to provide a modern, vibrant environment for staff to work in.
• Flexible agreements with our tenants and franchisees.
The sustained growth in our business has allowed for improvements in training programmes, and given more opportunity for staff to progress.
The opening of our newly refurbished head office early in 2016 will provide an exciting and engaging environment that will encourage the creativity of staff and interaction between teams.
Loss of investor • Detailed management accounts, budgets and 1confidence and forecasts. reputational • Constant monitoring of financial ratios. damage. Potential 3 • Internal audit programme. loss as a result of fraud. Breach of • Annual external audit. covenant, resulting 4 • Extensive segregation of duties. in additional
• Access controls over the financial systems financial operating
accurately aligned with responsibilities. restrictions.
• Appropriate levels of authority.
There are strong controls mitigating this risk to a low level. There has been no change in the risk since last year.
6 Financial covenants and accounting controls The Group’s financial systems have to handle a large number of transactions securely. Accurate reporting of financial results is key to running the business effectively and critically important for compliance with financial covenants.
Risk context
Movement
5 Our staff and licensees Increased demand for high calibre people. Marston’s operates in a very competitive environment; as a result its strategic objectives have a heavy reliance upon the quality of its managers.
Movement
Movement
The risk
Network outage. Loss, theft or corruption of data. Denial of service.
Failure to attract or retain the best people.
Incorrect reporting of financial results. Unauthorised transactions. Breach of financial covenants with our lenders.
23
Marston’s PLC Annual Report and Accounts 2015
PERFORMANCE AND FINANCIAL REVIEW
strong trading performance with underlying profit before tax
up 10.2% to £91.5 million
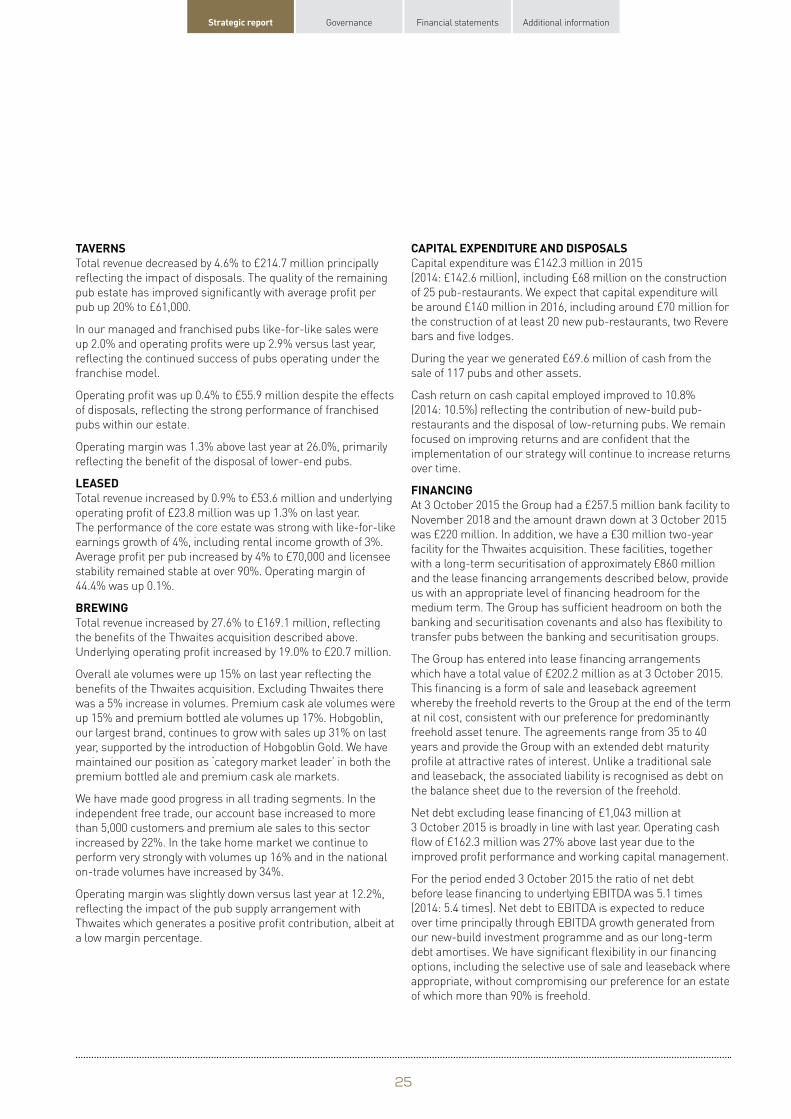
Underlying revenue Underlying operating profit Margin 2015 2014 2015 2014 2015 2014
£m £m £m £m % %
Destination and Premium 408.1 376.9 83.6 76.0 20.5 20.2
Taverns 214.7 225.1 55.9 55.7 26.0 24.7
Leased 53.6 53.1 23.8 23.5 44.4 44.3
Brewing 169.1 132.5 20.7 17.4 12.2 13.1
Group Services – – (18.6) (16.5) (2.2) (2.1)
Group 845.5 787.6 165.4 156.1 19.6 19.8
GROUP Total underlying revenue increased by 7.4% from 2014
reflecting like-for-like growth in our pubs, the impact of new
openings, growth in our beer brands and the acquisition of
Thwaites’ beer business. As previously forecast, our operating
margin was 0.2% below last year reflecting lower margins in
Brewing, as a result of the contract to supply Thwaites’ pubs.
Underlying operating margin increased in each of our pub
segments, demonstrating our ability to grow our business by
delivering a consistent and excellent customer experience
rather than relying on the high level of discounting which has
been prevalent in the market.
Underlying operating profit of £165.4 million
(2014: £156.1 million) was up 6.0% despite the impact
of disposals and a £2 million increase in pension costs.
Profit growth was achieved in each of our trading segments.
Underlying profit before tax was up 10.2% to £91.5 million
(2014: £83.0 million) principally reflecting the contribution from
new pub-restaurants and a strong performance from Brewing.
Basic underlying earnings per share for the period increased by
10.3% to 12.9 pence per share (2014: 11.7 pence per share).
On a statutory basis profit before tax was £31.3 million
(2014: loss of £59.2 million) and earnings per share were
4.1 pence per share (2014: 8.9 pence loss per share).
DESTINATION AND PREMIUM Total revenue increased by 8.3% to £408.1 million
reflecting the continued strong performance of our new-
build pub-restaurants and growth in like-for-like sales.
Underlying operating profit of £83.6 million was up 10.0%
(2014: £76.0 million). Average profit per pub increased to
£219,000, up 3%.
Total like-for-like sales were 1.8% above last year, with like-for
like food sales up by 1.7%, assisted by strong growth in sales
of starters, desserts and coffee. In addition, like-for-like room
income was up 5.6%. In Destination pubs, food now accounts
for 58% of total sales (2014: 57%) and in Premium pubs and
bars food is 28% of sales (2014: 27%).
Like-for-like wet sales increased by 1.7%, outperforming the
declining UK on-trade drinks market. We continue to see
growth in more premium products, with own-brewed premium
ale volumes up 5% and premium lager up 7%.
We achieved a 0.3% improvement in operating margin through a
disciplined approach to discounting and tight cost management.
24
Strategic report Governance Financial statements Additional information
TAVERNS Total revenue decreased by 4.6% to £214.7 million principally
reflecting the impact of disposals. The quality of the remaining
pub estate has improved significantly with average profit per
pub up 20% to £61,000.
In our managed and franchised pubs like-for-like sales were
up 2.0% and operating profits were up 2.9% versus last year,
reflecting the continued success of pubs operating under the
franchise model.
Operating profit was up 0.4% to £55.9 million despite the effects
of disposals, reflecting the strong performance of franchised
pubs within our estate.
Operating margin was 1.3% above last year at 26.0%, primarily
reflecting the benefit of the disposal of lower-end pubs.
LEASED Total revenue increased by 0.9% to £53.6 million and underlying
operating profit of £23.8 million was up 1.3% on last year.
The performance of the core estate was strong with like-for-like
earnings growth of 4%, including rental income growth of 3%.
Average profit per pub increased by 4% to £70,000 and licensee
stability remained stable at over 90%. Operating margin of
44.4% was up 0.1%.
BREWING Total revenue increased by 27.6% to £169.1 million, reflecting
the benefits of the Thwaites acquisition described above.
Underlying operating profit increased by 19.0% to £20.7 million.
Overall ale volumes were up 15% on last year reflecting the
benefits of the Thwaites acquisition. Excluding Thwaites there
was a 5% increase in volumes. Premium cask ale volumes were
up 15% and premium bottled ale volumes up 17%. Hobgoblin,
our largest brand, continues to grow with sales up 31% on last
year, supported by the introduction of Hobgoblin Gold. We have
maintained our position as ‘category market leader’ in both the
premium bottled ale and premium cask ale markets.
We have made good progress in all trading segments. In the
independent free trade, our account base increased to more
than 5,000 customers and premium ale sales to this sector
increased by 22%. In the take home market we continue to
perform very strongly with volumes up 16% and in the national
on-trade volumes have increased by 34%.
Operating margin was slightly down versus last year at 12.2%,
reflecting the impact of the pub supply arrangement with
Thwaites which generates a positive profit contribution, albeit at
a low margin percentage.
CAPITAL EXPENDITURE AND DISPOSALS Capital expenditure was £142.3 million in 2015
(2014: £142.6 million), including £68 million on the construction
of 25 pub-restaurants. We expect that capital expenditure will
be around £140 million in 2016, including around £70 million for
the construction of at least 20 new pub-restaurants, two Revere
bars and five lodges.
During the year we generated £69.6 million of cash from the
sale of 117 pubs and other assets.
Cash return on cash capital employed improved to 10.8%
(2014: 10.5%) reflecting the contribution of new-build pub-
restaurants and the disposal of low-returning pubs. We remain
focused on improving returns and are confident that the
implementation of our strategy will continue to increase returns
over time.
FINANCING At 3 October 2015 the Group had a £257.5 million bank facility to
November 2018 and the amount drawn down at 3 October 2015
was £220 million. In addition, we have a £30 million two-year
facility for the Thwaites acquisition. These facilities, together
with a long-term securitisation of approximately £860 million
and the lease financing arrangements described below, provide
us with an appropriate level of financing headroom for the
medium term. The Group has sufficient headroom on both the
banking and securitisation covenants and also has flexibility to
transfer pubs between the banking and securitisation groups.
The Group has entered into lease financing arrangements
which have a total value of £202.2 million as at 3 October 2015.
This financing is a form of sale and leaseback agreement
whereby the freehold reverts to the Group at the end of the term
at nil cost, consistent with our preference for predominantly
freehold asset tenure. The agreements range from 35 to 40
years and provide the Group with an extended debt maturity
profile at attractive rates of interest. Unlike a traditional sale
and leaseback, the associated liability is recognised as debt on
the balance sheet due to the reversion of the freehold.
Net debt excluding lease financing of £1,043 million at
3 October 2015 is broadly in line with last year. Operating cash
flow of £162.3 million was 27% above last year due to the
improved profit performance and working capital management.
For the period ended 3 October 2015 the ratio of net debt
before lease financing to underlying EBITDA was 5.1 times
(2014: 5.4 times). Net debt to EBITDA is expected to reduce
over time principally through EBITDA growth generated from
our new-build investment programme and as our long-term
debt amortises. We have significant flexibility in our financing
options, including the selective use of sale and leaseback where
appropriate, without compromising our preference for an estate
of which more than 90% is freehold.
25
Marston’s PLC Annual Report and Accounts 2015
PERFORMANCE AND FINANCIAL REVIEW continued
PENSIONS Our final salary pension scheme at the year end showed
a surplus of £15.0 million before tax (2014: £7.8 million).
This position reflects the consistent manner in which the
Group has managed its deficit over the last five years, and
the closure of the final salary scheme to future accrual from
30 September 2014. We have concluded our triennial valuation
as at 30 September 2014, which has resulted in a reduction of
cash contributions to c.£8 million per annum going forward.
TAXATION The underlying rate of taxation of 19.3% in 2015 is below the
standard rate of corporation tax of 20.5% primarily due to
credits in respect of deferred tax on property.
The underlying tax rate has decreased by 0.3% from 19.6%
in 2014.
NON-UNDERLYING ITEMS There is a net non-underlying charge of £50.5 million after
tax. This primarily reflects the external estate valuation
undertaken in the period, which resulted in a £39.0 million
charge to the income statement. A net revaluation increase
of £95.9 million has also been recognised in the revaluation
reserve in respect of property revaluations undertaken in the
period. Other non-underlying items comprise a £2.5 million
charge relating to non-core estate disposal and reorganisation
costs, a £2.6 million loss in respect of the ongoing management
of the pubs from the prior year portfolio disposal, a £4.9 million
charge in respect of the change in the inflation and discount
rate assumptions used in calculating our onerous lease
provisions, a £2.6 million charge in respect of relocation,
reorganisation and integration costs and an £8.6 million loss in
respect of the mark-to-market movement in the fair value of
certain interest rate swaps. These charges are offset by a credit
of £9.7 million relating to the tax on non-underlying items.
STRATEGIC REPORT APPROVAL
The Strategic Report, outlined on pages 1 to 26, incorporates A Snapshot of 2015, The Place to Be, Chairman’s Statement, Chief Executive’s Statement, Market Overview, Our Business Model, A Clear Strategy, Our Strategic Pillars in Action, Measuring Our Progress (KPIs), Operating Review, Risks and Risk Management, Principal Risks and Uncertainties and Performance and Financial Review.
By order of the Board
Ralph Findlay Chief Executive Officer
26 November 2015
26
Strategic report Governance Financial statements Additional information
in this section
Governance
Corporate Governance Report 28 – 35Board of Directors 30 – 31Audit Committee Report 36 – 37Nomination Committee Report 38Directors’ Remuneration Report 39 – 57Other Statutory Information 58 – 61Statement of Directors’ 62Responsibilities
27
See page 00
Marston’s PLC Annual Report and Accounts 2015
Corporate Governance Report
Chairman’s Introduction
We believe that high standards of governance are an essential underpin to sustainable growth and the protection
of shareholder value
DEAR SHAREHOLDER I am pleased to present the Board’s annual report on corporate
governance. At Marston’s we are continually striving to help
our people and our business develop and go from strength to
strength. We strongly believe that high standards of corporate
governance are an essential underpin to sustainable growth
and the protection of shareholder value. This review, together
with the reports of the Nomination, Audit and Remuneration
Committees, provides an overview of our corporate governance
practices and summarises our activities in this area during
the period.
BOARD EFFECTIVENESS The Board is keen to review and further develop its
effectiveness to support the Company in its ambitions.
Details of the outcomes from this year’s Board evaluation
together with progress against last year’s action points are
given on page 33. Details of each Director’s experience and
how that contributes to the effectiveness of the Board and the
Company are set out on pages 30 to 31.
BOARD AND COMMITTEE APPOINTMENTS As previously reported, Catherine Glickman joined the Board
(and the Remuneration Committee) on 1 December 2014 and
Rosalind Cuschieri retired from the Board following the 2015
AGM. Catherine Glickman and Carolyn Bradley also joined the
Nomination Committee during the year. Further details on the
Board’s composition are given on page 33.
REMUNERATION The Remuneration Committee has continued to focus on
strengthening and clarifying the link between rewards
and performance. The Committee has also reviewed the
requirements relating to clawback provisions and updated
the 2014 LTIP and deferred bonus rules to incorporate this
provision to ensure that they remain in line with best practice.
The Remuneration Committee’s report is on pages 39 to 57.
AUDIT The focus of the Audit Committee during the year has been on
the new requirements of the 2014 UK Corporate Governance
Code (the ‘2014 Code’), the evaluation of the internal audit
function conducted by PricewaterhouseCoopers, and the
commencement of the new internal audit co-source provision
by Grant Thornton. More details are in the Audit Committee
Report on pages 36 to 37.
STATEMENT OF COMPLIANCE The 2014 Code has applied to the Company during the reporting
period under review. I am pleased to confirm that the Board
considers it has fully complied with the main principles of the
Code. The Code is available on the Financial Reporting Council’s
website www.frc.org.uk
Roger Devlin Chairman
26 November 2015
See page 29
1 Leadership 2 Effectiveness
See page 33
3 Accountability
See page 34
4 Remuneration
See page 39
5 Shareholder Relations
See page 35
28
Strategic report Governance Financial statements Additional information
1. Leadership and the Board of Directors ROLE OF THE BOARD The Board is collectively responsible to shareholders for the
long-term success of the Company. A schedule of matters
specifically reserved for the Board’s decision has been
approved and this schedule includes matters relating to:
strategy, major capital expenditure, acquisitions and disposals,
capital structure and financial results, internal controls,
governance and risk management, committee membership
and terms of reference. The schedule was last reviewed in
September 2015 and the latest version is available on our
website. The Board met nine times during the year, allowing
sufficient opportunities to effectively challenge and monitor the
Company’s progress against its strategic aims and within the
risk management framework.
ROLES AND RESPONSIBILITIES There is a clear division of responsibility between the roles of
the Chairman and the Chief Executive Officer (CEO) which are
set out in writing and agreed by the Board.
SENIOR INDEPENDENT DIRECTOR Neil Goulden is the Senior Independent Director and acts as a
‘sounding board’ for the Chairman and as an intermediary for
the other Directors. He is available to shareholders if they have
concerns which the normal channels have failed to resolve or
for which such contact would be inappropriate. Neil also leads
the Non-executive Directors in their annual assessment of the
Chairman’s performance.
GROUP SECRETARY Anne-Marie Brennan is responsible for ensuring effective
information channels within the Board and its Committees, and
between senior management and Non-executive Directors, as
well as facilitating induction activities for Directors and assisting
with their development as required.
NON-EXECUTIVE DIRECTORS Non-executive Directors are encouraged to spend time in the
business, accompanying the Executive Directors and other
senior managers on visits to a range of pubs, customers and
brewery outlets during the year. Together with their diverse
range of business experience outside of the Company, this
enables the Non-executive Directors to constructively challenge
proposals on strategy and contribute to the development of
strategy in the long term.
The Chairman meets with the Non-executive Directors at least
annually without the Executive Directors being present.
More information about our Board and the relevant experience theybring to the business is set out on the following pages.
Chairman
Roger Devlin is responsible for:
• The operation, leadership and governance of the Board.
• Ensuring the effectiveness of the Board.
• Setting the agenda, style and tone of Board discussions with
a particular focus on strategic matters.
• Ensuring each Non-executive Director makes an effective
contribution to the Board through debate and discussion
with the Executive Directors.
• Ensuring through the Group Secretary that the Directors
receive accurate, timely and clear information.
Chief Executive Officer
Ralph Findlay is responsible for:
• The performance of the Company in line with the strategies
and objectives established by the Board and under powers
delegated by the Board.
• Ensuring the Board is supplied with information relevant
to its strategic role.
• Leading the Executive Directors and senior management in
dealing with the operational requirements of the business.
• Providing clear and visible leadership in business conduct.
29
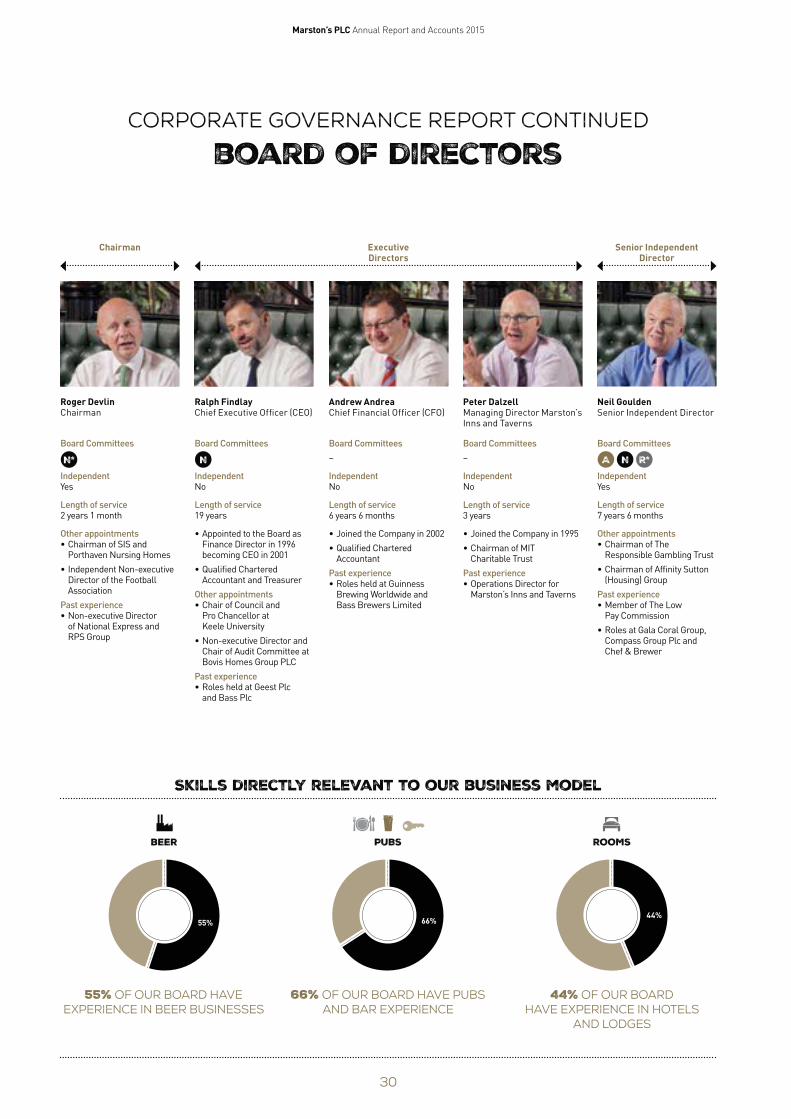
50
70
Marston’s PLC Annual Report and Accounts 2015
Corporate Governance Report continued
board of directors
Chairman Executive Senior Independent Directors Director
Roger Devlin Chairman
Board Committees
N* Independent Yes
Length of service 2 years 1 month
Other appointments • Chairman of SIS and
Porthaven Nursing Homes
• Independent Non-executive Director of the Football Association
Past experience • Non-executive Director
of National Express and RPS Group
Ralph Findlay Chief Executive Officer (CEO)
Board Committees
N Independent No
Length of service 19 years
• Appointed to the Board as Finance Director in 1996 becoming CEO in 2001
• Qualified Chartered Accountant and Treasurer
Other appointments • Chair of Council and
Pro Chancellor at Keele University
• Non-executive Director and Chair of Audit Committee at Bovis Homes Group PLC
Past experience • Roles held at Geest Plc
and Bass Plc
Andrew Andrea Chief Financial Officer (CFO)
Board Committees
–
Independent No
Length of service 6 years 6 months
• Joined the Company in 2002
• Qualified Chartered Accountant
Past experience • Roles held at Guinness
Brewing Worldwide and Bass Brewers Limited
Peter Dalzell Managing Director Marston’s Inns and Taverns
Board Committees
–
Independent No
Length of service 3 years
• Joined the Company in 1995
• Chairman of MIT Charitable Trust
Past experience • Operations Director for
Marston’s Inns and Taverns
Neil Goulden Senior Independent Director
Board Committees
A N R* Independent Yes
Length of service 7 years 6 months
Other appointments • Chairman of The
Responsible Gambling Trust
• Chairman of Affinity Sutton (Housing) Group
Past experience • Member of The Low
Pay Commission
• Roles at Gala Coral Group, Compass Group Plc and Chef & Brewer
Skills directly relevant to our business model
beer PUBS ROOMS
55% 66% 44%
55% OF OUR BOARD HAVE 66% OF OUR BOARD HAVE PUBS 44% OF OUR BOARD EXPERIENCE in beer businesses AND BAR EXPERIENCE HAVE EXPERIENCE IN HOTELS
AND LODGES
30
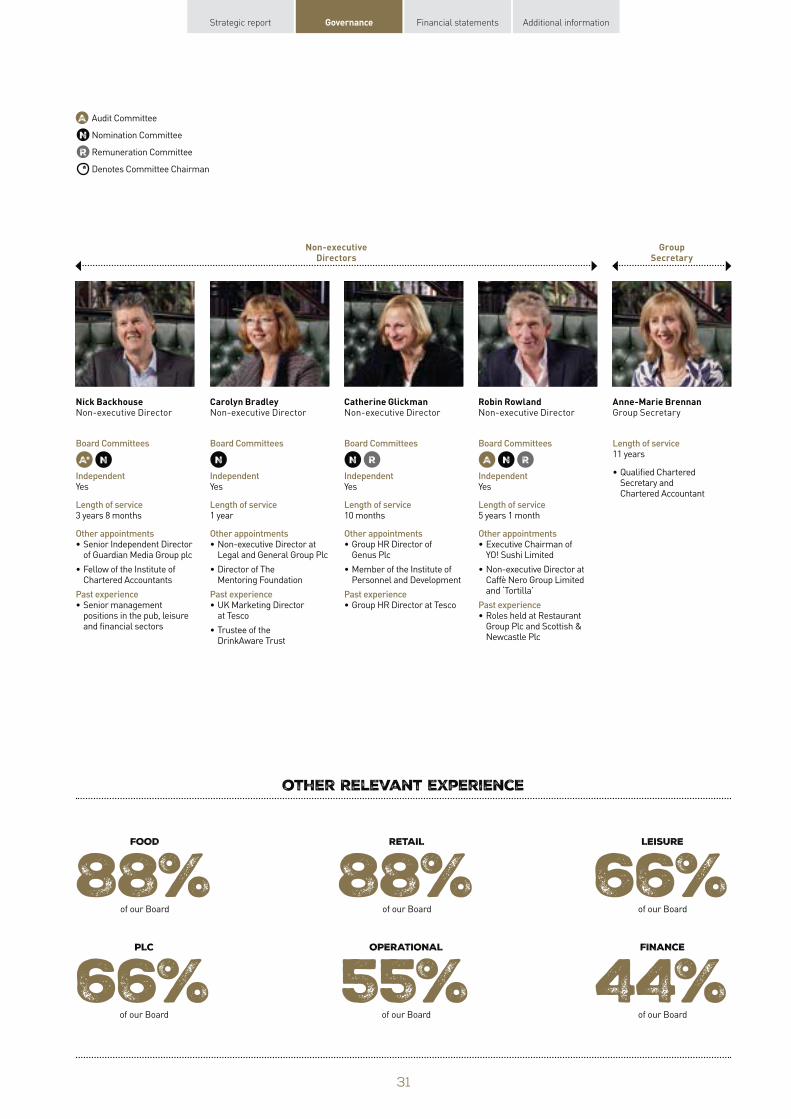
Strategic report Governance Financial statements Additional information
R
A Audit Committee
N Nomination Committee
Remuneration Committee
* Denotes Committee Chairman
Non-executive Group Directors Secretar y
Nick Backhouse Non-executive Director
Board Committees
A* N Independent Yes
Length of service 3 years 8 months
Other appointments • Senior Independent Director
of Guardian Media Group plc
• Fellow of the Institute of Chartered Accountants
Past experience • Senior management
positions in the pub, leisure and financial sectors
Anne-Marie Brennan Group Secretary
Length of service 11 years
• Qualified Chartered Secretary and Chartered Accountant
other Relevant experience
FOOD
88% of our Board
PLC
66% of our Board
Carolyn Bradley Non-executive Director
Board Committees
N Independent Yes
Length of service 1 year
Other appointments • Non-executive Director at
Legal and General Group Plc
• Director of The Mentoring Foundation
Past experience • UK Marketing Director
at Tesco
• Trustee of the DrinkAware Trust
Catherine Glickman Non-executive Director
Board Committees
N R Independent Yes
Length of service 10 months
Other appointments • Group HR Director of
Genus Plc
• Member of the Institute of Personnel and Development
Past experience • Group HR Director at Tesco
Robin Rowland Non-executive Director
Board Committees
A N R Independent Yes
Length of service 5 years 1 month
Other appointments • Executive Chairman of
YO! Sushi Limited
• Non-executive Director at Caffè Nero Group Limited and ‘Tortilla’
Past experience • Roles held at Restaurant
Group Plc and Scottish & Newcastle Plc
RETAIL
88% of our Board
OPERATIONAL
55% of our Board
LEISURE
66% of our Board
FINANCE
44% of our Board
31
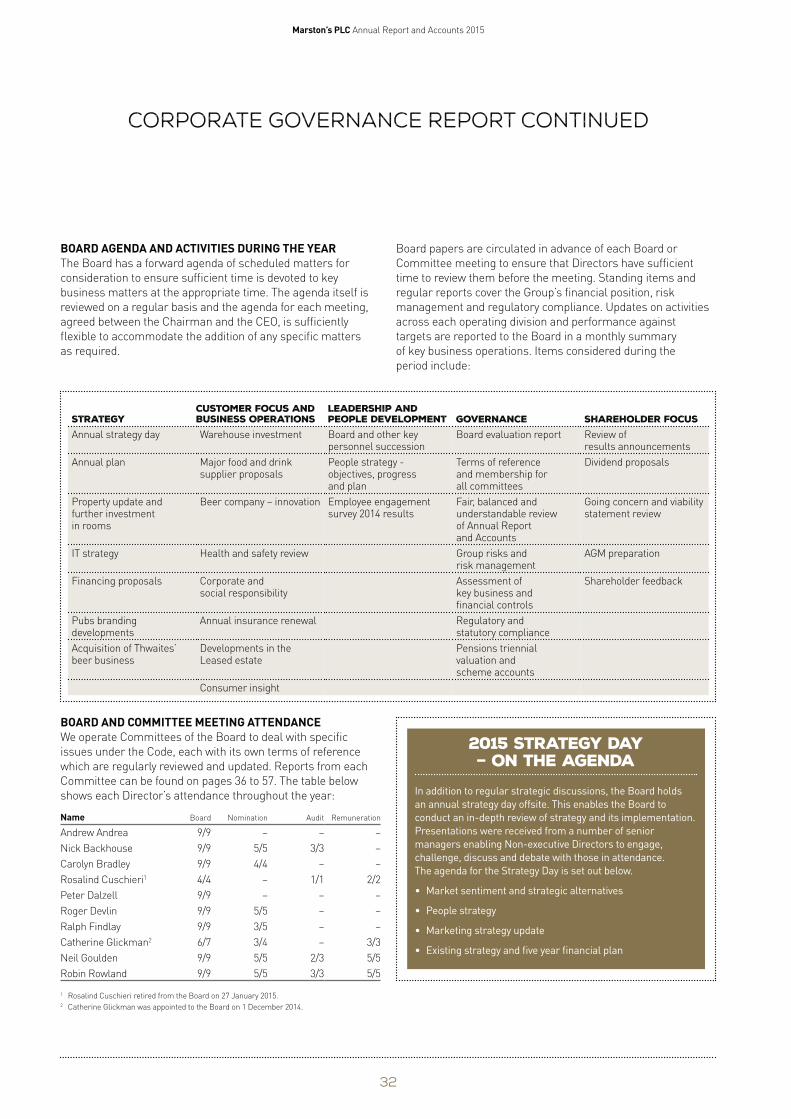
Marston’s PLC Annual Report and Accounts 2015
corporate governance report continued
BOARD AGENDA AND ACTIVITIES DURING THE YEAR The Board has a forward agenda of scheduled matters for
consideration to ensure sufficient time is devoted to key
business matters at the appropriate time. The agenda itself is
reviewed on a regular basis and the agenda for each meeting,
agreed between the Chairman and the CEO, is sufficiently
flexible to accommodate the addition of any specific matters
as required.
Board papers are circulated in advance of each Board or
Committee meeting to ensure that Directors have sufficient
time to review them before the meeting. Standing items and
regular reports cover the Group’s financial position, risk
management and regulatory compliance. Updates on activities
across each operating division and performance against
targets are reported to the Board in a monthly summary
of key business operations. Items considered during the
period include:
Customer Focus and Leadership and Strategy Business Operations People Development Governance Shareholder Focus Annual strategy day Warehouse investment Board and other key Board evaluation report Review of
personnel succession results announcements
Annual plan Major food and drink People strategy supplier proposals objectives, progress
and plan
Property update and further investment survey 2014 results in rooms
IT strategy Health and safety review
Financing proposals Corporate and social responsibility
Pubs branding Annual insurance renewal developments
Acquisition of Thwaites’ Developments in the beer business Leased estate
Consumer insight
Terms of reference and membership for all committees
Fair, balanced and understandable review of Annual Report and Accounts
Group risks and risk management
Assessment of key business and financial controls
Dividend proposals
Going concern and viability statement review
AGM preparation
Shareholder feedback
Beer company – innovation Employee engagement
Regulatory and statutory compliance
Pensions triennial valuation and scheme accounts
BOARD AND COMMITTEE MEETING ATTENDANCE We operate Committees of the Board to deal with specific
issues under the Code, each with its own terms of reference
which are regularly reviewed and updated. Reports from each
Committee can be found on pages 36 to 57. The table below
shows each Director’s attendance throughout the year:
Name Board Nomination Audit Remuneration
Andrew Andrea 9/9 – – –
Nick Backhouse 9/9 5/5 3/3 –
Carolyn Bradley 9/9 4/4 – –
Rosalind Cuschieri1 4/4 – 1/1 2/2
Peter Dalzell 9/9 – – –
Roger Devlin 9/9 5/5 – –
Ralph Findlay 9/9 3/5 – –
Catherine Glickman2 6/7 3/4 – 3/3
Neil Goulden 9/9 5/5 2/3 5/5
Robin Rowland 9/9 5/5 3/3 5/5
1 Rosalind Cuschieri retired from the Board on 27 January 2015. 2 Catherine Glickman was appointed to the Board on 1 December 2014.
2015 Strategy Day – On the agenda
In addition to regular strategic discussions, the Board holds
an annual strategy day offsite. This enables the Board to
conduct an in-depth review of strategy and its implementation.
Presentations were received from a number of senior
managers enabling Non-executive Directors to engage,
challenge, discuss and debate with those in attendance.
The agenda for the Strategy Day is set out below.
• Market sentiment and strategic alternatives
• People strategy
• Marketing strategy update
• Existing strategy and five year financial plan
32
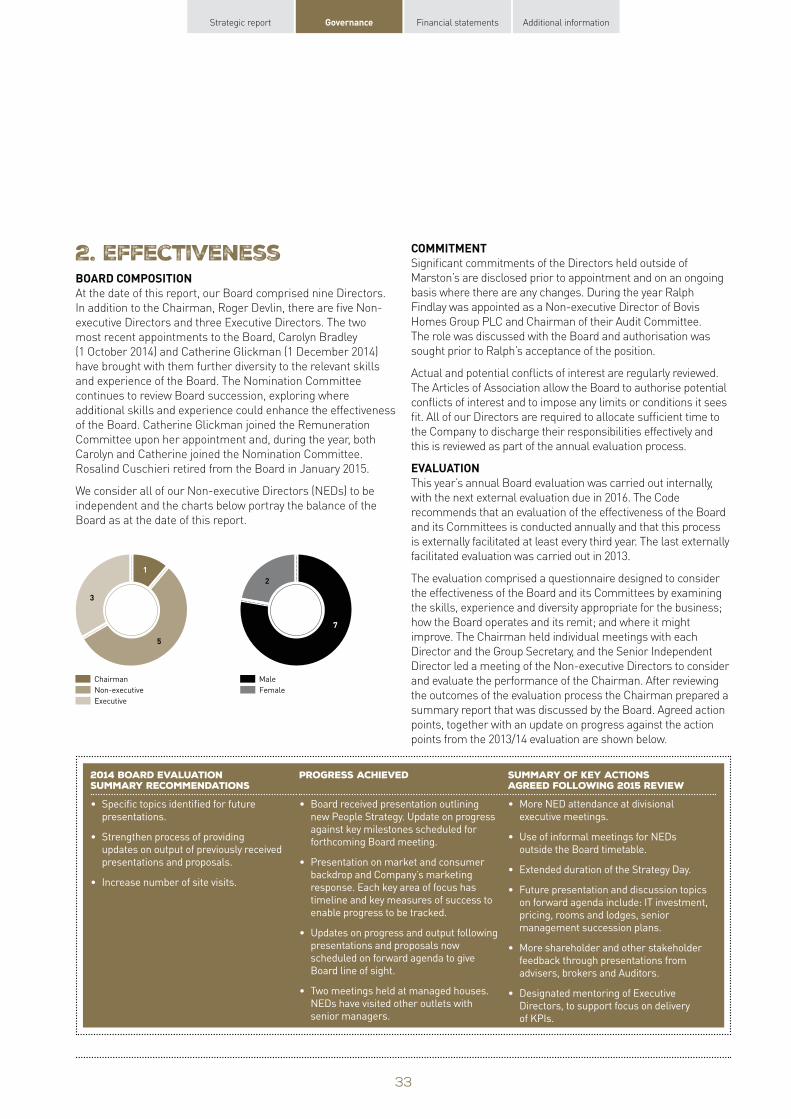
Strategic report Governance Financial statements Additional information
2. Effectiveness BOARD COMPOSITION At the date of this report, our Board comprised nine Directors.
In addition to the Chairman, Roger Devlin, there are five Non-
executive Directors and three Executive Directors. The two
most recent appointments to the Board, Carolyn Bradley
(1 October 2014) and Catherine Glickman (1 December 2014)
have brought with them further diversity to the relevant skills
and experience of the Board. The Nomination Committee
continues to review Board succession, exploring where
additional skills and experience could enhance the effectiveness
of the Board. Catherine Glickman joined the Remuneration
Committee upon her appointment and, during the year, both
Carolyn and Catherine joined the Nomination Committee.
Rosalind Cuschieri retired from the Board in January 2015.
We consider all of our Non-executive Directors (NEDs) to be
independent and the charts below portray the balance of the
Board as at the date of this report.
3
5
1
Chairman
Non-executive
Executive
2
7
Male
Female
COMMITMENT Significant commitments of the Directors held outside of
Marston’s are disclosed prior to appointment and on an ongoing
basis where there are any changes. During the year Ralph
Findlay was appointed as a Non-executive Director of Bovis
Homes Group PLC and Chairman of their Audit Committee.
The role was discussed with the Board and authorisation was
sought prior to Ralph’s acceptance of the position.
Actual and potential conflicts of interest are regularly reviewed.
The Articles of Association allow the Board to authorise potential
conflicts of interest and to impose any limits or conditions it sees
fit. All of our Directors are required to allocate sufficient time to
the Company to discharge their responsibilities effectively and
this is reviewed as part of the annual evaluation process.
EVALUATION This year’s annual Board evaluation was carried out internally,
with the next external evaluation due in 2016. The Code
recommends that an evaluation of the effectiveness of the Board
and its Committees is conducted annually and that this process
is externally facilitated at least every third year. The last externally
facilitated evaluation was carried out in 2013.
The evaluation comprised a questionnaire designed to consider
the effectiveness of the Board and its Committees by examining
the skills, experience and diversity appropriate for the business;
how the Board operates and its remit; and where it might
improve. The Chairman held individual meetings with each
Director and the Group Secretary, and the Senior Independent
Director led a meeting of the Non-executive Directors to consider
and evaluate the performance of the Chairman. After reviewing
the outcomes of the evaluation process the Chairman prepared a
summary report that was discussed by the Board. Agreed action
points, together with an update on progress against the action
points from the 2013/14 evaluation are shown below.
2014 Board evaluation summary recommendations
Progress achieved Summary of key actions agreed following 2015 review
• Specific topics identified for future
presentations.
• Strengthen process of providing
updates on output of previously received
presentations and proposals.
• Increase number of site visits.
• Board received presentation outlining
new People Strategy. Update on progress
against key milestones scheduled for
forthcoming Board meeting.
• Presentation on market and consumer
backdrop and Company’s marketing
response. Each key area of focus has
timeline and key measures of success to
enable progress to be tracked.
• Updates on progress and output following
presentations and proposals now
scheduled on forward agenda to give
Board line of sight.
• Two meetings held at managed houses.
NEDs have visited other outlets with
senior managers.
• More NED attendance at divisional
executive meetings.
• Use of informal meetings for NEDs
outside the Board timetable.
• Extended duration of the Strategy Day.
• Future presentation and discussion topics
on forward agenda include: IT investment,
pricing, rooms and lodges, senior
management succession plans.
• More shareholder and other stakeholder
feedback through presentations from
advisers, brokers and Auditors.
• Designated mentoring of Executive
Directors, to support focus on delivery
of KPIs.
33
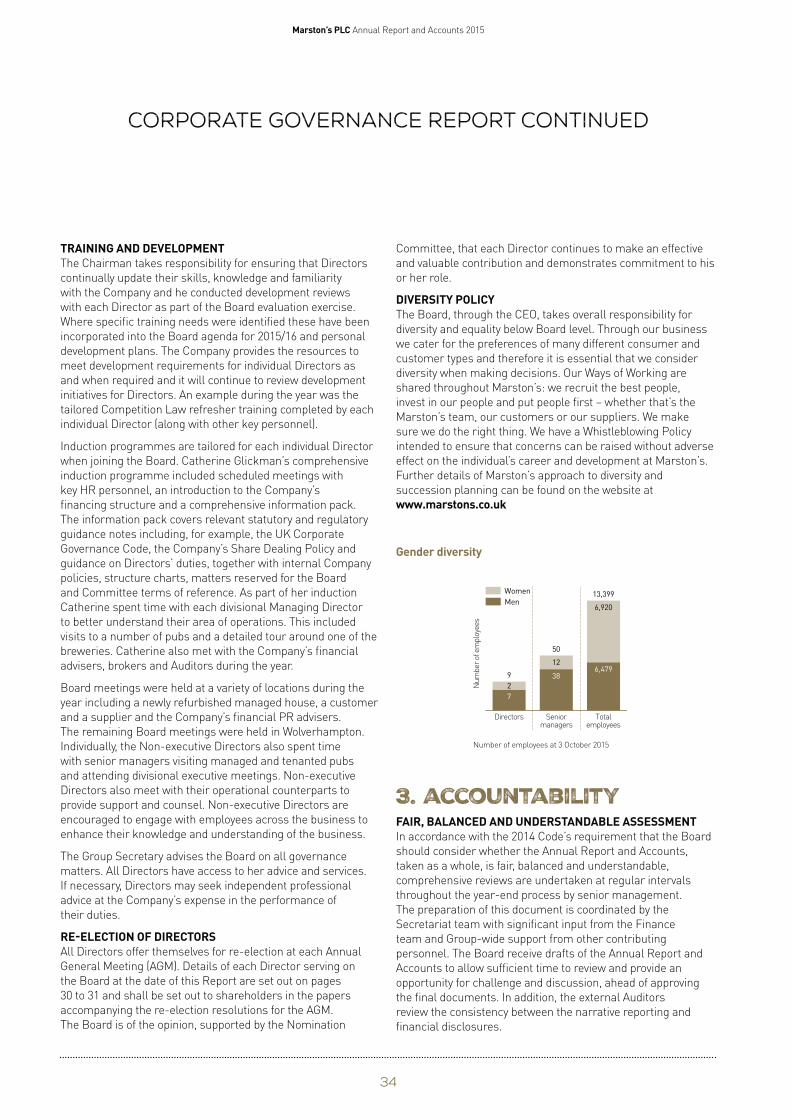
00
00
Marston’s PLC Annual Report and Accounts 2015
corporate governance report continued
TRAINING AND DEVELOPMENT The Chairman takes responsibility for ensuring that Directors
continually update their skills, knowledge and familiarity
with the Company and he conducted development reviews
with each Director as part of the Board evaluation exercise.
Where specific training needs were identified these have been
incorporated into the Board agenda for 2015/16 and personal
development plans. The Company provides the resources to
meet development requirements for individual Directors as
and when required and it will continue to review development
initiatives for Directors. An example during the year was the
tailored Competition Law refresher training completed by each
individual Director (along with other key personnel).
Induction programmes are tailored for each individual Director
when joining the Board. Catherine Glickman’s comprehensive
induction programme included scheduled meetings with
key HR personnel, an introduction to the Company’s
financing structure and a comprehensive information pack.
The information pack covers relevant statutory and regulatory
guidance notes including, for example, the UK Corporate
Governance Code, the Company’s Share Dealing Policy and
guidance on Directors’ duties, together with internal Company
policies, structure charts, matters reserved for the Board
and Committee terms of reference. As part of her induction
Catherine spent time with each divisional Managing Director
to better understand their area of operations. This included
visits to a number of pubs and a detailed tour around one of the
Committee, that each Director continues to make an effective
and valuable contribution and demonstrates commitment to his
or her role.
DIVERSITY POLICY The Board, through the CEO, takes overall responsibility for
diversity and equality below Board level. Through our business
we cater for the preferences of many different consumer and
customer types and therefore it is essential that we consider
diversity when making decisions. Our Ways of Working are
shared throughout Marston’s: we recruit the best people,
invest in our people and put people first – whether that’s the
Marston’s team, our customers or our suppliers. We make
sure we do the right thing. We have a Whistleblowing Policy
intended to ensure that concerns can be raised without adverse
effect on the individual’s career and development at Marston’s.
Further details of Marston’s approach to diversity and
succession planning can be found on the website at
www.marstons.co.uk
Gender diversity
Women 13,399 Men
6,920
Num
ber
of e
mplo
yees
breweries. Catherine also met with the Company’s financial
advisers, brokers and Auditors during the year.
Board meetings were held at a variety of locations during the
50
12 6,479
389
2
7year including a newly refurbished managed house, a customer
and a supplier and the Company’s financial PR advisers.
The remaining Board meetings were held in Wolverhampton.
Individually, the Non-executive Directors also spent time
with senior managers visiting managed and tenanted pubs
and attending divisional executive meetings. Non-executive
Directors also meet with their operational counterparts to
provide support and counsel. Non-executive Directors are
encouraged to engage with employees across the business to
enhance their knowledge and understanding of the business.
The Group Secretary advises the Board on all governance
matters. All Directors have access to her advice and services.
If necessary, Directors may seek independent professional
advice at the Company’s expense in the performance of
their duties.
RE-ELECTION OF DIRECTORS All Directors offer themselves for re-election at each Annual
General Meeting (AGM). Details of each Director serving on
the Board at the date of this Report are set out on pages
30 to 31 and shall be set out to shareholders in the papers
accompanying the re-election resolutions for the AGM.
The Board is of the opinion, supported by the Nomination
Directors Senior Total managers employees
Number of employees at 3 October 2015
3. accountability FAIR, BALANCED AND UNDERSTANDABLE ASSESSMENT In accordance with the 2014 Code’s requirement that the Board
should consider whether the Annual Report and Accounts,
taken as a whole, is fair, balanced and understandable,
comprehensive reviews are undertaken at regular intervals
throughout the year-end process by senior management.
The preparation of this document is coordinated by the
Secretariat team with significant input from the Finance
team and Group-wide support from other contributing
personnel. The Board receive drafts of the Annual Report and
Accounts to allow sufficient time to review and provide an
opportunity for challenge and discussion, ahead of approving
the final documents. In addition, the external Auditors
review the consistency between the narrative reporting and
financial disclosures.
34
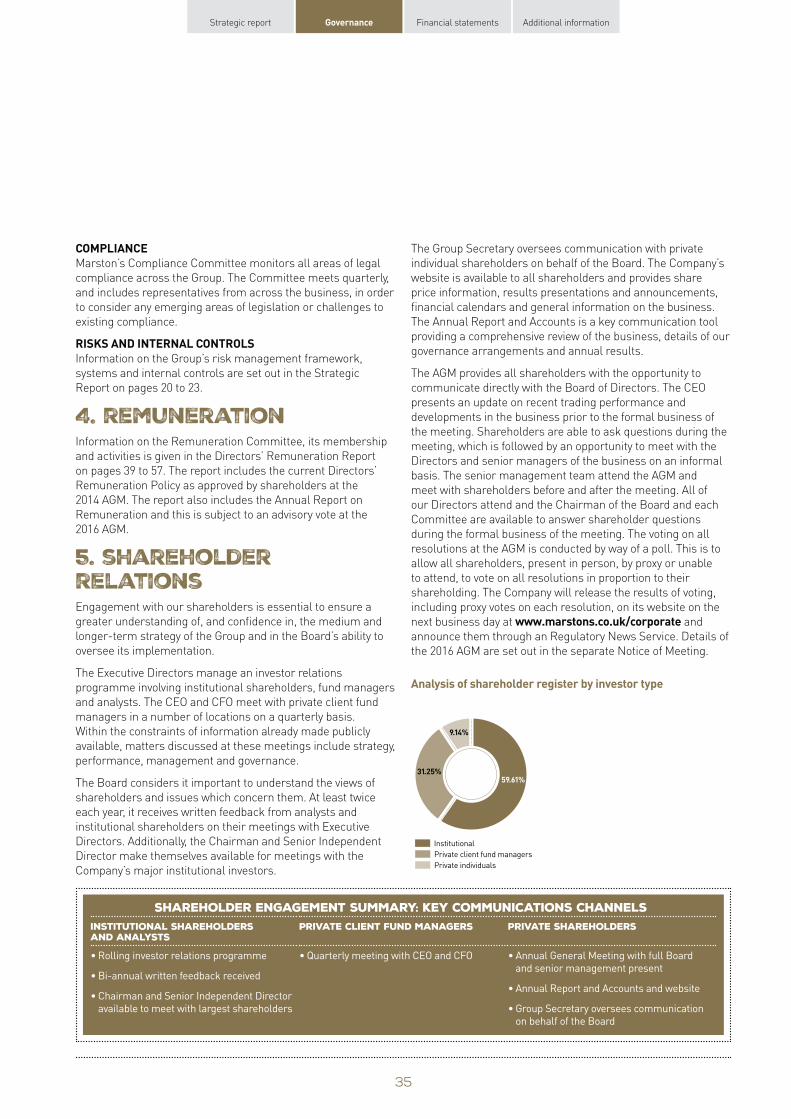
Strategic report Governance Financial statements Additional information
COMPLIANCE Marston’s Compliance Committee monitors all areas of legal
compliance across the Group. The Committee meets quarterly,
and includes representatives from across the business, in order
to consider any emerging areas of legislation or challenges to
existing compliance.
RISKS AND INTERNAL CONTROLS Information on the Group’s risk management framework,
systems and internal controls are set out in the Strategic
Report on pages 20 to 23.
4. remuneration Information on the Remuneration Committee, its membership
and activities is given in the Directors’ Remuneration Report
on pages 39 to 57. The report includes the current Directors’
Remuneration Policy as approved by shareholders at the
2014 AGM. The report also includes the Annual Report on
Remuneration and this is subject to an advisory vote at the
2016 AGM.
5. shareholder relations Engagement with our shareholders is essential to ensure a
greater understanding of, and confidence in, the medium and
longer-term strategy of the Group and in the Board’s ability to
oversee its implementation.
The Executive Directors manage an investor relations
programme involving institutional shareholders, fund managers
and analysts. The CEO and CFO meet with private client fund
managers in a number of locations on a quarterly basis.
Within the constraints of information already made publicly
available, matters discussed at these meetings include strategy,
performance, management and governance.
The Board considers it important to understand the views of
shareholders and issues which concern them. At least twice
each year, it receives written feedback from analysts and
institutional shareholders on their meetings with Executive
Directors. Additionally, the Chairman and Senior Independent
Director make themselves available for meetings with the
Company’s major institutional investors.
The Group Secretary oversees communication with private
individual shareholders on behalf of the Board. The Company’s
website is available to all shareholders and provides share
price information, results presentations and announcements,
financial calendars and general information on the business.
The Annual Report and Accounts is a key communication tool
providing a comprehensive review of the business, details of our
governance arrangements and annual results.
The AGM provides all shareholders with the opportunity to
communicate directly with the Board of Directors. The CEO
presents an update on recent trading performance and
developments in the business prior to the formal business of
the meeting. Shareholders are able to ask questions during the
meeting, which is followed by an opportunity to meet with the
Directors and senior managers of the business on an informal
basis. The senior management team attend the AGM and
meet with shareholders before and after the meeting. All of
our Directors attend and the Chairman of the Board and each
Committee are available to answer shareholder questions
during the formal business of the meeting. The voting on all
resolutions at the AGM is conducted by way of a poll. This is to
allow all shareholders, present in person, by proxy or unable
to attend, to vote on all resolutions in proportion to their
shareholding. The Company will release the results of voting,
including proxy votes on each resolution, on its website on the
next business day at www.marstons.co.uk/corporate and
announce them through an Regulatory News Service. Details of
the 2016 AGM are set out in the separate Notice of Meeting.
Analysis of shareholder register by investor type
9.14%
31.25% 59.61%
Institutional
Private client fund managers
Private individuals
SHAREHOLDER ENGAGEMENT SUMMARY: KEY COMMUNICATIONS CHANNELS Institutional shareholders and analysts
Private Client Fund Managers Private shareholders
• Rolling investor relations programme
• Bi-annual written feedback received
• Chairman and Senior Independent Director
available to meet with largest shareholders
• Quarterly meeting with CEO and CFO • Annual General Meeting with full Board
and senior management present
• Annual Report and Accounts and website
• Group Secretary oversees communication
on behalf of the Board
35
Marston’s PLC Annual Report and Accounts 2015
audit committee report
DEAR SHAREHOLDER I am pleased to present the Audit Committee Report for the
period ended 3 October 2015.
Each member of the Committee, all independent Non-executive
Directors, contributes their own financial and business
experience to effectively assess the external and internal audits
of the Company and the internal control and risk management
systems. Both Neil Goulden and I are considered by the
Board to meet the requirements of the Code as having recent
and relevant financial experience. The Committee members
challenge and debate the reports, statements and findings
presented to them.
A key focus for the Committee this year has been the new
requirements of the 2014 Code that now apply to the Company,
particularly the process by which the Directors are able
to confirm they have carried out a robust assessment of
the principal risks facing the Company and consideration
of the period over which the viability statement will apply.
The Committee has reviewed the assurance process and
the risk management framework to ensure that it remains
appropriate and does provide a robust assessment of those
principal risks. See pages 20 to 23 for more details.
The Committee has also considered and discussed a report
undertaken by PwC evaluating the internal audit function.
The output from those discussions is a reassurance of the
quality of the function currently provided and a programme to
further develop the internal audit plan, succession planning
and the allocation of additional resource. Mindful of increasing
responsibilities, the Committee has also reviewed its own
meeting agenda to ensure it is allowing sufficient time to focus
on the issues within its remit and extended the time allocated
as appropriate.
Having reviewed the external audit process, the Committee
believes that PwC continue to provide an effective audit service
and recommends their re-appointment to shareholders.
As previously reported, the audit partner is next due to rotate
after the 2017 reporting period and the Company will conduct a
full tender of the external audit at that time. The Committee will
review and agree a timetable for the tender process during the
coming financial year.
Nick Backhouse Chairman of the Audit Committee
Membership Responsibilities Nick Backhouse
Rosalind Cuschieri (until 27 January 2015)
Neil Goulden
Robin Rowland
• Reviewing the integrity of the Group’s financial statements including the Interim Results and the Annual Report and Accounts.
• Reviewing the effectiveness of the internal controls and risk management system.
• Reviewing the Group’s systems for detecting fraud, preventing bribery and allowing employees to raise concerns in a safe and confidential manner.
• Reviewing the effectiveness of the internal audit function.
• Overseeing the relationship with the external Auditors, specifically reviewing and approving their fees and the terms of engagement.
• Reviewing and monitoring the external Auditors’ objectivity and independence and the effectiveness of the audit process.
Attendees Terms of reference The Corporate Risk Director and external Auditors attend each Full terms of reference of the Committee can be found in the Investors meeting. section of the Company’s website www.marstons.co.uk Other individuals, such as the CEO and CFO are usually invited to attend all or part of the Committee’s meetings.
36
Strategic report Governance Financial statements Additional information
AUDITORS In assessing the work of the external Auditors, the
Committee was satisfied with the scope of their work and
their effectiveness, and recommended their re-appointment
to the Board. The Committee has satisfied itself that the
independence and objectivity of the external Auditors, and the
safeguards to protect it, remain strong noting the following:
• The external Auditors conduct an annual review of their
independence identifying all services provided to the Group
and assessing whether the content and scale of such work is
a threat to their independence.
• The Committee accepts that some non-audit work is
most appropriately undertaken by the external Auditors.
The Committee’s terms of reference set out what is
permissible and where such work is expected to be in excess
of a specified amount, the Chairman of the Audit Committee
must approve the work. Below that amount, the CFO has
authority to approve such work once he is satisfied that the
Auditors are the most appropriate providers. The Group
has used other accounting firms for some non-audit
work. In each case, consideration is given to the need for
value for money, experience and objectivity required in the
particular circumstances.
• The audit partner is changed at least once every five years
and a new partner was appointed during the 2012/13 financial
reporting period. The audit partner is next due to rotate
after the 2016/17 financial year when a formal tender will be
conducted. Given the length of their tenure, PwC will not be
invited to tender at that time.
Fees paid to the external Auditors are disclosed in Note 3 of the Financial Statements on page 83
KEY ACTIViTIES DURING THE REPORTING YEAR
• Considering the implications of the new requirements
introduced in the 2014 Code.
• Reviewing the main corporate risks and the outcomes
from testing the systems and processes for managing and
mitigating those risks. The Committee has satisfied itself
that the Risk Management Framework provides sufficient
assurances.
• Drafting a viability statement that assesses the prospects
of the Group over an appropriate period. The Committee
considered that the Group’s existing five year financial
planning horizon makes that time period most appropriate.
• Assessing the evaluation of the Internal Audit function that
found the overall function to be sound and efficient but
identified opportunities for improvement through better
use of technology, audit plan development and succession
planning. An action plan and timeline for implementing
improvements has been agreed with the Corporate Risk
Director. The Committee will track progress over the coming
reporting period.
The Corporate Risk Director attends each Committee meeting
providing ongoing assurance and regular updates on the
Group’s main risks and the scope and findings of internal audit.
As part of its remit, the Committee also considered the Annual
Report and Accounts and Interim Results. In order to provide
the Committee with the opportunity to review and challenge
the integrity of the Company’s financial reports, the external
Auditors also attend each meeting. The external Auditors
also present their audit strategy, findings and conclusions in
respect of the Annual Report and Accounts and Interim Results.
In addition, at least once a year, the external Auditors meet the
Committee without any Executive Director present to provide an
opportunity for open dialogue and feedback.
The Committee also reviewed a number of standing items
including the Whistleblowing Policy and arrangements
thereunder, matters arising from internal audits and
compliance and legal developments.
SIGNIFICANT FINANCIAL JUDGEMENTS In recommending the Interim Results and Annual Report and
Accounts to the Board for approval, the Committee reviewed
in particular the accounting for and disclosure of the following
key matters:
• Estate revaluation. The Committee considered the results of
the external valuation of the Group’s entire property portfolio
undertaken during the year. The Committee challenged the
valuation methodologies adopted and assumptions used,
considering external trends and the performance of the
properties, and concluded that the valuation was appropriate.
• Non-underlying items. The Committee reviewed
management’s assessment of each item disclosed as non-
underlying and satisfied itself that the classification was both
consistent with prior years and appropriate. In reaching this
conclusion the Committee took note of the quality of earnings
and, in particular, the threshold for property-related matters
to be treated as non-underlying.
• Acquisition of the beer business of Daniel Thwaites PLC.
The Committee reviewed management’s assessment of the
accounting for this acquisition, including the assumptions
made in valuing the acquired beer brands. The Committee
was satisfied that the methodology adopted and the
judgements made were suitable.
• Uncertain tax positions. Having considered the Group’s
outstanding tax positions where settlement is uncertain,
and having considered the risks relating to each of the
various items, the Committee concurred with management’s
treatment and disclosure. The Committee noted that the
potential benefit in respect of the majority of positions has not
been recognised.
37
Marston’s PLC Annual Report and Accounts 2015
Nomination Committee Report
DEAR SHAREHOLDER As previously reported, this year saw a number of changes
to the Board and Committees. Catherine Glickman joined
the Board on 1 December 2014 and Rosalind Cuschieri
retired from the Board on 27 January 2015. Catherine joined
the Remuneration Committee upon her appointment and
both Carolyn Bradley and Catherine were appointed to the
Nomination Committee with effect from 8 May 2015.
DIVERSITY POLICY Our approach remains the same: we take note of the guidance
provided and we require any search agency to have signed up to
their industry’s Voluntary Code of Conduct addressing gender
diversity. We have not set a specific target for numbers of female
Directors and we will continue to make appointments on the basis
of merit. However, we recognise the benefits that greater diversity
can bring and take into account such factors when considering
any particular appointment. Currently, two of Marston’s nine Board
members are female.
RE-ELECTION AND EVALUATION The Committee considered the time required from each
Non-executive Director, their effectiveness and the experience
brought to the Board. Neil Goulden’s breadth of experience in
the pubs, food and leisure sectors together with his involvement
in areas relevant to our corporate responsibilities make
Membership Responsibilities Roger Devlin (Chairman) • Ensure the Board and its Committees
have the right balance of skills, Ralph Findlay knowledge and experience.
Nick Backhouse • To plan for the orderly succession of
Carolyn Bradley Directors to the Board and other senior
Rosalind Cuschieri managers.
(until 27 January 2015) • To identify and nominate suitable
Neil Goulden candidates for Executive and Non-
executive Director vacancies having Catherine Glickman regard to, amongst other factors, the
Robin Rowland benefits of diversity, including gender
diversity.
Attendees Terms of reference Other Executive Directors, senior Full terms of reference of the
management and external advisers Committee can be found in the
may be invited to attend meetings. Investors section of the Company’s
website.
his continuing role as a Non-executive Director invaluable.
Mindful that an effective Board should be a balance between
preserving some continuity of challenge with the introduction
of some fresh thinking, the Committee consider Neil’s tenure
on the Board to strengthen his effectiveness as the Senior
Independent Director. Looking ahead, Neil has stated that he
will step down from the Board after the 2017 AGM.
Finally, the Committee considered its own effectiveness.
This provided a formal opportunity to review the way we operate
and our strategy for discharging those duties. The Committee
was satisfied that it continues to perform its duties in
accordance with its terms of reference.
Having discussed the personal effectiveness and commitment
with each Director in individual meetings as part of this year’s
Board evaluation, I have concluded that the performance of
each Board member continues to be effective and I therefore
recommend the re-election of each Director to shareholders at
the 2016 Annual General Meeting.
Roger Devlin Chairman of the Nomination Committee
KEY ACTIViTIES DURING THE REPORTING YEAR
• Understanding the leadership needs of the business,
succession planning, the process for this year’s Board
evaluation and the contribution and tenure of each Director.
• Considering future succession planning and executive
development needs to ensure delivery of operational
performance in line with the Company’s strategy.
• Ahead of this year’s internal evaluation process, the
Committee met to consider the most effective method for the
review of the Board, its Committees and individual contribution
of each Director.
• Reviewing the membership of the Board and each of its
Committees by way of a self-assessment skills matrix of
core competencies. We developed the matrix to identify the
strengths and balance of skills and experience within the
Board and any gaps in desirable skills when looking to future
appointments.
38
-
Strategic report Governance Financial statements Additional information
Directors’ Remuneration Report
Remuneration Committee Chairman – Annual Statement
DEAR SHAREHOLDER On behalf of the Board, I am pleased to present the
Remuneration Report for the period ended 3 October 2015,
which details the amounts earned in respect of that period and
sets out the Remuneration Policy for the Directors of Marston’s.
The Committee met five times during the period and details of
the Committee membership is shown overleaf.
PERFORMANCE Our Executive Directors have delivered a strong set of results
aligned with our strategy. Underlying profit before tax is up
10.2% to £91.5 million and underlying earnings per share have
also increased this year. Our Executive Directors and our people
have made excellent progress in transforming our pub portfolio
into an optimal estate and our new-build investment continues
to deliver strong returns with the average profit per pub up to
£100,000 and return on capital up to 10.8%.
Our KPIs and how they link to our strategy and to remuneration
are set out on pages 16 to 17. The Committee believes that
the alignment of Remuneration Policy with our five strategic
pillars continues to incentivise and drive results that generate
sustainable value creation for our shareholders. The annual
bonus scheme targets profit growth and returns on our
investment in the business, through CROCCE and Group profit
measures. The LTIP incentivises over the longer term through
sustainable growth in: earnings per share (EPS) and return
on investment, both drivers of shareholder value measured
by relative Total Shareholder Return (TSR); and free cash
flow, which enables continued investment in the business and
debt servicing.
2014/15 key decisions and incentive pay outs
Average base salary increases awarded to the Executive Directors in 2015 were circa 2%, in line with average salary increases across
the Group. Peter Dalzell was awarded an additional 3.5% increase in base salary to reflect his span of responsibilities for the entire pub
estate, to align his salary with the other Executive Directors and the market, and recognise his contribution to the long-term success of
the Company.
Marston’s underlying profit before tax increased by 10.2% for the year and return on capital exceeded target. The Executive Directors will
receive 40% of their maximum annual bonus entitlements. On a straight-line vesting basis a bonus level of 45% would have been payable
but, taking into account the affordability of bonus payments across the Group, and to reaffirm their commitment to a responsible approach
to executive pay, the Committee exercised restraint and awarded bonuses of 40% of salary.
The 2012 LTIP award vested at 41.9%, as a result of EPS growth from 2012 to 2014. Further details are set out on page 43. The Committee
has discretion to withhold or reduce awards (but not to increase them) and, when reviewing the outturn of an award, has regard to the
financial performance of the business for the financial period in which the award vests. For the 2012 award the Committee has taken into
account a further 12 months of performance to provide additional assurance that the vesting of the award is appropriate.
39
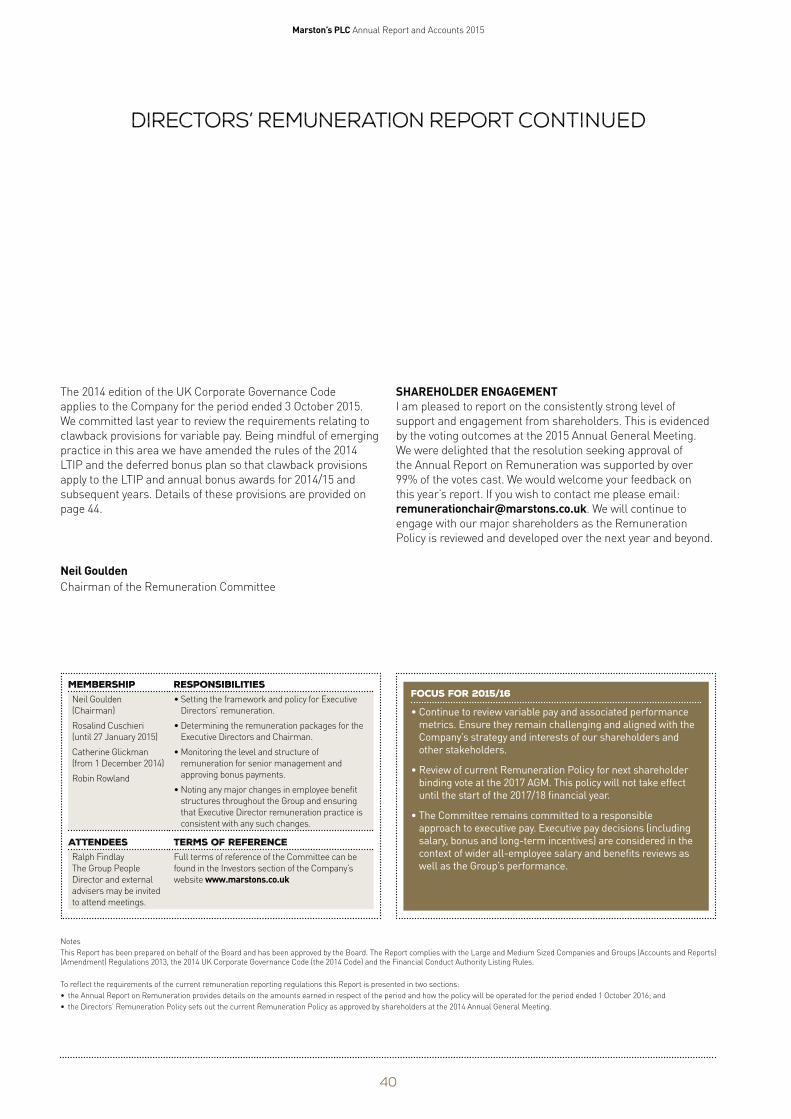
Marston’s PLC Annual Report and Accounts 2015
Directors’ Remuneration Report continued
The 2014 edition of the UK Corporate Governance Code
applies to the Company for the period ended 3 October 2015.
We committed last year to review the requirements relating to
clawback provisions for variable pay. Being mindful of emerging
practice in this area we have amended the rules of the 2014
LTIP and the deferred bonus plan so that clawback provisions
apply to the LTIP and annual bonus awards for 2014/15 and
subsequent years. Details of these provisions are provided on
page 44.
Neil Goulden Chairman of the Remuneration Committee
Membership Responsibilities Neil Goulden
(Chairman)
Rosalind Cuschieri
(until 27 January 2015)
Catherine Glickman
(from 1 December 2014)
Robin Rowland
• Setting the framework and policy for Executive
Directors’ remuneration.
• Determining the remuneration packages for the
Executive Directors and Chairman.
• Monitoring the level and structure of
remuneration for senior management and
approving bonus payments.
• Noting any major changes in employee benefit
structures throughout the Group and ensuring
that Executive Director remuneration practice is
consistent with any such changes.
Attendees Terms of reference Ralph Findlay
The Group People
Director and external
advisers may be invited
to attend meetings.
Full terms of reference of the Committee can be
found in the Investors section of the Company’s
website www.marstons.co.uk
SHAREHOLDER ENGAGEMENT I am pleased to report on the consistently strong level of
support and engagement from shareholders. This is evidenced
by the voting outcomes at the 2015 Annual General Meeting.
We were delighted that the resolution seeking approval of
the Annual Report on Remuneration was supported by over
99% of the votes cast. We would welcome your feedback on
this year’s report. If you wish to contact me please email:
[email protected]. We will continue to
engage with our major shareholders as the Remuneration
Policy is reviewed and developed over the next year and beyond.
focus for 2015/16
• Continue to review variable pay and associated performance
metrics. Ensure they remain challenging and aligned with the
Company’s strategy and interests of our shareholders and
other stakeholders.
• Review of current Remuneration Policy for next shareholder
binding vote at the 2017 AGM. This policy will not take effect
until the start of the 2017/18 financial year.
• The Committee remains committed to a responsible
approach to executive pay. Executive pay decisions (including
salary, bonus and long-term incentives) are considered in the
context of wider all-employee salary and benefits reviews as
well as the Group’s performance.
Notes
This Report has been prepared on behalf of the Board and has been approved by the Board. The Report complies with the Large and Medium Sized Companies and Groups (Accounts and Reports) (Amendment) Regulations 2013, the 2014 UK Corporate Governance Code (the 2014 Code) and the Financial Conduct Authority Listing Rules.
To reflect the requirements of the current remuneration reporting regulations this Report is presented in two sections:
• the Annual Report on Remuneration provides details on the amounts earned in respect of the period and how the policy will be operated for the period ended 1 October 2016; and
• the Directors’ Remuneration Policy sets out the current Remuneration Policy as approved by shareholders at the 2014 Annual General Meeting.
40
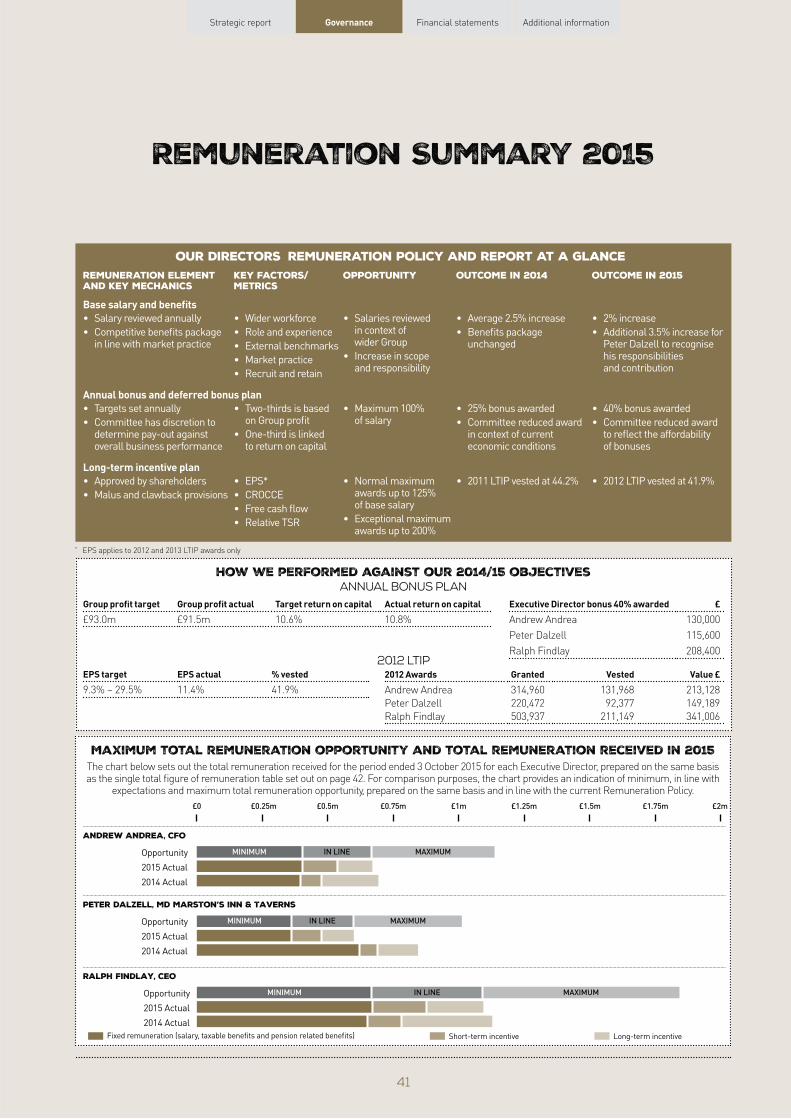
’
Strategic report Governance Financial statements Additional information
Remuneration Summary 2015
Our directorS remuneration policy and report at a glance Remuneration element and key mechanics
Key factors/ metrics
opportunity Outcome in 2014 Outcome in 2015
Base salary and benefits • Salary reviewed annually
• Competitive benefits package in line with market practice
• Wider workforce
• Role and experience
• External benchmarks
• Market practice
• Recruit and retain
• Salaries reviewed in context of wider Group
• Increase in scope and responsibility
• Average 2.5% increase
• Benefits package unchanged
• 2% increase
• Additional 3.5% increase for Peter Dalzell to recognise his responsibilities and contribution
Annual bonus and deferred bonus plan • Targets set annually
• Committee has discretion to determine pay-out against overall business performance
• Two-thirds is based on Group profit
• One-third is linked to return on capital
• Maximum 100% of salary
• 25% bonus awarded
• Committee reduced award in context of current economic conditions
• 40% bonus awarded
• Committee reduced award to reflect the affordability of bonuses
Long-term incentive plan • Approved by shareholders
• Malus and clawback provisions
• EPS*
• CROCCE
• Free cash flow
• Relative TSR
• Normal maximum awards up to 125% of base salary
• Exceptional maximum awards up to 200%
• 2011 LTIP vested at 44.2% • 2012 LTIP vested at 41.9%
* EPS applies to 2012 and 2013 LTIP awards only
How we performed against our 2014/15 objectives Annual bonus plan
Group profit target Group profit actual Target return on capital Actual return on capital Executive Director bonus 40% awarded £
£93.0m £91.5m 10.6% 10.8% Andrew Andrea 130,000
Peter Dalzell 115,600
2012 LTIP Ralph Findlay 208,400
EPS target EPS actual % vested 2012 Awards Granted Vested Value £
9.3% – 29.5% 11.4% 41.9% Andrew Andrea 314,960 131,968 213,128
Peter Dalzell 220,472 92,377 149,189
Ralph Findlay 503,937 211,149 341,006
Maximum total remuneration opportunity and total remuneration received in 2015 The chart below sets out the total remuneration received for the period ended 3 October 2015 for each Executive Director, prepared on the same basis as the single total figure of remuneration table set out on page 42. For comparison purposes, the chart provides an indication of minimum, in line with
expectations and maximum total remuneration opportunity, prepared on the same basis and in line with the current Remuneration Policy.
£0 £0.25m £0.5m £0.75m £1m £1.25m £1.5m £1.75m £2m
ANDREW ANDREA, CFO
2015 Actual
2014 Actual
Opportunity MINIMUM IN LINE MAXIMUM
MINIMUM
Peter dalzell, md marston’s inn & taverns
2015 Actual
Opportunity
2014 Actual
IN LINE MAXIMUM
Ralph findlay, CeO
MINIMUM IN LINE MAXIMUMOpportunity
2015 Actual
2014 Actual
Fixed remuneration (salary, taxable benefits and pension related benefits) Short-term incentive Long-term incentive
41
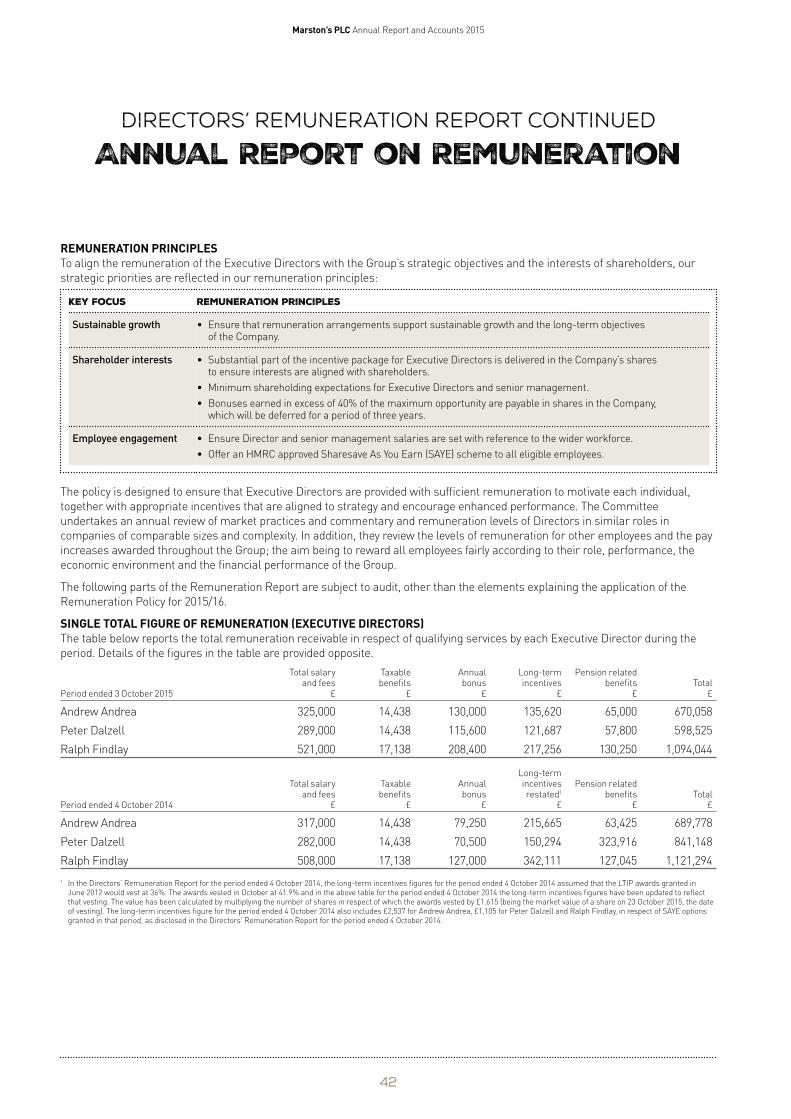
Marston’s PLC Annual Report and Accounts 2015
Directors’ Remuneration Report continued
Annual Report on Remuneration
REMUNERATION PRINCIPLES To align the remuneration of the Executive Directors with the Group’s strategic objectives and the interests of shareholders, our
strategic priorities are reflected in our remuneration principles:
Key focus Remuneration principles
Sustainable growth • Ensure that remuneration arrangements support sustainable growth and the long-term objectives of the Company.
Shareholder interests • Substantial part of the incentive package for Executive Directors is delivered in the Company’s shares to ensure interests are aligned with shareholders.
• Minimum shareholding expectations for Executive Directors and senior management.
• Bonuses earned in excess of 40% of the maximum opportunity are payable in shares in the Company, which will be deferred for a period of three years.
Employee engagement • Ensure Director and senior management salaries are set with reference to the wider workforce.
• Offer an HMRC approved Sharesave As You Earn (SAYE) scheme to all eligible employees.
The policy is designed to ensure that Executive Directors are provided with sufficient remuneration to motivate each individual,
together with appropriate incentives that are aligned to strategy and encourage enhanced performance. The Committee
undertakes an annual review of market practices and commentary and remuneration levels of Directors in similar roles in
companies of comparable sizes and complexity. In addition, they review the levels of remuneration for other employees and the pay
increases awarded throughout the Group; the aim being to reward all employees fairly according to their role, performance, the
economic environment and the financial performance of the Group.
The following parts of the Remuneration Report are subject to audit, other than the elements explaining the application of the
Remuneration Policy for 2015/16.
SINGLE TOTAL FIGURE OF REMUNERATION (EXECUTIVE DIRECTORS) The table below reports the total remuneration receivable in respect of qualifying services by each Executive Director during the
period. Details of the figures in the table are provided opposite.
Total salary Taxable Annual Long-term Pension related and fees benefits bonus incentives benefits Total
Period ended 3 October 2015 £ £ £ £ £ £
Andrew Andrea 325,000 14,438 130,000 135,620 65,000 670,058
Peter Dalzell 289,000 14,438 115,600 121,687 57,800 598,525
Ralph Findlay 521,000 17,138 208,400 217,256 130,250 1,094,044
Long-term Total salary Taxable Annual incentives Pension related
and fees benefits bonus restated1 benefits Total Period ended 4 October 2014 £ £ £ £ £ £
Andrew Andrea 317,000 14,438 79,250 215,665 63,425 689,778
Peter Dalzell 282,000 14,438 70,500 150,294 323,916 841,148
Ralph Findlay 508,000 17,138 127,000 342,111 127,045 1,121,294
In the Directors’ Remuneration Report for the period ended 4 October 2014, the long-term incentives figures for the period ended 4 October 2014 assumed that the LTIP awards granted in June 2012 would vest at 36%. The awards vested in October at 41.9% and in the above table for the period ended 4 October 2014 the long-term incentives figures have been updated to reflect that vesting. The value has been calculated by multiplying the number of shares in respect of which the awards vested by £1.615 (being the market value of a share on 23 October 2015, the date of vesting). The long-term incentives figure for the period ended 4 October 2014 also includes £2,537 for Andrew Andrea, £1,105 for Peter Dalzell and Ralph Findlay, in respect of SAYE options granted in that period, as disclosed in the Directors’ Remuneration Report for the period ended 4 October 2014.
42
1
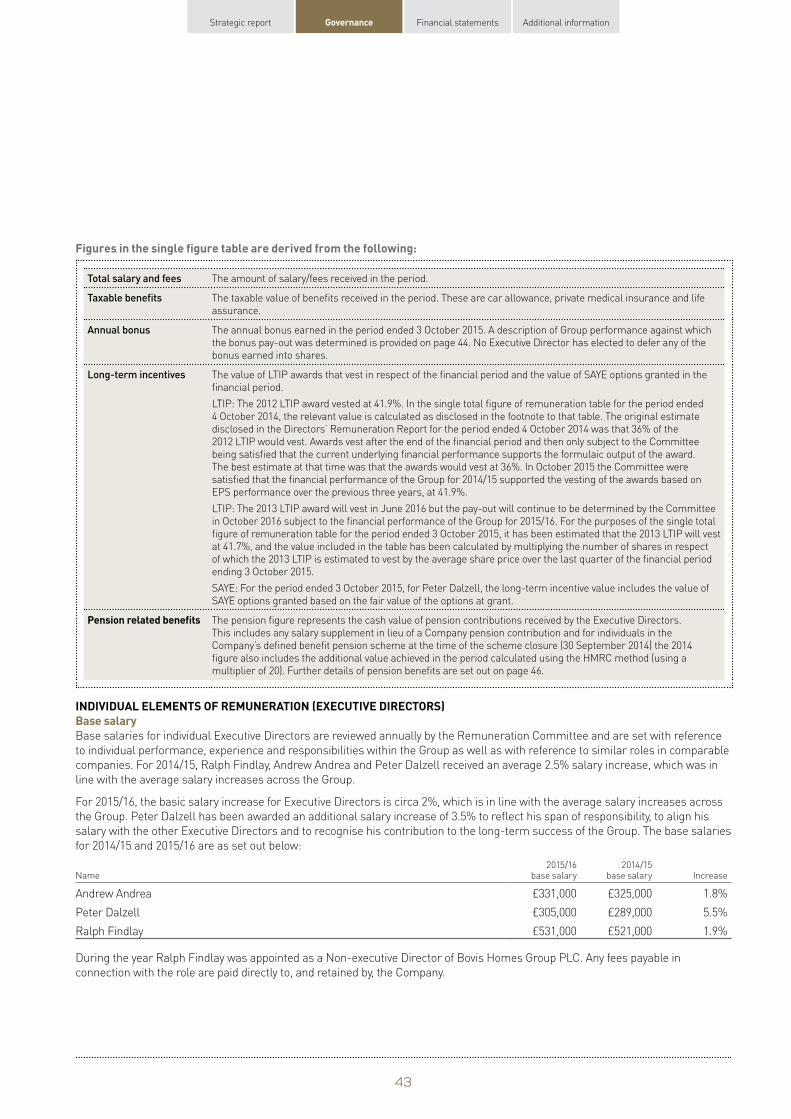
Strategic report Governance Financial statements Additional information
Figures in the single figure table are derived from the following:
Total salary and fees The amount of salary/fees received in the period.
Taxable benefits The taxable value of benefits received in the period. These are car allowance, private medical insurance and life assurance.
Annual bonus The annual bonus earned in the period ended 3 October 2015. A description of Group performance against which the bonus pay-out was determined is provided on page 44. No Executive Director has elected to defer any of the bonus earned into shares.
Long-term incentives The value of LTIP awards that vest in respect of the financial period and the value of SAYE options granted in the financial period.
LTIP: The 2012 LTIP award vested at 41.9%. In the single total figure of remuneration table for the period ended 4 October 2014, the relevant value is calculated as disclosed in the footnote to that table. The original estimate disclosed in the Directors’ Remuneration Report for the period ended 4 October 2014 was that 36% of the 2012 LTIP would vest. Awards vest after the end of the financial period and then only subject to the Committee being satisfied that the current underlying financial performance supports the formulaic output of the award. The best estimate at that time was that the awards would vest at 36%. In October 2015 the Committee were satisfied that the financial performance of the Group for 2014/15 supported the vesting of the awards based on EPS performance over the previous three years, at 41.9%.
LTIP: The 2013 LTIP award will vest in June 2016 but the pay-out will continue to be determined by the Committee in October 2016 subject to the financial performance of the Group for 2015/16. For the purposes of the single total figure of remuneration table for the period ended 3 October 2015, it has been estimated that the 2013 LTIP will vest at 41.7%, and the value included in the table has been calculated by multiplying the number of shares in respect of which the 2013 LTIP is estimated to vest by the average share price over the last quarter of the financial period ending 3 October 2015.
SAYE: For the period ended 3 October 2015, for Peter Dalzell, the long-term incentive value includes the value of SAYE options granted based on the fair value of the options at grant.
Pension related benefits The pension figure represents the cash value of pension contributions received by the Executive Directors. This includes any salary supplement in lieu of a Company pension contribution and for individuals in the Company’s defined benefit pension scheme at the time of the scheme closure (30 September 2014) the 2014 figure also includes the additional value achieved in the period calculated using the HMRC method (using a multiplier of 20). Further details of pension benefits are set out on page 46.
INDIVIDUAL ELEMENTS OF REMUNERATION (EXECUTIVE DIRECTORS) Base salary Base salaries for individual Executive Directors are reviewed annually by the Remuneration Committee and are set with reference
to individual performance, experience and responsibilities within the Group as well as with reference to similar roles in comparable
companies. For 2014/15, Ralph Findlay, Andrew Andrea and Peter Dalzell received an average 2.5% salary increase, which was in
line with the average salary increases across the Group.
For 2015/16, the basic salary increase for Executive Directors is circa 2%, which is in line with the average salary increases across
the Group. Peter Dalzell has been awarded an additional salary increase of 3.5% to reflect his span of responsibility, to align his
salary with the other Executive Directors and to recognise his contribution to the long-term success of the Group. The base salaries
for 2014/15 and 2015/16 are as set out below:
2015/16 2014/15 Name base salary base salary Increase
Andrew Andrea £331,000 £325,000 1.8%
Peter Dalzell £305,000 £289,000 5.5%
Ralph Findlay £531,000 £521,000 1.9%
During the year Ralph Findlay was appointed as a Non-executive Director of Bovis Homes Group PLC. Any fees payable in
connection with the role are paid directly to, and retained by, the Company.
43
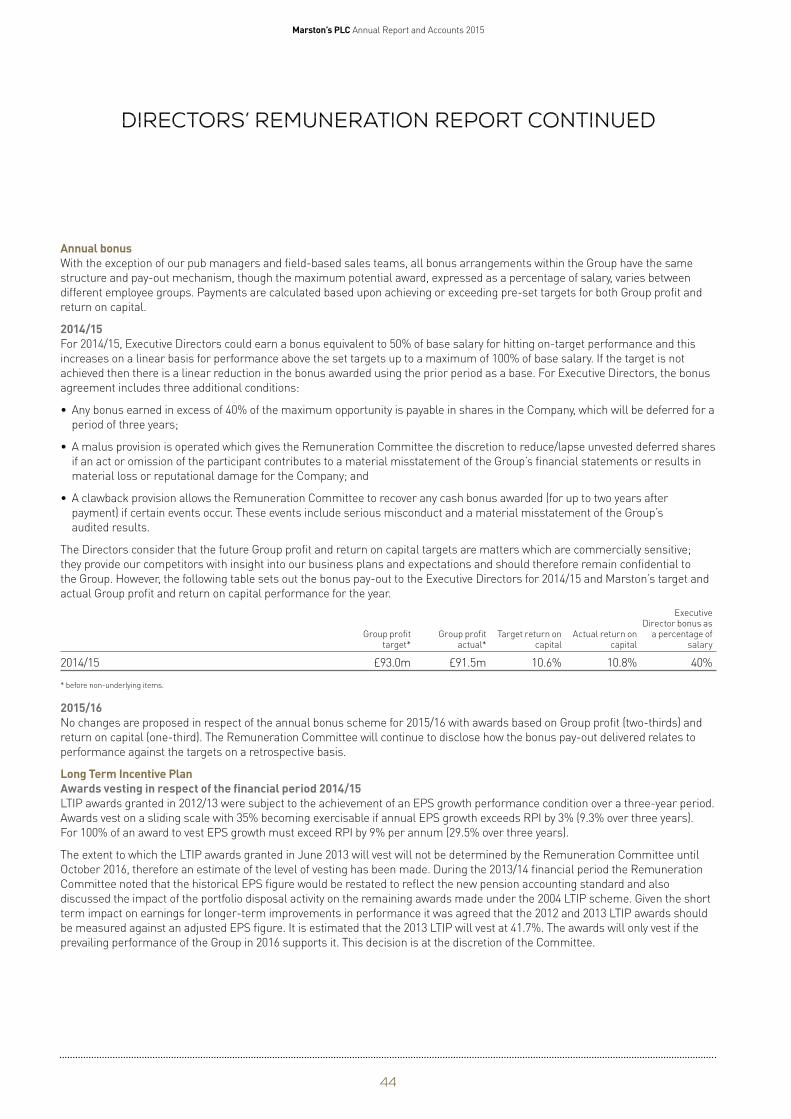
Marston’s PLC Annual Report and Accounts 2015
Directors’ Remuneration Report continued
Annual bonus With the exception of our pub managers and field-based sales teams, all bonus arrangements within the Group have the same
structure and pay-out mechanism, though the maximum potential award, expressed as a percentage of salary, varies between
different employee groups. Payments are calculated based upon achieving or exceeding pre-set targets for both Group profit and
return on capital.
2014/15 For 2014/15, Executive Directors could earn a bonus equivalent to 50% of base salary for hitting on-target performance and this
increases on a linear basis for performance above the set targets up to a maximum of 100% of base salary. If the target is not
achieved then there is a linear reduction in the bonus awarded using the prior period as a base. For Executive Directors, the bonus
agreement includes three additional conditions:
• Any bonus earned in excess of 40% of the maximum opportunity is payable in shares in the Company, which will be deferred for a
period of three years;
• A malus provision is operated which gives the Remuneration Committee the discretion to reduce/lapse unvested deferred shares
if an act or omission of the participant contributes to a material misstatement of the Group’s financial statements or results in
material loss or reputational damage for the Company; and
• A clawback provision allows the Remuneration Committee to recover any cash bonus awarded (for up to two years after
payment) if certain events occur. These events include serious misconduct and a material misstatement of the Group’s
audited results.
The Directors consider that the future Group profit and return on capital targets are matters which are commercially sensitive;
they provide our competitors with insight into our business plans and expectations and should therefore remain confidential to
the Group. However, the following table sets out the bonus pay-out to the Executive Directors for 2014/15 and Marston’s target and
actual Group profit and return on capital performance for the year.
Executive Director bonus as
Group profit Group profit Target return on Actual return on a percentage of target* actual* capital capital salary
2014/15 £93.0m £91.5m 10.6% 10.8% 40%
* before non-underlying items.
2015/16 No changes are proposed in respect of the annual bonus scheme for 2015/16 with awards based on Group profit (two-thirds) and
return on capital (one-third). The Remuneration Committee will continue to disclose how the bonus pay-out delivered relates to
performance against the targets on a retrospective basis.
Long Term Incentive Plan Awards vesting in respect of the financial period 2014/15 LTIP awards granted in 2012/13 were subject to the achievement of an EPS growth performance condition over a three-year period.
Awards vest on a sliding scale with 35% becoming exercisable if annual EPS growth exceeds RPI by 3% (9.3% over three years).
For 100% of an award to vest EPS growth must exceed RPI by 9% per annum (29.5% over three years).
The extent to which the LTIP awards granted in June 2013 will vest will not be determined by the Remuneration Committee until
October 2016, therefore an estimate of the level of vesting has been made. During the 2013/14 financial period the Remuneration
Committee noted that the historical EPS figure would be restated to reflect the new pension accounting standard and also
discussed the impact of the portfolio disposal activity on the remaining awards made under the 2004 LTIP scheme. Given the short
term impact on earnings for longer-term improvements in performance it was agreed that the 2012 and 2013 LTIP awards should
be measured against an adjusted EPS figure. It is estimated that the 2013 LTIP will vest at 41.7%. The awards will only vest if the
prevailing performance of the Group in 2016 supports it. This decision is at the discretion of the Committee.
44
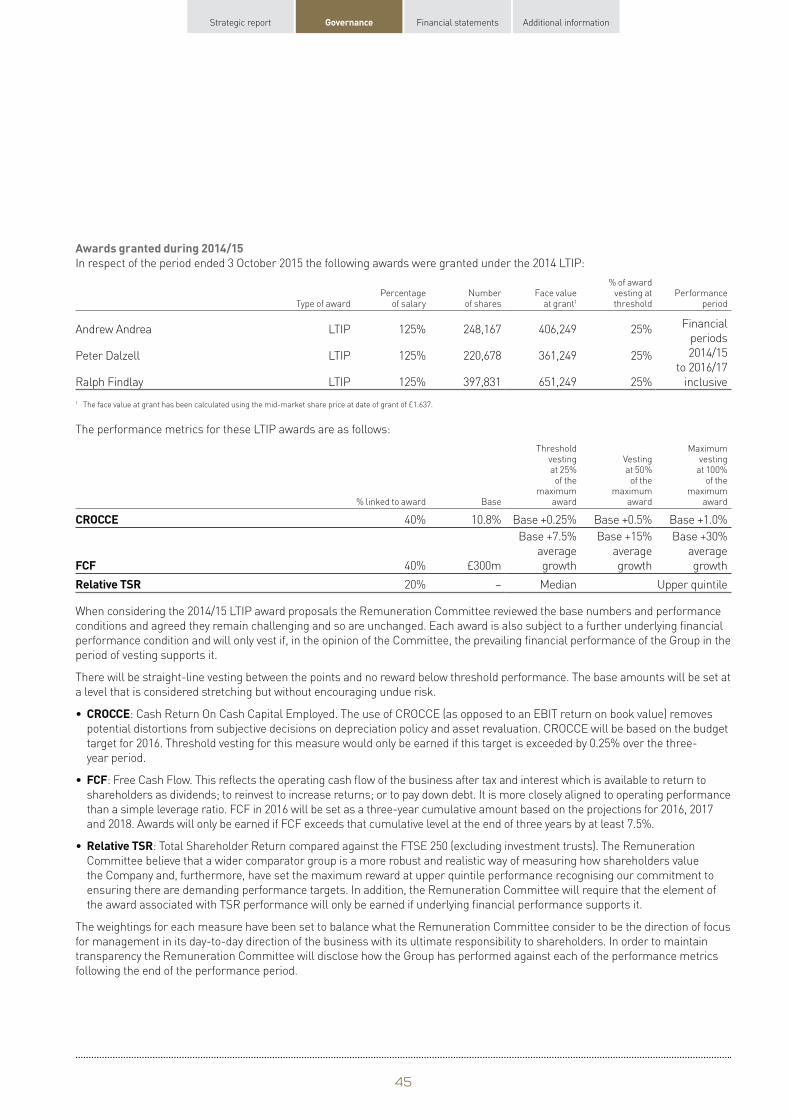
Strategic report Governance Financial statements Additional information
Awards granted during 2014/15 In respect of the period ended 3 October 2015 the following awards were granted under the 2014 LTIP:
Type of award Percentage
of salary Number
of shares Face value
at grant1
% of award vesting at threshold
Performance period
FinancialAndrew Andrea LTIP 125% 248,167 406,249 25% periods
Peter Dalzell LTIP 125% 220,678 361,249 25% 2014/15
to 2016/17
Ralph Findlay LTIP 125% 397,831 651,249 25% inclusive
1 The face value at grant has been calculated using the mid-market share price at date of grant of £1.637.
The performance metrics for these LTIP awards are as follows:
% linked to award Base
Threshold vesting at 25% of the
maximum award
Vesting at 50% of the
maximum award
Maximum vesting
at 100% of the
maximum award
CROCCE 40% 10.8% Base +0.25% Base +0.5% Base +1.0%
Base +7.5% Base +15% Base +30%
average average average
FCF 40% £300m growth growth growth
Relative TSR 20% – Median Upper quintile
When considering the 2014/15 LTIP award proposals the Remuneration Committee reviewed the base numbers and performance
conditions and agreed they remain challenging and so are unchanged. Each award is also subject to a further underlying financial
performance condition and will only vest if, in the opinion of the Committee, the prevailing financial performance of the Group in the
period of vesting supports it.
There will be straight-line vesting between the points and no reward below threshold performance. The base amounts will be set at
a level that is considered stretching but without encouraging undue risk.
• CROCCE: Cash Return On Cash Capital Employed. The use of CROCCE (as opposed to an EBIT return on book value) removes
potential distortions from subjective decisions on depreciation policy and asset revaluation. CROCCE will be based on the budget
target for 2016. Threshold vesting for this measure would only be earned if this target is exceeded by 0.25% over the three-
year period.
• FCF: Free Cash Flow. This reflects the operating cash flow of the business after tax and interest which is available to return to
shareholders as dividends; to reinvest to increase returns; or to pay down debt. It is more closely aligned to operating performance
than a simple leverage ratio. FCF in 2016 will be set as a three-year cumulative amount based on the projections for 2016, 2017
and 2018. Awards will only be earned if FCF exceeds that cumulative level at the end of three years by at least 7.5%.
• Relative TSR: Total Shareholder Return compared against the FTSE 250 (excluding investment trusts). The Remuneration
Committee believe that a wider comparator group is a more robust and realistic way of measuring how shareholders value
the Company and, furthermore, have set the maximum reward at upper quintile performance recognising our commitment to
ensuring there are demanding performance targets. In addition, the Remuneration Committee will require that the element of
the award associated with TSR performance will only be earned if underlying financial performance supports it.
The weightings for each measure have been set to balance what the Remuneration Committee consider to be the direction of focus
for management in its day-to-day direction of the business with its ultimate responsibility to shareholders. In order to maintain
transparency the Remuneration Committee will disclose how the Group has performed against each of the performance metrics
following the end of the performance period.
45
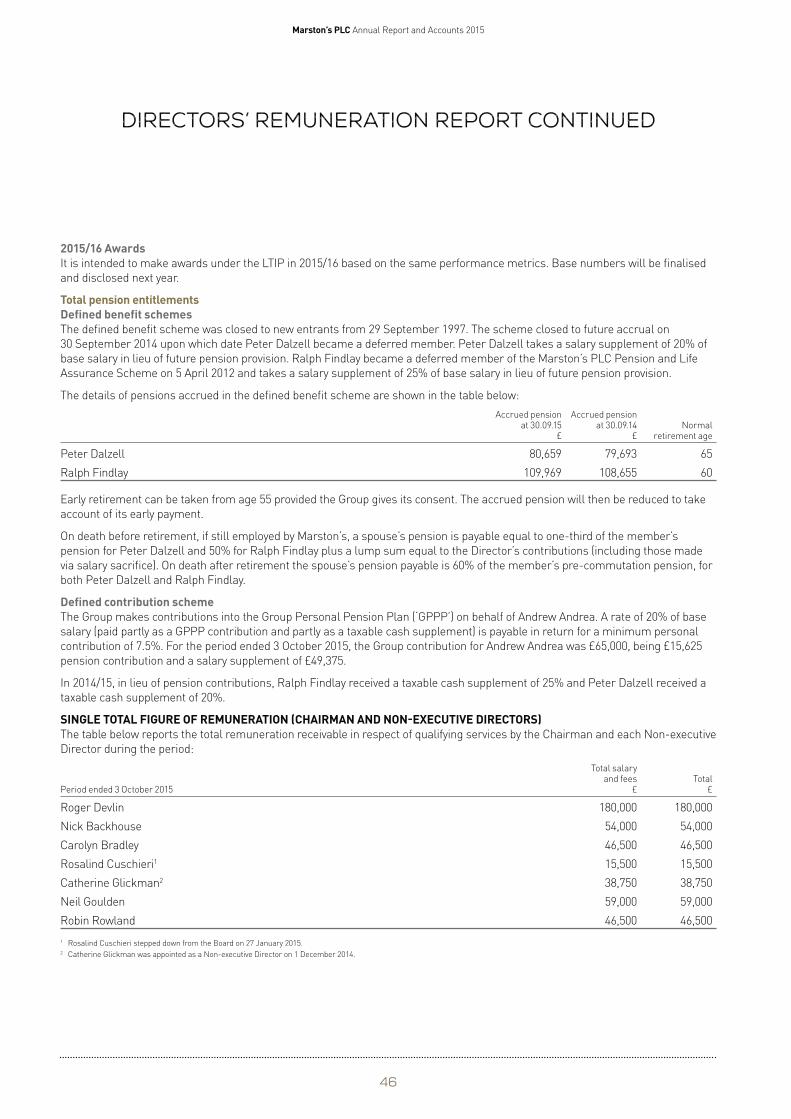
Marston’s PLC Annual Report and Accounts 2015
Directors’ Remuneration Report continued
2015/16 Awards It is intended to make awards under the LTIP in 2015/16 based on the same performance metrics. Base numbers will be finalised
and disclosed next year.
Total pension entitlements Defined benefit schemes The defined benefit scheme was closed to new entrants from 29 September 1997. The scheme closed to future accrual on
30 September 2014 upon which date Peter Dalzell became a deferred member. Peter Dalzell takes a salary supplement of 20% of
base salary in lieu of future pension provision. Ralph Findlay became a deferred member of the Marston’s PLC Pension and Life
Assurance Scheme on 5 April 2012 and takes a salary supplement of 25% of base salary in lieu of future pension provision.
The details of pensions accrued in the defined benefit scheme are shown in the table below:
Accrued pension Accrued pension at 30.09.15 at 30.09.14 Normal
£ £ retirement age
Peter Dalzell 80,659 79,693 65
Ralph Findlay 109,969 108,655 60
Early retirement can be taken from age 55 provided the Group gives its consent. The accrued pension will then be reduced to take
account of its early payment.
On death before retirement, if still employed by Marston’s, a spouse’s pension is payable equal to one-third of the member’s
pension for Peter Dalzell and 50% for Ralph Findlay plus a lump sum equal to the Director’s contributions (including those made
via salary sacrifice). On death after retirement the spouse’s pension payable is 60% of the member’s pre-commutation pension, for
both Peter Dalzell and Ralph Findlay.
Defined contribution scheme The Group makes contributions into the Group Personal Pension Plan (‘GPPP’) on behalf of Andrew Andrea. A rate of 20% of base
salary (paid partly as a GPPP contribution and partly as a taxable cash supplement) is payable in return for a minimum personal
contribution of 7.5%. For the period ended 3 October 2015, the Group contribution for Andrew Andrea was £65,000, being £15,625
pension contribution and a salary supplement of £49,375.
In 2014/15, in lieu of pension contributions, Ralph Findlay received a taxable cash supplement of 25% and Peter Dalzell received a
taxable cash supplement of 20%.
SINGLE TOTAL FIGURE OF REMUNERATION (CHAIRMAN AND NON-EXECUTIVE DIRECTORS) The table below reports the total remuneration receivable in respect of qualifying services by the Chairman and each Non-executive
Director during the period:
Total salary and fees Total
Period ended 3 October 2015 £ £
Roger Devlin 180,000 180,000
Nick Backhouse 54,000 54,000
Carolyn Bradley 46,500 46,500
Rosalind Cuschieri1 15,500 15,500
Catherine Glickman2 38,750 38,750
Neil Goulden 59,000 59,000
Robin Rowland 46,500 46,500
1 Rosalind Cuschieri stepped down from the Board on 27 January 2015. 2 Catherine Glickman was appointed as a Non-executive Director on 1 December 2014.
46
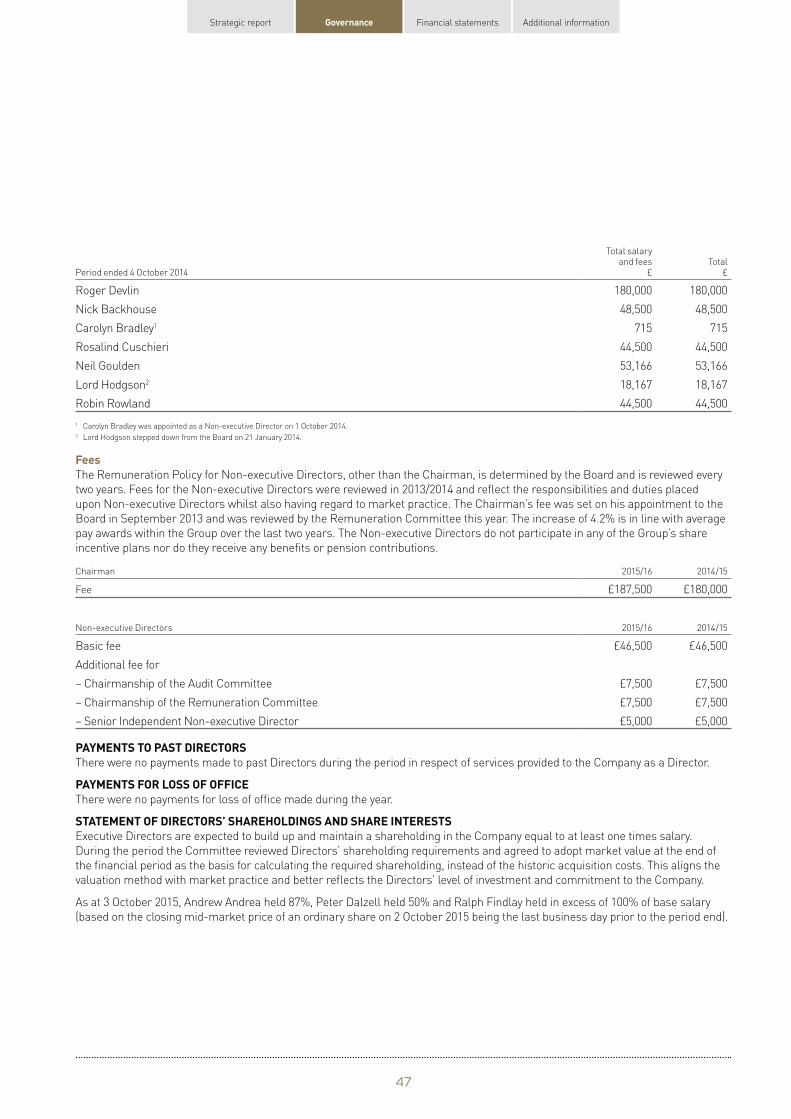
Strategic report Governance Financial statements Additional information
Total salary and fees Total
Period ended 4 October 2014 £ £
Roger Devlin 180,000 180,000
Nick Backhouse 48,500 48,500
Carolyn Bradley1 715 715
Rosalind Cuschieri 44,500 44,500
Neil Goulden 53,166 53,166
Lord Hodgson2 18,167 18,167
Robin Rowland 44,500 44,500
1 Carolyn Bradley was appointed as a Non-executive Director on 1 October 2014. 2 Lord Hodgson stepped down from the Board on 21 January 2014.
Fees The Remuneration Policy for Non-executive Directors, other than the Chairman, is determined by the Board and is reviewed every
two years. Fees for the Non-executive Directors were reviewed in 2013/2014 and reflect the responsibilities and duties placed
upon Non-executive Directors whilst also having regard to market practice. The Chairman’s fee was set on his appointment to the
Board in September 2013 and was reviewed by the Remuneration Committee this year. The increase of 4.2% is in line with average
pay awards within the Group over the last two years. The Non-executive Directors do not participate in any of the Group’s share
incentive plans nor do they receive any benefits or pension contributions.
Chairman 2015/16 2014/15
Fee £187,500 £180,000
Non-executive Directors 2015/16 2014/15
Basic fee £46,500 £46,500
Additional fee for
– Chairmanship of the Audit Committee £7,500 £7,500
– Chairmanship of the Remuneration Committee £7,500 £7,500
– Senior Independent Non-executive Director £5,000 £5,000
PAYMENTS TO PAST DIRECTORS There were no payments made to past Directors during the period in respect of services provided to the Company as a Director.
PAYMENTS FOR LOSS OF OFFICE There were no payments for loss of office made during the year.
STATEMENT OF DIRECTORS’ SHAREHOLDINGS AND SHARE INTERESTS Executive Directors are expected to build up and maintain a shareholding in the Company equal to at least one times salary.
During the period the Committee reviewed Directors’ shareholding requirements and agreed to adopt market value at the end of
the financial period as the basis for calculating the required shareholding, instead of the historic acquisition costs. This aligns the
valuation method with market practice and better reflects the Directors’ level of investment and commitment to the Company.
As at 3 October 2015, Andrew Andrea held 87%, Peter Dalzell held 50% and Ralph Findlay held in excess of 100% of base salary
(based on the closing mid-market price of an ordinary share on 2 October 2015 being the last business day prior to the period end).
47
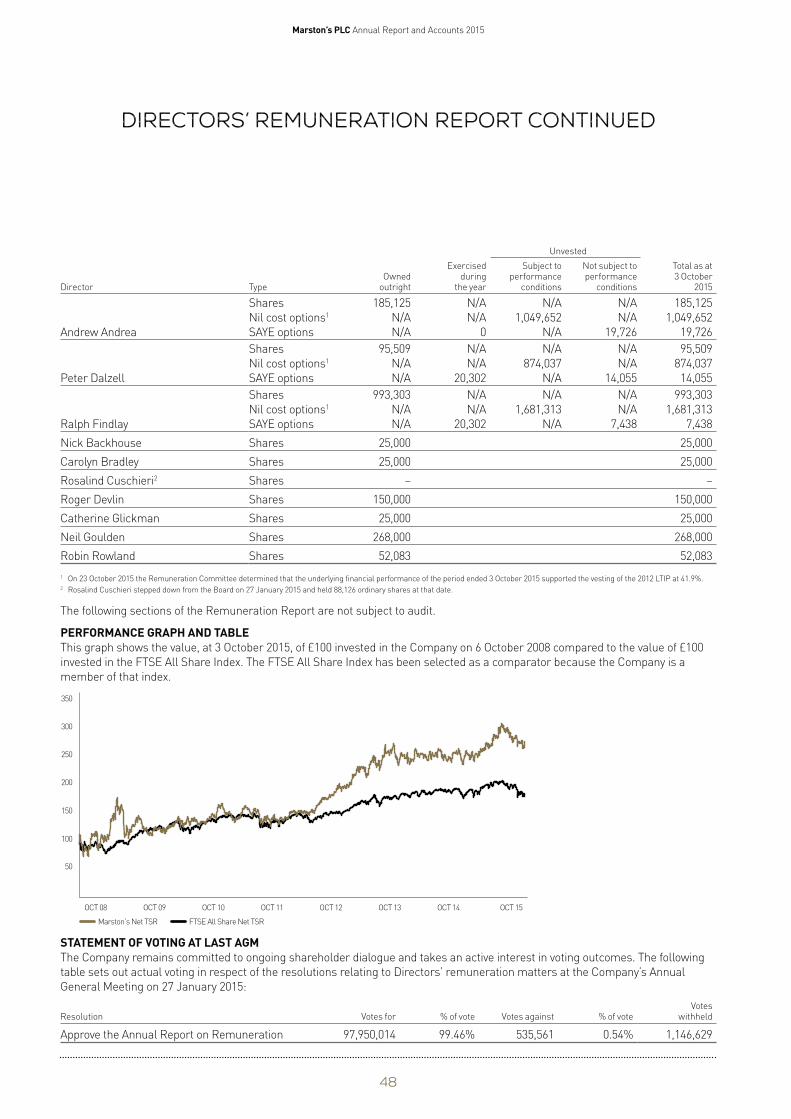
Marston’s PLC Annual Report and Accounts 2015
Directors’ Remuneration Report continued
Unvested
Exercised Subject to Not subject to Total as at Owned during performance performance 3 October
Director Type outright the year conditions conditions 2015
Shares 185,125 N/A N/A N/A 185,125
Nil cost options1 N/A N/A 1,049,652 N/A 1,049,652
Andrew Andrea SAYE options N/A 0 N/A 19,726 19,726
Shares 95,509 N/A N/A N/A 95,509
Nil cost options1 N/A N/A 874,037 N/A 874,037
Peter Dalzell SAYE options N/A 20,302 N/A 14,055 14,055
Shares 993,303 N/A N/A N/A 993,303
Nil cost options1 N/A N/A 1,681,313 N/A 1,681,313
Ralph Findlay SAYE options N/A 20,302 N/A 7,438 7,438
Nick Backhouse Shares 25,000 25,000
Carolyn Bradley Shares 25,000 25,000
Rosalind Cuschieri2 Shares – –
Roger Devlin Shares 150,000 150,000
Catherine Glickman Shares 25,000 25,000
Neil Goulden Shares 268,000 268,000
Robin Rowland Shares 52,083 52,083
1 On 23 October 2015 the Remuneration Committee determined that the underlying financial performance of the period ended 3 October 2015 supported the vesting of the 2012 LTIP at 41.9%. 2 Rosalind Cuschieri stepped down from the Board on 27 January 2015 and held 88,126 ordinary shares at that date.
The following sections of the Remuneration Report are not subject to audit.
PERFORMANCE GRAPH AND TABLE This graph shows the value, at 3 October 2015, of £100 invested in the Company on 6 October 2008 compared to the value of £100
invested in the FTSE All Share Index. The FTSE All Share Index has been selected as a comparator because the Company is a
member of that index.
350
300
250
200
150
100
50
OCT 08 OCT 09 OCT 10 OCT 11 OCT 12 OCT 13 OCT 14 OCT 15
Marston’s Net TSR FTSE All Share Net TSR
STATEMENT OF VOTING AT LAST AGM The Company remains committed to ongoing shareholder dialogue and takes an active interest in voting outcomes. The following
table sets out actual voting in respect of the resolutions relating to Directors’ remuneration matters at the Company’s Annual
General Meeting on 27 January 2015:
Votes Resolution Votes for % of vote Votes against % of vote withheld
Approve the Annual Report on Remuneration 97,950,014 99.46% 535,561 0.54% 1,146,629
48
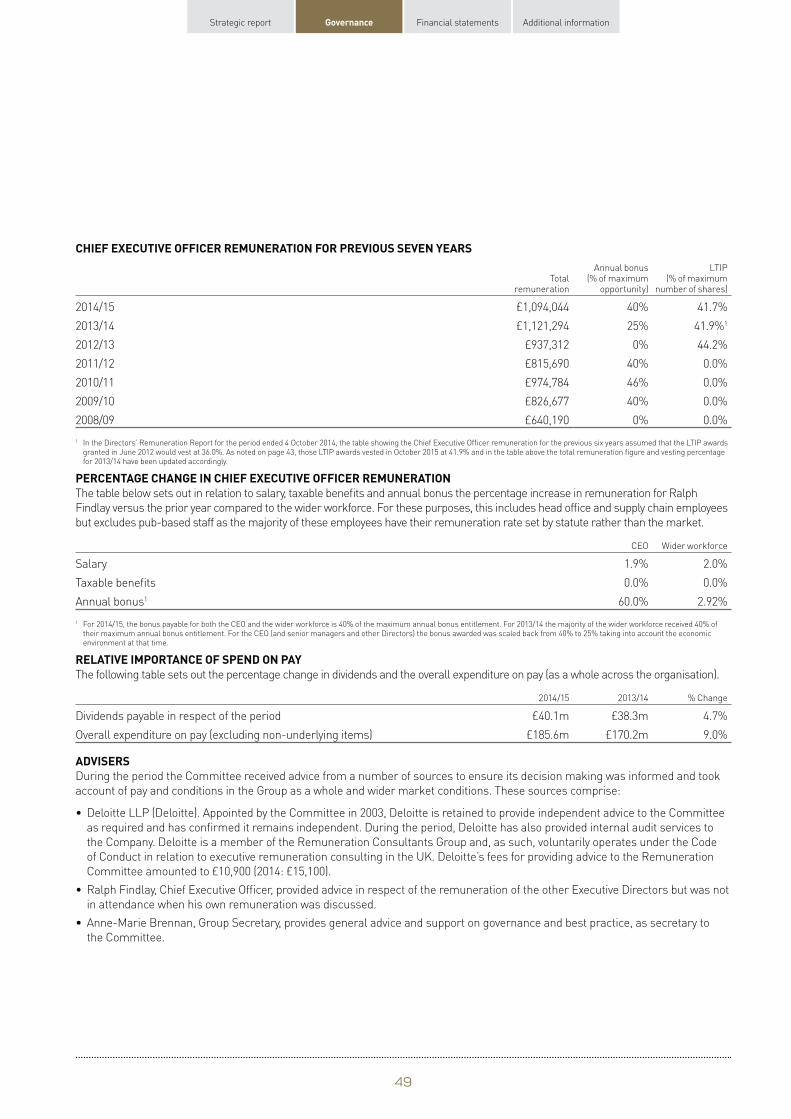
1
1
Strategic report Governance Financial statements Additional information
CHIEF EXECUTIVE OFFICER REMUNERATION FOR PREVIOUS SEVEN YEARS
Total remuneration
Annual bonus (% of maximum
opportunity)
LTIP (% of maximum
number of shares)
2014/15 £1,094,044 40% 41.7%
2013/14 £1,121,294 25% 41.9%1
2012/13 £937,312 0% 44.2%
2011/12 £815,690 40% 0.0%
2010/11 £974,784 46% 0.0%
2009/10 £826,677 40% 0.0%
2008/09 £640,190 0% 0.0%
In the Directors’ Remuneration Report for the period ended 4 October 2014, the table showing the Chief Executive Officer remuneration for the previous six years assumed that the LTIP awards granted in June 2012 would vest at 36.0%. As noted on page 43, those LTIP awards vested in October 2015 at 41.9% and in the table above the total remuneration figure and vesting percentage for 2013/14 have been updated accordingly.
PERCENTAGE CHANGE IN CHIEF EXECUTIVE OFFICER REMUNERATION The table below sets out in relation to salary, taxable benefits and annual bonus the percentage increase in remuneration for Ralph
Findlay versus the prior year compared to the wider workforce. For these purposes, this includes head office and supply chain employees
but excludes pub-based staff as the majority of these employees have their remuneration rate set by statute rather than the market.
CEO Wider workforce
Salary 1.9% 2.0%
Taxable benefits 0.0% 0.0%
Annual bonus1 60.0% 2.92%
For 2014/15, the bonus payable for both the CEO and the wider workforce is 40% of the maximum annual bonus entitlement. For 2013/14 the majority of the wider workforce received 40% of their maximum annual bonus entitlement. For the CEO (and senior managers and other Directors) the bonus awarded was scaled back from 40% to 25% taking into account the economic environment at that time.
RELATIVE IMPORTANCE OF SPEND ON PAY The following table sets out the percentage change in dividends and the overall expenditure on pay (as a whole across the organisation).
2014/15 2013/14 % Change
Dividends payable in respect of the period £40.1m £38.3m 4.7%
Overall expenditure on pay (excluding non-underlying items) £185.6m £170.2m 9.0%
ADVISERS During the period the Committee received advice from a number of sources to ensure its decision making was informed and took
account of pay and conditions in the Group as a whole and wider market conditions. These sources comprise:
• Deloitte LLP (Deloitte). Appointed by the Committee in 2003, Deloitte is retained to provide independent advice to the Committee
as required and has confirmed it remains independent. During the period, Deloitte has also provided internal audit services to
the Company. Deloitte is a member of the Remuneration Consultants Group and, as such, voluntarily operates under the Code
of Conduct in relation to executive remuneration consulting in the UK. Deloitte’s fees for providing advice to the Remuneration
Committee amounted to £10,900 (2014: £15,100).
• Ralph Findlay, Chief Executive Officer, provided advice in respect of the remuneration of the other Executive Directors but was not
in attendance when his own remuneration was discussed.
• Anne-Marie Brennan, Group Secretary, provides general advice and support on governance and best practice, as secretary to
the Committee.
49
Marston’s PLC Annual Report and Accounts 2015
Directors’ Remuneration Report continued
directors’ remuneration policy
This part of the report sets out the Company’s Directors’ Remuneration Policy which was approved by shareholders at the 2014
AGM. The policy came into effect on 5 October 2014. The policy is determined by the Company’s Remuneration Committee.
The policy is due to be reviewed by shareholders at the 2017 AGM.
base salary
Purpose and Core element of fixed remuneration, reflecting the size and scope of the role. link to strategy Purpose is to recruit and retain Directors of the calibre required for the business.
Operation Reviewed annually and usually fixed for 12 months commencing 1 October.
Whilst Executive Directors are contractually entitled to an annual review of their salary, there is no entitlement to an increase as a result of this review.
Salary levels are determined by the Committee taking into account a range of factors including:
• role, experience and performance;
• alignment with workforce;
• prevailing market conditions; and
• external benchmarks for similar roles at comparable companies.
Opportunity Salary increases are reviewed in the context of salary increases across the wider Group. The Committee considers any increase which is out of line with these very carefully and such increases may be awarded where there is a reason to do so taking into account relevant factors. These circumstances may include but are not limited to:
• increase in scope and responsibility;
• promotional increase to Executive Director; or
• a salary falling significantly below market positioning.
Performance metrics Not applicable, although the individual’s contribution and overall performance is one of the considerations in determining the level of any salary increase.
benefits
Purpose and Ensures the overall package is competitive. link to strategy Purpose is to recruit and retain Directors of the calibre required for the business.
Participation in the Save As You Earn scheme (SAYE) creates staff alignment with the Group and promotes a sense of ownership.
Operation Executive Directors receive benefits in line with market practice which include a car allowance, private medical insurance and life assurance.
The SAYE is an HMRC approved monthly savings scheme facilitating the purchase of shares at a discount.
Other benefits may be provided based on the role and individual circumstances. These may include, for example, relocation and travel allowances.
Opportunity Set at a level which the Committee considers appropriate against the market and provides a sufficient level of benefit based on individual circumstances.
SAYE contribution as permitted in accordance with the relevant tax legislation.
Performance metrics Not applicable.
50
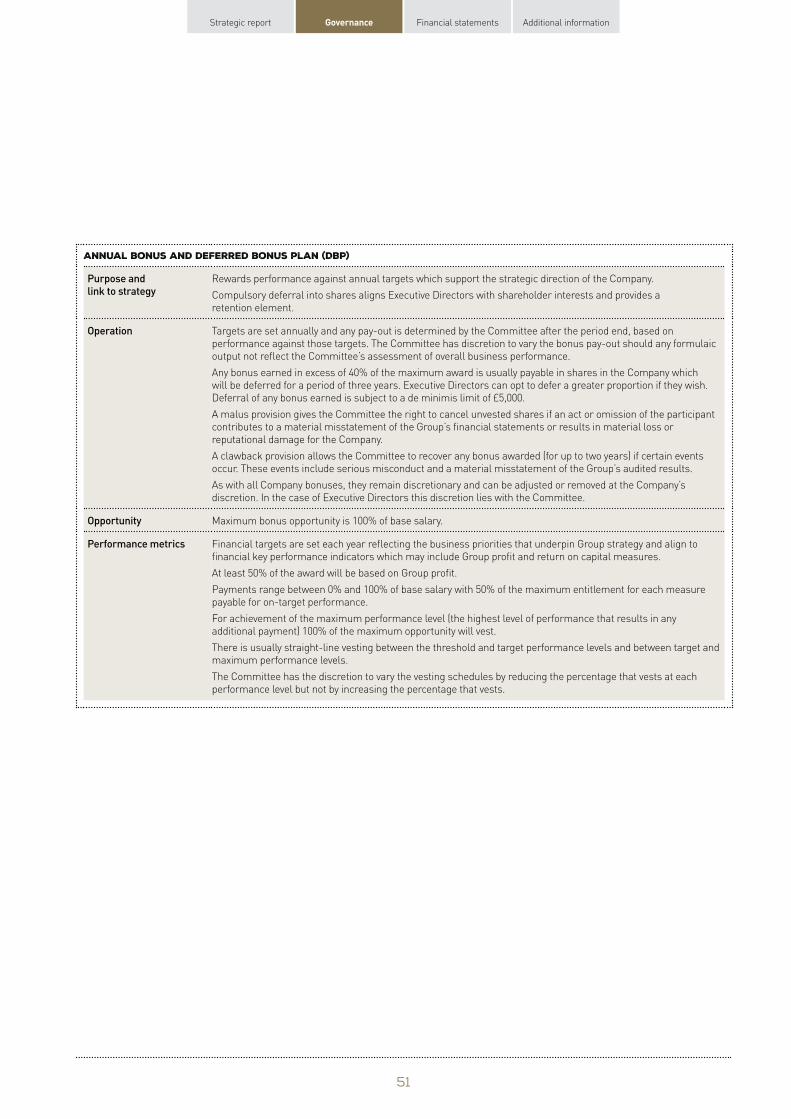
Strategic report Governance Financial statements Additional information
Annual bonus and deferred bonus plan (DBP)
Purpose and Rewards performance against annual targets which support the strategic direction of the Company. link to strategy Compulsory deferral into shares aligns Executive Directors with shareholder interests and provides a
retention element.
Operation Targets are set annually and any pay-out is determined by the Committee after the period end, based on performance against those targets. The Committee has discretion to vary the bonus pay-out should any formulaic output not reflect the Committee’s assessment of overall business performance.
Any bonus earned in excess of 40% of the maximum award is usually payable in shares in the Company which will be deferred for a period of three years. Executive Directors can opt to defer a greater proportion if they wish. Deferral of any bonus earned is subject to a de minimis limit of £5,000.
A malus provision gives the Committee the right to cancel unvested shares if an act or omission of the participant contributes to a material misstatement of the Group’s financial statements or results in material loss or reputational damage for the Company.
A clawback provision allows the Committee to recover any bonus awarded (for up to two years) if certain events occur. These events include serious misconduct and a material misstatement of the Group’s audited results.
As with all Company bonuses, they remain discretionary and can be adjusted or removed at the Company’s discretion. In the case of Executive Directors this discretion lies with the Committee.
Opportunity Maximum bonus opportunity is 100% of base salary.
Performance metrics Financial targets are set each year reflecting the business priorities that underpin Group strategy and align to financial key performance indicators which may include Group profit and return on capital measures.
At least 50% of the award will be based on Group profit.
Payments range between 0% and 100% of base salary with 50% of the maximum entitlement for each measure payable for on-target performance.
For achievement of the maximum performance level (the highest level of performance that results in any additional payment) 100% of the maximum opportunity will vest.
There is usually straight-line vesting between the threshold and target performance levels and between target and maximum performance levels.
The Committee has the discretion to vary the vesting schedules by reducing the percentage that vests at each performance level but not by increasing the percentage that vests.
51
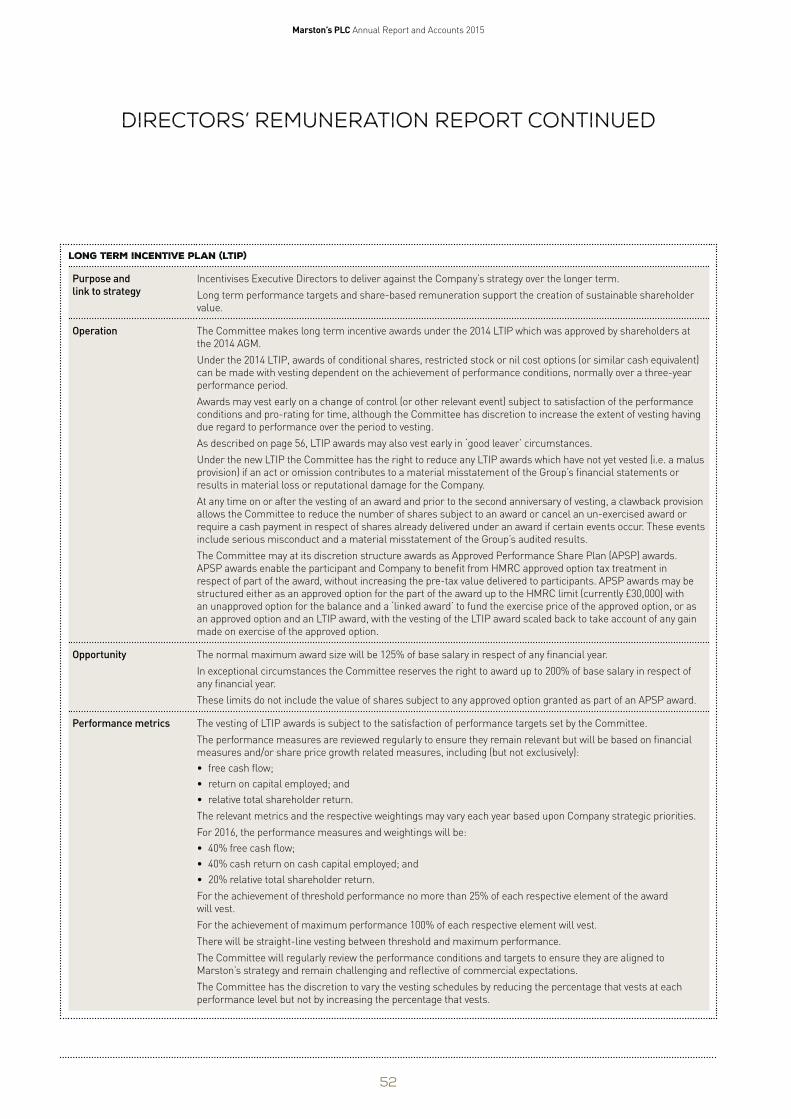
Marston’s PLC Annual Report and Accounts 2015
Directors’ Remuneration Report continued
Long term incentive plan (LTIP)
Purpose and Incentivises Executive Directors to deliver against the Company’s strategy over the longer term. link to strategy Long term performance targets and share-based remuneration support the creation of sustainable shareholder
value.
Operation The Committee makes long term incentive awards under the 2014 LTIP which was approved by shareholders at the 2014 AGM.
Under the 2014 LTIP, awards of conditional shares, restricted stock or nil cost options (or similar cash equivalent) can be made with vesting dependent on the achievement of performance conditions, normally over a three-year performance period.
Awards may vest early on a change of control (or other relevant event) subject to satisfaction of the performance conditions and pro-rating for time, although the Committee has discretion to increase the extent of vesting having due regard to performance over the period to vesting.
As described on page 56, LTIP awards may also vest early in ‘good leaver’ circumstances.
Under the new LTIP the Committee has the right to reduce any LTIP awards which have not yet vested (i.e. a malus provision) if an act or omission contributes to a material misstatement of the Group’s financial statements or results in material loss or reputational damage for the Company.
At any time on or after the vesting of an award and prior to the second anniversary of vesting, a clawback provision allows the Committee to reduce the number of shares subject to an award or cancel an un-exercised award or require a cash payment in respect of shares already delivered under an award if certain events occur. These events include serious misconduct and a material misstatement of the Group’s audited results.
The Committee may at its discretion structure awards as Approved Performance Share Plan (APSP) awards. APSP awards enable the participant and Company to benefit from HMRC approved option tax treatment in respect of part of the award, without increasing the pre-tax value delivered to participants. APSP awards may be structured either as an approved option for the part of the award up to the HMRC limit (currently £30,000) with an unapproved option for the balance and a ‘linked award’ to fund the exercise price of the approved option, or as an approved option and an LTIP award, with the vesting of the LTIP award scaled back to take account of any gain made on exercise of the approved option.
Opportunity The normal maximum award size will be 125% of base salary in respect of any financial year.
In exceptional circumstances the Committee reserves the right to award up to 200% of base salary in respect of any financial year.
These limits do not include the value of shares subject to any approved option granted as part of an APSP award.
Performance metrics The vesting of LTIP awards is subject to the satisfaction of performance targets set by the Committee.
The performance measures are reviewed regularly to ensure they remain relevant but will be based on financial measures and/or share price growth related measures, including (but not exclusively):
• free cash flow;
• return on capital employed; and
• relative total shareholder return.
The relevant metrics and the respective weightings may vary each year based upon Company strategic priorities.
For 2016, the performance measures and weightings will be:
• 40% free cash flow;
• 40% cash return on cash capital employed; and
• 20% relative total shareholder return.
For the achievement of threshold performance no more than 25% of each respective element of the award will vest.
For the achievement of maximum performance 100% of each respective element will vest.
There will be straight-line vesting between threshold and maximum performance.
The Committee will regularly review the performance conditions and targets to ensure they are aligned to Marston’s strategy and remain challenging and reflective of commercial expectations.
The Committee has the discretion to vary the vesting schedules by reducing the percentage that vests at each performance level but not by increasing the percentage that vests.
52
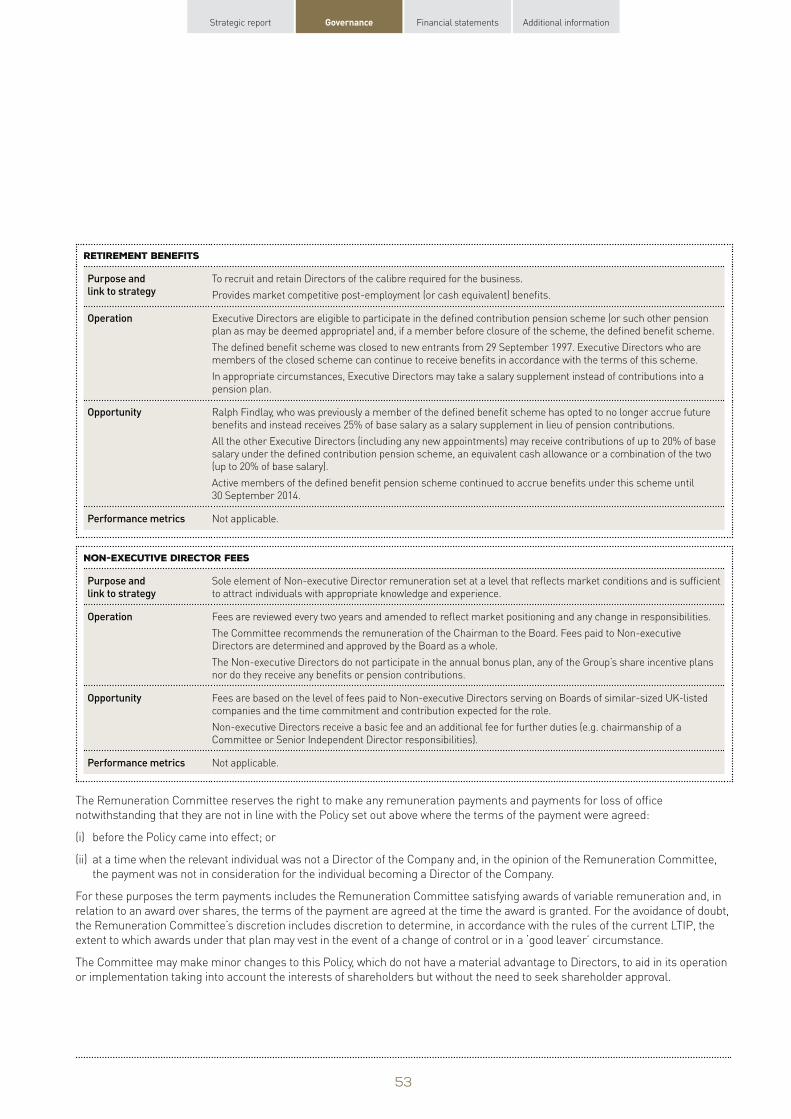
Strategic report Governance Financial statements Additional information
Retirement benefits
Purpose and To recruit and retain Directors of the calibre required for the business. link to strategy Provides market competitive post-employment (or cash equivalent) benefits.
Operation Executive Directors are eligible to participate in the defined contribution pension scheme (or such other pension plan as may be deemed appropriate) and, if a member before closure of the scheme, the defined benefit scheme.
The defined benefit scheme was closed to new entrants from 29 September 1997. Executive Directors who are members of the closed scheme can continue to receive benefits in accordance with the terms of this scheme.
In appropriate circumstances, Executive Directors may take a salary supplement instead of contributions into a pension plan.
Opportunity Ralph Findlay, who was previously a member of the defined benefit scheme has opted to no longer accrue future benefits and instead receives 25% of base salary as a salary supplement in lieu of pension contributions.
All the other Executive Directors (including any new appointments) may receive contributions of up to 20% of base salary under the defined contribution pension scheme, an equivalent cash allowance or a combination of the two (up to 20% of base salary).
Active members of the defined benefit pension scheme continued to accrue benefits under this scheme until 30 September 2014.
Performance metrics Not applicable.
Non-executive Director fees
Purpose and link to strategy
Sole element of Non-executive Director remuneration set at a level that reflects market conditions and is sufficient to attract individuals with appropriate knowledge and experience.
Operation Fees are reviewed every two years and amended to reflect market positioning and any change in responsibilities.
The Committee recommends the remuneration of the Chairman to the Board. Fees paid to Non-executive Directors are determined and approved by the Board as a whole.
The Non-executive Directors do not participate in the annual bonus plan, any of the Group’s share incentive plans nor do they receive any benefits or pension contributions.
Opportunity Fees are based on the level of fees paid to Non-executive Directors serving on Boards of similar-sized UK-listed companies and the time commitment and contribution expected for the role.
Non-executive Directors receive a basic fee and an additional fee for further duties (e.g. chairmanship of a Committee or Senior Independent Director responsibilities).
Performance metrics Not applicable.
The Remuneration Committee reserves the right to make any remuneration payments and payments for loss of office
notwithstanding that they are not in line with the Policy set out above where the terms of the payment were agreed:
(i) before the Policy came into effect; or
(ii) at a time when the relevant individual was not a Director of the Company and, in the opinion of the Remuneration Committee,
the payment was not in consideration for the individual becoming a Director of the Company.
For these purposes the term payments includes the Remuneration Committee satisfying awards of variable remuneration and, in
relation to an award over shares, the terms of the payment are agreed at the time the award is granted. For the avoidance of doubt,
the Remuneration Committee’s discretion includes discretion to determine, in accordance with the rules of the current LTIP, the
extent to which awards under that plan may vest in the event of a change of control or in a ‘good leaver’ circumstance.
The Committee may make minor changes to this Policy, which do not have a material advantage to Directors, to aid in its operation
or implementation taking into account the interests of shareholders but without the need to seek shareholder approval.
53
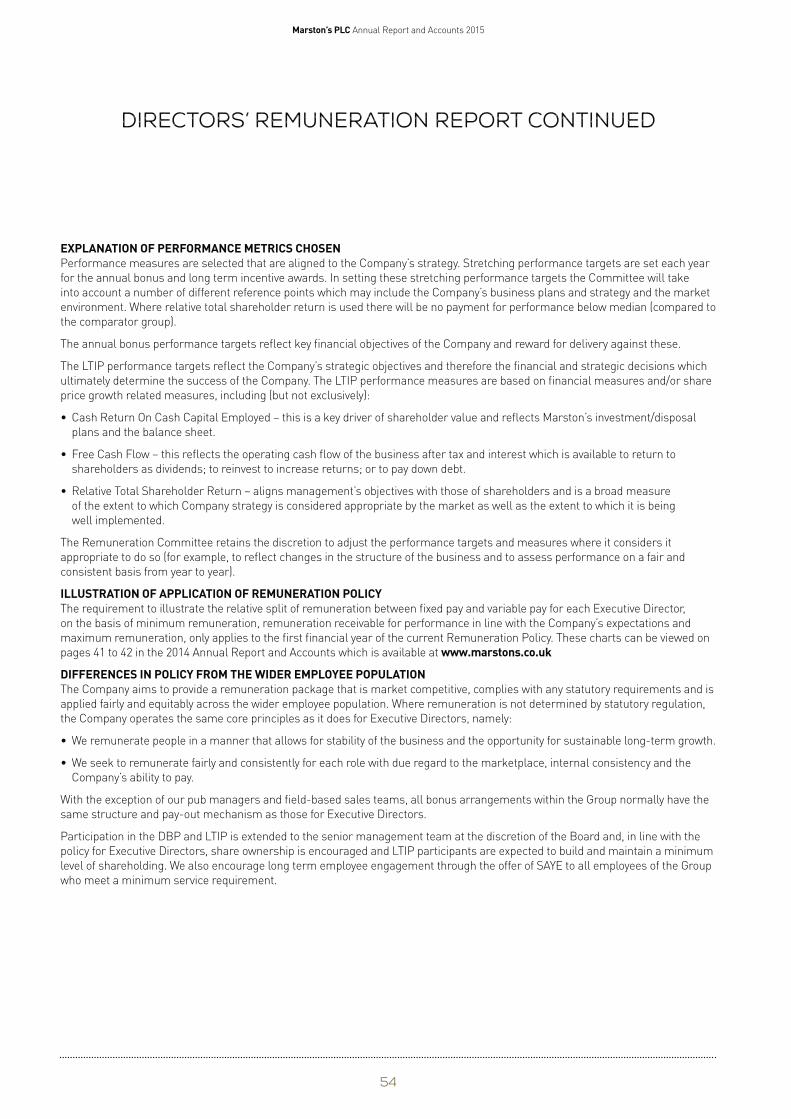
Marston’s PLC Annual Report and Accounts 2015
Directors’ Remuneration Report continued
EXPLANATION OF PERFORMANCE METRICS CHOSEN Performance measures are selected that are aligned to the Company’s strategy. Stretching performance targets are set each year
for the annual bonus and long term incentive awards. In setting these stretching performance targets the Committee will take
into account a number of different reference points which may include the Company’s business plans and strategy and the market
environment. Where relative total shareholder return is used there will be no payment for performance below median (compared to
the comparator group).
The annual bonus performance targets reflect key financial objectives of the Company and reward for delivery against these.
The LTIP performance targets reflect the Company’s strategic objectives and therefore the financial and strategic decisions which
ultimately determine the success of the Company. The LTIP performance measures are based on financial measures and/or share
price growth related measures, including (but not exclusively):
• Cash Return On Cash Capital Employed – this is a key driver of shareholder value and reflects Marston’s investment/disposal
plans and the balance sheet.
• Free Cash Flow – this reflects the operating cash flow of the business after tax and interest which is available to return to
shareholders as dividends; to reinvest to increase returns; or to pay down debt.
• Relative Total Shareholder Return – aligns management’s objectives with those of shareholders and is a broad measure
of the extent to which Company strategy is considered appropriate by the market as well as the extent to which it is being
well implemented.
The Remuneration Committee retains the discretion to adjust the performance targets and measures where it considers it
appropriate to do so (for example, to reflect changes in the structure of the business and to assess performance on a fair and
consistent basis from year to year).
ILLUSTRATION OF APPLICATION OF REMUNERATION POLICY The requirement to illustrate the relative split of remuneration between fixed pay and variable pay for each Executive Director,
on the basis of minimum remuneration, remuneration receivable for performance in line with the Company’s expectations and
maximum remuneration, only applies to the first financial year of the current Remuneration Policy. These charts can be viewed on
pages 41 to 42 in the 2014 Annual Report and Accounts which is available at www.marstons.co.uk
DIFFERENCES IN POLICY FROM THE WIDER EMPLOYEE POPULATION The Company aims to provide a remuneration package that is market competitive, complies with any statutory requirements and is
applied fairly and equitably across the wider employee population. Where remuneration is not determined by statutory regulation,
the Company operates the same core principles as it does for Executive Directors, namely:
• We remunerate people in a manner that allows for stability of the business and the opportunity for sustainable long-term growth.
• We seek to remunerate fairly and consistently for each role with due regard to the marketplace, internal consistency and the
Company’s ability to pay.
With the exception of our pub managers and field-based sales teams, all bonus arrangements within the Group normally have the
same structure and pay-out mechanism as those for Executive Directors.
Participation in the DBP and LTIP is extended to the senior management team at the discretion of the Board and, in line with the
policy for Executive Directors, share ownership is encouraged and LTIP participants are expected to build and maintain a minimum
level of shareholding. We also encourage long term employee engagement through the offer of SAYE to all employees of the Group
who meet a minimum service requirement.
54
Strategic report Governance Financial statements Additional information
RECRUITMENT REMUNERATION POLICY When hiring a new Executive Director, the Committee will typically seek to use the Policy detailed in the table above to determine
the Executive Director’s ongoing remuneration package. To facilitate the hiring of candidates of the appropriate calibre required
to implement the Group’s strategy, the Committee also retains the discretion to include any other remuneration component or
award which is outside the Policy. In determining appropriate remuneration, the Committee will take into consideration all relevant
factors (including the quantum and nature of remuneration) to ensure the arrangements are in the best interests of Marston’s and
its shareholders.
The Committee may make an award to buy out incentive arrangements forfeited on leaving a previous employer. In doing so
the Committee will take account of relevant factors including the form of award, any performance conditions attached to these
awards and the time over which they would have vested. The Committee would seek to incorporate buy-out awards in line with the
Company’s remuneration framework as far as is practical. The Committee may consider other components for structuring the
buy-out, including cash or shares awards, restricted stock awards and share options where there is a commercial rationale for
doing so.
Appropriate costs and support will be covered if the recruitment requires relocation of the individual.
All recruitment awards will normally be liable to forfeiture or clawback on early departure. For Executive Directors, early departure
is defined as being within the first two years of employment.
The maximum level of variable remuneration which may be granted (excluding buy-out arrangements) is three times salary.
The Committee will ensure that such awards are linked to the achievement of appropriate and challenging performance measures
and will be forfeited if performance or continued employment conditions are not met.
SERVICE CONTRACTS AND POLICY ON PAYMENT FOR LOSS OF OFFICE Executive Directors’ contracts are on a rolling 12 month basis and are subject to 12 months’ notice when terminated by the
Company and six months’ notice when terminated by the Director. The Committee may, in exceptional circumstances, in order
to attract and retain suitable executives, offer service contracts with up to an initial 24 month notice period which then reduce to
12 months at the end of this initial period.
The current Non-executive Directors, including the Chairman, do not have a service contract and their appointments, whilst for a
term of three years, may be terminated without compensation at any time. All Non-executive Directors have letters of appointment
and their appointment and subsequent re-appointment is subject to annual approval by shareholders.
55
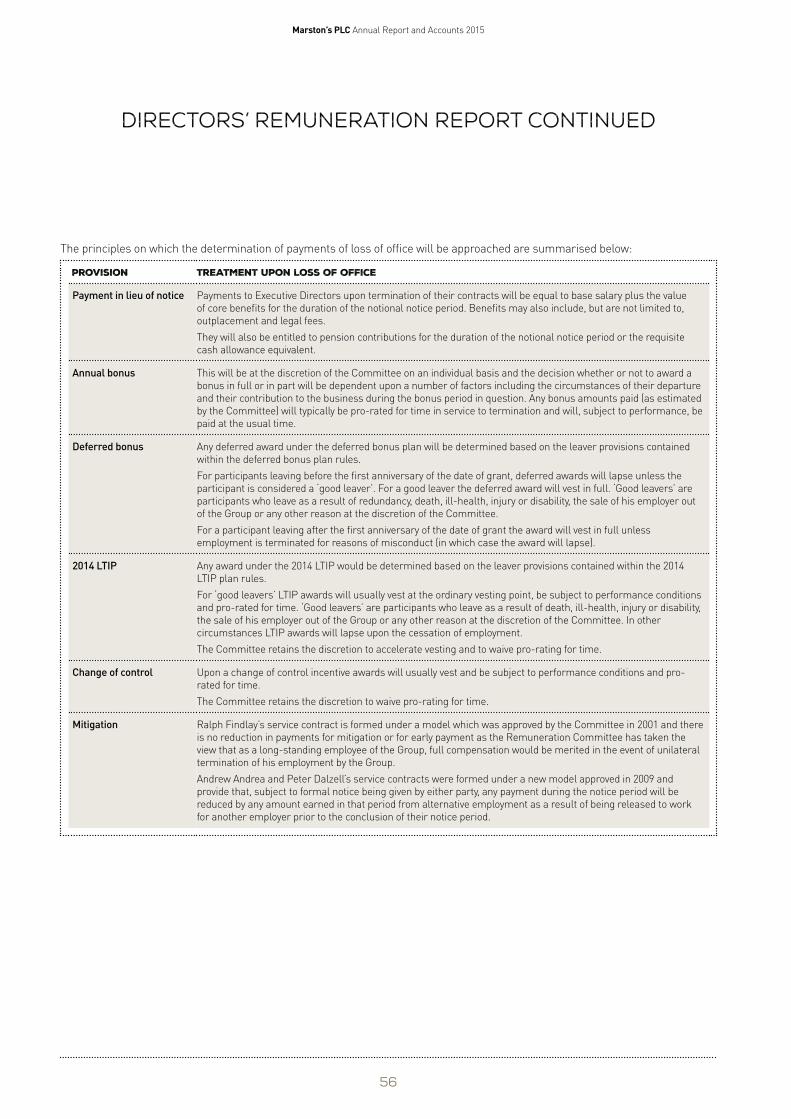
Marston’s PLC Annual Report and Accounts 2015
Directors’ Remuneration Report continued
The principles on which the determination of payments of loss of office will be approached are summarised below:
provision treatment upon loss of office
Payment in lieu of notice Payments to Executive Directors upon termination of their contracts will be equal to base salary plus the value of core benefits for the duration of the notional notice period. Benefits may also include, but are not limited to, outplacement and legal fees.
They will also be entitled to pension contributions for the duration of the notional notice period or the requisite cash allowance equivalent.
Annual bonus This will be at the discretion of the Committee on an individual basis and the decision whether or not to award a bonus in full or in part will be dependent upon a number of factors including the circumstances of their departure and their contribution to the business during the bonus period in question. Any bonus amounts paid (as estimated by the Committee) will typically be pro-rated for time in service to termination and will, subject to performance, be paid at the usual time.
Deferred bonus Any deferred award under the deferred bonus plan will be determined based on the leaver provisions contained within the deferred bonus plan rules.
For participants leaving before the first anniversary of the date of grant, deferred awards will lapse unless the participant is considered a ‘good leaver’. For a good leaver the deferred award will vest in full. ‘Good leavers’ are participants who leave as a result of redundancy, death, ill-health, injury or disability, the sale of his employer out of the Group or any other reason at the discretion of the Committee.
For a participant leaving after the first anniversary of the date of grant the award will vest in full unless employment is terminated for reasons of misconduct (in which case the award will lapse).
2014 LTIP Any award under the 2014 LTIP would be determined based on the leaver provisions contained within the 2014 LTIP plan rules.
For ‘good leavers’ LTIP awards will usually vest at the ordinary vesting point, be subject to performance conditions and pro-rated for time. ‘Good leavers’ are participants who leave as a result of death, ill-health, injury or disability, the sale of his employer out of the Group or any other reason at the discretion of the Committee. In other circumstances LTIP awards will lapse upon the cessation of employment.
The Committee retains the discretion to accelerate vesting and to waive pro-rating for time.
Change of control Upon a change of control incentive awards will usually vest and be subject to performance conditions and prorated for time.
The Committee retains the discretion to waive pro-rating for time.
Mitigation Ralph Findlay’s service contract is formed under a model which was approved by the Committee in 2001 and there is no reduction in payments for mitigation or for early payment as the Remuneration Committee has taken the view that as a long-standing employee of the Group, full compensation would be merited in the event of unilateral termination of his employment by the Group.
Andrew Andrea and Peter Dalzell’s service contracts were formed under a new model approved in 2009 and provide that, subject to formal notice being given by either party, any payment during the notice period will be reduced by any amount earned in that period from alternative employment as a result of being released to work for another employer prior to the conclusion of their notice period.
56
Strategic report Governance Financial statements Additional information
STATEMENT OF CONSIDERATION OF EMPLOYMENT CONDITIONS ELSEWHERE IN THE COMPANY Salary, benefits and performance related rewards provided to employees are taken into account when setting policy for
Executive Directors’ remuneration. Although employees are not actively consulted on Directors’ remuneration the Company
has regular contact with union bodies on matters of pay and remuneration for employees covered by collective bargaining or
consultation arrangements.
In October of each year a paper is submitted to the Remuneration Committee by the Group People Director summarising the
outcome of any annual reviews made to the wider workforce (including head office and supply chain employees but excluding
pub-based staff as the majority of these employees have their remuneration rate set by statute rather than the market).
This paper is taken into account when setting Executive Directors’ remuneration effective from the start of October for the
following 12 months. In addition, and where relevant, a similar paper is submitted in October covering the decisions taken by the
Executive Committee relating to bonus payments for employees within the wider workforce. This is taken into consideration by the
Remuneration Committee when approving bonus awards for Executive Directors.
STATEMENT OF CONSIDERATION OF SHAREHOLDER VIEWS The Committee is committed to open and transparent dialogue with shareholders and welcomes feedback on Executive and
Non-executive Directors’ remuneration.
Prior to the 2014 LTIP being formally put to shareholders, the Committee held an open dialogue with major shareholders and
institutional investor bodies setting out the proposals and the detailed thinking and planning behind them.
This report was approved by the Board and signed on its behalf by
Neil Goulden Chairman of the Remuneration Committee
26 November 2015
57
Marston’s PLC Annual Report and Accounts 2015
Other Statutory Information
This section contains additional information which the Directors are required by law and regulation to include within the Annual
Report and Accounts. This section along with the information from the Chairman’s Statement on page 4 to the Statement of
Directors’ Responsibilities on page 62 constitutes the Directors’ Report in accordance with the Companies Act 2006.
STRATEGIC REPORT The Company is required by the Companies Act to include a Strategic Report in this document. The information that fulfils the
requirements of the Strategic Report can be found on pages 1 to 26, which are incorporated in this report by reference.
CORPORATE GOVERNANCE STATEMENT The corporate governance statement as required by the Financial Conduct Authority’s Disclosure and Transparency Rules (DTR)
7.2.1 is set out on pages 28 to 38 and is incorporated into this report by reference.
RESEARCH AND DEVELOPMENT In-house research and development is undertaken alongside work with the British Beer and Pub Association (BBPA) and Brewing
Research International.
CAPITAL STRUCTURE Details of the Company’s issued share capital and of the movements during the period are shown in note 27 to the financial
statements on page 107. The Company has one class of ordinary shares and one class of preference shares. On a poll vote,
ordinary and preference shareholders have one vote for every 25 pence of nominal value of ordinary and preference share capital
held in relation to all circumstances at general meetings of the Company. The issued nominal value of the ordinary shares and
preference shares is 100% of the total issued nominal value of all share capital.
There are no specific restrictions on the size of a holding nor on the transfer of shares, which are both governed by the general
provisions of the Articles of Association and prevailing legislation. The Directors are not aware of any agreements between holders
of the Company’s shares that may result in restrictions on the transfer of securities or on voting rights.
Details of employee share schemes are set out in note 26 to the financial statements on pages 106 to 107. Where shares are held
on behalf of the Company’s share schemes, the trustees have waived their right to vote and to dividends.
No person has any special rights of control over the Company’s share capital and all issued shares are fully paid.
Under the Articles of Association, the Directors have authority to allot ordinary shares subject to the aggregate set at the 2015
Annual General Meeting (AGM). The Company was also given authority at its 2015 AGM to make market purchases of ordinary
shares up to a maximum number of 57,314,054 shares. Similar authority will again be sought from shareholders at the 2016 AGM.
With regard to the appointment and replacement of Directors, the Company is governed by its Articles of Association, the UK
Corporate Governance Code, the Companies Act 2006 and related legislation. The Articles may be amended by special resolution of
the shareholders. The powers of the Directors are further described in the Corporate Governance Report on pages 28 to 38.
CHANGE OF CONTROL There are a number of agreements that take effect after, or terminate upon, a change of control of the Company, such as
commercial contracts, bank loan agreements, property lease arrangements and employee share plans. None of these are
considered to be significant in terms of their likely impact on the business as a whole. Furthermore, the Directors are not aware
of any agreements between the Company and its Directors or employees that provide for compensation for loss of office or
employment that occurs because of a takeover bid.
MAJOR INTEREST IN COMPANY’S SHARES Notifications of the following voting interests in the Company’s ordinary share capital had been received by the Company (in
accordance with Chapter 5 of the DTR. The information shown below was correct at the time of disclosure. However, the date
received may not have been within the current financial reporting period and the percentages shown (as provided at the time of
disclosure) have not been re-calculated based on the issued share capital at the period end. It should also be noted that these
holdings may have changed since the Company was notified, however, notification of any change is not required until the next
notifiable threshold is crossed.
No further notifications have been received by the Company between 3 October 2015 and 23 November 2015 (being the latest
practical date prior to the date of this report).
58
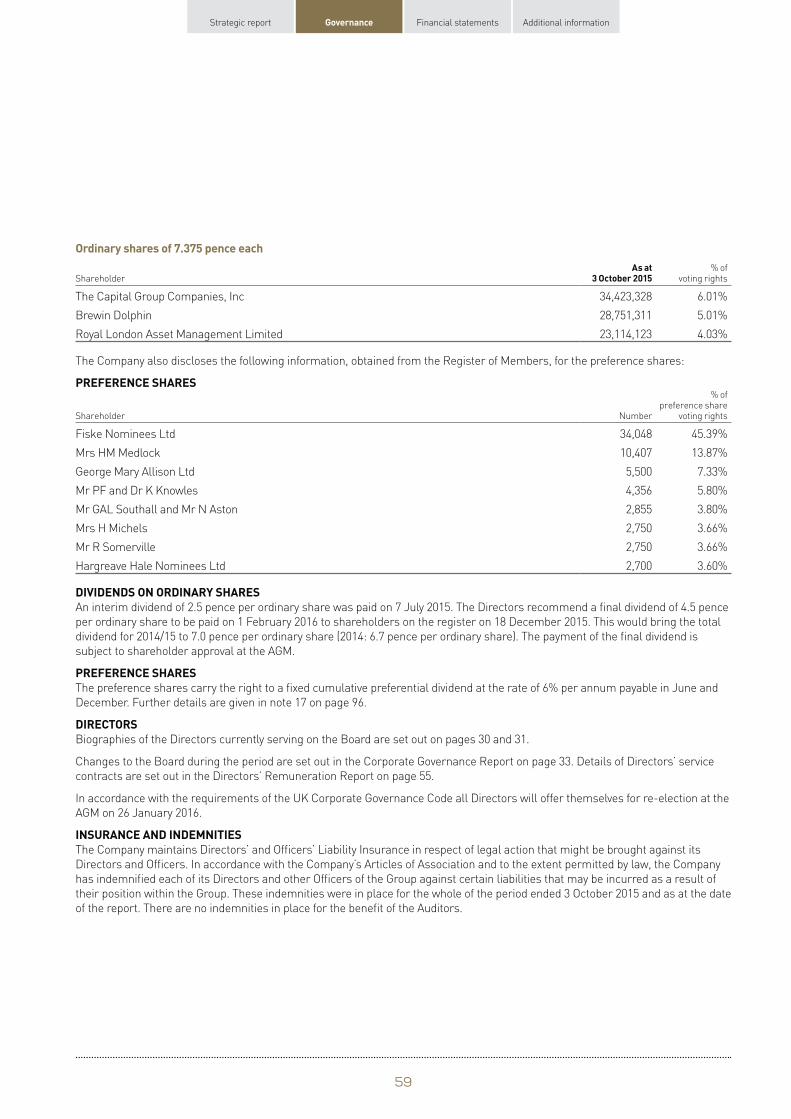
Strategic report Governance Financial statements Additional information
Ordinary shares of 7.375 pence each As at % of
Shareholder 3 October 2015 voting rights
The Capital Group Companies, Inc 34,423,328 6.01%
Brewin Dolphin 28,751,311 5.01%
Royal London Asset Management Limited 23,114,123 4.03%
The Company also discloses the following information, obtained from the Register of Members, for the preference shares:
PREFERENCE SHARES % of
preference share Shareholder Number voting rights
Fiske Nominees Ltd 34,048 45.39%
Mrs HM Medlock 10,407 13.87%
George Mary Allison Ltd 5,500 7.33%
Mr PF and Dr K Knowles 4,356 5.80%
Mr GAL Southall and Mr N Aston 2,855 3.80%
Mrs H Michels 2,750 3.66%
Mr R Somerville 2,750 3.66%
Hargreave Hale Nominees Ltd 2,700 3.60%
DIVIDENDS ON ORDINARY SHARES An interim dividend of 2.5 pence per ordinary share was paid on 7 July 2015. The Directors recommend a final dividend of 4.5 pence
per ordinary share to be paid on 1 February 2016 to shareholders on the register on 18 December 2015. This would bring the total
dividend for 2014/15 to 7.0 pence per ordinary share (2014: 6.7 pence per ordinary share). The payment of the final dividend is
subject to shareholder approval at the AGM.
PREFERENCE SHARES The preference shares carry the right to a fixed cumulative preferential dividend at the rate of 6% per annum payable in June and
December. Further details are given in note 17 on page 96.
DIRECTORS Biographies of the Directors currently serving on the Board are set out on pages 30 and 31.
Changes to the Board during the period are set out in the Corporate Governance Report on page 33. Details of Directors’ service
contracts are set out in the Directors’ Remuneration Report on page 55.
In accordance with the requirements of the UK Corporate Governance Code all Directors will offer themselves for re-election at the
AGM on 26 January 2016.
INSURANCE AND INDEMNITIES The Company maintains Directors’ and Officers’ Liability Insurance in respect of legal action that might be brought against its
Directors and Officers. In accordance with the Company’s Articles of Association and to the extent permitted by law, the Company
has indemnified each of its Directors and other Officers of the Group against certain liabilities that may be incurred as a result of
their position within the Group. These indemnities were in place for the whole of the period ended 3 October 2015 and as at the date
of the report. There are no indemnities in place for the benefit of the Auditors.
59
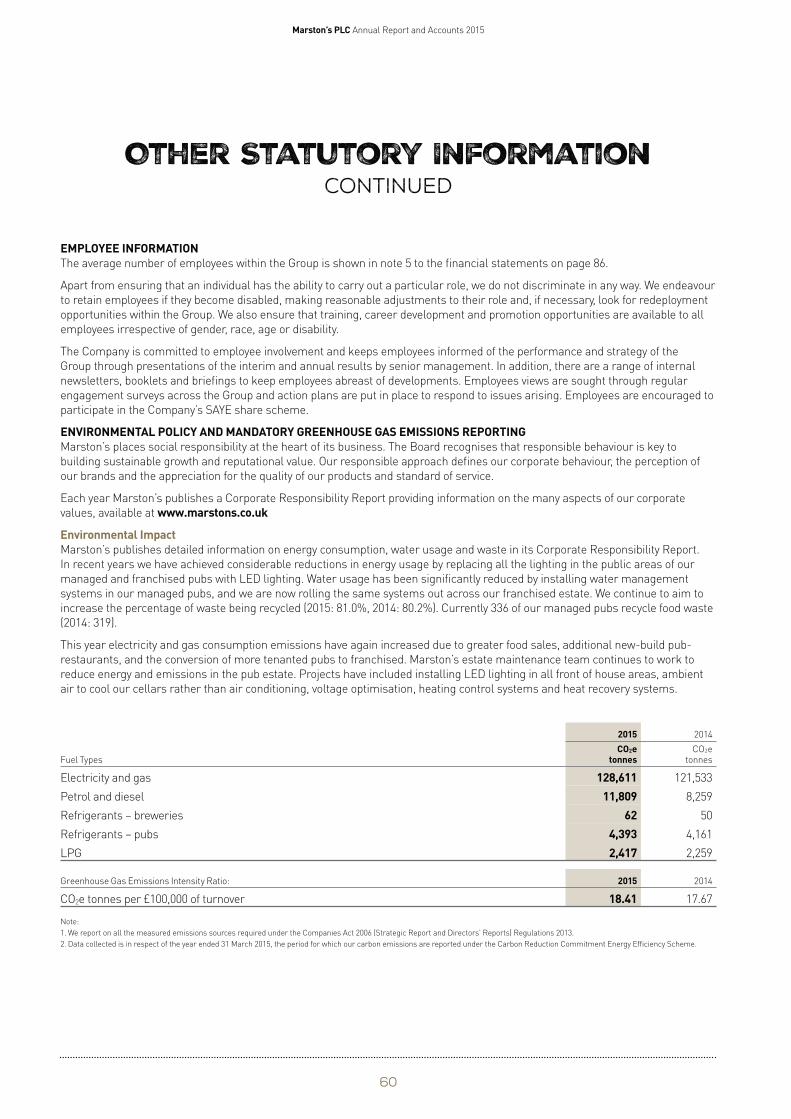
Marston’s PLC Annual Report and Accounts 2015
Other Statutory Information continued
EMPLOYEE INFORMATION The average number of employees within the Group is shown in note 5 to the financial statements on page 86.
Apart from ensuring that an individual has the ability to carry out a particular role, we do not discriminate in any way. We endeavour
to retain employees if they become disabled, making reasonable adjustments to their role and, if necessary, look for redeployment
opportunities within the Group. We also ensure that training, career development and promotion opportunities are available to all
employees irrespective of gender, race, age or disability.
The Company is committed to employee involvement and keeps employees informed of the performance and strategy of the
Group through presentations of the interim and annual results by senior management. In addition, there are a range of internal
newsletters, booklets and briefings to keep employees abreast of developments. Employees views are sought through regular
engagement surveys across the Group and action plans are put in place to respond to issues arising. Employees are encouraged to
participate in the Company’s SAYE share scheme.
ENVIRONMENTAL POLICY AND MANDATORY GREENHOUSE GAS EMISSIONS REPORTING Marston’s places social responsibility at the heart of its business. The Board recognises that responsible behaviour is key to
building sustainable growth and reputational value. Our responsible approach defines our corporate behaviour, the perception of
our brands and the appreciation for the quality of our products and standard of service.
Each year Marston’s publishes a Corporate Responsibility Report providing information on the many aspects of our corporate
values, available at www.marstons.co.uk
Environmental Impact Marston’s publishes detailed information on energy consumption, water usage and waste in its Corporate Responsibility Report.
In recent years we have achieved considerable reductions in energy usage by replacing all the lighting in the public areas of our
managed and franchised pubs with LED lighting. Water usage has been significantly reduced by installing water management
systems in our managed pubs, and we are now rolling the same systems out across our franchised estate. We continue to aim to
increase the percentage of waste being recycled (2015: 81.0%, 2014: 80.2%). Currently 336 of our managed pubs recycle food waste
(2014: 319).
This year electricity and gas consumption emissions have again increased due to greater food sales, additional new-build pub-
restaurants, and the conversion of more tenanted pubs to franchised. Marston’s estate maintenance team continues to work to
reduce energy and emissions in the pub estate. Projects have included installing LED lighting in all front of house areas, ambient
air to cool our cellars rather than air conditioning, voltage optimisation, heating control systems and heat recovery systems.
2015 2014
CO2e CO2e Fuel Types tonnes tonnes
Electricity and gas 128,611 121,533
Petrol and diesel 11,809 8,259
Refrigerants – breweries 62 50
Refrigerants – pubs 4,393 4,161
LPG 2,417 2,259
Greenhouse Gas Emissions Intensity Ratio: 2015 2014
CO2e tonnes per £100,000 of turnover 18.41 17.67
Note:
1. We report on all the measured emissions sources required under the Companies Act 2006 (Strategic Report and Directors’ Reports) Regulations 2013.
2. Data collected is in respect of the year ended 31 March 2015, the period for which our carbon emissions are reported under the Carbon Reduction Commitment Energy Efficiency Scheme.
60
Strategic report Governance Financial statements Additional information
POLITICAL DONATIONS Our policy is not to make any donations for political purposes in the UK or to donate to EU political parties or incur EU
political expenditure.
FINANCIAL INSTRUMENTS The disclosures required in relation to the use of financial instruments by the Group together with details of our treasury policy and
management are set out in note 20 to the financial statements on pages 98 to 101.
AUDITORS PricewaterhouseCoopers LLP have indicated their willingness to continue as Auditors and their re-appointment has been approved
by the Audit Committee. Resolutions to re-appoint them and to authorise the Directors to determine their remuneration will be
proposed at the 2016 AGM.
GOING CONCERN The Group’s business activities, together with the factors likely to affect its future development, performance and position are set
out in the Strategic Report. The financial position of the Group is described on pages 24 to 26. In addition, note 20 to the financial
statements on pages 98 to 101 includes the Group’s objectives, policies and processes for managing its exposures to interest rate
risk, foreign currency risk, counterparty risk, credit risk and liquidity risk. Details of the Group’s financial instruments and hedging
activities are also provided in note 20.
The Board has a reasonable expectation that the Group and the Company have adequate resources to continue in operational
existence for the foreseeable future. Accordingly, the financial statements set out on pages 69 to 112 and 115 to 124 have been
prepared on the going concern basis.
ANNUAL GENERAL MEETING The AGM of the Company will be held at Wolverhampton Wanderers Football Club, Molineux Stadium, Waterloo Road,
Wolverhampton WV1 4QR at 12 noon on 26 January 2016. The notice convening the meeting, together with details of the special
business to be considered and explanatory notes for each resolution, is distributed separately to shareholders. It is also available at
www.marstons.co.uk, where a copy can be viewed and downloaded.
By order of the Board
Anne-Marie Brennan Company Secretary
26 November 2015
61

Marston’s PLC Annual Report and Accounts 2015
Statement of directors’ responsibilities
The Directors are responsible for preparing the Annual Report, the Directors’ Remuneration Report and the financial statements in
accordance with applicable law and regulations.
Company law requires the Directors to prepare financial statements for each financial year. Under that law the Directors have
prepared the Group financial statements in accordance with International Financial Reporting Standards (IFRS) as adopted by
the European Union (EU), and the Parent Company financial statements in accordance with United Kingdom Generally Accepted
Accounting Practice (United Kingdom Accounting Standards and applicable law). Under company law the Directors must not
approve the financial statements unless they are satisfied that they give a true and fair view of the state of affairs of the Group
and the Company and of the profit or loss of the Group for that period. In preparing these financial statements, the Directors are
required to:
• select suitable accounting policies and then apply them consistently;
• make judgements and accounting estimates that are reasonable and prudent;
• state whether IFRS as adopted by the EU and applicable UK Accounting Standards have been followed, subject to any material
departures disclosed and explained in the Group and Parent Company financial statements respectively;
• prepare the financial statements on the going concern basis unless it is inappropriate to presume that the Company will
continue in business.
The Directors are responsible for keeping adequate accounting records that are sufficient to show and explain the Group’s and
Company’s transactions and disclose with reasonable accuracy at any time the financial position of the Company and the Group
and enable them to ensure that the financial statements and the Directors’ Remuneration Report comply with the Companies Act
2006 and, as regards the Group financial statements, Article 4 of the IAS Regulation. They are also responsible for safeguarding
the assets of the Company and the Group and hence for taking reasonable steps for the prevention and detection of fraud and
other irregularities.
The Directors are responsible for the maintenance and integrity of the Company’s website. Legislation in the United Kingdom
governing the preparation and dissemination of financial statements may differ from legislation in other jurisdictions.
The Directors consider that the Annual Report and Accounts, taken as a whole, is fair, balanced and understandable and provides
the information necessary for shareholders to assess the Group’s performance, business model and strategy.
Each of the Directors, whose names and functions are listed on page 30 to 31 confirm that, to the best of their knowledge:
• the Group financial statements, which have been prepared in accordance with IFRS as adopted by the EU, give a true and fair
view of the assets, liabilities, financial position and profit of the Group; and
• the Strategic Report together with the Other Statutory Information includes a fair review of the development and performance of
the business and the position of the Group, together with a description of the principal risks and uncertainties that it faces.
In accordance with Section 418, Companies Act 2006, Directors’ reports shall include a statement, in the case of each Director in
office at the date the Directors’ Report is approved, that:
(a) so far as the Director is aware, there is no relevant audit information of which the Company’s Auditors are unaware; and
(b) he/she has taken all the steps that he/she ought to have taken as a Director in order to make him/herself aware of any
relevant audit information and to establish that the Company’s Auditors are aware of that information.
Ralph Findlay Andrew Andrea Chief Executive Officer Chief Financial Officer
26 November 2015
62
Strategic report Governance Financial statements Additional information
in this section
Financial Statements
Independent Auditors’ Report 64 – 68 Group Accounts 69 – 73 Notes to Group Accounts 74 – 112 Independent Auditors’ Report 113 – 114 Company Balance Sheet 115 Notes to Company Accounts 116 – 124 Five Year Record 125
63
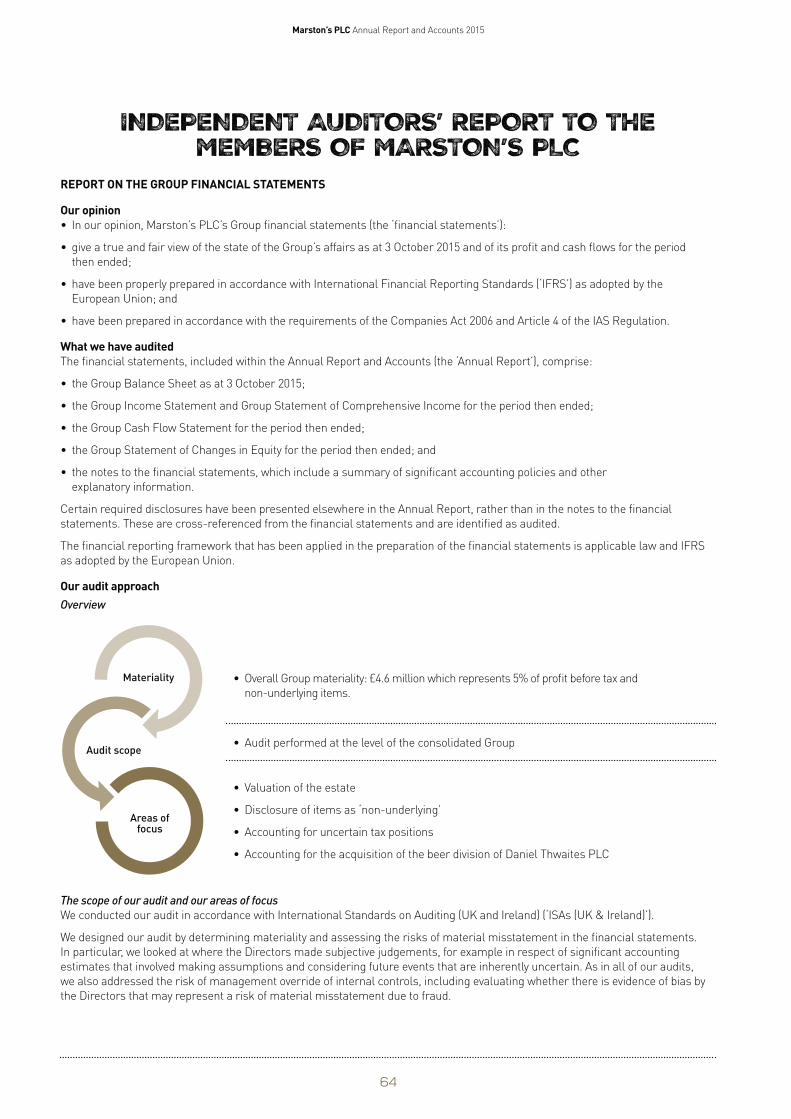
Marston’s PLC Annual Report and Accounts 2015
INDEPENDENT AUDITORS’ REPORT TO THE MEMBERS OF MARSTON’S PLC
REPORT ON THE GROUP FINANCIAL STATEMENTS
Our opinion • In our opinion, Marston’s PLC’s Group financial statements (the ‘financial statements’):
• give a true and fair view of the state of the Group’s affairs as at 3 October 2015 and of its profit and cash flows for the period
then ended;
• have been properly prepared in accordance with International Financial Reporting Standards (‘IFRS’) as adopted by the
European Union; and
• have been prepared in accordance with the requirements of the Companies Act 2006 and Article 4 of the IAS Regulation.
What we have audited The financial statements, included within the Annual Report and Accounts (the ‘Annual Report’), comprise:
• the Group Balance Sheet as at 3 October 2015;
• the Group Income Statement and Group Statement of Comprehensive Income for the period then ended;
• the Group Cash Flow Statement for the period then ended;
• the Group Statement of Changes in Equity for the period then ended; and
• the notes to the financial statements, which include a summary of significant accounting policies and other
explanatory information.
Certain required disclosures have been presented elsewhere in the Annual Report, rather than in the notes to the financial
statements. These are cross-referenced from the financial statements and are identified as audited.
The financial reporting framework that has been applied in the preparation of the financial statements is applicable law and IFRS
as adopted by the European Union.
Our audit approach Overview
Materiality
Audit scope
Areas of focus
• Overall Group materiality: £4.6 million which represents 5% of profit before tax and
non-underlying items.
• Audit performed at the level of the consolidated Group
• Valuation of the estate
• Disclosure of items as ‘non-underlying’
• Accounting for uncertain tax positions
• Accounting for the acquisition of the beer division of Daniel Thwaites PLC
The scope of our audit and our areas of focus
We conducted our audit in accordance with International Standards on Auditing (UK and Ireland) (‘ISAs (UK & Ireland)’).
We designed our audit by determining materiality and assessing the risks of material misstatement in the financial statements.
In particular, we looked at where the Directors made subjective judgements, for example in respect of significant accounting
estimates that involved making assumptions and considering future events that are inherently uncertain. As in all of our audits,
we also addressed the risk of management override of internal controls, including evaluating whether there is evidence of bias by
the Directors that may represent a risk of material misstatement due to fraud.
64
Strategic report Governance Financial statements Additional information
The risks of material misstatement that had the greatest effect on our audit, including the allocation of our resources and effort,
are identified as ‘areas of focus’ in the table below. We have also set out how we tailored our audit to address these specific areas
in order to provide an opinion on the financial statements as a whole and any comments we make on the results of our procedures
should be read in this context. This is not a complete list of all risks identified by our audit.
Area of focus How our audit addressed the area of focus
Valuation of the estate (notes 1, 4, 11, 12 and 15) We focused on the Directors’ annual assessment of the carrying value of land and buildings because properties are a significant item on the balance sheet. The valuation in the period resulted in a net increase in shareholders’ equity of £57.3 million and a net £38.6 million impairment charge in the income statement. There are complex and subjective assumptions used in the valuations, including the future expected performance of pubs and multiples to be applied.
We obtained the Directors’ valuation and impairment analysis and discussed the valuations, the methodology adopted and the assumptions used with the Group’s estates team and our valuation specialists. We also took into account the impact of changes in macroeconomic conditions, pub performance and recent market transactions and their associated multiples. We assessed the valuation methodologies adopted and found them to be appropriate.
We verified management’s assumptions on future earnings and multiples using recent market transactions data, historical pub performance and the level of investment in properties and considered the impact of movements in key assumptions. We found the assumptions adopted to be appropriate and consistent with our knowledge of the business.
Where material adjustments to valuations of specific assets occurred we agreed the revaluation adopted by management to external market information or third party evidence, including offers received that supported the value.
We found that the estate had been valued in line with the Group’s policy using appropriate methodologies and assumptions.
Disclosure of items as ‘non-underlying’ (notes 1 and 4) The financial statements include certain items which are disclosed as ‘non-underlying’ such as non-core estate disposal and reorganisation costs, impairment charges in respect of the property estate, losses on the portfolio disposal of pubs and the results arising from the ongoing management of these pubs, recognition of onerous lease provisions and associated leasehold impairments, movements in the financial assumptions used in determining the onerous lease provisions, relocation, reorganisation and integration costs and movements in the fair value of interest rate swaps. Management has included these items as non-underlying using the criteria explained in their accounting policy which is disclosed in note 1 to the financial statements.
We focused on this area because non-underlying items are not defined by IFRS as adopted by the European Union and it therefore requires judgement by the Directors to identify such items. Consistency in identifying and disclosing items as non-underlying is important to maintain comparability of the results with previous periods.
We assessed the appropriateness of the Group’s accounting policy and whether those items disclosed as non-underlying were consistent with the accounting policy and the approach taken in previous accounting periods. We found the Group’s accounting policy to be appropriate and the classification of items to be consistent with the accounting policy.
We also considered an appropriate threshold to apply to non-underlying items based on the financial statement line items that were affected. For example, property items are considered by management to have a higher threshold for disclosure as non-underlying. We concluded that the thresholds adopted are appropriate in the circumstances.
We assessed whether other non-recurring items should have been classified as non-underlying and discussed this with the Directors and the Audit Committee. We confirmed that all significant items meeting the criteria in the Group’s accounting policy had been identified and that the treatment was consistent year on year.
Accounting for uncertain tax positions (note 1) The Group has a number of outstanding corporate and indirect tax positions where recognition in the financial statements is judgemental given the uncertainty of settlement.
These uncertainties arise because these matters have not yet been resolved with HM Revenue & Customs and the Directors have had to make material judgements about the recognition or non-recognition of the benefits or liabilities associated with the tax positions.
We examined correspondence with HM Revenue & Customs and any legal challenges relevant to the individual circumstances of each case. We assessed the position taken by the Directors in respect of these uncertainties.
We evaluated the appropriateness of the recognition or nonrecognition of the benefits or liabilities associated with these tax positions, and the treatment of any related interest. We found that the positions taken by the Directors were appropriate.
65
Marston’s PLC Annual Report and Accounts 2015
INDEPENDENT AUDITORS’ REPORT TO THE MEMBERS OF MARSTON’S PLC continued
Area of focus How our audit addressed the area of focus
Accounting for the acquisition of the beer division of Daniel Thwaites PLC (note 35) The Group acquired the trade and assets of the beer division of Daniel Thwaites PLC (‘Thwaites’) for consideration of £28.8 million.
Accounting for the acquisition of the trade and assets involved judgements in relation to the identification and valuation of the assets and liabilities to be recognised, particularly in respect of the acquired brands.
The value of the acquired brands, which was calculated by management, included estimates about future earnings and current market multiples.
Judgement was required to determine whether costs arising from the Thwaites acquisition met the Group’s accounting policy for non-underlying items.
We tested the brand value by understanding the appropriateness of the methodology used, benchmarking the value using a royalty replacement method and considering comparable market transactions. We compared the forecast revenue and margins for the Thwaites beer brands to historic performance and evaluated the brand valuation in the context of the rationale for the acquisition and the objectives of the accounting framework. We found that the brand valuation was consistent with the application of industry practices and market transactions.
We evaluated the fair value ascribed to the acquired assets and liabilities, for example by challenging management’s assessment of the acquired inventory and accounts receivable with reference to Marston’s experience in recovering debt and the margins on other beer brands. We found the fair value ascribed to the acquired assets and liabilities to be reasonable.
We considered the classification of the restructuring costs incurred following the business combination as ‘non-underlying’ and the appropriateness of their identification. We determined that they had been identified accurately and had been classified in accordance with the Group’s accounting policy.
How we tailored the audit scope
We tailored the scope of our audit to ensure that we performed enough work to be able to give an opinion on the financial
statements as a whole, taking into account the geographic structure of the Group, the accounting processes and controls,
the industry in which the Group operates and the integration of the acquired Thwaites business.
The Group is structured along four business lines being Destination and Premium, Taverns, Leased and Brewing, supported
by Group Services. The Group financial statements are a consolidation of subsidiaries and special purpose entities, principally
comprising the Group’s operating businesses, property companies, securitisation vehicles, holding companies and an
insurance company.
In establishing the overall approach to the Group audit we considered the consolidated trial balance for the Group as a whole and
designed our audit testing for each financial statement line item based on the size and nature of the transactions and balances
that are aggregated to form that line item and our assessment of the risk of material misstatement. We used our professional
judgement to determine the nature and extent of testing required over each line item in the financial statements.
Materiality
The scope of our audit was influenced by our application of materiality. We set certain quantitative thresholds for materiality.
These, together with qualitative considerations, helped us to determine the scope of our audit and the nature, timing and
extent of our audit procedures on the individual financial statement line items and disclosures, and in evaluating the effect of
misstatements, both individually and on the financial statements as a whole.
Based on our professional judgement, we determined materiality for the financial statements as a whole as follows:
Overall Group materiality £4.6 million (2014: £4.2 million).
How we determined it 5% of profit before tax and non-underlying items.
Rationale for benchmark applied We believe that profit before tax and non-underlying items is the primary measure used by the shareholders in assessing the performance of the Group and is a generally accepted auditing benchmark. The exclusion of items classified as non-underlying is consistent with previous periods and practice within the sector.
We agreed with the Audit Committee that we would report to them misstatements identified during our audit above £0.2 million
(2014: £0.2 million) as well as misstatements below that amount that, in our view, warranted reporting for qualitative reasons.
Going concern
Under the Listing Rules we are required to review the Directors’ statements, set out on page 62, in relation to going concern.
We have nothing to report having performed our review.
66
Strategic report Governance Financial statements Additional information
Under ISAs (UK & Ireland) we are also required to report to you if we have anything material to add or to draw attention to in
relation to the Directors’ statement about whether they considered it appropriate to adopt the going concern basis in preparing the
financial statements. We have nothing material to add or to draw attention to.
As noted in the Directors’ statements, the Directors have concluded that it is appropriate to adopt the going concern basis in
preparing the financial statements. The going concern basis presumes that the Group has adequate resources to remain in
operation, and that the Directors intend it to do so, for at least one year from the date the financial statements were signed. As part
of our audit we have concluded that the Directors’ use of the going concern basis is appropriate.
However, because not all future events or conditions can be predicted, these statements are not a guarantee as to the Group’s
ability to continue as a going concern.
OTHER REQUIRED REPORTING
Consistency of other information Companies Act 2006 opinions
In our opinion the information given in the Strategic Report and the Directors’ Report for the financial period for which the financial
statements are prepared is consistent with the financial statements.
ISAs (UK & Ireland) reporting
Under ISAs (UK & Ireland) we are required to report to you if, in our opinion:
• Information in the Annual Report is: − materially inconsistent with the information in the audited financial statements; or
− apparently materially incorrect based on, or materially inconsistent with, our knowledge of the Group acquired in the course of performing our audit; or
− otherwise misleading.
We have no exceptions to report.
• The statement given by the Directors on page 62, in accordance with provision C.1.1 of the UK Corporate Governance Code (the ‘Code’), that they consider the Annual Report taken as a whole to be fair, balanced and understandable and provides the information necessary for members to assess the Group’s performance, business model and strategy is materially inconsistent with our knowledge of the Group acquired in the course of performing our audit.
We have no exceptions to report.
• The section of the Annual Report on pages 36 to 37, as required by provision C.3.8 of the Code, describing the work of the Audit Committee does not appropriately address matters communicated by us to the Audit Committee.
We have no exceptions to report.
The Directors’ assessment of the prospects of the Group and of the principal risks that would threaten the solvency or liquidity of the Group
Under ISAs (UK & Ireland) we are required to report to you if we have anything material to add or to draw attention to in relation to:
• The Directors’ confirmation in the Annual Report that they have carried out a robust assessment of the principal risks facing the Group, including those that would threaten its business model, future performance, solvency or liquidity.
We have nothing material to add or to draw attention to.
• The disclosures in the Annual Report that describe those risks and explain how they are being managed or mitigated.
We have nothing material to add or to draw attention to.
• The Directors’ explanation in the Annual Report as to how they have assessed the prospects of the Group, over what period they have done so and why they consider that period to be appropriate, and their statement as to whether they have a reasonable expectation that the Group will be able to continue as a going concern in operation and meet its liabilities as they fall due over the period of their assessment, including any related disclosures drawing attention to any necessary qualifications or assumptions.
We have nothing material to add or to draw attention to.
Under the Listing Rules we are required to review the Directors’ statement that they have carried out a robust assessment of the principal risks facing the Group and the Directors’ statement in relation to the longer-term viability of the Group, set out on page 21. Our review was substantially less in in scope than an audit and only consisted of making enquiries and considering the Directors’ process supporting their statements; checking that the statements are in alignment with the relevant provisions of the Code; and considering whether the statements are consistent with the knowledge acquired by us in the course of performing our audit. We have nothing to report having performed our review.
67
Marston’s PLC Annual Report and Accounts 2015
INDEPENDENT AUDITORS’ REPORT TO the MEMBERS OF MARSTON’S PLC continued
Adequacy of information and explanations received Under the Companies Act 2006 we are required to report to you if, in our opinion, we have not received all the information and
explanations we require for our audit. We have no exceptions to report arising from this responsibility.
Directors’ remuneration Under the Companies Act 2006 we are required to report to you if, in our opinion, certain disclosures of Directors’ remuneration
specified by law are not made. We have no exceptions to report arising from this responsibility.
Corporate Governance Statement Under the Listing Rules we are required to review the part of the Corporate Governance Statement relating to ten further provisions
of the Code. We have nothing to report having performed our review.
RESPONSIBILITIES FOR THE FINANCIAL STATEMENTS AND THE AUDIT
Our responsibilities and those of the Directors As explained more fully in the Statement of Directors’ Responsibilities set out on page 62, the Directors are responsible for the
preparation of the financial statements and for being satisfied that they give a true and fair view.
Our responsibility is to audit and express an opinion on the financial statements in accordance with applicable law and ISAs
(UK & Ireland). Those standards require us to comply with the Auditing Practices Board’s Ethical Standards for Auditors.
This report, including the opinions, has been prepared for and only for the Company’s members as a body in accordance with
Chapter 3 of Part 16 of the Companies Act 2006 and for no other purpose. We do not, in giving these opinions, accept or assume
responsibility for any other purpose or to any other person to whom this report is shown or into whose hands it may come save
where expressly agreed by our prior consent in writing.
What an audit of financial statements involves An audit involves obtaining evidence about the amounts and disclosures in the financial statements sufficient to give reasonable
assurance that the financial statements are free from material misstatement, whether caused by fraud or error. This includes an
assessment of:
• whether the accounting policies are appropriate to the Group’s circumstances and have been consistently applied and
adequately disclosed;
• the reasonableness of significant accounting estimates made by the Directors; and
• the overall presentation of the financial statements.
We primarily focus our work in these areas by assessing the Directors’ judgements against available evidence, forming our own
judgements, and evaluating the disclosures in the financial statements.
We test and examine information, using sampling and other auditing techniques, to the extent we consider necessary to provide
a reasonable basis for us to draw conclusions. We obtain audit evidence through testing the effectiveness of controls, substantive
procedures or a combination of both.
In addition, we read all the financial and non-financial information in the Annual Report to identify material inconsistencies with
the audited financial statements and to identify any information that is apparently materially incorrect based on, or materially
inconsistent with, the knowledge acquired by us in the course of performing the audit. If we become aware of any apparent material
misstatements or inconsistencies we consider the implications for our report.
OTHER MATTER
We have reported separately on the Parent Company financial statements of Marston’s PLC for the period ended 3 October 2015
and on the information in the Directors’ Remuneration Report that is described as having been audited.
Mark Smith (Senior Statutory Auditor) for and on behalf of PricewaterhouseCoopers LLP
Chartered Accountants and Statutory Auditors
Birmingham
26 November 2015
68
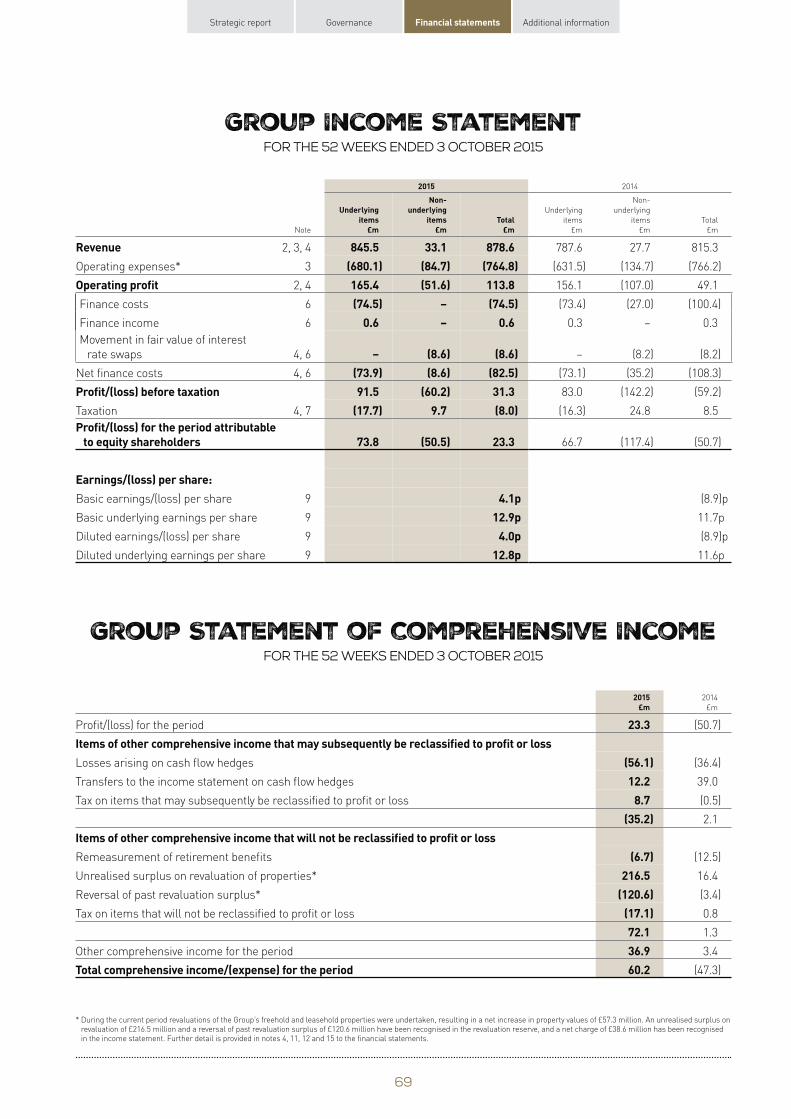
Strategic report Governance Financial statements Additional information
Group Income Statement For the 52 weeks ended 3 October 2015
2015
Underlying items
£m
Non-underlying
items £m
Total £m
845.5 33.1 878.6 (680.1) (84.7) (764.8) 165.4 (51.6) 113.8 (74.5) – (74.5)
0.6 – 0.6
– (8.6) (8.6) (73.9) (8.6) (82.5) 91.5 (60.2) 31.3
(17.7) 9.7 (8.0)
73.8 (50.5) 23.3
4.1p 12.9p
4.0p 12.8p
Revenue Operating expenses*
Operating profit Finance costs
Finance income
Movement in fair value of interest
rate swaps
Net finance costs
Profit/(loss) before taxation Taxation
Profit/(loss) for the period attributable to equity shareholders
Earnings/(loss) per share: Basic earnings/(loss) per share
Basic underlying earnings per share
Diluted earnings/(loss) per share
Diluted underlying earnings per share
Note
2, 3, 4
3
2, 4
6
6
4, 6
4, 6
4, 7
9
9
9
9
Underlying
items
£m
787.6
(631.5)
156.1
(73.4)
0.3
–
(73.1)
83.0
(16.3)
66.7
2014
Non-
underlying
items
£m
27.7
(134.7)
(107.0)
(27.0)
–
(8.2)
(35.2)
(142.2)
24.8
(117.4)
Total
£m
815.3
(766.2)
49.1
(100.4)
0.3
(8.2)
(108.3)
(59.2)
8.5
(50.7)
(8.9)p
11.7p
(8.9)p
11.6p
Group Statement of Comprehensive Income For the 52 weeks ended 3 October 2015
2015 £m
23.3
(56.1) 12.2
8.7 (35.2)
(6.7) 216.5
(120.6) (17.1) 72.1 36.9 60.2
Profit/(loss) for the period
Items of other comprehensive income that may subsequently be reclassified to profit or loss Losses arising on cash flow hedges
Transfers to the income statement on cash flow hedges
Tax on items that may subsequently be reclassified to profit or loss
Items of other comprehensive income that will not be reclassified to profit or loss Remeasurement of retirement benefits
Unrealised surplus on revaluation of properties*
Reversal of past revaluation surplus*
Tax on items that will not be reclassified to profit or loss
Other comprehensive income for the period
Total comprehensive income/(expense) for the period
2014
£m
(50.7)
(36.4)
39.0
(0.5)
2.1
(12.5)
16.4
(3.4)
0.8
1.3
3.4
(47.3)
* During the current period revaluations of the Group’s freehold and leasehold properties were undertaken, resulting in a net increase in property values of £57.3 million. An unrealised surplus on revaluation of £216.5 million and a reversal of past revaluation surplus of £120.6 million have been recognised in the revaluation reserve, and a net charge of £38.6 million has been recognised in the income statement. Further detail is provided in notes 4, 11, 12 and 15 to the financial statements.
69
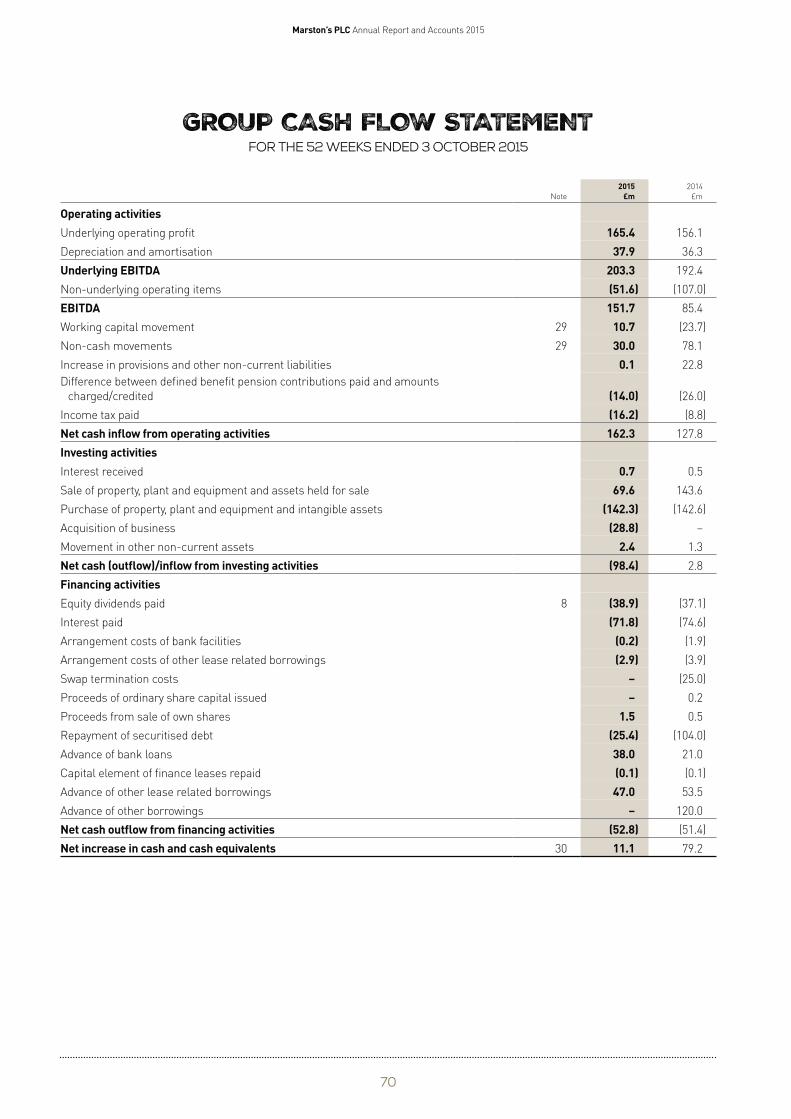
Marston’s PLC Annual Report and Accounts 2015
GROUP CASH FLOW STATEMENT For the 52 weeks ended 3 October 2015
2015 £m
165.4 37.9
203.3 (51.6) 151.7
10.7 30.0
0.1
(14.0) (16.2) 162.3
0.7 69.6
(142.3) (28.8)
2.4 (98.4)
(38.9) (71.8)
(0.2) (2.9)
– –
1.5 (25.4) 38.0 (0.1) 47.0
– (52.8) 11.1
2014
Note £m
Operating activities Underlying operating profit 156.1
Depreciation and amortisation 36.3
Underlying EBITDA 192.4
Non-underlying operating items (107.0)
EBITDA 85.4
Working capital movement 29 (23.7)
Non-cash movements 29 78.1
Increase in provisions and other non-current liabilities 22.8
Difference between defined benefit pension contributions paid and amounts
charged/credited (26.0)
Income tax paid (8.8)
Net cash inflow from operating activities 127.8
Investing activities Interest received 0.5
Sale of property, plant and equipment and assets held for sale 143.6
Purchase of property, plant and equipment and intangible assets (142.6)
Acquisition of business –
Movement in other non-current assets 1.3
Net cash (outflow)/inflow from investing activities 2.8
Financing activities Equity dividends paid 8 (37.1)
Interest paid (74.6)
Arrangement costs of bank facilities (1.9)
Arrangement costs of other lease related borrowings (3.9)
Swap termination costs (25.0)
Proceeds of ordinary share capital issued 0.2
Proceeds from sale of own shares 0.5
Repayment of securitised debt (104.0)
Advance of bank loans 21.0
Capital element of finance leases repaid (0.1)
Advance of other lease related borrowings 53.5
Advance of other borrowings 120.0
Net cash outflow from financing activities (51.4)
Net increase in cash and cash equivalents 30 79.2
70
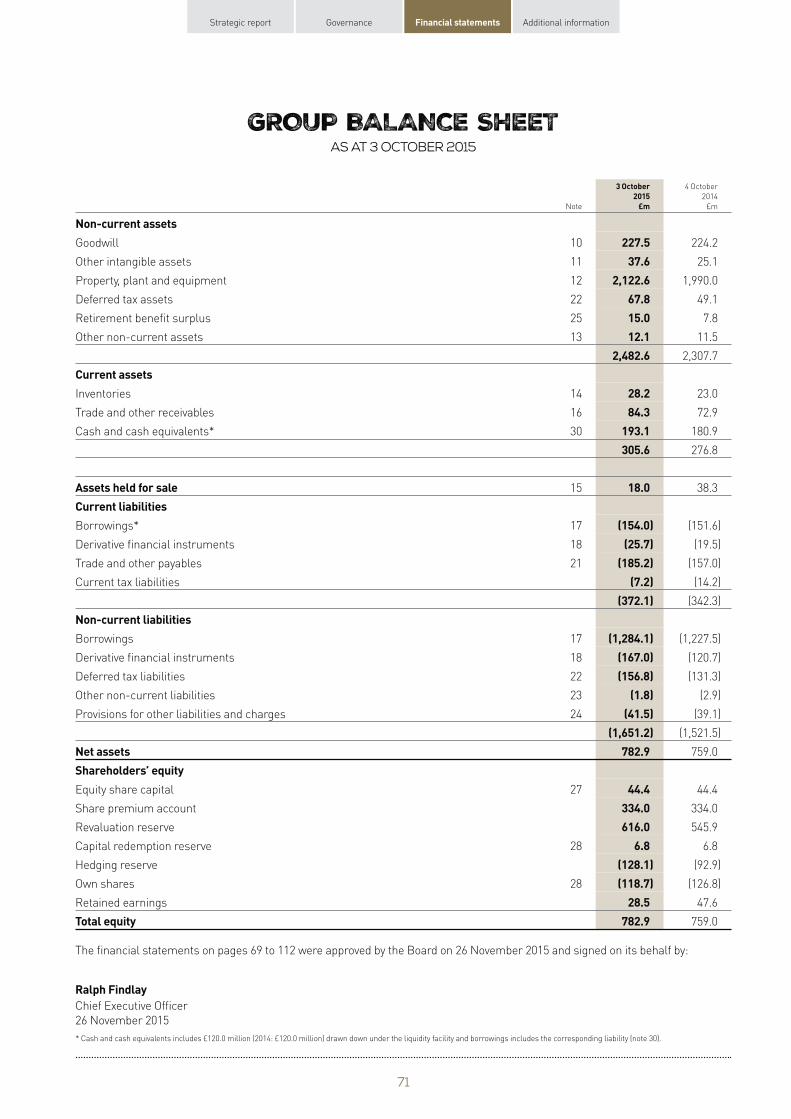
Strategic report Governance Financial statements Additional information
GROUP BALANCE SHEET As at 3 October 2015
Non-current assets Goodwill
Other intangible assets
Property, plant and equipment
Deferred tax assets
Retirement benefit surplus
Other non-current assets
Current assets Inventories
Trade and other receivables
Cash and cash equivalents*
Assets held for sale Current liabilities Borrowings*
Derivative financial instruments
Trade and other payables
Current tax liabilities
Non-current liabilities Borrowings
Derivative financial instruments
Deferred tax liabilities
Other non-current liabilities
Provisions for other liabilities and charges
Net assets Shareholders’ equity Equity share capital
Share premium account
Revaluation reserve
Capital redemption reserve
Hedging reserve
Own shares
Retained earnings
Total equity
3 October 2015
£m
227.5 37.6
2,122.6 67.8 15.0 12.1
2,482.6
28.2 84.3
193.1 305.6
18.0
(154.0) (25.7)
(185.2) (7.2)
(372.1)
(1,284.1) (167.0) (156.8)
(1.8) (41.5)
(1,651.2) 782.9
44.4 334.0 616.0
6.8 (128.1) (118.7)
28.5 782.9
Note
10
11
12
22
25
13
14
16
30
15
17
18
21
17
18
22
23
24
27
28
28
4 October
2014
£m
224.2
25.1
1,990.0
49.1
7.8
11.5
2,307.7
23.0
72.9
180.9
276.8
38.3
(151.6)
(19.5)
(157.0)
(14.2)
(342.3)
(1,227.5)
(120.7)
(131.3)
(2.9)
(39.1)
(1,521.5)
759.0
44.4
334.0
545.9
6.8
(92.9)
(126.8)
47.6
759.0
The financial statements on pages 69 to 112 were approved by the Board on 26 November 2015 and signed on its behalf by:
Ralph Findlay Chief Executive Officer
26 November 2015
* Cash and cash equivalents includes £120.0 million (2014: £120.0 million) drawn down under the liquidity facility and borrowings includes the corresponding liability (note 30).
71
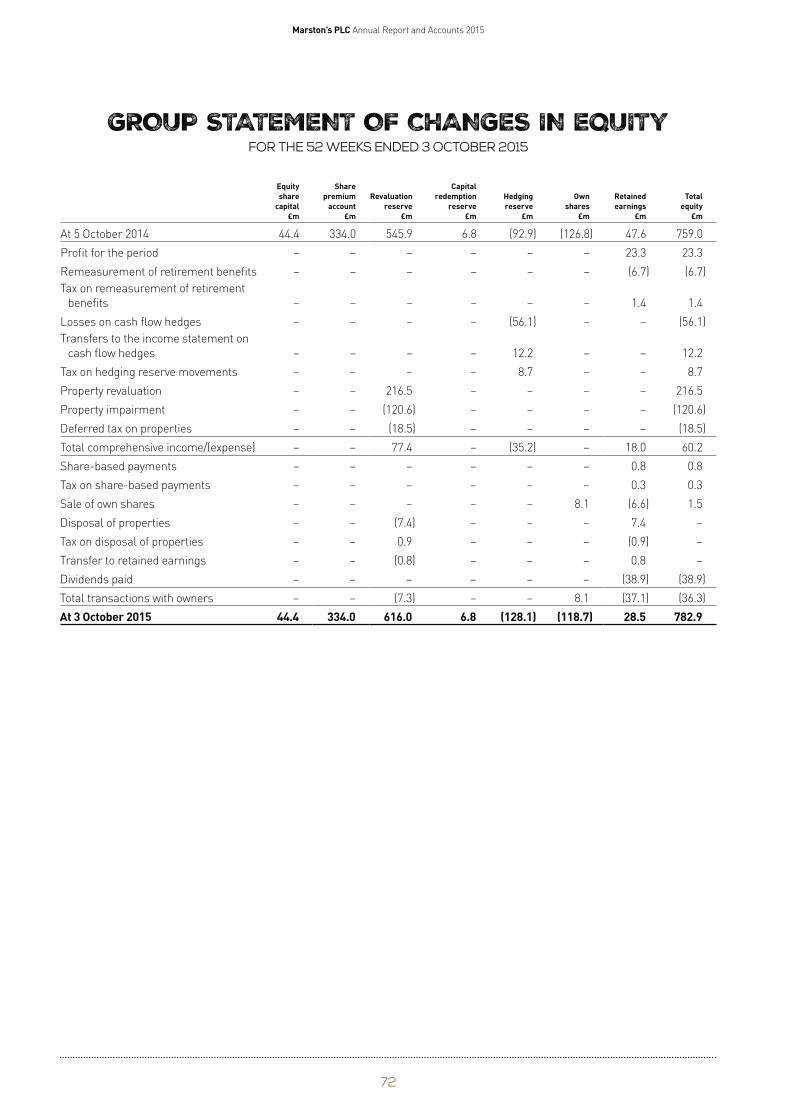
Marston’s PLC Annual Report and Accounts 2015
GROUP STATEMENT OF CHANGES IN EQUITY For the 52 weeks ended 3 October 2015
Equity Share Capital share premium Revaluation redemption Hedging Own Retained Total
capital account reserve reserve reserve shares earnings equity £m £m £m £m £m £m £m £m
At 5 October 2014 44.4 334.0 545.9 6.8 (92.9) (126.8) 47.6 759.0
Profit for the period – – – – – – 23.3 23.3
Remeasurement of retirement benefits – – – – – – (6.7) (6.7)
Tax on remeasurement of retirement
benefits – – – – – – 1.4 1.4
Losses on cash flow hedges – – – – (56.1) – – (56.1)
Transfers to the income statement on
cash flow hedges – – – – 12.2 – – 12.2
Tax on hedging reserve movements – – – – 8.7 – – 8.7
Property revaluation – – 216.5 – – – – 216.5
Property impairment – – (120.6) – – – – (120.6)
Deferred tax on properties – – (18.5) – – – – (18.5)
Total comprehensive income/(expense) – – 77.4 – (35.2) – 18.0 60.2
Share-based payments – – – – – – 0.8 0.8
Tax on share-based payments – – – – – – 0.3 0.3
Sale of own shares – – – – – 8.1 (6.6) 1.5
Disposal of properties – – (7.4) – – – 7.4 –
Tax on disposal of properties – – 0.9 – – – (0.9) –
Transfer to retained earnings – – (0.8) – – – 0.8 –
Dividends paid – – – – – – (38.9) (38.9)
Total transactions with owners – – (7.3) – – 8.1 (37.1) (36.3)
At 3 October 2015 44.4 334.0 616.0 6.8 (128.1) (118.7) 28.5 782.9
72
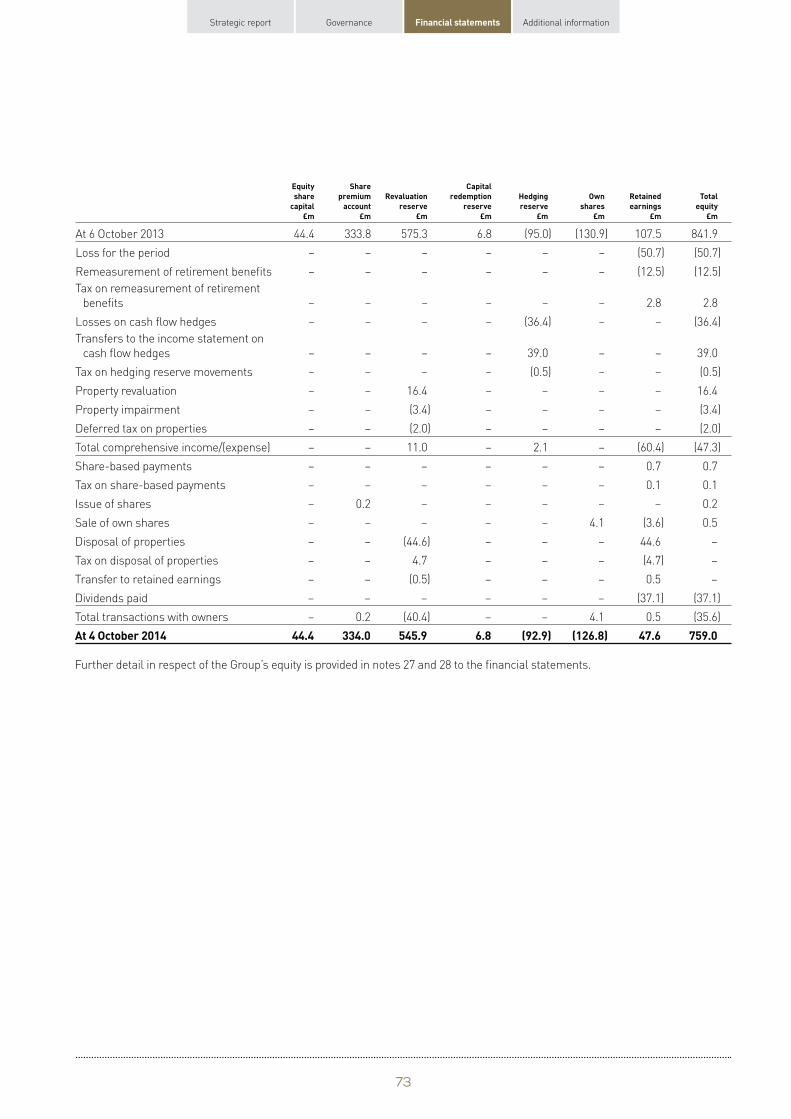
Strategic report Governance Financial statements Additional information
Equity Share Capital share premium Revaluation redemption Hedging Own Retained Total
capital account reserve reserve reserve shares earnings equity £m £m £m £m £m £m £m £m
At 6 October 2013 44.4 333.8 575.3 6.8 (95.0) (130.9) 107.5 841.9
Loss for the period – – – – – – (50.7) (50.7)
Remeasurement of retirement benefits – – – – – – (12.5) (12.5)
Tax on remeasurement of retirement
benefits – – – – – – 2.8 2.8
Losses on cash flow hedges – – – – (36.4) – – (36.4)
Transfers to the income statement on
cash flow hedges – – – – 39.0 – – 39.0
Tax on hedging reserve movements – – – – (0.5) – – (0.5)
Property revaluation – – 16.4 – – – – 16.4
Property impairment – – (3.4) – – – – (3.4)
Deferred tax on properties – – (2.0) – – – – (2.0)
Total comprehensive income/(expense) – – 11.0 – 2.1 – (60.4) (47.3)
Share-based payments – – – – – – 0.7 0.7
Tax on share-based payments – – – – – – 0.1 0.1
Issue of shares – 0.2 – – – – – 0.2
Sale of own shares – – – – – 4.1 (3.6) 0.5
Disposal of properties – – (44.6) – – – 44.6 –
Tax on disposal of properties – – 4.7 – – – (4.7) –
Transfer to retained earnings – – (0.5) – – – 0.5 –
Dividends paid – – – – – – (37.1) (37.1)
Total transactions with owners – 0.2 (40.4) – – 4.1 0.5 (35.6)
At 4 October 2014 44.4 334.0 545.9 6.8 (92.9) (126.8) 47.6 759.0
Further detail in respect of the Group’s equity is provided in notes 27 and 28 to the financial statements.
73
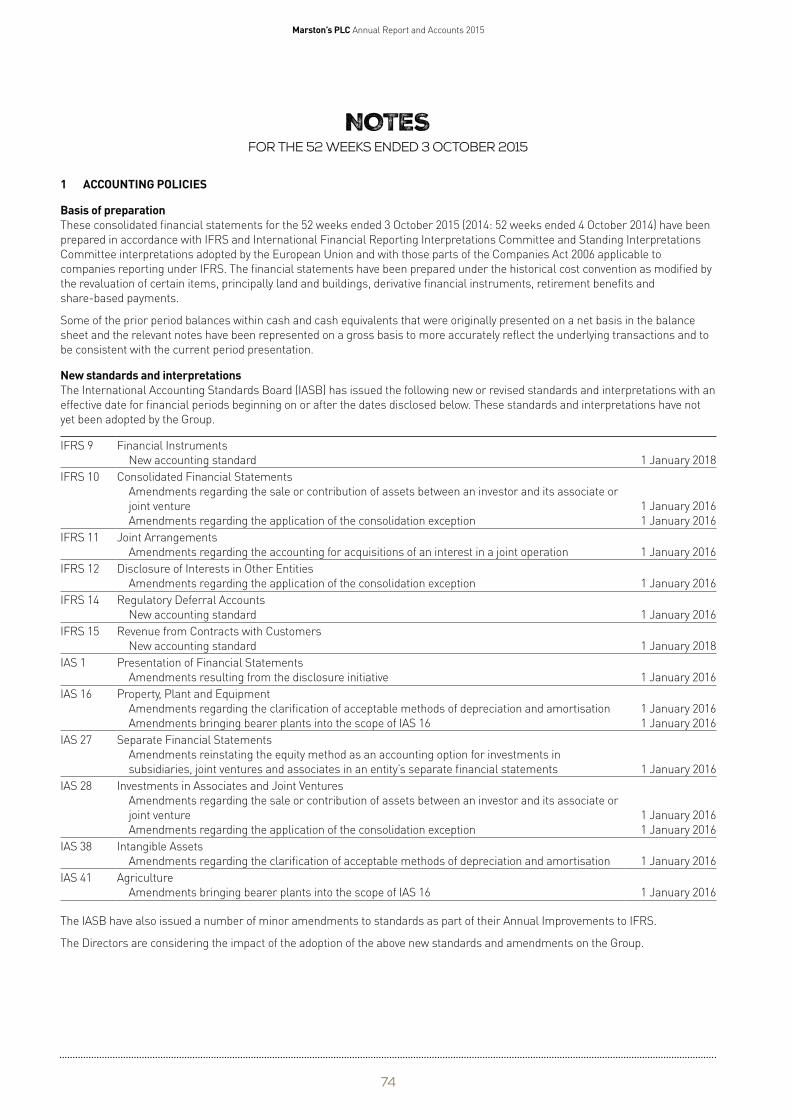
1
Marston’s PLC Annual Report and Accounts 2015
NOTES For the 52 weeks ended 3 October 2015
ACCOUNTING POLICIES
Basis of preparation These consolidated financial statements for the 52 weeks ended 3 October 2015 (2014: 52 weeks ended 4 October 2014) have been
prepared in accordance with IFRS and International Financial Reporting Interpretations Committee and Standing Interpretations
Committee interpretations adopted by the European Union and with those parts of the Companies Act 2006 applicable to
companies reporting under IFRS. The financial statements have been prepared under the historical cost convention as modified by
the revaluation of certain items, principally land and buildings, derivative financial instruments, retirement benefits and
share-based payments.
Some of the prior period balances within cash and cash equivalents that were originally presented on a net basis in the balance
sheet and the relevant notes have been represented on a gross basis to more accurately reflect the underlying transactions and to
be consistent with the current period presentation.
New standards and interpretations The International Accounting Standards Board (IASB) has issued the following new or revised standards and interpretations with an
effective date for financial periods beginning on or after the dates disclosed below. These standards and interpretations have not
yet been adopted by the Group.
IFRS 9 Financial Instruments
New accounting standard 1 January 2018
IFRS 10 Consolidated Financial Statements
Amendments regarding the sale or contribution of assets between an investor and its associate or
joint venture 1 January 2016
Amendments regarding the application of the consolidation exception 1 January 2016
IFRS 11 Joint Arrangements
Amendments regarding the accounting for acquisitions of an interest in a joint operation 1 January 2016
IFRS 12 Disclosure of Interests in Other Entities
Amendments regarding the application of the consolidation exception 1 January 2016
IFRS 14 Regulatory Deferral Accounts
New accounting standard 1 January 2016
IFRS 15 Revenue from Contracts with Customers
New accounting standard 1 January 2018
IAS 1 Presentation of Financial Statements
Amendments resulting from the disclosure initiative 1 January 2016
IAS 16 Property, Plant and Equipment
Amendments regarding the clarification of acceptable methods of depreciation and amortisation 1 January 2016
Amendments bringing bearer plants into the scope of IAS 16 1 January 2016
IAS 27 Separate Financial Statements
Amendments reinstating the equity method as an accounting option for investments in
subsidiaries, joint ventures and associates in an entity’s separate financial statements 1 January 2016
IAS 28 Investments in Associates and Joint Ventures
Amendments regarding the sale or contribution of assets between an investor and its associate or
joint venture 1 January 2016
Amendments regarding the application of the consolidation exception 1 January 2016
IAS 38 Intangible Assets
Amendments regarding the clarification of acceptable methods of depreciation and amortisation 1 January 2016
IAS 41 Agriculture
Amendments bringing bearer plants into the scope of IAS 16 1 January 2016
The IASB have also issued a number of minor amendments to standards as part of their Annual Improvements to IFRS.
The Directors are considering the impact of the adoption of the above new standards and amendments on the Group.
74
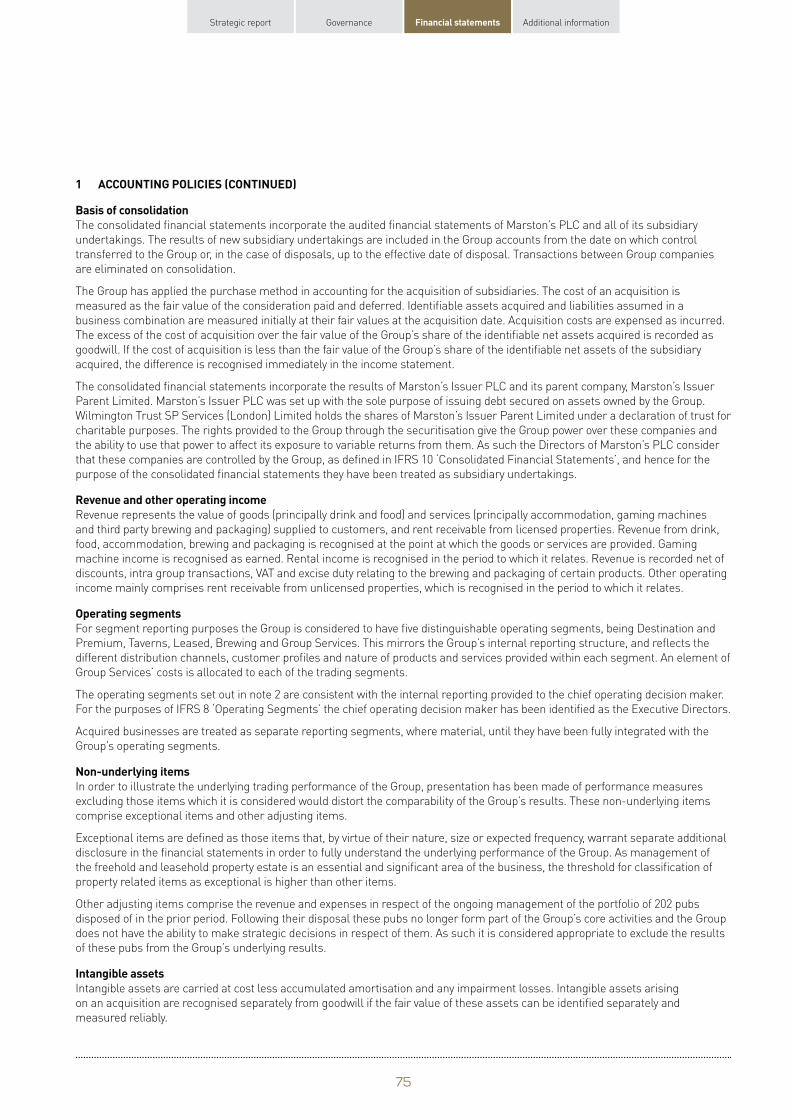
1
Strategic report Governance Financial statements Additional information
ACCOUNTING POLICIES (CONTINUED)
Basis of consolidation The consolidated financial statements incorporate the audited financial statements of Marston’s PLC and all of its subsidiary
undertakings. The results of new subsidiary undertakings are included in the Group accounts from the date on which control
transferred to the Group or, in the case of disposals, up to the effective date of disposal. Transactions between Group companies
are eliminated on consolidation.
The Group has applied the purchase method in accounting for the acquisition of subsidiaries. The cost of an acquisition is
measured as the fair value of the consideration paid and deferred. Identifiable assets acquired and liabilities assumed in a
business combination are measured initially at their fair values at the acquisition date. Acquisition costs are expensed as incurred.
The excess of the cost of acquisition over the fair value of the Group’s share of the identifiable net assets acquired is recorded as
goodwill. If the cost of acquisition is less than the fair value of the Group’s share of the identifiable net assets of the subsidiary
acquired, the difference is recognised immediately in the income statement.
The consolidated financial statements incorporate the results of Marston’s Issuer PLC and its parent company, Marston’s Issuer
Parent Limited. Marston’s Issuer PLC was set up with the sole purpose of issuing debt secured on assets owned by the Group.
Wilmington Trust SP Services (London) Limited holds the shares of Marston’s Issuer Parent Limited under a declaration of trust for
charitable purposes. The rights provided to the Group through the securitisation give the Group power over these companies and
the ability to use that power to affect its exposure to variable returns from them. As such the Directors of Marston’s PLC consider
that these companies are controlled by the Group, as defined in IFRS 10 ‘Consolidated Financial Statements’, and hence for the
purpose of the consolidated financial statements they have been treated as subsidiary undertakings.
Revenue and other operating income Revenue represents the value of goods (principally drink and food) and services (principally accommodation, gaming machines
and third party brewing and packaging) supplied to customers, and rent receivable from licensed properties. Revenue from drink,
food, accommodation, brewing and packaging is recognised at the point at which the goods or services are provided. Gaming
machine income is recognised as earned. Rental income is recognised in the period to which it relates. Revenue is recorded net of
discounts, intra group transactions, VAT and excise duty relating to the brewing and packaging of certain products. Other operating
income mainly comprises rent receivable from unlicensed properties, which is recognised in the period to which it relates.
Operating segments For segment reporting purposes the Group is considered to have five distinguishable operating segments, being Destination and
Premium, Taverns, Leased, Brewing and Group Services. This mirrors the Group’s internal reporting structure, and reflects the
different distribution channels, customer profiles and nature of products and services provided within each segment. An element of
Group Services’ costs is allocated to each of the trading segments.
The operating segments set out in note 2 are consistent with the internal reporting provided to the chief operating decision maker.
For the purposes of IFRS 8 ‘Operating Segments’ the chief operating decision maker has been identified as the Executive Directors.
Acquired businesses are treated as separate reporting segments, where material, until they have been fully integrated with the
Group’s operating segments.
Non-underlying items In order to illustrate the underlying trading performance of the Group, presentation has been made of performance measures
excluding those items which it is considered would distort the comparability of the Group’s results. These non-underlying items
comprise exceptional items and other adjusting items.
Exceptional items are defined as those items that, by virtue of their nature, size or expected frequency, warrant separate additional
disclosure in the financial statements in order to fully understand the underlying performance of the Group. As management of
the freehold and leasehold property estate is an essential and significant area of the business, the threshold for classification of
property related items as exceptional is higher than other items.
Other adjusting items comprise the revenue and expenses in respect of the ongoing management of the portfolio of 202 pubs
disposed of in the prior period. Following their disposal these pubs no longer form part of the Group’s core activities and the Group
does not have the ability to make strategic decisions in respect of them. As such it is considered appropriate to exclude the results
of these pubs from the Group’s underlying results.
Intangible assets Intangible assets are carried at cost less accumulated amortisation and any impairment losses. Intangible assets arising
on an acquisition are recognised separately from goodwill if the fair value of these assets can be identified separately and
measured reliably.
75
1
Marston’s PLC Annual Report and Accounts 2015
NOTES continued For the 52 weeks ended 3 October 2015
ACCOUNTING POLICIES (CONTINUED)
Amortisation is calculated on a straight-line basis over the estimated useful life of the intangible asset. Where the useful life of
the asset is considered to be indefinite no annual amortisation is provided but the asset is subject to annual impairment reviews.
Impairment reviews are carried out more frequently if events or changes in circumstances indicate that the carrying value of an
asset may be impaired.
The useful lives of the Group’s intangible assets are:
Acquired brands Indefinite
Lease premiums Life of the lease
Computer software 5 to 15 years
Development costs 10 years
Any impairment of carrying value is charged to the income statement.
Research and development expenditure All expenditure on the research phase of an internal project is expensed as incurred.
Development costs are recognised as an intangible asset when the following conditions are met:
• It is technically feasible to complete the intangible asset so that it will be available for use;
• Management intends to complete the asset and use or sell it;
• There is an ability to use or sell the asset;
• It can be demonstrated how the asset will generate probable future economic benefits;
• Adequate technical, financial and other resources to complete the development and to use or sell the asset are available; and
• The expenditure attributable to the asset during its development can be reliably measured.
Other development expenditure that does not meet these criteria is recognised as an expense as incurred. Development costs
previously recognised as an expense are not recognised as an asset in a subsequent period.
Goodwill Goodwill arising on acquisitions is capitalised and represents the excess of the fair value of the consideration given over the fair
value of the identifiable net assets and liabilities acquired. Goodwill is not amortised but instead is reviewed for impairment on
an annual basis, or more frequently if events or changes in circumstances indicate that the carrying value may be impaired. Any
impairment is recognised immediately in the income statement.
For the purposes of impairment testing, goodwill is allocated to cash generating units that are consistent with the Group’s
operating segments.
Property, plant and equipment • Freehold and leasehold properties are initially stated at cost and subsequently at valuation. Plant and machinery and fixtures,
fittings, tools and equipment are stated at cost.
• Depreciation is charged to the income statement on a straight-line basis to provide for the cost of the assets less residual value
over their useful lives.
• Freehold and long leasehold buildings are depreciated to their residual value over 50 years.
• Short leasehold properties are depreciated over the life of the lease.
• Plant and machinery and fixtures, fittings, tools and equipment are depreciated over periods ranging from 3 to 15 years.
• Own labour and interest costs directly attributable to capital projects are capitalised.
• Land is not depreciated.
Residual values and useful lives are reviewed and adjusted if appropriate at each balance sheet date.
Properties are revalued by qualified valuers on a sufficiently regular basis using open market value so that the carrying value of
an asset does not differ significantly from its fair value at the balance sheet date. Substantially all of the Group’s properties have
been externally valued in accordance with the Royal Institution of Chartered Surveyors’ Red Book. These valuations are performed
directly by reference to observable prices in an active market or recent market transactions on arm’s length terms. Internal
valuations are performed on the same basis.
The estate is reviewed for indication of impairment at each reporting date, using a process focusing on areas of risk and business
performance throughout the portfolio to identify any exposure.
76
1
Strategic report Governance Financial statements Additional information
ACCOUNTING POLICIES (CONTINUED)
Impairment losses are charged to the revaluation reserve to the extent that a previous gain has been recorded, and thereafter to
the income statement. Surpluses on revaluation are recognised in the revaluation reserve, except to the extent that they reverse
previously charged impairment losses, in which case the reversal is recorded in the income statement.
Disposals of property, plant and equipment Profit/loss on disposal of property, plant and equipment represents net sale proceeds less the carrying value of the assets. Any
element of the revaluation reserve relating to the property disposed of is transferred to retained earnings at the date of sale.
Impairment If there are indications of impairment or reversal of impairment, an assessment is made of the recoverable amount. An impairment
loss is recognised where the recoverable amount is lower than the carrying value of assets, including goodwill. The recoverable
amount is the higher of value in use and fair value less costs to sell.
Where there is an indication that any previously recognised impairment losses no longer exist or have decreased, a reversal of the
loss is made if there has been a change in the estimates used to determine the recoverable amounts since the last impairment
loss was recognised. The carrying amount of the asset is increased to its recoverable amount only up to the carrying amount that
would have resulted, net of depreciation or amortisation, had no impairment loss been recognised for the asset in prior periods.
The reversal is recognised in the income statement unless the asset is carried at revalued amount. The reversal of an impairment
loss on a revalued asset is recognised in other comprehensive income and increases the revaluation surplus for that asset.
However, to the extent that an impairment loss on the same revalued asset was previously recognised in the income statement, the
reversal of that impairment loss is recognised in the income statement. The depreciation charge is adjusted in future periods to
allocate the asset’s revised carrying value, less any residual value, on a systematic basis over its remaining useful life. There is no
reversal of impairment losses relating to goodwill.
Acquired brands are reviewed for impairment on a portfolio basis.
Leases Leases are classified as finance leases if the terms of the lease transfer substantially all the risks and rewards of ownership to the
lessee. All other leases are classified as operating leases.
The cost of assets held under finance leases is included within property, plant and equipment and depreciation is charged in
accordance with the accounting policy for each class of asset concerned. The corresponding capital obligations under these leases
are shown as liabilities. The finance charge element of rentals is charged to the income statement and classified within finance
costs as incurred.
Rental costs under operating leases, including lease incentives, are charged to the income statement on a straight-line basis over
the term of the lease. Similarly, income receivable under operating leases is credited to the income statement on a straight-line
basis over the term of the lease.
Obligations arising from sale and leaseback arrangements with repurchase options that do not fall within the scope of IAS 17
‘Leases’ are classified as other lease related borrowings and accounted for in accordance with IAS 39 ‘Financial Instruments:
Recognition and Measurement’.
Inventories Inventories are stated at the lower of cost and net realisable value. Raw materials are valued on a ‘first in, first out’ basis, with the
exception of hops which are valued at average cost. Finished goods and work in progress include direct materials, labour and a
proportion of attributable overheads.
Assets held for sale Assets, typically properties and related fixtures and fittings, are categorised as held for sale when the value of the asset will be
recovered through a sale transaction rather than continuing use. This condition is met when the sale is highly probable, the asset
is available for immediate sale in its present condition and is being actively marketed. In addition, the Group must be committed to
the sale and completion should be expected to occur within one year from the date of classification. Assets held for sale are valued
at the lower of carrying value and fair value less costs to sell, and are no longer depreciated.
77
1
Marston’s PLC Annual Report and Accounts 2015
NOTES continued For the 52 weeks ended 3 October 2015
ACCOUNTING POLICIES (CONTINUED)
Financial instruments The Group classifies its financial assets in one of the following two categories: at fair value through profit or loss and loans and
receivables. The Group classifies its financial liabilities in one of the following two categories: at fair value through profit or loss
and other financial liabilities. The classification depends on the purpose for which the financial instruments were acquired.
Management determines the classification of the Group’s financial instruments at initial recognition.
Financial instruments at fair value through profit or loss
Derivatives are categorised as financial instruments at fair value through profit or loss unless they are designated as part of a
hedging relationship. The Group holds no other financial instruments at fair value through profit or loss.
Loans and receivables
Loans and receivables are non-derivative financial assets with fixed or determinable payments that are not quoted in an active
market. The Group’s loans and receivables comprise trade receivables, other receivables, trade loans and cash and cash
equivalents in the balance sheet. Loans and receivables are carried at amortised cost using the effective interest method.
Other financial liabilities
Non-derivative financial liabilities are classified as other financial liabilities. The Group’s other financial liabilities comprise
borrowings, trade payables and other payables. Other financial liabilities are carried at amortised cost using the effective
interest method.
Financial assets are derecognised when the rights to receive cash flows from the investments have expired or have been
transferred and the Group has transferred substantially all risks and rewards of ownership.
The Group assesses whether there is objective evidence that a financial asset is impaired at each balance sheet date.
It is, and has been throughout the period under review, the Group’s policy that no trading in financial instruments shall be
undertaken.
Derivative financial instruments
The only derivative financial instruments that the Group enters into are interest rate swaps. The purpose of these transactions is to
manage the interest rate risk arising from the Group’s operations and its sources of finance.
Derivatives are initially recognised at fair value on the date the derivative contract is entered into and are subsequently remeasured
at their fair value at each balance sheet date. The method of recognising the resulting gain or loss depends on whether the
derivative is designated as a hedging instrument.
The effective portion of changes in the fair value of derivatives that are designated and qualify as cash flow hedges is recognised in
other comprehensive income. The gain or loss relating to the ineffective portion is recognised immediately in the income statement
within exceptional finance income or costs.
Gains or losses arising from changes in the fair value of derivatives which are not designated as part of a hedging relationship are
presented in the income statement within exceptional finance income or costs in the period in which they arise.
The fair value of a hedging derivative is classified as a non-current asset or liability when the remaining maturity of the hedged
item is more than 12 months and as a current asset or liability when the remaining maturity of the hedged item is less than 12
months. The fair values of derivatives which are not designated as part of a hedging relationship are classified as current assets or
liabilities. Accrued interest is recognised separately in current assets or liabilities as appropriate.
At the inception of a hedging transaction, the Group documents the relationship between hedging instruments and hedged items,
as well as its risk management objectives and strategy for undertaking the hedging transaction. The Group also documents its
assessment, both at hedge inception and on an ongoing basis, of whether the derivatives that are used in hedging transactions are
highly effective in offsetting changes in fair values or cash flows of hedged items.
When a hedging instrument expires or is sold, or when a hedge no longer meets the criteria for hedge accounting, any cumulative
gain or loss existing in equity at that time remains in equity and is recognised when the forecast transaction is ultimately
recognised in the income statement. When a forecast transaction is no longer expected to occur, the cumulative gain or loss that
was reported in equity is immediately transferred to the income statement within exceptional finance income or costs.
Amounts that have been recognised in other comprehensive income in respect of cash flow hedges are reclassified from equity
to profit or loss as a reclassification adjustment in the same period or periods during which the hedged forecast cash flow affects
profit or loss.
78
1
Strategic report Governance Financial statements Additional information
ACCOUNTING POLICIES (CONTINUED)
Trade receivables and other receivables
Trade receivables and other receivables are recognised initially at fair value and subsequently measured at amortised cost less
provision for impairment. A provision for impairment of trade receivables and other receivables is established when there is
objective evidence that the Group will not be able to collect all amounts due according to the original terms of the receivables.
Significant financial difficulties of the debtor, probability that the debtor will enter bankruptcy or financial reorganisation and
default or delinquency in payments are considered indicators that the trade or other receivable is impaired. The amount of the
provision is the difference between the asset’s carrying amount and the estimated future cash flows. The carrying amount of the
asset is reduced through the use of an allowance account, and the amount of the loss is recognised in the income statement within
other net operating charges. When a trade or other receivable is uncollectable, it is written off against the allowance account
for trade or other receivables. Subsequent recoveries of amounts previously written off are credited against other net operating
charges in the income statement.
Trade loans
In common with other major brewers, the Group makes trade loans to publicans who purchase the Group’s beer. These trade
loans are classified as other non-current assets in the balance sheet and are recognised initially at fair value and subsequently at
amortised cost less provision for impairment. Significant trade loans are secured against the property of the loan recipient.
Cash and cash equivalents
Cash and cash equivalents include cash in hand and deposits on call with banks. Bank overdrafts are shown within borrowings in
current liabilities. For the purpose of the cash flow statement, cash and cash equivalents are as defined above, net of outstanding
bank overdrafts.
Borrowings
Borrowings are initially recognised at fair value, net of transaction costs incurred. Borrowings are subsequently stated at amortised
cost; any difference between the proceeds (net of transaction costs) and the redemption value is recognised in the income
statement over the period of the borrowings using the effective interest method.
Preference shares are classified as liabilities. The dividends on these preference shares are recognised in the income statement as
finance costs.
Borrowing costs are recognised as an expense in the period in which they are incurred, except for interest costs incurred on the
financing of major projects, which are capitalised until the time that the projects are available for use.
Trade payables and other payables
Trade payables and other payables are recognised initially at fair value and subsequently measured at amortised cost using the
effective interest method.
Employee benefits Pension costs for the Group’s defined benefit pension plan are determined by the Projected Unit Credit Method, with actuarial
calculations being carried out at each period end date. Costs are recognised in the income statement within both operating
expenses and net finance costs. The current service cost, past service cost and gains or losses arising from settlements are
included within operating expenses. The net interest on the net defined benefit asset/liability and the administrative expenses paid
from plan assets are included within net finance costs.
Actuarial gains or losses arising from experience adjustments and changes in actuarial assumptions are recognised in full in the
period in which they occur in the statement of comprehensive income. The return on plan assets, excluding amounts included in
the net interest on the net defined benefit asset/liability, is also recognised in other comprehensive income.
The asset/liability recognised in the balance sheet for the defined benefit pension plan is the fair value of plan assets less the
present value of the defined benefit obligation. Where the fair value of plan assets exceeds the present value of the defined benefit
obligation, the Group recognises an asset at the lower of the fair value of plan assets less the present value of the defined benefit
obligation, and the present value of any economic benefits available in the form of refunds from the plan or reductions in future
contributions to the plan.
Pension costs for the Group’s defined contribution pension plans are charged to the income statement in the period in which they arise.
Post-retirement medical benefits are accounted for in an identical way to the Group’s defined benefit pension plan.
79
1
Marston’s PLC Annual Report and Accounts 2015
NOTES continued For the 52 weeks ended 3 October 2015
ACCOUNTING POLICIES (CONTINUED)
Key management personnel Key management personnel are those who have authority and responsibility for planning, directing and controlling the activities of
the Group. In the case of Marston’s PLC, the Directors of the Group are considered to be the only key management personnel.
Current and deferred tax The current tax charge is calculated on the basis of the tax laws enacted or substantively enacted at the balance sheet date and is
measured at the amount expected to be paid to or recovered from the tax authorities.
Deferred tax is provided in full, using the liability method, on all differences that have originated but not reversed by the balance
sheet date, and which give rise to an obligation to pay more or less tax in the future. Differences are defined as the differences
between the carrying value of assets and liabilities and their tax base.
Deferred tax assets are recognised to the extent that it is probable that future taxable profit will be available against which the
assets can be utilised.
Deferred tax is calculated using tax rates that are expected to apply when the related deferred tax asset is realised or the deferred
tax liability is settled.
Provisions Provisions are recognised in the balance sheet when the Group has a present legal or constructive obligation as a result of a past
event and it is probable that an outflow of economic benefits will be required to settle the obligation.
When valuations of leasehold properties (based on future estimated income streams) give rise to a deficit as a result of onerous
lease conditions they are recognised as provisions. These provisions are measured at the present value of the expenditure expected
to be required to settle the obligation using a pre-tax rate that reflects current market assessments of the time value of money
and the risks specific to the obligation. The key assumptions used in the discounted cash flow calculations are the discount rates,
inflation rates and market rents and vacant periods of the properties.
Other contractual property costs are also recorded as provisions as appropriate.
Share-based payments The fair value of share-based remuneration at the date of grant is calculated using the Black-Scholes option-pricing model and
charged to the income statement on a straight-line basis over the vesting period of the award. The charge to the income statement
takes account of the estimated number of shares that will vest.
Non-vesting conditions are taken into account when determining the fair value of the Group’s share-based payments, and all
cancellations of share-based payments, whether by the Group or by employees, are accounted for in an identical manner with any
costs unrecognised at the date of cancellation being immediately accelerated.
Own shares Own shares comprise treasury shares, and shares held on trust for employee share schemes, which are used for the granting of
shares to applicable employees.
Own shares are recognised at cost as a deduction from shareholders’ equity. Subsequent consideration received for the sale of
such shares is also recognised in equity, with any difference between the sale proceeds and the original cost being taken to equity.
No income or expense is recognised in the performance statements on own share transactions.
Dividends Dividends proposed by the Board but unpaid at the period end are recognised in the financial statements when they have been
approved by the shareholders. Interim dividends are recognised when paid.
Transactions and balance sheet items in a foreign currency Transactions in a foreign currency are translated to sterling using the exchange rate at the date of the transaction. Monetary
receivables and payables are remeasured at closing day rates at each balance sheet date. Exchange gains or losses that arise from
such remeasurement and on settlement of the transaction are recognised in the income statement. Translation differences for
non-monetary assets valued at fair value through profit or loss are reported as part of the fair value gain or loss. Gains or losses on
disposal of non-monetary assets are recognised in the income statement.
80
1
Strategic report Governance Financial statements Additional information
ACCOUNTING POLICIES (CONTINUED)
Key assumptions and significant judgements IFRS requires the Group to make estimates and assumptions that affect the application of policies and reported amounts.
Estimates and judgements are continually evaluated and are based on historical experience and other factors including
expectations of future events that are believed to be reasonable under the circumstances. Actual results may differ from these
estimates. The Group’s key assumptions and significant judgements are in respect of property, plant and equipment, taxation,
impairment, retirement benefits, financial instruments, property lease provisions, share-based payments and non-underlying
items. Details of these assumptions and judgements are provided in the relevant accounting policy and detailed note to the
financial statements as set out below:
Property, plant and equipment
• Valuation of properties (see accounting policy).
• Assets’ useful lives and residual values (see accounting policy).
Taxation
• Assumptions in respect of the resolution of outstanding corporate and indirect tax matters with HM Revenue & Customs (see
accounting policies for current and deferred tax and provisions).
Impairment
• Assumptions made in the value in use calculation, in particular the pre-tax discount rate applied to cash flow projections and the
growth rate used to extrapolate projected cash flows beyond one year budgets (notes 10 and 11).
Retirement benefits
• Actuarial assumptions in respect of the defined benefit pension plan, which include discount rates, rates of increase in
pensionable salaries, rates of increase in pensions, inflation rates and life expectancies (note 25).
• Recognition of a retirement benefit surplus (see accounting policy).
Financial instruments
• Valuation of financial instruments that are not traded in an active market (note 20).
Property lease provisions
• Assumptions made in the discounted cash flow calculations, in particular the market rents, vacant periods, inflation rates and
discount rates (see accounting policy).
Share-based payments
• Inputs to the Black-Scholes option-pricing model, which include dividend yields, expected volatilities and risk-free interest rates
(note 26).
Non-underlying items
• Determination of items to be classed as non-underlying (see accounting policy).
81
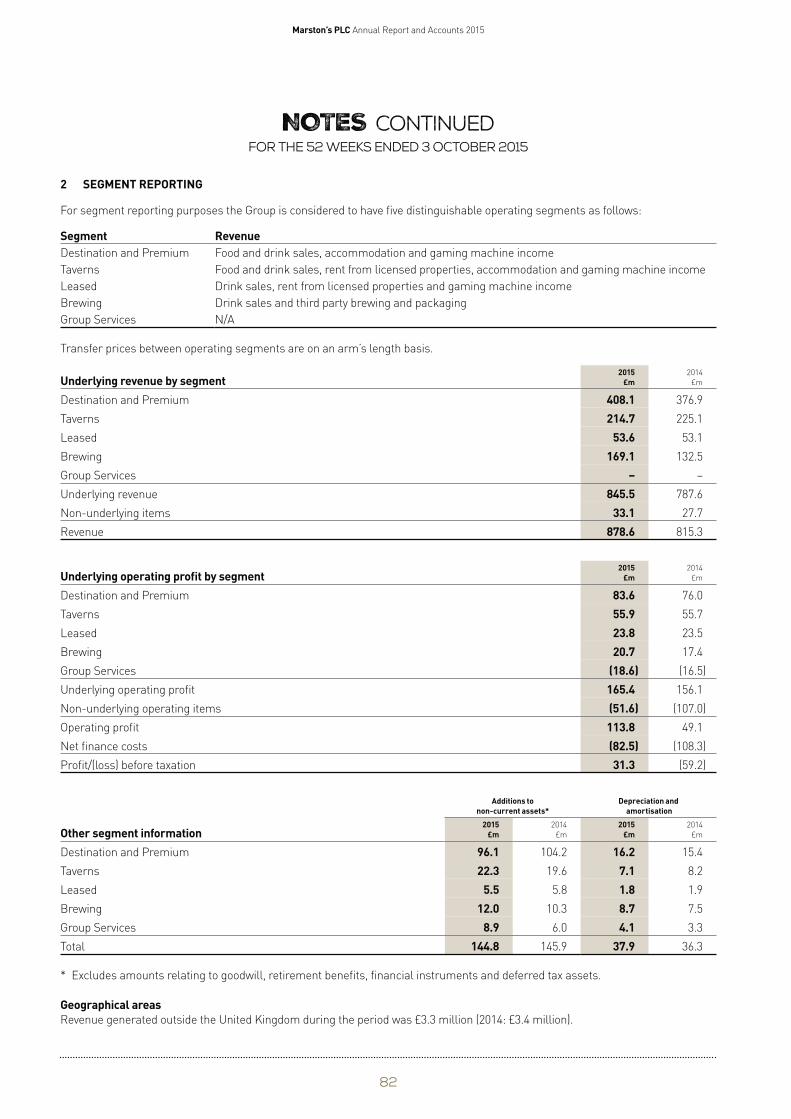
2
Marston’s PLC Annual Report and Accounts 2015
NOTES continued For the 52 weeks ended 3 October 2015
SEGMENT REPORTING
For segment reporting purposes the Group is considered to have five distinguishable operating segments as follows:
Segment Revenue Destination and Premium Food and drink sales, accommodation and gaming machine income
Taverns Food and drink sales, rent from licensed properties, accommodation and gaming machine income
Leased Drink sales, rent from licensed properties and gaming machine income
Brewing Drink sales and third party brewing and packaging
Group Services N/A
Transfer prices between operating segments are on an arm’s length basis.
2015 £m
408.1 214.7
53.6 169.1
– 845.5
33.1 878.6
2015 £m
83.6 55.9 23.8 20.7
(18.6) 165.4 (51.6) 113.8 (82.5) 31.3
Underlying revenue by segment Destination and Premium
Taverns
Leased
Brewing
Group Services
Underlying revenue
Non-underlying items
Revenue
2014
£m
376.9
225.1
53.1
132.5
–
787.6
27.7
815.3
Underlying operating profit by segment Destination and Premium
Taverns
Leased
Brewing
Group Services
Underlying operating profit
Non-underlying operating items
Operating profit
Net finance costs
Profit/(loss) before taxation
2014
£m
76.0
55.7
23.5
17.4
(16.5)
156.1
(107.0)
49.1
(108.3)
(59.2)
Additions to Depreciation and non-current assets* amortisation
2014
Other segment information £m
Destination and Premium 15.4
Taverns 8.2
Leased 1.9
Brewing 7.5
Group Services 3.3
Total 36.3
2015 2014 2015 £m £m £m
96.1 104.2 16.2 22.3 19.6 7.1
5.5 5.8 1.8 12.0 10.3 8.7
8.9 6.0 4.1 144.8 145.9 37.9
* Excludes amounts relating to goodwill, retirement benefits, financial instruments and deferred tax assets.
Geographical areas Revenue generated outside the United Kingdom during the period was £3.3 million (2014: £3.4 million).
82
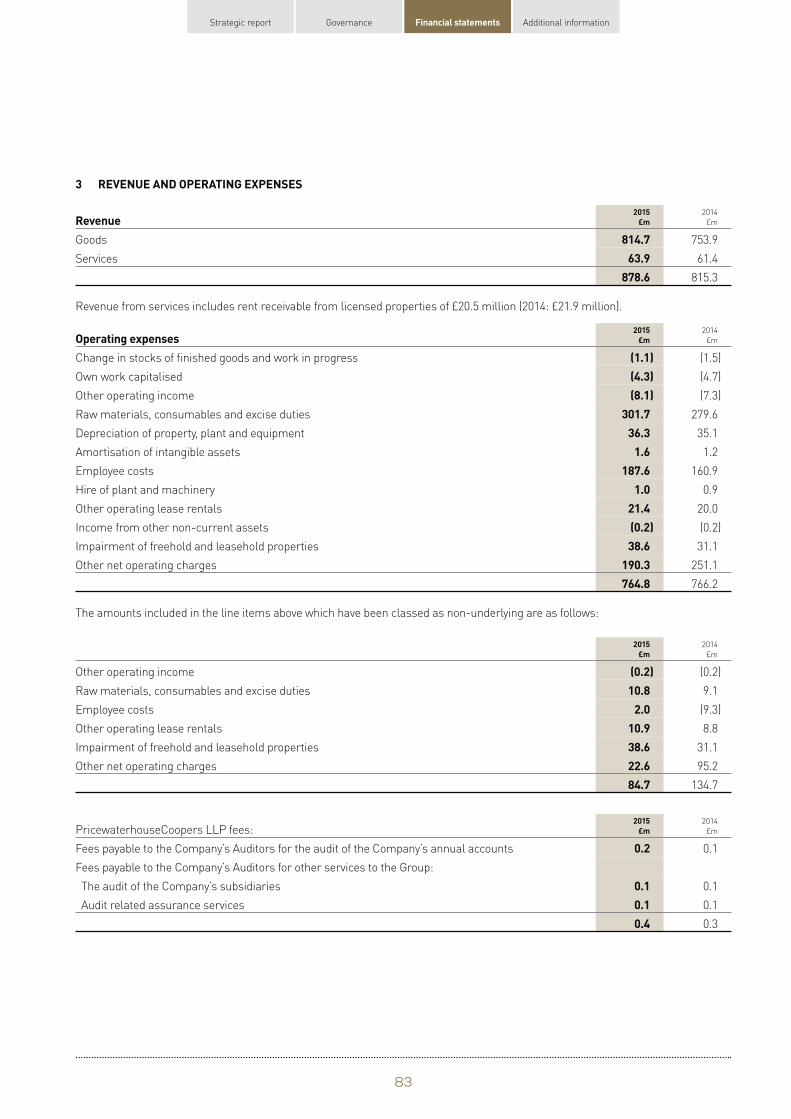
3
Strategic report Governance Financial statements Additional information
REVENUE AND OPERATING EXPENSES
Revenue 2015
£m 2014
£m
Goods 814.7 753.9
Services 63.9 61.4
878.6 815.3
Revenue from services includes rent receivable from licensed properties of £20.5 million (2014: £21.9 million).
2015 £m
(1.1) (4.3) (8.1)
301.7 36.3
1.6 187.6
1.0 21.4 (0.2) 38.6
190.3 764.8
Operating expenses Change in stocks of finished goods and work in progress
Own work capitalised
Other operating income
Raw materials, consumables and excise duties
Depreciation of property, plant and equipment
Amortisation of intangible assets
Employee costs
Hire of plant and machinery
Other operating lease rentals
Income from other non-current assets
Impairment of freehold and leasehold properties
Other net operating charges
2014
£m
(1.5)
(4.7)
(7.3)
279.6
35.1
1.2
160.9
0.9
20.0
(0.2)
31.1
251.1
766.2
The amounts included in the line items above which have been classed as non-underlying are as follows:
2015 £m
2014
£m
Other operating income (0.2) (0.2)
Raw materials, consumables and excise duties 10.8 9.1
Employee costs 2.0 (9.3)
Other operating lease rentals 10.9 8.8
Impairment of freehold and leasehold properties 38.6 31.1
Other net operating charges 22.6 95.2
84.7 134.7
PricewaterhouseCoopers LLP fees: 2015
£m 2014
£m
Fees payable to the Company’s Auditors for the audit of the Company’s annual accounts 0.2 0.1
Fees payable to the Company’s Auditors for other services to the Group:
The audit of the Company’s subsidiaries 0.1 0.1
Audit related assurance services 0.1 0.1
0.4 0.3
83
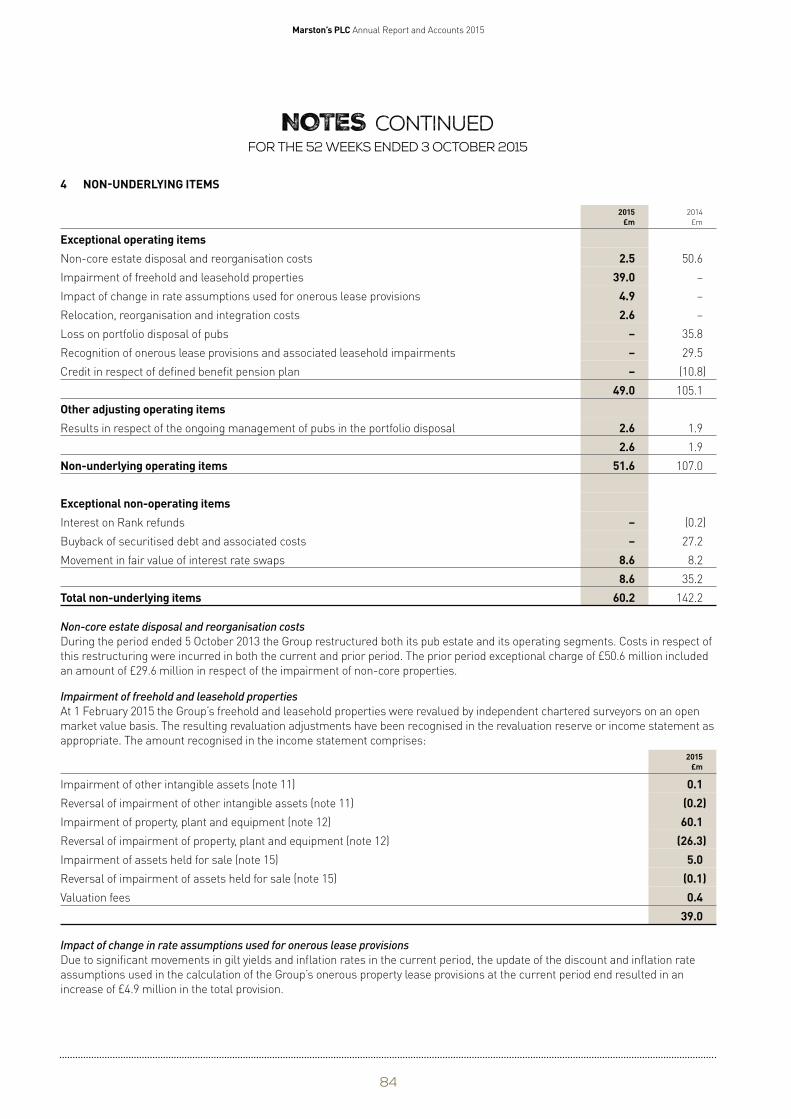
4
Marston’s PLC Annual Report and Accounts 2015
NOTES continued For the 52 weeks ended 3 October 2015
NON-UNDERLYING ITEMS
2015 £m
2.5 39.0
4.9 2.6
– – –
49.0
2.6 2.6
51.6
– –
8.6 8.6
60.2
Exceptional operating items Non-core estate disposal and reorganisation costs
Impairment of freehold and leasehold properties
Impact of change in rate assumptions used for onerous lease provisions
Relocation, reorganisation and integration costs
Loss on portfolio disposal of pubs
Recognition of onerous lease provisions and associated leasehold impairments
Credit in respect of defined benefit pension plan
Other adjusting operating items Results in respect of the ongoing management of pubs in the portfolio disposal
Non-underlying operating items
Exceptional non-operating items Interest on Rank refunds
Buyback of securitised debt and associated costs
Movement in fair value of interest rate swaps
Total non-underlying items
2014
£m
50.6
–
–
–
35.8
29.5
(10.8)
105.1
1.9
1.9
107.0
(0.2)
27.2
8.2
35.2
142.2
Non-core estate disposal and reorganisation costs
During the period ended 5 October 2013 the Group restructured both its pub estate and its operating segments. Costs in respect of
this restructuring were incurred in both the current and prior period. The prior period exceptional charge of £50.6 million included
an amount of £29.6 million in respect of the impairment of non-core properties.
Impairment of freehold and leasehold properties
At 1 February 2015 the Group’s freehold and leasehold properties were revalued by independent chartered surveyors on an open
market value basis. The resulting revaluation adjustments have been recognised in the revaluation reserve or income statement as
appropriate. The amount recognised in the income statement comprises:
2015 £m
0.1 (0.2) 60.1
(26.3) 5.0
(0.1) 0.4
39.0
Impairment of other intangible assets (note 11)
Reversal of impairment of other intangible assets (note 11)
Impairment of property, plant and equipment (note 12)
Reversal of impairment of property, plant and equipment (note 12)
Impairment of assets held for sale (note 15)
Reversal of impairment of assets held for sale (note 15)
Valuation fees
Impact of change in rate assumptions used for onerous lease provisions
Due to significant movements in gilt yields and inflation rates in the current period, the update of the discount and inflation rate
assumptions used in the calculation of the Group’s onerous property lease provisions at the current period end resulted in an
increase of £4.9 million in the total provision.
84
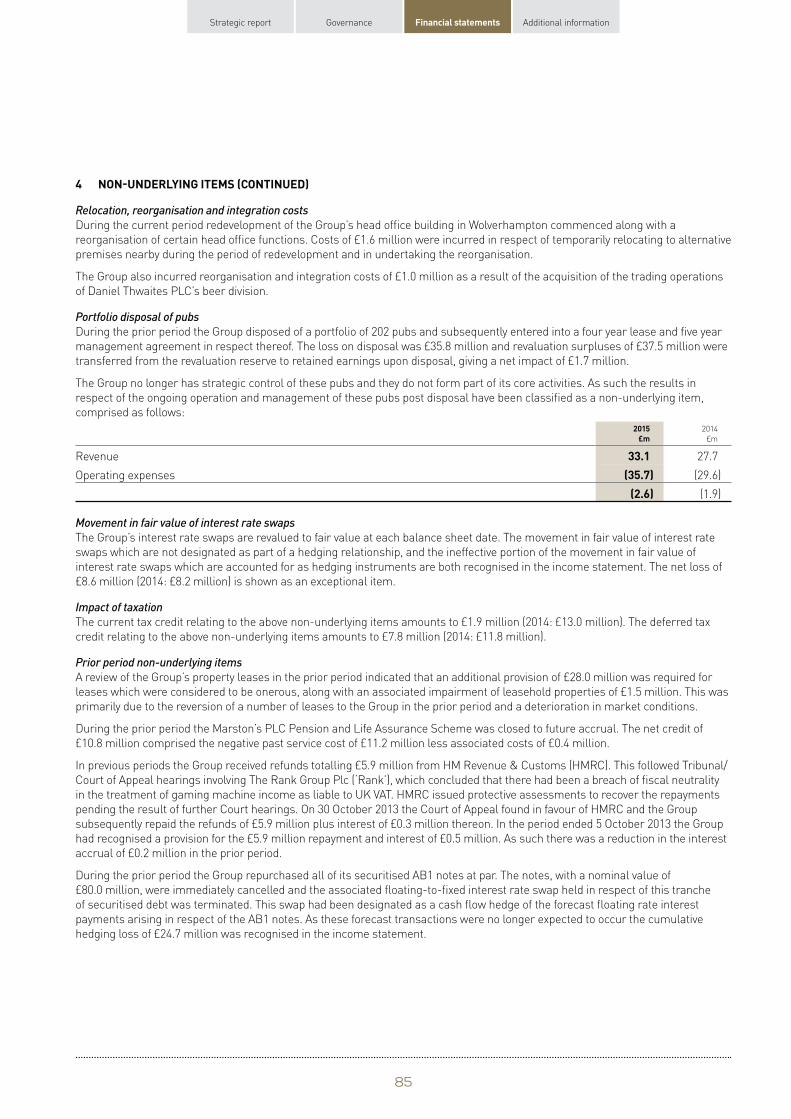
4
Strategic report Governance Financial statements Additional information
NON-UNDERLYING ITEMS (CONTINUED)
Relocation, reorganisation and integration costs
During the current period redevelopment of the Group’s head office building in Wolverhampton commenced along with a
reorganisation of certain head office functions. Costs of £1.6 million were incurred in respect of temporarily relocating to alternative
premises nearby during the period of redevelopment and in undertaking the reorganisation.
The Group also incurred reorganisation and integration costs of £1.0 million as a result of the acquisition of the trading operations
of Daniel Thwaites PLC’s beer division.
Portfolio disposal of pubs
During the prior period the Group disposed of a portfolio of 202 pubs and subsequently entered into a four year lease and five year
management agreement in respect thereof. The loss on disposal was £35.8 million and revaluation surpluses of £37.5 million were
transferred from the revaluation reserve to retained earnings upon disposal, giving a net impact of £1.7 million.
The Group no longer has strategic control of these pubs and they do not form part of its core activities. As such the results in
respect of the ongoing operation and management of these pubs post disposal have been classified as a non-underlying item,
comprised as follows:
2015 £m
2014
£m
Revenue 33.1 27.7
Operating expenses (35.7) (29.6)
(2.6) (1.9)
Movement in fair value of interest rate swaps
The Group’s interest rate swaps are revalued to fair value at each balance sheet date. The movement in fair value of interest rate
swaps which are not designated as part of a hedging relationship, and the ineffective portion of the movement in fair value of
interest rate swaps which are accounted for as hedging instruments are both recognised in the income statement. The net loss of
£8.6 million (2014: £8.2 million) is shown as an exceptional item.
Impact of taxation
The current tax credit relating to the above non-underlying items amounts to £1.9 million (2014: £13.0 million). The deferred tax
credit relating to the above non-underlying items amounts to £7.8 million (2014: £11.8 million).
Prior period non-underlying items
A review of the Group’s property leases in the prior period indicated that an additional provision of £28.0 million was required for
leases which were considered to be onerous, along with an associated impairment of leasehold properties of £1.5 million. This was
primarily due to the reversion of a number of leases to the Group in the prior period and a deterioration in market conditions.
During the prior period the Marston’s PLC Pension and Life Assurance Scheme was closed to future accrual. The net credit of
£10.8 million comprised the negative past service cost of £11.2 million less associated costs of £0.4 million.
In previous periods the Group received refunds totalling £5.9 million from HM Revenue & Customs (HMRC). This followed Tribunal/
Court of Appeal hearings involving The Rank Group Plc (‘Rank’), which concluded that there had been a breach of fiscal neutrality
in the treatment of gaming machine income as liable to UK VAT. HMRC issued protective assessments to recover the repayments
pending the result of further Court hearings. On 30 October 2013 the Court of Appeal found in favour of HMRC and the Group
subsequently repaid the refunds of £5.9 million plus interest of £0.3 million thereon. In the period ended 5 October 2013 the Group
had recognised a provision for the £5.9 million repayment and interest of £0.5 million. As such there was a reduction in the interest
accrual of £0.2 million in the prior period.
During the prior period the Group repurchased all of its securitised AB1 notes at par. The notes, with a nominal value of
£80.0 million, were immediately cancelled and the associated floating-to-fixed interest rate swap held in respect of this tranche
of securitised debt was terminated. This swap had been designated as a cash flow hedge of the forecast floating rate interest
payments arising in respect of the AB1 notes. As these forecast transactions were no longer expected to occur the cumulative
hedging loss of £24.7 million was recognised in the income statement.
85
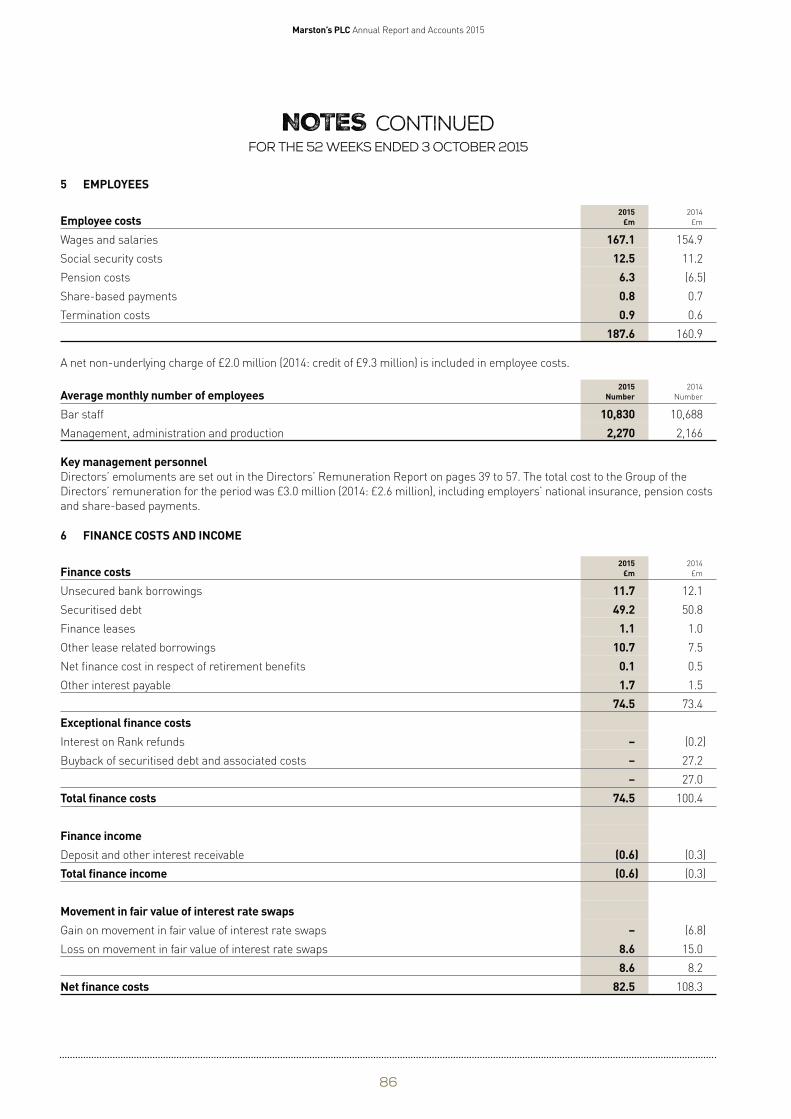
5
6
Marston’s PLC Annual Report and Accounts 2015
NOTES continued For the 52 weeks ended 3 October 2015
EMPLOYEES
Employee costs Wages and salaries
Social security costs
Pension costs
Share-based payments
Termination costs
2015 Number
10,830 2,270
2015 £m
167.1 12.5
6.3 0.8 0.9
187.6
A net non-underlying charge of £2.0 million (2014: credit of £9.3 million) is included in employee costs.
Average monthly number of employees Bar staff
Management, administration and production
2014
£m
154.9
11.2
(6.5)
0.7
0.6
160.9
2014
Number
10,688
2,166
Key management personnel Directors’ emoluments are set out in the Directors’ Remuneration Report on pages 39 to 57. The total cost to the Group of the
Directors’ remuneration for the period was £3.0 million (2014: £2.6 million), including employers’ national insurance, pension costs
and share-based payments.
FINANCE COSTS AND INCOME
Finance costs Unsecured bank borrowings
Securitised debt
Finance leases
Other lease related borrowings
Net finance cost in respect of retirement benefits
Other interest payable
Exceptional finance costs Interest on Rank refunds
Buyback of securitised debt and associated costs
Total finance costs
Finance income Deposit and other interest receivable
Total finance income
Movement in fair value of interest rate swaps Gain on movement in fair value of interest rate swaps
Loss on movement in fair value of interest rate swaps
Net finance costs
2015 £m
2014
£m
11.7 12.1
49.2 50.8
1.1 1.0
10.7 7.5
0.1 0.5
1.7 1.5
74.5 73.4
– (0.2)
– 27.2
– 27.0
74.5 100.4
(0.6) (0.3)
(0.6) (0.3)
– (6.8)
8.6 15.0
8.6 8.2
82.5 108.3
86
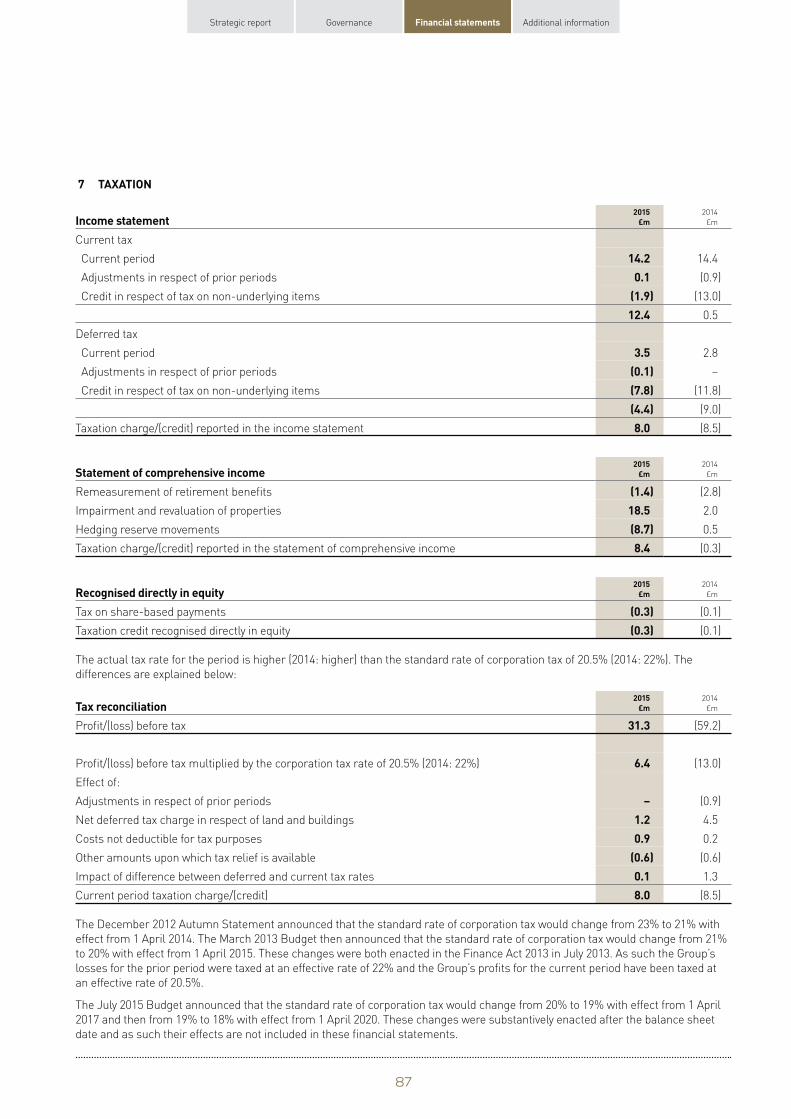
7
Strategic report Governance Financial statements Additional information
TAXATION
Income statement 2015
£m
Current tax
Current period 14.2 Adjustments in respect of prior periods 0.1 Credit in respect of tax on non-underlying items (1.9)
12.4 Deferred tax
Current period 3.5 Adjustments in respect of prior periods (0.1) Credit in respect of tax on non-underlying items (7.8)
(4.4) Taxation charge/(credit) reported in the income statement 8.0
2015 £m
(1.4) 18.5 (8.7) 8.4
Statement of comprehensive income Remeasurement of retirement benefits
Impairment and revaluation of properties
Hedging reserve movements
Taxation charge/(credit) reported in the statement of comprehensive income
Recognised directly in equity Tax on share-based payments
Taxation credit recognised directly in equity
2015 £m
2014
£m
(0.3) (0.1)
(0.3) (0.1)
2014
£m
14.4
(0.9)
(13.0)
0.5
2.8
–
(11.8)
(9.0)
(8.5)
2014
£m
(2.8)
2.0
0.5
(0.3)
The actual tax rate for the period is higher (2014: higher) than the standard rate of corporation tax of 20.5% (2014: 22%). The
differences are explained below:
2015 £m
31.3
6.4
– 1.2 0.9
(0.6) 0.1 8.0
Tax reconciliation Profit/(loss) before tax
Profit/(loss) before tax multiplied by the corporation tax rate of 20.5% (2014: 22%)
Effect of:
Adjustments in respect of prior periods
Net deferred tax charge in respect of land and buildings
Costs not deductible for tax purposes
Other amounts upon which tax relief is available
Impact of difference between deferred and current tax rates
Current period taxation charge/(credit)
2014
£m
(59.2)
(13.0)
(0.9)
4.5
0.2
(0.6)
1.3
(8.5)
The December 2012 Autumn Statement announced that the standard rate of corporation tax would change from 23% to 21% with
effect from 1 April 2014. The March 2013 Budget then announced that the standard rate of corporation tax would change from 21%
to 20% with effect from 1 April 2015. These changes were both enacted in the Finance Act 2013 in July 2013. As such the Group’s
losses for the prior period were taxed at an effective rate of 22% and the Group’s profits for the current period have been taxed at
an effective rate of 20.5%.
The July 2015 Budget announced that the standard rate of corporation tax would change from 20% to 19% with effect from 1 April
2017 and then from 19% to 18% with effect from 1 April 2020. These changes were substantively enacted after the balance sheet
date and as such their effects are not included in these financial statements.
87
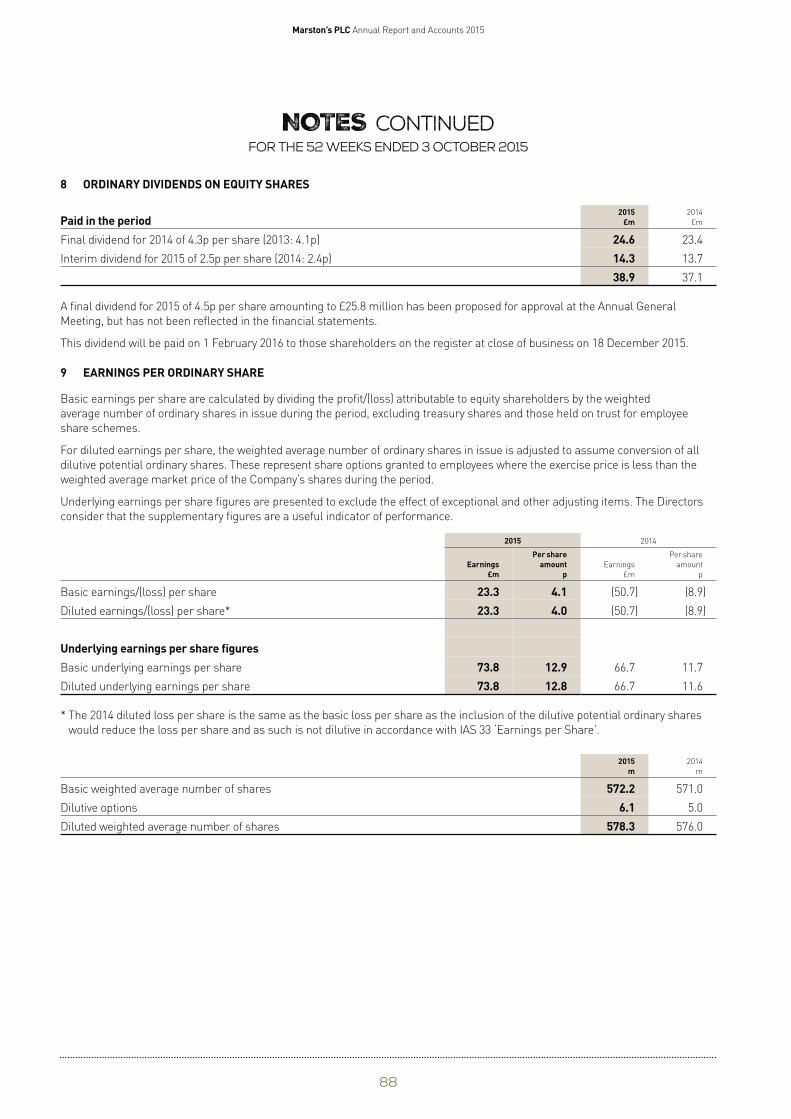
8
9
Marston’s PLC Annual Report and Accounts 2015
NOTES continued For the 52 weeks ended 3 October 2015
ORDINARY DIVIDENDS ON EQUITY SHARES
Paid in the period 2015
£m 2014
£m
Final dividend for 2014 of 4.3p per share (2013: 4.1p) 24.6 23.4
Interim dividend for 2015 of 2.5p per share (2014: 2.4p) 14.3 13.7
38.9 37.1
A final dividend for 2015 of 4.5p per share amounting to £25.8 million has been proposed for approval at the Annual General
Meeting, but has not been reflected in the financial statements.
This dividend will be paid on 1 February 2016 to those shareholders on the register at close of business on 18 December 2015.
EARNINGS PER ORDINARY SHARE
Basic earnings per share are calculated by dividing the profit/(loss) attributable to equity shareholders by the weighted
average number of ordinary shares in issue during the period, excluding treasury shares and those held on trust for employee
share schemes.
For diluted earnings per share, the weighted average number of ordinary shares in issue is adjusted to assume conversion of all
dilutive potential ordinary shares. These represent share options granted to employees where the exercise price is less than the
weighted average market price of the Company’s shares during the period.
Underlying earnings per share figures are presented to exclude the effect of exceptional and other adjusting items. The Directors
consider that the supplementary figures are a useful indicator of performance.
2015 2014
Earnings £m
Per share amount
p Earnings
£m
Per share
amount
p
Basic earnings/(loss) per share 23.3 4.1 (50.7) (8.9)
Diluted earnings/(loss) per share* 23.3 4.0 (50.7) (8.9)
Underlying earnings per share figures Basic underlying earnings per share 73.8 12.9 66.7 11.7
Diluted underlying earnings per share 73.8 12.8 66.7 11.6
* The 2014 diluted loss per share is the same as the basic loss per share as the inclusion of the dilutive potential ordinary shares
would reduce the loss per share and as such is not dilutive in accordance with IAS 33 ‘Earnings per Share’.
2015 m
2014
m
Basic weighted average number of shares 572.2 571.0
Dilutive options 6.1 5.0
Diluted weighted average number of shares 578.3 576.0
88
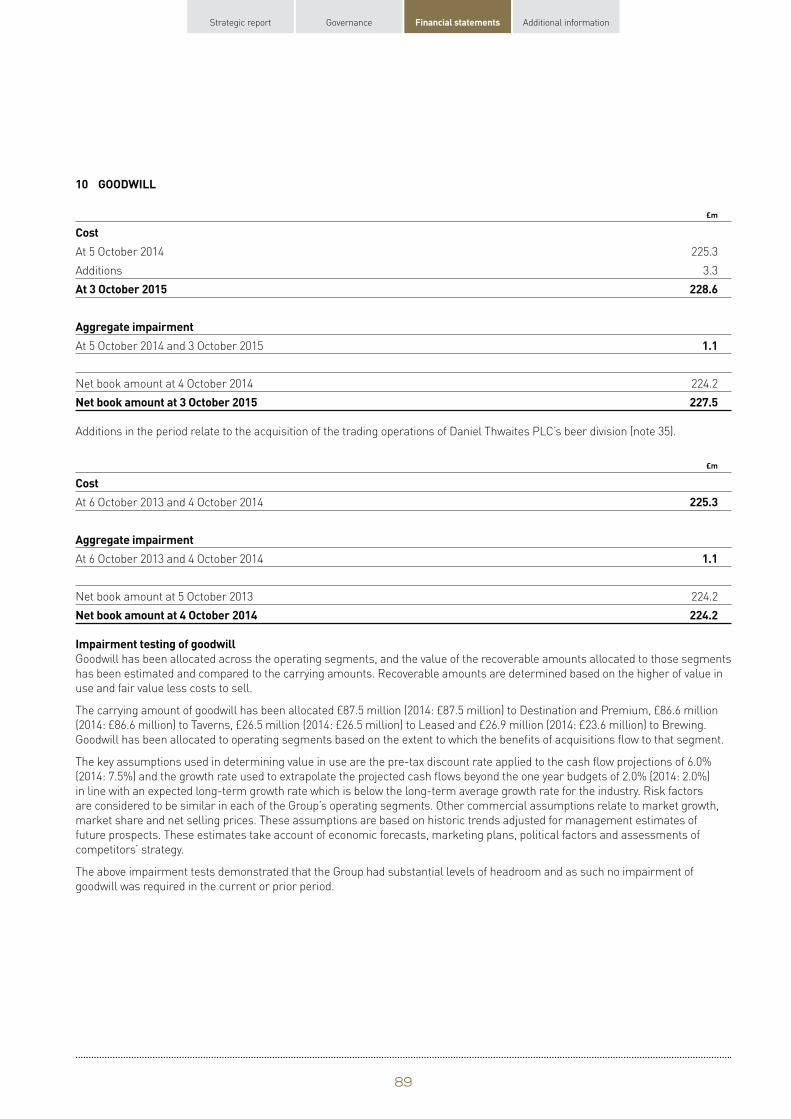
Strategic report Governance Financial statements Additional information
10 GOODWILL
£m
Cost At 5 October 2014 225.3
Additions 3.3
At 3 October 2015 228.6
Aggregate impairment At 5 October 2014 and 3 October 2015
Net book amount at 4 October 2014 224.2
Net book amount at 3 October 2015 227.5
Additions in the period relate to the acquisition of the trading operations of Daniel Thwaites PLC’s beer division (note 35).
£m
Cost At 6 October 2013 and 4 October 2014
Aggregate impairment At 6 October 2013 and 4 October 2014
Net book amount at 5 October 2013 224.2
Net book amount at 4 October 2014 224.2
Impairment testing of goodwill Goodwill has been allocated across the operating segments, and the value of the recoverable amounts allocated to those segments
has been estimated and compared to the carrying amounts. Recoverable amounts are determined based on the higher of value in
use and fair value less costs to sell.
The carrying amount of goodwill has been allocated £87.5 million (2014: £87.5 million) to Destination and Premium, £86.6 million
(2014: £86.6 million) to Taverns, £26.5 million (2014: £26.5 million) to Leased and £26.9 million (2014: £23.6 million) to Brewing.
Goodwill has been allocated to operating segments based on the extent to which the benefits of acquisitions flow to that segment.
The key assumptions used in determining value in use are the pre-tax discount rate applied to the cash flow projections of 6.0%
(2014: 7.5%) and the growth rate used to extrapolate the projected cash flows beyond the one year budgets of 2.0% (2014: 2.0%)
in line with an expected long-term growth rate which is below the long-term average growth rate for the industry. Risk factors
are considered to be similar in each of the Group’s operating segments. Other commercial assumptions relate to market growth,
market share and net selling prices. These assumptions are based on historic trends adjusted for management estimates of
future prospects. These estimates take account of economic forecasts, marketing plans, political factors and assessments of
competitors’ strategy.
The above impairment tests demonstrated that the Group had substantial levels of headroom and as such no impairment of
goodwill was required in the current or prior period.
89
1.1
225.3
1.1
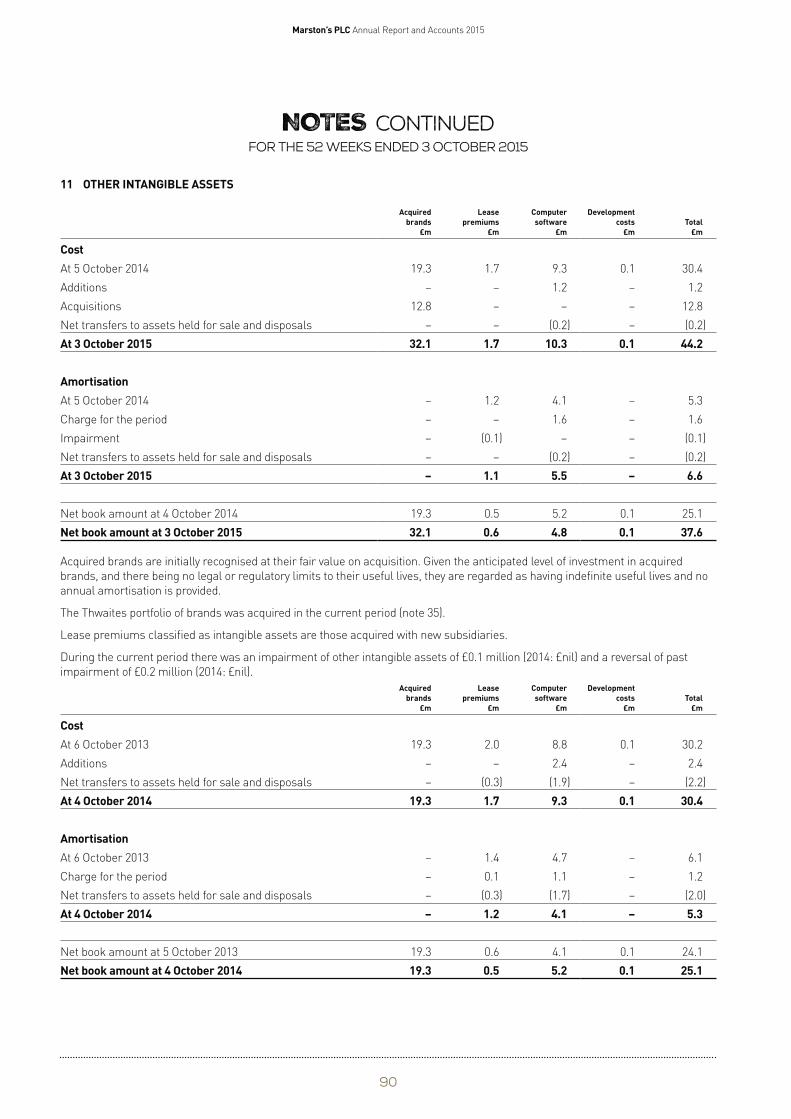
Marston’s PLC Annual Report and Accounts 2015
NOTES continued For the 52 weeks ended 3 October 2015
11 OTHER INTANGIBLE ASSETS
Acquired Lease Computer Development brands premiums software costs Total
£m £m £m £m £m
Cost At 5 October 2014 19.3 1.7 9.3 0.1 30.4
Additions – – 1.2 – 1.2
Acquisitions 12.8 – – – 12.8
Net transfers to assets held for sale and disposals – – (0.2) – (0.2)
At 3 October 2015 32.1 1.7 10.3 0.1 44.2
Amortisation At 5 October 2014 – 1.2 4.1 – 5.3
Charge for the period – – 1.6 – 1.6
Impairment – (0.1) – – (0.1)
Net transfers to assets held for sale and disposals – – (0.2) – (0.2)
At 3 October 2015 – 1.1 5.5 – 6.6
Net book amount at 4 October 2014 19.3 0.5 5.2 0.1 25.1
Net book amount at 3 October 2015 32.1 0.6 4.8 0.1 37.6
Acquired brands are initially recognised at their fair value on acquisition. Given the anticipated level of investment in acquired
brands, and there being no legal or regulatory limits to their useful lives, they are regarded as having indefinite useful lives and no
annual amortisation is provided.
The Thwaites portfolio of brands was acquired in the current period (note 35).
Lease premiums classified as intangible assets are those acquired with new subsidiaries.
During the current period there was an impairment of other intangible assets of £0.1 million (2014: £nil) and a reversal of past
impairment of £0.2 million (2014: £nil).
Acquired Lease Computer Development brands premiums software costs Total
£m £m £m £m £m
Cost At 6 October 2013 19.3 2.0 8.8 0.1 30.2
Additions – – 2.4 – 2.4
Net transfers to assets held for sale and disposals – (0.3) (1.9) – (2.2)
At 4 October 2014 19.3 1.7 9.3 0.1 30.4
Amortisation At 6 October 2013 – 1.4 4.7 – 6.1
Charge for the period – 0.1 1.1 – 1.2
Net transfers to assets held for sale and disposals – (0.3) (1.7) – (2.0)
At 4 October 2014 – 1.2 4.1 – 5.3
Net book amount at 5 October 2013 19.3 0.6 4.1 0.1 24.1
Net book amount at 4 October 2014 19.3 0.5 5.2 0.1 25.1
90
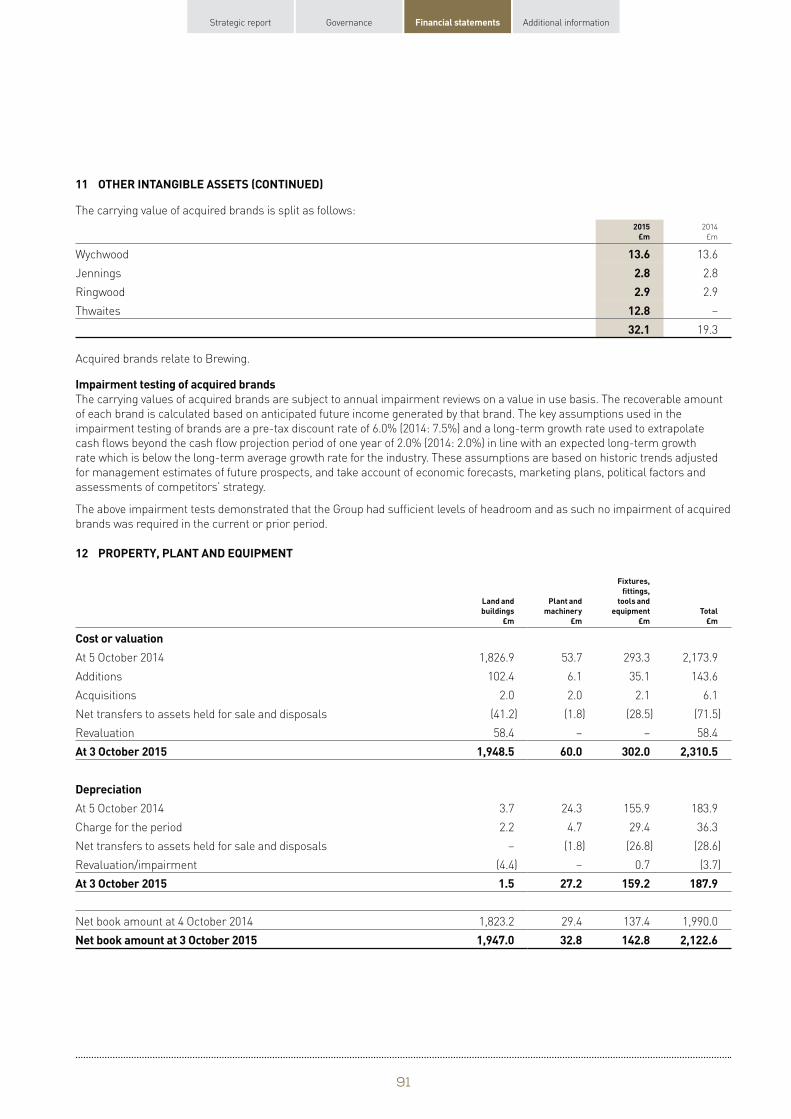
Strategic report Governance Financial statements Additional information
11 OTHER INTANGIBLE ASSETS (CONTINUED)
The carrying value of acquired brands is split as follows:
2014
£m
Wychwood 13.6
Jennings 2.8
Ringwood 2.9
Thwaites –
19.3
2015 £m
13.6 2.8 2.9
12.8 32.1
Acquired brands relate to Brewing.
Impairment testing of acquired brands The carrying values of acquired brands are subject to annual impairment reviews on a value in use basis. The recoverable amount
of each brand is calculated based on anticipated future income generated by that brand. The key assumptions used in the
impairment testing of brands are a pre-tax discount rate of 6.0% (2014: 7.5%) and a long-term growth rate used to extrapolate
cash flows beyond the cash flow projection period of one year of 2.0% (2014: 2.0%) in line with an expected long-term growth
rate which is below the long-term average growth rate for the industry. These assumptions are based on historic trends adjusted
for management estimates of future prospects, and take account of economic forecasts, marketing plans, political factors and
assessments of competitors’ strategy.
The above impairment tests demonstrated that the Group had sufficient levels of headroom and as such no impairment of acquired
brands was required in the current or prior period.
12 PROPERTY, PLANT AND EQUIPMENT
Fixtures, fittings,
Land and Plant and tools and buildings machinery equipment Total
£m £m £m £m
Cost or valuation At 5 October 2014 1,826.9 53.7 293.3 2,173.9
Additions 102.4 6.1 35.1 143.6
Acquisitions 2.0 2.0 2.1 6.1
Net transfers to assets held for sale and disposals (41.2) (1.8) (28.5) (71.5)
Revaluation 58.4 – – 58.4
At 3 October 2015 1,948.5 60.0 302.0 2,310.5
Depreciation At 5 October 2014 3.7 24.3 155.9 183.9
Charge for the period 2.2 4.7 29.4 36.3
Net transfers to assets held for sale and disposals – (1.8) (26.8) (28.6)
Revaluation/impairment (4.4) – 0.7 (3.7)
At 3 October 2015 1.5 27.2 159.2 187.9
Net book amount at 4 October 2014 1,823.2 29.4 137.4 1,990.0
Net book amount at 3 October 2015 1,947.0 32.8 142.8 2,122.6
91
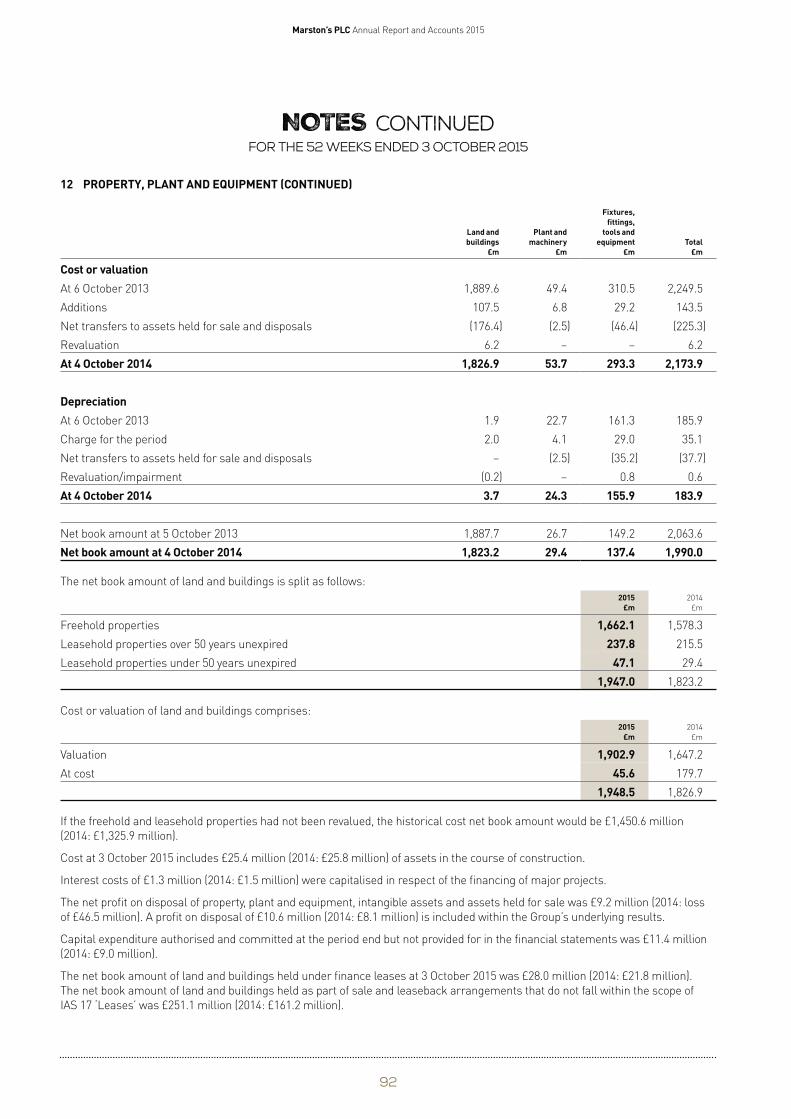
Marston’s PLC Annual Report and Accounts 2015
NOTES continued For the 52 weeks ended 3 October 2015
12 PROPERTY, PLANT AND EQUIPMENT (CONTINUED)
Land and buildings
£m
Plant and machinery
£m
Fixtures, fittings,
tools and equipment
£m Total
£m
Cost or valuation At 6 October 2013 1,889.6 49.4 310.5 2,249.5
Additions 107.5 6.8 29.2 143.5
Net transfers to assets held for sale and disposals (176.4) (2.5) (46.4) (225.3)
Revaluation 6.2 – – 6.2
At 4 October 2014 1,826.9 53.7 293.3 2,173.9
Depreciation At 6 October 2013 1.9 22.7 161.3 185.9
Charge for the period 2.0 4.1 29.0 35.1
Net transfers to assets held for sale and disposals – (2.5) (35.2) (37.7)
Revaluation/impairment (0.2) – 0.8 0.6
At 4 October 2014 3.7 24.3 155.9 183.9
Net book amount at 5 October 2013 1,887.7 26.7 149.2 2,063.6
Net book amount at 4 October 2014 1,823.2 29.4 137.4 1,990.0
The net book amount of land and buildings is split as follows:
2014
£m
Freehold properties 1,578.3
Leasehold properties over 50 years unexpired 215.5
Leasehold properties under 50 years unexpired 29.4
1,823.2
2015 £m
1,662.1 237.8
47.1 1,947.0
Cost or valuation of land and buildings comprises:
2014
£m
Valuation 1,647.2
At cost 179.7
1,826.9
2015 £m
1,902.9 45.6
1,948.5
If the freehold and leasehold properties had not been revalued, the historical cost net book amount would be £1,450.6 million
(2014: £1,325.9 million).
Cost at 3 October 2015 includes £25.4 million (2014: £25.8 million) of assets in the course of construction.
Interest costs of £1.3 million (2014: £1.5 million) were capitalised in respect of the financing of major projects.
The net profit on disposal of property, plant and equipment, intangible assets and assets held for sale was £9.2 million (2014: loss
of £46.5 million). A profit on disposal of £10.6 million (2014: £8.1 million) is included within the Group’s underlying results.
Capital expenditure authorised and committed at the period end but not provided for in the financial statements was £11.4 million
(2014: £9.0 million).
The net book amount of land and buildings held under finance leases at 3 October 2015 was £28.0 million (2014: £21.8 million).
The net book amount of land and buildings held as part of sale and leaseback arrangements that do not fall within the scope of
IAS 17 ‘Leases’ was £251.1 million (2014: £161.2 million).
92
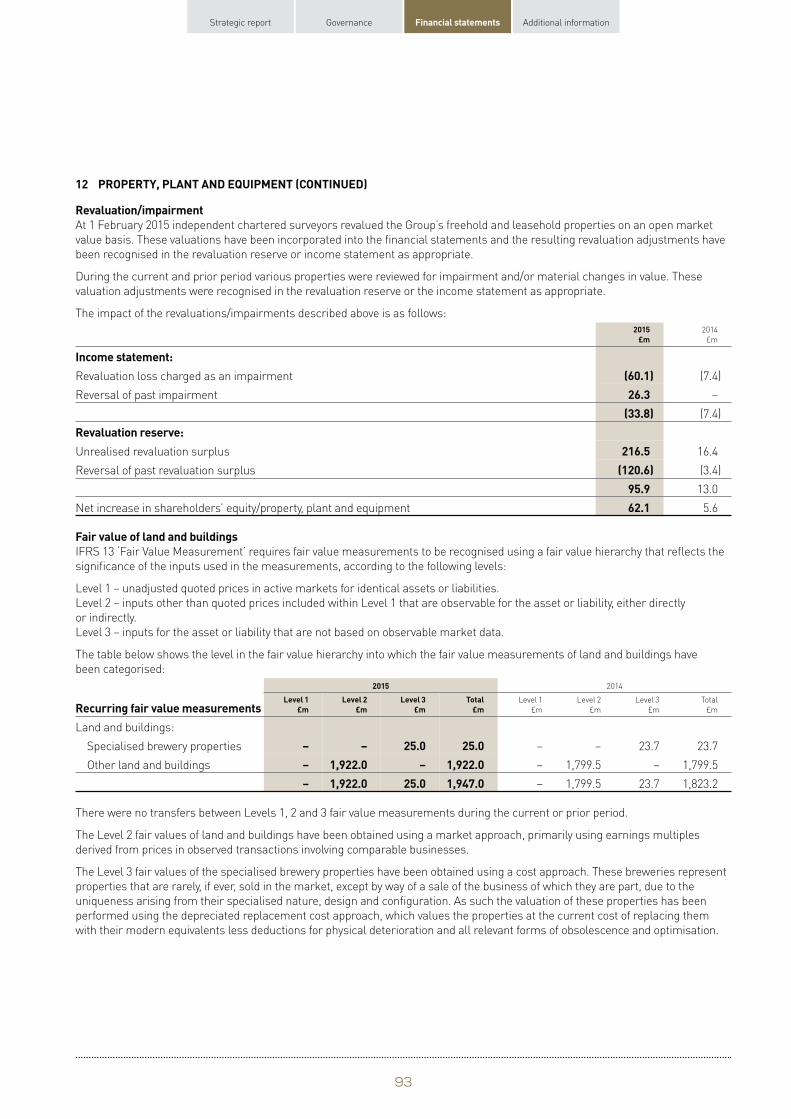
Strategic report Governance Financial statements Additional information
12 PROPERTY, PLANT AND EQUIPMENT (CONTINUED)
Revaluation/impairment At 1 February 2015 independent chartered surveyors revalued the Group’s freehold and leasehold properties on an open market
value basis. These valuations have been incorporated into the financial statements and the resulting revaluation adjustments have
been recognised in the revaluation reserve or income statement as appropriate.
During the current and prior period various properties were reviewed for impairment and/or material changes in value. These
valuation adjustments were recognised in the revaluation reserve or the income statement as appropriate.
The impact of the revaluations/impairments described above is as follows:
2014
£m
Income statement: Revaluation loss charged as an impairment (7.4)
Reversal of past impairment –
(7.4)
Revaluation reserve: Unrealised revaluation surplus 16.4
Reversal of past revaluation surplus (3.4)
13.0
Net increase in shareholders’ equity/property, plant and equipment 5.6
2015 £m
(60.1) 26.3
(33.8)
216.5 (120.6)
95.9 62.1
Fair value of land and buildings IFRS 13 ‘Fair Value Measurement’ requires fair value measurements to be recognised using a fair value hierarchy that reflects the
significance of the inputs used in the measurements, according to the following levels:
Level 1 – unadjusted quoted prices in active markets for identical assets or liabilities.
Level 2 – inputs other than quoted prices included within Level 1 that are observable for the asset or liability, either directly
or indirectly.
Level 3 – inputs for the asset or liability that are not based on observable market data.
The table below shows the level in the fair value hierarchy into which the fair value measurements of land and buildings have
been categorised:
2014
Level 1 Level 2 Level 3 Total
Recurring fair value measurements £m £m £m £m
Land and buildings:
Specialised brewery properties – – 23.7 23.7
Other land and buildings – 1,799.5 – 1,799.5
– 1,799.5 23.7 1,823.2
2015
Level 1 Level 2 Level 3 Total £m £m £m £m
– – 25.0 25.0 – 1,922.0 – 1,922.0 – 1,922.0 25.0 1,947.0
There were no transfers between Levels 1, 2 and 3 fair value measurements during the current or prior period.
The Level 2 fair values of land and buildings have been obtained using a market approach, primarily using earnings multiples
derived from prices in observed transactions involving comparable businesses.
The Level 3 fair values of the specialised brewery properties have been obtained using a cost approach. These breweries represent
properties that are rarely, if ever, sold in the market, except by way of a sale of the business of which they are part, due to the
uniqueness arising from their specialised nature, design and configuration. As such the valuation of these properties has been
performed using the depreciated replacement cost approach, which values the properties at the current cost of replacing them
with their modern equivalents less deductions for physical deterioration and all relevant forms of obsolescence and optimisation.
93
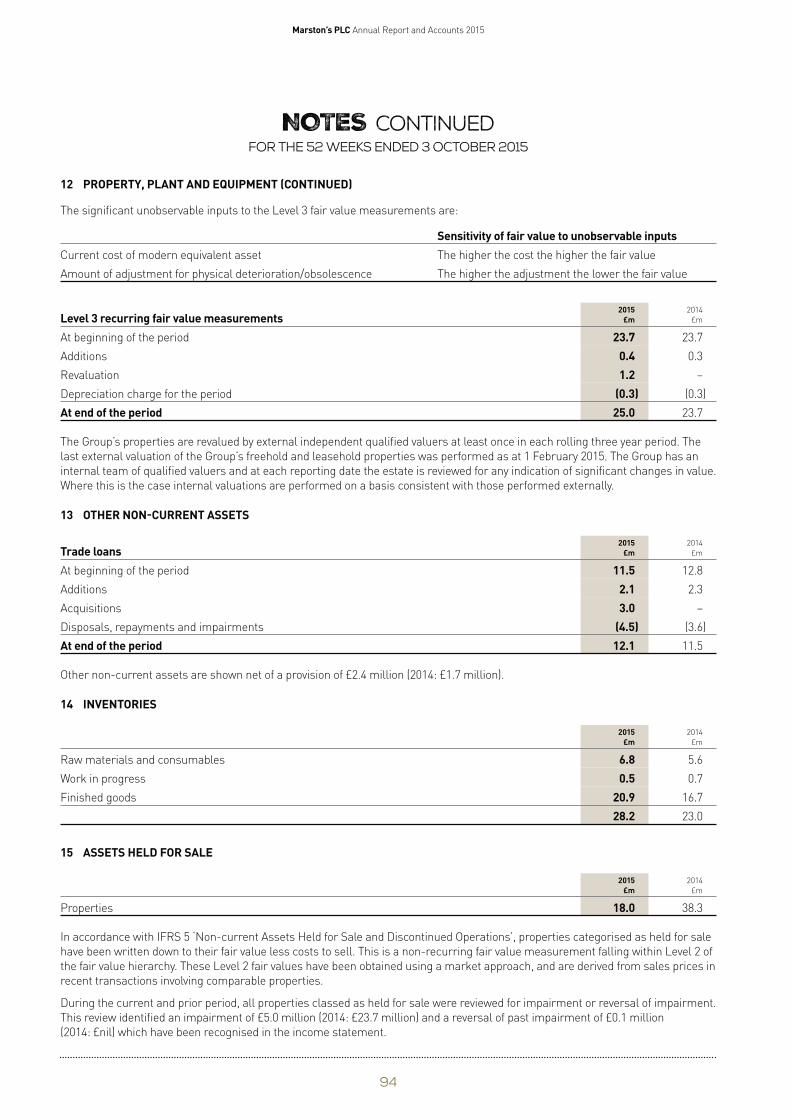
Marston’s PLC Annual Report and Accounts 2015
NOTES continued For the 52 weeks ended 3 October 2015
12 PROPERTY, PLANT AND EQUIPMENT (CONTINUED)
The significant unobservable inputs to the Level 3 fair value measurements are:
Sensitivity of fair value to unobservable inputs Current cost of modern equivalent asset The higher the cost the higher the fair value
Amount of adjustment for physical deterioration/obsolescence The higher the adjustment the lower the fair value
2014
Level 3 recurring fair value measurements £m
At beginning of the period 23.7
Additions 0.3
Revaluation –
Depreciation charge for the period (0.3)
At end of the period 23.7
2015 £m
23.7 0.4 1.2
(0.3) 25.0
The Group’s properties are revalued by external independent qualified valuers at least once in each rolling three year period. The
last external valuation of the Group’s freehold and leasehold properties was performed as at 1 February 2015. The Group has an
internal team of qualified valuers and at each reporting date the estate is reviewed for any indication of significant changes in value.
Where this is the case internal valuations are performed on a basis consistent with those performed externally.
13 OTHER NON-CURRENT ASSETS
Trade loans 2015
£m 2014
£m
At beginning of the period 11.5 12.8
Additions 2.1 2.3
Acquisitions 3.0 –
Disposals, repayments and impairments (4.5) (3.6)
At end of the period 12.1 11.5
Other non-current assets are shown net of a provision of £2.4 million (2014: £1.7 million).
14 INVENTORIES
2015 £m
2014
£m
Raw materials and consumables 6.8 5.6
Work in progress 0.5 0.7
Finished goods 20.9 16.7
28.2 23.0
15 ASSETS HELD FOR SALE
2015 £m
2014
£m
Properties 18.0 38.3
In accordance with IFRS 5 ‘Non-current Assets Held for Sale and Discontinued Operations’, properties categorised as held for sale
have been written down to their fair value less costs to sell. This is a non-recurring fair value measurement falling within Level 2 of
the fair value hierarchy. These Level 2 fair values have been obtained using a market approach, and are derived from sales prices in
recent transactions involving comparable properties.
During the current and prior period, all properties classed as held for sale were reviewed for impairment or reversal of impairment.
This review identified an impairment of £5.0 million (2014: £23.7 million) and a reversal of past impairment of £0.1 million
(2014: £nil) which have been recognised in the income statement.
94
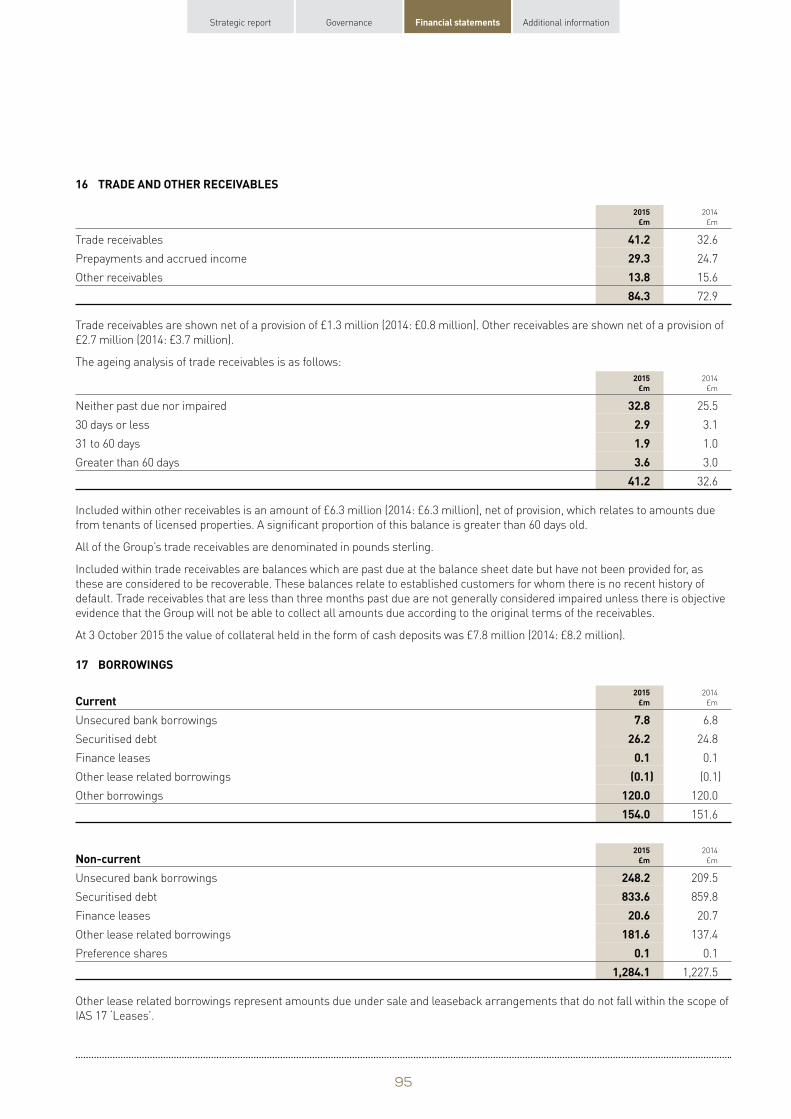
Strategic report Governance Financial statements Additional information
16 TRADE AND OTHER RECEIVABLES
2015 £m
2014
£m
Trade receivables 41.2 32.6
Prepayments and accrued income 29.3 24.7
Other receivables 13.8 15.6
84.3 72.9
Trade receivables are shown net of a provision of £1.3 million (2014: £0.8 million). Other receivables are shown net of a provision of
£2.7 million (2014: £3.7 million).
The ageing analysis of trade receivables is as follows:
2014
£m
Neither past due nor impaired 25.5
30 days or less 3.1
31 to 60 days 1.0
Greater than 60 days 3.0
32.6
2015 £m
32.8 2.9 1.9 3.6
41.2
Included within other receivables is an amount of £6.3 million (2014: £6.3 million), net of provision, which relates to amounts due
from tenants of licensed properties. A significant proportion of this balance is greater than 60 days old.
All of the Group’s trade receivables are denominated in pounds sterling.
Included within trade receivables are balances which are past due at the balance sheet date but have not been provided for, as
these are considered to be recoverable. These balances relate to established customers for whom there is no recent history of
default. Trade receivables that are less than three months past due are not generally considered impaired unless there is objective
evidence that the Group will not be able to collect all amounts due according to the original terms of the receivables.
At 3 October 2015 the value of collateral held in the form of cash deposits was £7.8 million (2014: £8.2 million).
17 BORROWINGS
Current 2015
£m 2014
£m
Unsecured bank borrowings 7.8 6.8
Securitised debt 26.2 24.8
Finance leases 0.1 0.1
Other lease related borrowings (0.1) (0.1)
Other borrowings 120.0 120.0
154.0 151.6
Non-current 2015
£m 2014
£m
Unsecured bank borrowings 248.2 209.5
Securitised debt 833.6 859.8
Finance leases 20.6 20.7
Other lease related borrowings 181.6 137.4
Preference shares 0.1 0.1
1,284.1 1,227.5
Other lease related borrowings represent amounts due under sale and leaseback arrangements that do not fall within the scope of
IAS 17 ‘Leases’.
95
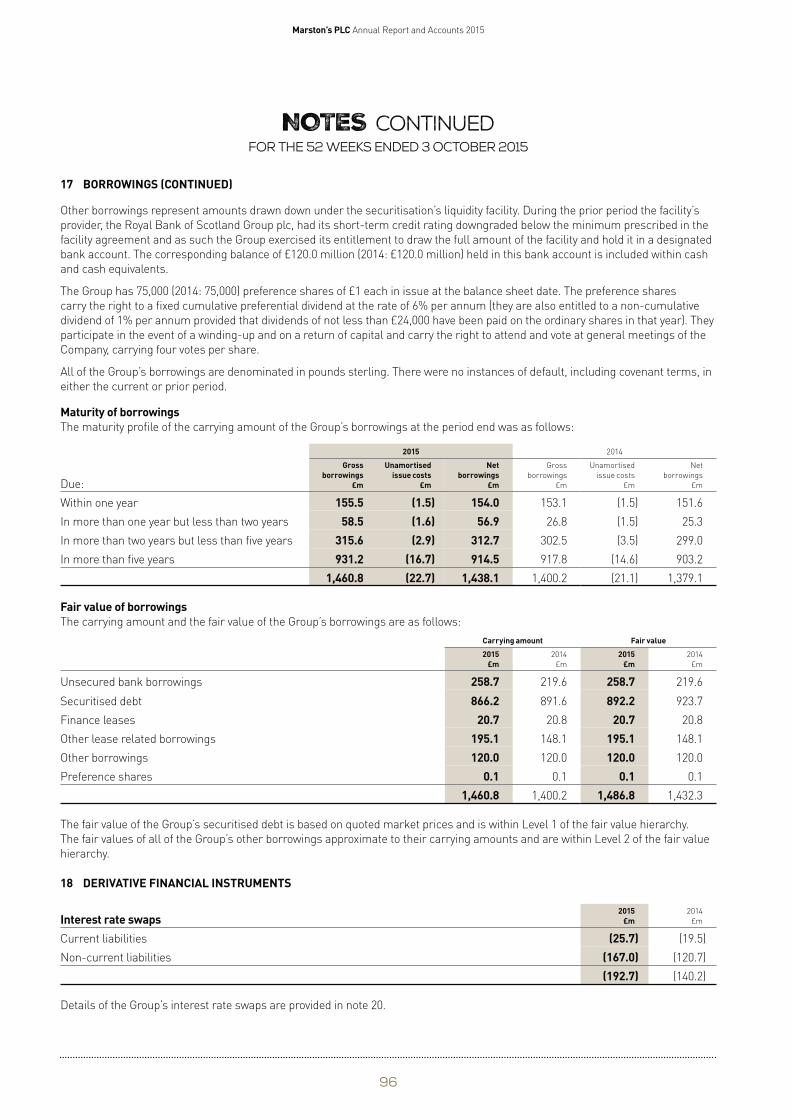
Marston’s PLC Annual Report and Accounts 2015
NOTES continued For the 52 weeks ended 3 October 2015
17 BORROWINGS (CONTINUED)
Other borrowings represent amounts drawn down under the securitisation’s liquidity facility. During the prior period the facility’s
provider, the Royal Bank of Scotland Group plc, had its short-term credit rating downgraded below the minimum prescribed in the
facility agreement and as such the Group exercised its entitlement to draw the full amount of the facility and hold it in a designated
bank account. The corresponding balance of £120.0 million (2014: £120.0 million) held in this bank account is included within cash
and cash equivalents.
The Group has 75,000 (2014: 75,000) preference shares of £1 each in issue at the balance sheet date. The preference shares
carry the right to a fixed cumulative preferential dividend at the rate of 6% per annum (they are also entitled to a non-cumulative
dividend of 1% per annum provided that dividends of not less than £24,000 have been paid on the ordinary shares in that year). They
participate in the event of a winding-up and on a return of capital and carry the right to attend and vote at general meetings of the
Company, carrying four votes per share.
All of the Group’s borrowings are denominated in pounds sterling. There were no instances of default, including covenant terms, in
either the current or prior period.
Maturity of borrowings The maturity profile of the carrying amount of the Group’s borrowings at the period end was as follows:
2015 2014
Due:
Gross borrowings
£m
Unamortised issue costs
£m
Net borrowings
£m
Gross
borrowings
£m
Unamor tised
issue costs
£m
Net
borrowings
£m
Within one year 155.5 (1.5) 154.0 153.1 (1.5) 151.6
In more than one year but less than two years 58.5 (1.6) 56.9 26.8 (1.5) 25.3
In more than two years but less than five years 315.6 (2.9) 312.7 302.5 (3.5) 299.0
In more than five years 931.2 (16.7) 914.5 917.8 (14.6) 903.2
1,460.8 (22.7) 1,438.1 1,400.2 (21.1) 1,379.1
Fair value of borrowings The carrying amount and the fair value of the Group’s borrowings are as follows:
Carrying amount Fair value
2014
£m
Unsecured bank borrowings 219.6
Securitised debt 923.7
Finance leases 20.8
Other lease related borrowings 148.1
Other borrowings 120.0
Preference shares 0.1
1,432.3
2015 2014 2015 £m £m £m
258.7 219.6 258.7
866.2 891.6 892.2 20.7 20.8 20.7
195.1 148.1 195.1 120.0 120.0 120.0
0.1 0.1 0.1 1,460.8 1,400.2 1,486.8
The fair value of the Group’s securitised debt is based on quoted market prices and is within Level 1 of the fair value hierarchy.
The fair values of all of the Group’s other borrowings approximate to their carrying amounts and are within Level 2 of the fair value
hierarchy.
18 DERIVATIVE FINANCIAL INSTRUMENTS
Interest rate swaps 2015
£m 2014
£m
Current liabilities (25.7) (19.5)
Non-current liabilities (167.0) (120.7)
(192.7) (140.2)
Details of the Group’s interest rate swaps are provided in note 20.
96
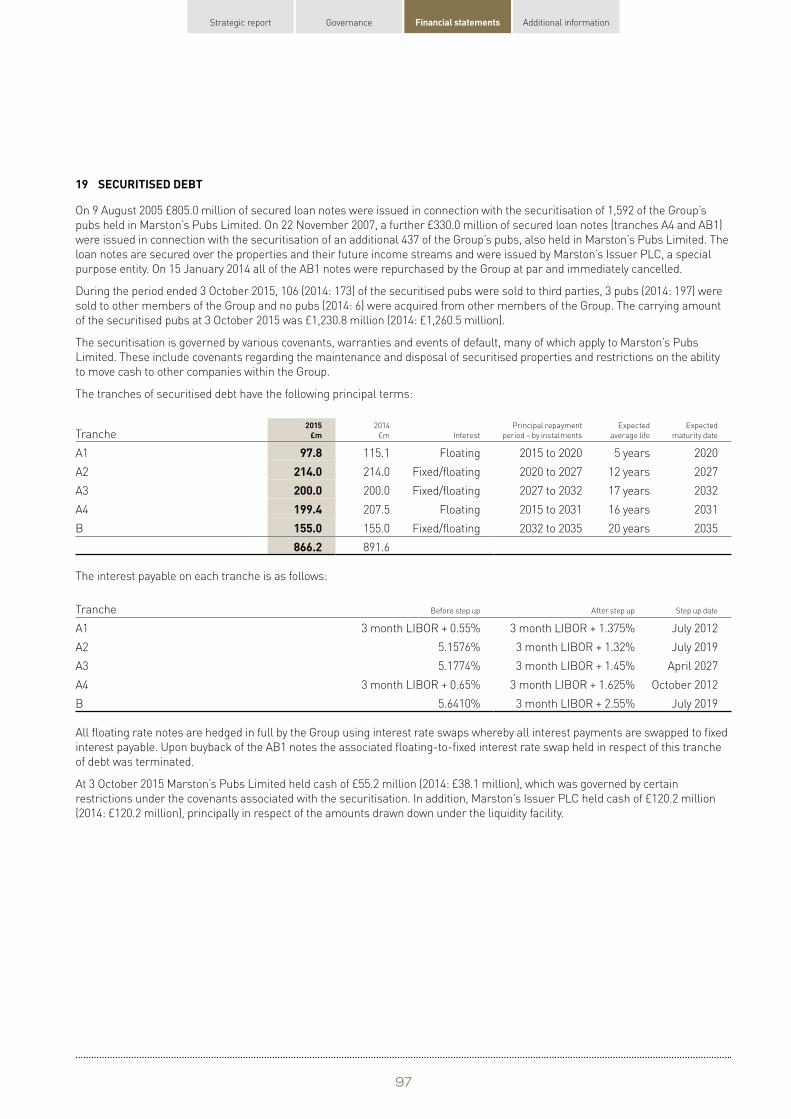
Strategic report Governance Financial statements Additional information
19 SECURITISED DEBT
On 9 August 2005 £805.0 million of secured loan notes were issued in connection with the securitisation of 1,592 of the Group’s
pubs held in Marston’s Pubs Limited. On 22 November 2007, a further £330.0 million of secured loan notes (tranches A4 and AB1)
were issued in connection with the securitisation of an additional 437 of the Group’s pubs, also held in Marston’s Pubs Limited. The
loan notes are secured over the properties and their future income streams and were issued by Marston’s Issuer PLC, a special
purpose entity. On 15 January 2014 all of the AB1 notes were repurchased by the Group at par and immediately cancelled.
During the period ended 3 October 2015, 106 (2014: 173) of the securitised pubs were sold to third parties, 3 pubs (2014: 197) were
sold to other members of the Group and no pubs (2014: 6) were acquired from other members of the Group. The carrying amount
of the securitised pubs at 3 October 2015 was £1,230.8 million (2014: £1,260.5 million).
The securitisation is governed by various covenants, warranties and events of default, many of which apply to Marston’s Pubs
Limited. These include covenants regarding the maintenance and disposal of securitised properties and restrictions on the ability
to move cash to other companies within the Group.
The tranches of securitised debt have the following principal terms:
Tranche 2015
£m 2014
£m Interest
Principal repayment
period – by instalments
Expected
average life
Expected
maturity date
A1 97.8 115.1 Floating 2015 to 2020 5 years 2020
A2 214.0 214.0 Fixed/floating 2020 to 2027 12 years 2027
A3 200.0 200.0 Fixed/floating 2027 to 2032 17 years 2032
A4 199.4 207.5 Floating 2015 to 2031 16 years 2031
B 155.0 155.0 Fixed/floating 2032 to 2035 20 years 2035
866.2 891.6
The interest payable on each tranche is as follows:
Tranche Before step up After step up Step up date
A1 3 month LIBOR + 0.55% 3 month LIBOR + 1.375% July 2012
A2 5.1576% 3 month LIBOR + 1.32% July 2019
A3 5.1774% 3 month LIBOR + 1.45% April 2027
A4 3 month LIBOR + 0.65% 3 month LIBOR + 1.625% October 2012
B 5.6410% 3 month LIBOR + 2.55% July 2019
All floating rate notes are hedged in full by the Group using interest rate swaps whereby all interest payments are swapped to fixed
interest payable. Upon buyback of the AB1 notes the associated floating-to-fixed interest rate swap held in respect of this tranche
of debt was terminated.
At 3 October 2015 Marston’s Pubs Limited held cash of £55.2 million (2014: £38.1 million), which was governed by certain
restrictions under the covenants associated with the securitisation. In addition, Marston’s Issuer PLC held cash of £120.2 million
(2014: £120.2 million), principally in respect of the amounts drawn down under the liquidity facility.
97
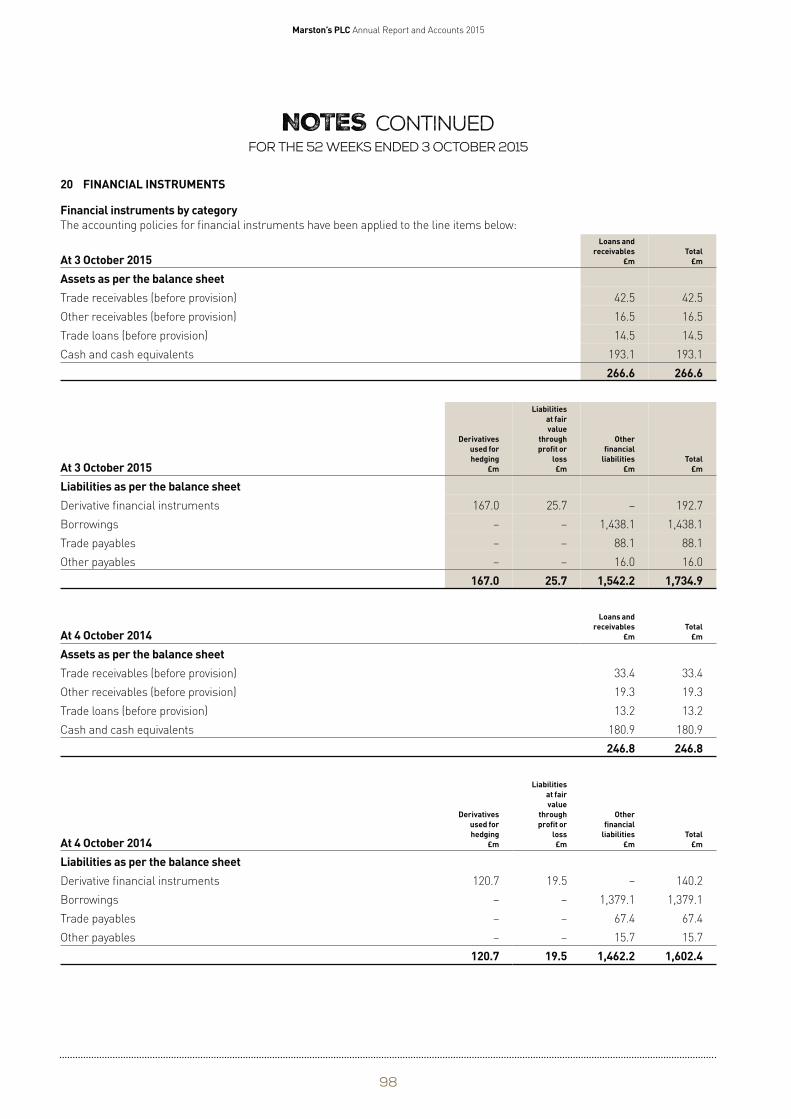
Marston’s PLC Annual Report and Accounts 2015
NOTES continued For the 52 weeks ended 3 October 2015
20 FINANCIAL INSTRUMENTS
Financial instruments by category The accounting policies for financial instruments have been applied to the line items below:
At 3 October 2015
Loans and receivables
£m Total
£m
Assets as per the balance sheet Trade receivables (before provision) 42.5 42.5
Other receivables (before provision) 16.5 16.5
Trade loans (before provision) 14.5 14.5
Cash and cash equivalents 193.1 193.1
266.6 266.6
At 3 October 2015
Derivatives used for hedging
£m
Liabilities at fair value
through profit or
loss £m
Other financial
liabilities £m
Total £m
Liabilities as per the balance sheet Derivative financial instruments 167.0 25.7 – 192.7
Borrowings – – 1,438.1 1,438.1
Trade payables – – 88.1 88.1
Other payables – – 16.0 16.0
167.0 25.7 1,542.2 1,734.9
Loans and receivables Total
At 4 October 2014 £m £m
Assets as per the balance sheet Trade receivables (before provision) 33.4 33.4
Other receivables (before provision) 19.3 19.3
Trade loans (before provision) 13.2 13.2
Cash and cash equivalents 180.9 180.9
246.8 246.8
Liabilities at fair value
Derivatives through Other used for profit or financial
At 4 October 2014 hedging
£m loss
£m liabilities
£m Total
£m
Liabilities as per the balance sheet Derivative financial instruments 120.7 19.5 – 140.2
Borrowings – – 1,379.1 1,379.1
Trade payables – – 67.4 67.4
Other payables – – 15.7 15.7
120.7 19.5 1,462.2 1,602.4
98
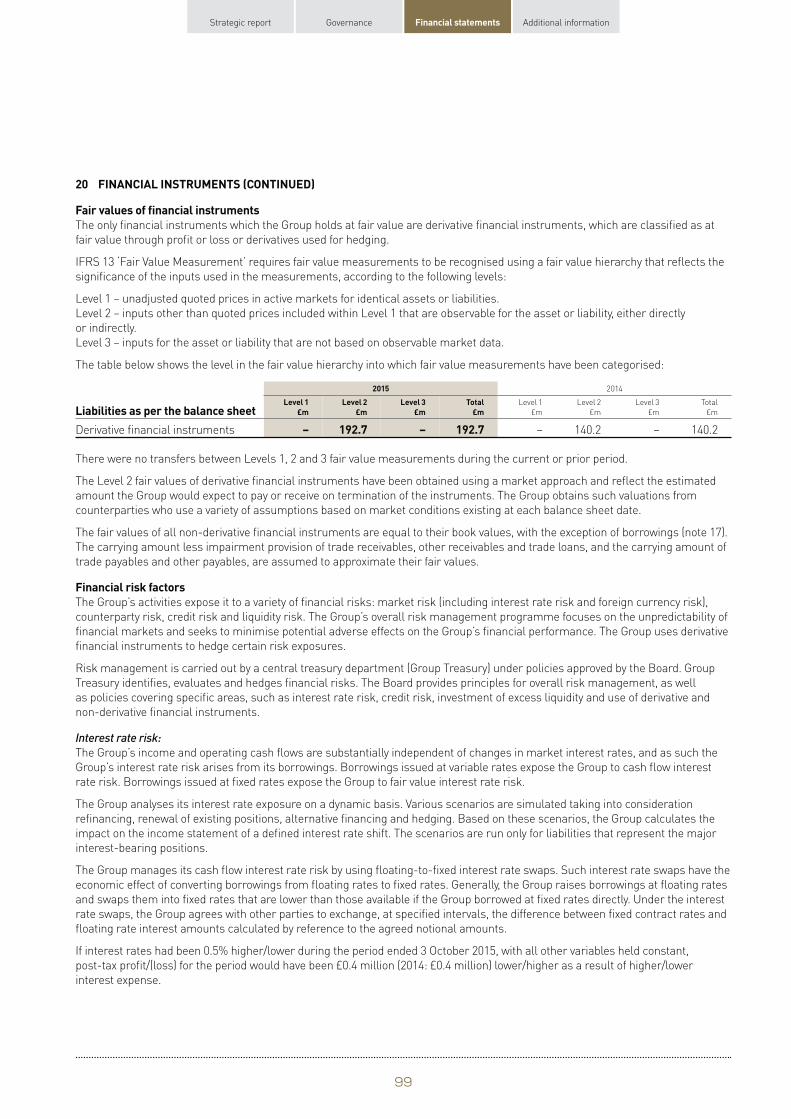
Strategic report Governance Financial statements Additional information
20 FINANCIAL INSTRUMENTS (CONTINUED)
Fair values of financial instruments The only financial instruments which the Group holds at fair value are derivative financial instruments, which are classified as at
fair value through profit or loss or derivatives used for hedging.
IFRS 13 ‘Fair Value Measurement’ requires fair value measurements to be recognised using a fair value hierarchy that reflects the
significance of the inputs used in the measurements, according to the following levels:
Level 1 – unadjusted quoted prices in active markets for identical assets or liabilities.
Level 2 – inputs other than quoted prices included within Level 1 that are observable for the asset or liability, either directly
or indirectly.
Level 3 – inputs for the asset or liability that are not based on observable market data.
The table below shows the level in the fair value hierarchy into which fair value measurements have been categorised:
2015 2014
Liabilities as per the balance sheet Level 1
£m Level 2
£m Level 3
£m Total
£m Level 1
£m
Level 2
£m
Level 3
£m
Total
£m
Derivative financial instruments – 192.7 – 192.7 – 140.2 – 140.2
There were no transfers between Levels 1, 2 and 3 fair value measurements during the current or prior period.
The Level 2 fair values of derivative financial instruments have been obtained using a market approach and reflect the estimated
amount the Group would expect to pay or receive on termination of the instruments. The Group obtains such valuations from
counterparties who use a variety of assumptions based on market conditions existing at each balance sheet date.
The fair values of all non-derivative financial instruments are equal to their book values, with the exception of borrowings (note 17).
The carrying amount less impairment provision of trade receivables, other receivables and trade loans, and the carrying amount of
trade payables and other payables, are assumed to approximate their fair values.
Financial risk factors The Group’s activities expose it to a variety of financial risks: market risk (including interest rate risk and foreign currency risk),
counterparty risk, credit risk and liquidity risk. The Group’s overall risk management programme focuses on the unpredictability of
financial markets and seeks to minimise potential adverse effects on the Group’s financial performance. The Group uses derivative
financial instruments to hedge certain risk exposures.
Risk management is carried out by a central treasury department (Group Treasury) under policies approved by the Board. Group
Treasury identifies, evaluates and hedges financial risks. The Board provides principles for overall risk management, as well
as policies covering specific areas, such as interest rate risk, credit risk, investment of excess liquidity and use of derivative and
non-derivative financial instruments.
Interest rate risk:
The Group’s income and operating cash flows are substantially independent of changes in market interest rates, and as such the
Group’s interest rate risk arises from its borrowings. Borrowings issued at variable rates expose the Group to cash flow interest
rate risk. Borrowings issued at fixed rates expose the Group to fair value interest rate risk.
The Group analyses its interest rate exposure on a dynamic basis. Various scenarios are simulated taking into consideration
refinancing, renewal of existing positions, alternative financing and hedging. Based on these scenarios, the Group calculates the
impact on the income statement of a defined interest rate shift. The scenarios are run only for liabilities that represent the major
interest-bearing positions.
The Group manages its cash flow interest rate risk by using floating-to-fixed interest rate swaps. Such interest rate swaps have the
economic effect of converting borrowings from floating rates to fixed rates. Generally, the Group raises borrowings at floating rates
and swaps them into fixed rates that are lower than those available if the Group borrowed at fixed rates directly. Under the interest
rate swaps, the Group agrees with other parties to exchange, at specified intervals, the difference between fixed contract rates and
floating rate interest amounts calculated by reference to the agreed notional amounts.
If interest rates had been 0.5% higher/lower during the period ended 3 October 2015, with all other variables held constant,
post-tax profit/(loss) for the period would have been £0.4 million (2014: £0.4 million) lower/higher as a result of higher/lower
interest expense.
99
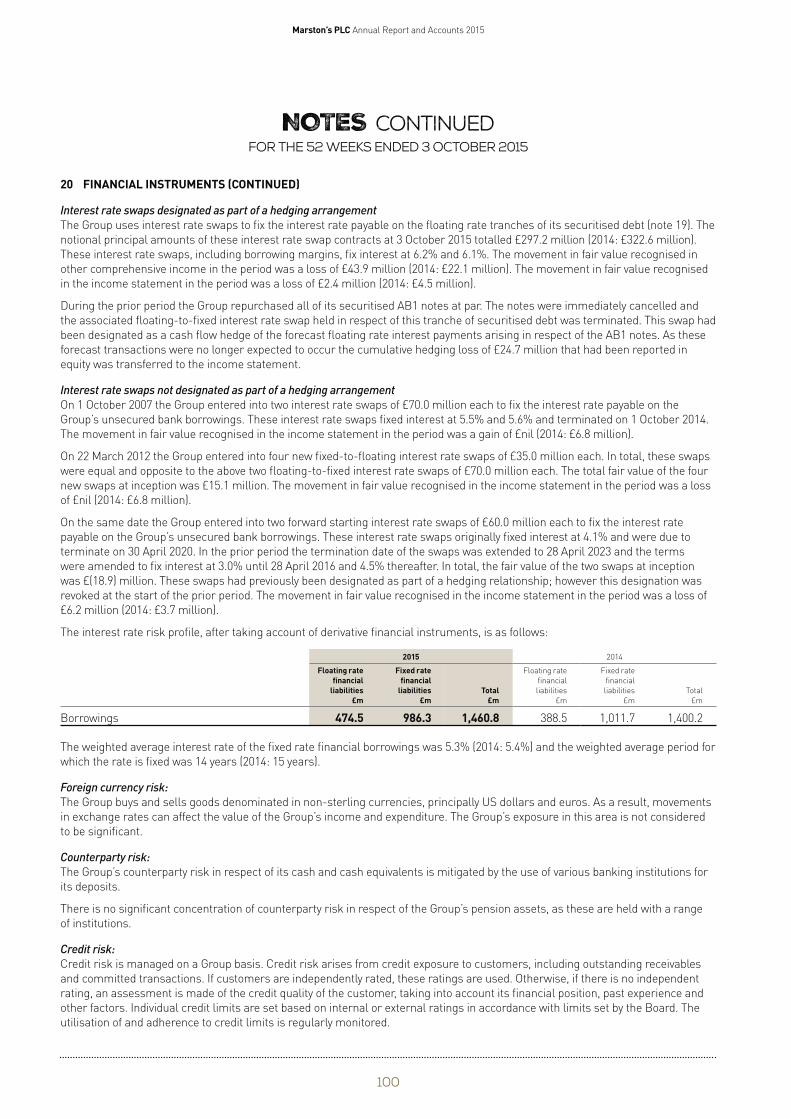
Marston’s PLC Annual Report and Accounts 2015
NOTES continued For the 52 weeks ended 3 October 2015
20 FINANCIAL INSTRUMENTS (CONTINUED)
Interest rate swaps designated as part of a hedging arrangement
The Group uses interest rate swaps to fix the interest rate payable on the floating rate tranches of its securitised debt (note 19). The
notional principal amounts of these interest rate swap contracts at 3 October 2015 totalled £297.2 million (2014: £322.6 million).
These interest rate swaps, including borrowing margins, fix interest at 6.2% and 6.1%. The movement in fair value recognised in
other comprehensive income in the period was a loss of £43.9 million (2014: £22.1 million). The movement in fair value recognised
in the income statement in the period was a loss of £2.4 million (2014: £4.5 million).
During the prior period the Group repurchased all of its securitised AB1 notes at par. The notes were immediately cancelled and
the associated floating-to-fixed interest rate swap held in respect of this tranche of securitised debt was terminated. This swap had
been designated as a cash flow hedge of the forecast floating rate interest payments arising in respect of the AB1 notes. As these
forecast transactions were no longer expected to occur the cumulative hedging loss of £24.7 million that had been reported in
equity was transferred to the income statement.
Interest rate swaps not designated as part of a hedging arrangement
On 1 October 2007 the Group entered into two interest rate swaps of £70.0 million each to fix the interest rate payable on the
Group’s unsecured bank borrowings. These interest rate swaps fixed interest at 5.5% and 5.6% and terminated on 1 October 2014.
The movement in fair value recognised in the income statement in the period was a gain of £nil (2014: £6.8 million).
On 22 March 2012 the Group entered into four new fixed-to-floating interest rate swaps of £35.0 million each. In total, these swaps
were equal and opposite to the above two floating-to-fixed interest rate swaps of £70.0 million each. The total fair value of the four
new swaps at inception was £15.1 million. The movement in fair value recognised in the income statement in the period was a loss
of £nil (2014: £6.8 million).
On the same date the Group entered into two forward starting interest rate swaps of £60.0 million each to fix the interest rate
payable on the Group’s unsecured bank borrowings. These interest rate swaps originally fixed interest at 4.1% and were due to
terminate on 30 April 2020. In the prior period the termination date of the swaps was extended to 28 April 2023 and the terms
were amended to fix interest at 3.0% until 28 April 2016 and 4.5% thereafter. In total, the fair value of the two swaps at inception
was £(18.9) million. These swaps had previously been designated as part of a hedging relationship; however this designation was
revoked at the start of the prior period. The movement in fair value recognised in the income statement in the period was a loss of
£6.2 million (2014: £3.7 million).
The interest rate risk profile, after taking account of derivative financial instruments, is as follows:
2015 2014
Floating rate financial
liabilities £m
Fixed rate financial
liabilities £m
Total £m
Floating rate
financial
liabilities
£m
Fixed rate
financial
liabilities
£m
Total
£m
Borrowings 474.5 986.3 1,460.8 388.5 1,011.7 1,400.2
The weighted average interest rate of the fixed rate financial borrowings was 5.3% (2014: 5.4%) and the weighted average period for
which the rate is fixed was 14 years (2014: 15 years).
Foreign currency risk:
The Group buys and sells goods denominated in non-sterling currencies, principally US dollars and euros. As a result, movements
in exchange rates can affect the value of the Group’s income and expenditure. The Group’s exposure in this area is not considered
to be significant.
Counterparty risk:
The Group’s counterparty risk in respect of its cash and cash equivalents is mitigated by the use of various banking institutions for
its deposits.
There is no significant concentration of counterparty risk in respect of the Group’s pension assets, as these are held with a range
of institutions.
Credit risk:
Credit risk is managed on a Group basis. Credit risk arises from credit exposure to customers, including outstanding receivables
and committed transactions. If customers are independently rated, these ratings are used. Otherwise, if there is no independent
rating, an assessment is made of the credit quality of the customer, taking into account its financial position, past experience and
other factors. Individual credit limits are set based on internal or external ratings in accordance with limits set by the Board. The
utilisation of and adherence to credit limits is regularly monitored.
100
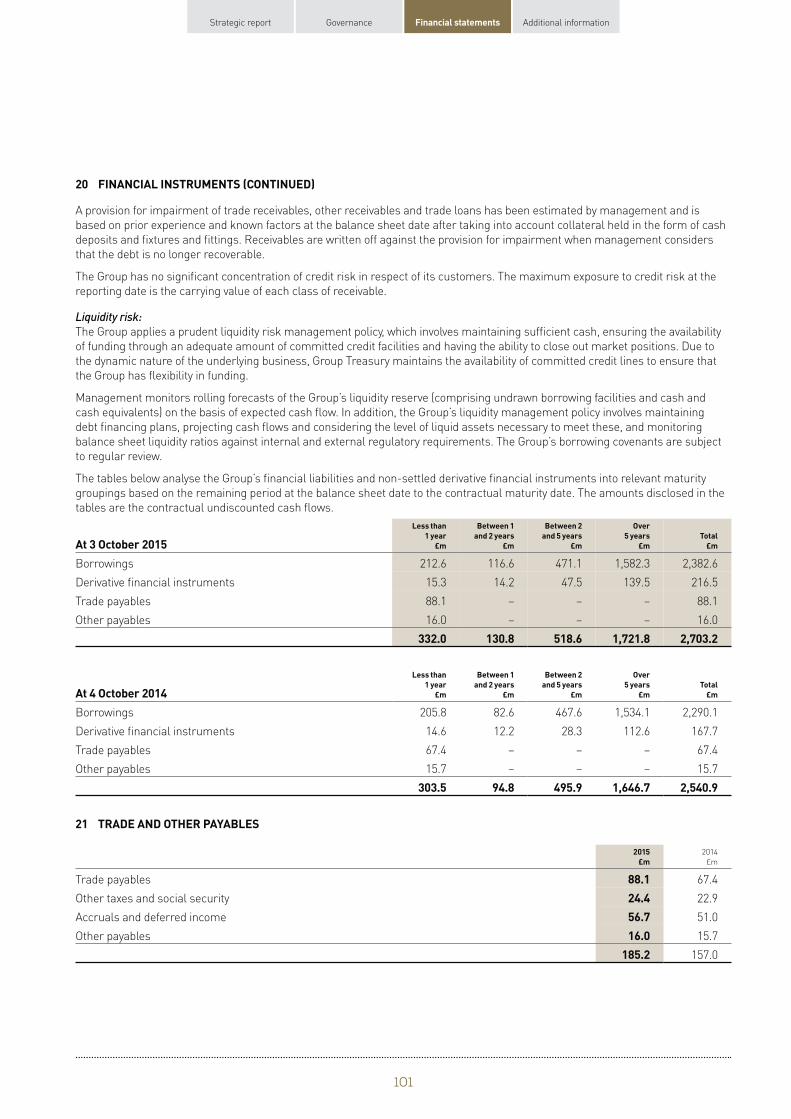
Strategic report Governance Financial statements Additional information
20 FINANCIAL INSTRUMENTS (CONTINUED)
A provision for impairment of trade receivables, other receivables and trade loans has been estimated by management and is
based on prior experience and known factors at the balance sheet date after taking into account collateral held in the form of cash
deposits and fixtures and fittings. Receivables are written off against the provision for impairment when management considers
that the debt is no longer recoverable.
The Group has no significant concentration of credit risk in respect of its customers. The maximum exposure to credit risk at the
reporting date is the carrying value of each class of receivable.
Liquidity risk:
The Group applies a prudent liquidity risk management policy, which involves maintaining sufficient cash, ensuring the availability
of funding through an adequate amount of committed credit facilities and having the ability to close out market positions. Due to
the dynamic nature of the underlying business, Group Treasury maintains the availability of committed credit lines to ensure that
the Group has flexibility in funding.
Management monitors rolling forecasts of the Group’s liquidity reserve (comprising undrawn borrowing facilities and cash and
cash equivalents) on the basis of expected cash flow. In addition, the Group’s liquidity management policy involves maintaining
debt financing plans, projecting cash flows and considering the level of liquid assets necessary to meet these, and monitoring
balance sheet liquidity ratios against internal and external regulatory requirements. The Group’s borrowing covenants are subject
to regular review.
The tables below analyse the Group’s financial liabilities and non-settled derivative financial instruments into relevant maturity
groupings based on the remaining period at the balance sheet date to the contractual maturity date. The amounts disclosed in the
tables are the contractual undiscounted cash flows.
At 3 October 2015
Less than 1 year
£m
Between 1 and 2 years
£m
Between 2 and 5 years
£m
Over 5 years
£m Total
£m
Borrowings 212.6 116.6 471.1 1,582.3 2,382.6
Derivative financial instruments 15.3 14.2 47.5 139.5 216.5
Trade payables 88.1 – – – 88.1
Other payables 16.0 – – – 16.0
332.0 130.8 518.6 1,721.8 2,703.2
Less than Between 1 Between 2 Over 1 year and 2 years and 5 years 5 years Total
At 4 October 2014 £m £m £m £m £m
Borrowings 205.8 82.6 467.6 1,534.1 2,290.1
Derivative financial instruments 14.6 12.2 28.3 112.6 167.7
Trade payables 67.4 – – – 67.4
Other payables 15.7 – – – 15.7
303.5 94.8 495.9 1,646.7 2,540.9
21 TRADE AND OTHER PAYABLES
2014
£m
Trade payables 67.4
Other taxes and social security 22.9
Accruals and deferred income 51.0
Other payables 15.7
157.0
2015 £m
88.1 24.4 56.7 16.0
185.2
101
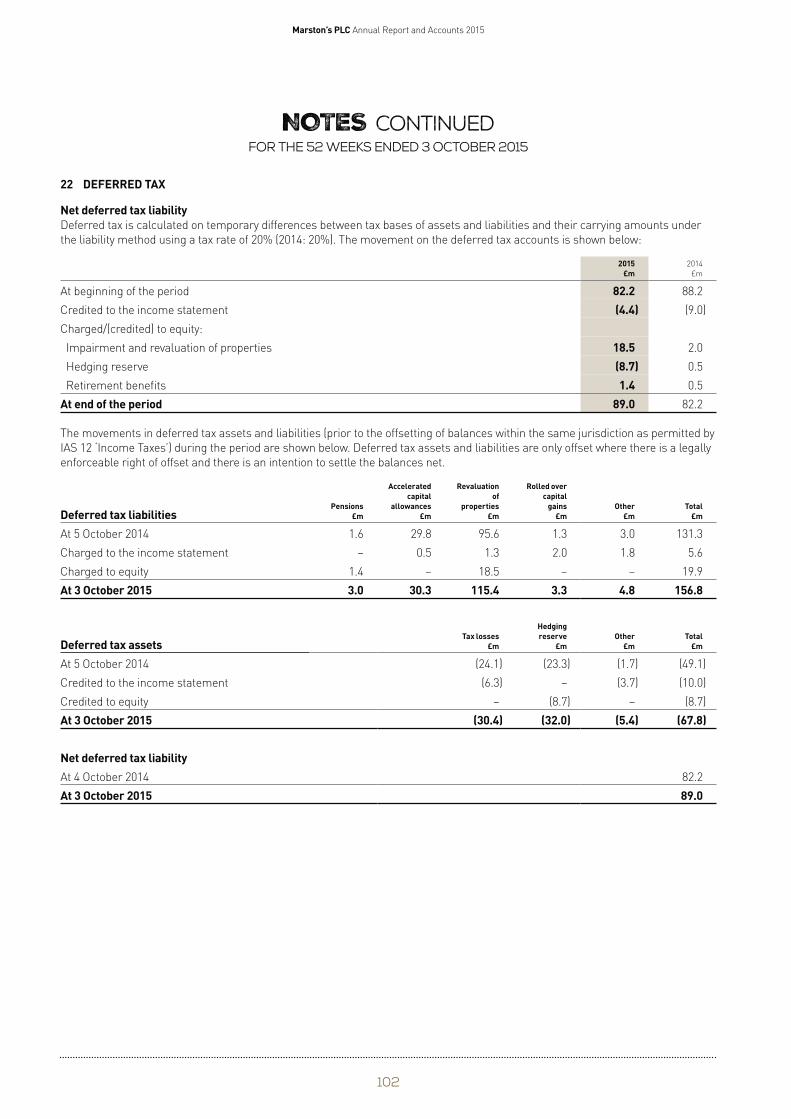
Marston’s PLC Annual Report and Accounts 2015
NOTES continued For the 52 weeks ended 3 October 2015
22 DEFERRED TAX
Net deferred tax liability Deferred tax is calculated on temporary differences between tax bases of assets and liabilities and their carrying amounts under
the liability method using a tax rate of 20% (2014: 20%). The movement on the deferred tax accounts is shown below:
2015 £m
2014
£m
At beginning of the period 82.2 88.2
Credited to the income statement (4.4) (9.0)
Charged/(credited) to equity:
Impairment and revaluation of properties 18.5 2.0
Hedging reserve (8.7) 0.5
Retirement benefits 1.4 0.5
At end of the period 89.0 82.2
The movements in deferred tax assets and liabilities (prior to the offsetting of balances within the same jurisdiction as permitted by
IAS 12 ‘Income Taxes’) during the period are shown below. Deferred tax assets and liabilities are only offset where there is a legally
enforceable right of offset and there is an intention to settle the balances net.
Accelerated Revaluation Rolled over capital of capital
Deferred tax liabilities Pensions
£m allowances
£m properties
£m gains
£m Other
£m Total
£m
At 5 October 2014 1.6 29.8 95.6 1.3 3.0 131.3
Charged to the income statement – 0.5 1.3 2.0 1.8 5.6
Charged to equity 1.4 – 18.5 – – 19.9
At 3 October 2015 3.0 30.3 115.4 3.3 4.8 156.8
Hedging Tax losses reserve Other Total
Deferred tax assets £m £m £m £m
At 5 October 2014 (24.1) (23.3) (1.7) (49.1)
Credited to the income statement (6.3) – (3.7) (10.0)
Credited to equity – (8.7) – (8.7)
At 3 October 2015 (30.4) (32.0) (5.4) (67.8)
Net deferred tax liability At 4 October 2014 82.2
At 3 October 2015 89.0
102
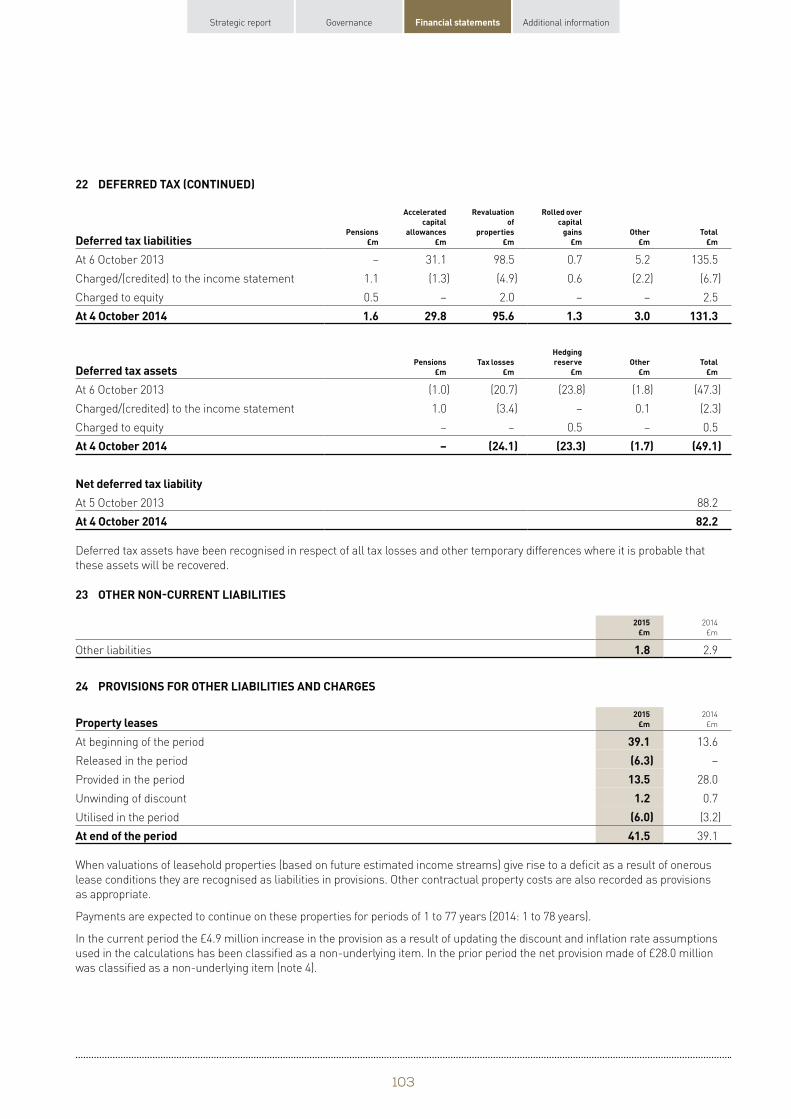
Strategic report Governance Financial statements Additional information
22 DEFERRED TAX (CONTINUED)
Deferred tax liabilities Pensions
£m
Accelerated capital
allowances £m
Revaluation of
properties £m
Rolled over capital gains
£m Other
£m Total
£m
At 6 October 2013 – 31.1 98.5 0.7 5.2 135.5
Charged/(credited) to the income statement 1.1 (1.3) (4.9) 0.6 (2.2) (6.7)
Charged to equity 0.5 – 2.0 – – 2.5
At 4 October 2014 1.6 29.8 95.6 1.3 3.0 131.3
Hedging Pensions Tax losses reserve Other Total
Deferred tax assets £m £m £m £m £m
At 6 October 2013 (1.0) (20.7) (23.8) (1.8) (47.3)
Charged/(credited) to the income statement 1.0 (3.4) – 0.1 (2.3)
Charged to equity – – 0.5 – 0.5
At 4 October 2014 – (24.1) (23.3) (1.7) (49.1)
Net deferred tax liability At 5 October 2013 88.2
At 4 October 2014 82.2
Deferred tax assets have been recognised in respect of all tax losses and other temporary differences where it is probable that
these assets will be recovered.
23 OTHER NON-CURRENT LIABILITIES
2015 £m
2014
£m
Other liabilities 1.8 2.9
24 PROVISIONS FOR OTHER LIABILITIES AND CHARGES
Property leases 2015
£m 2014
£m
At beginning of the period 39.1 13.6
Released in the period (6.3) –
Provided in the period 13.5 28.0
Unwinding of discount 1.2 0.7
Utilised in the period (6.0) (3.2)
At end of the period 41.5 39.1
When valuations of leasehold properties (based on future estimated income streams) give rise to a deficit as a result of onerous
lease conditions they are recognised as liabilities in provisions. Other contractual property costs are also recorded as provisions
as appropriate.
Payments are expected to continue on these properties for periods of 1 to 77 years (2014: 1 to 78 years).
In the current period the £4.9 million increase in the provision as a result of updating the discount and inflation rate assumptions
used in the calculations has been classified as a non-underlying item. In the prior period the net provision made of £28.0 million
was classified as a non-underlying item (note 4).
103
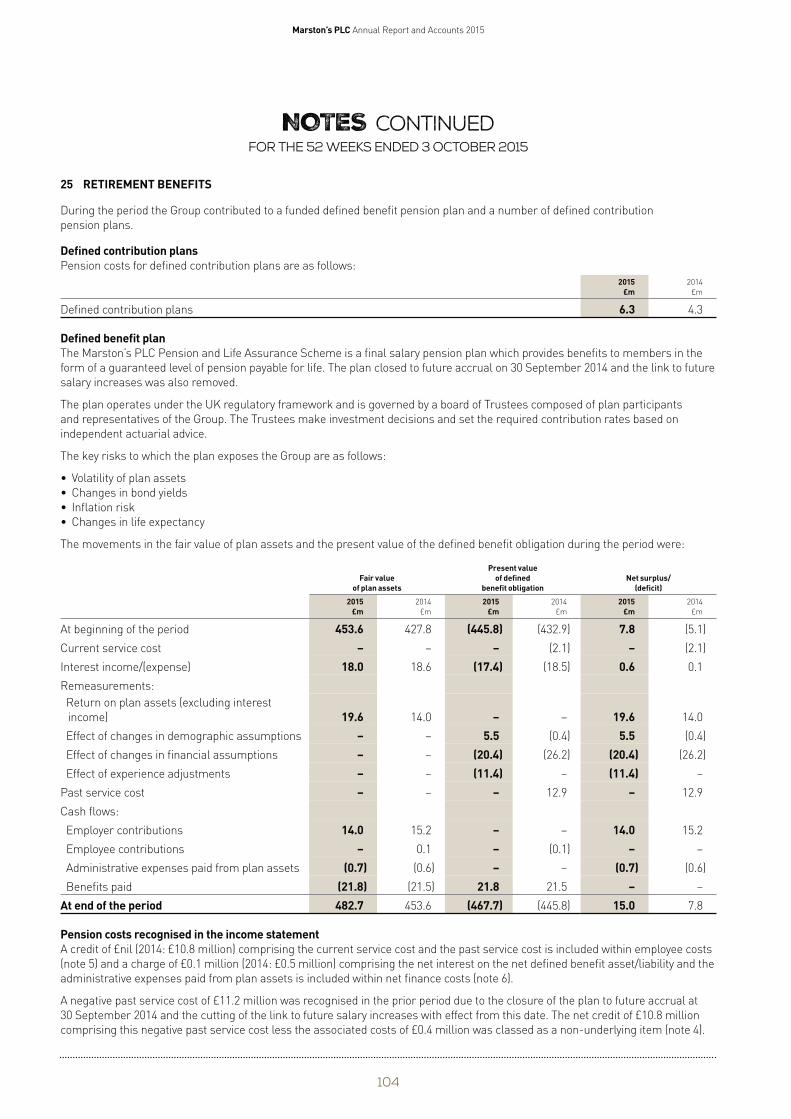
Marston’s PLC Annual Report and Accounts 2015
NOTES continued For the 52 weeks ended 3 October 2015
25 RETIREMENT BENEFITS
During the period the Group contributed to a funded defined benefit pension plan and a number of defined contribution
pension plans.
Defined contribution plans Pension costs for defined contribution plans are as follows:
2014
£m
Defined contribution plans 4.3
2015 £m
6.3
Defined benefit plan The Marston’s PLC Pension and Life Assurance Scheme is a final salary pension plan which provides benefits to members in the
form of a guaranteed level of pension payable for life. The plan closed to future accrual on 30 September 2014 and the link to future
salary increases was also removed.
The plan operates under the UK regulatory framework and is governed by a board of Trustees composed of plan participants
and representatives of the Group. The Trustees make investment decisions and set the required contribution rates based on
independent actuarial advice.
The key risks to which the plan exposes the Group are as follows:
• Volatility of plan assets
• Changes in bond yields
• Inflation risk
• Changes in life expectancy
The movements in the fair value of plan assets and the present value of the defined benefit obligation during the period were:
Present value Fair value of defined Net surplus/
of plan assets benefit obligation (deficit)
2014
£m
At beginning of the period (5.1)
Current service cost (2.1)
Interest income/(expense) 0.1
Remeasurements:
Return on plan assets (excluding interest
income) 14.0
Effect of changes in demographic assumptions (0.4)
Effect of changes in financial assumptions (26.2)
Effect of experience adjustments –
Past service cost 12.9
Cash flows:
Employer contributions 15.2
Employee contributions –
Administrative expenses paid from plan assets (0.6)
Benefits paid –
At end of the period 7.8
2015 £m
2014
£m
2015 £m
2014
£m
2015 £m
453.6 427.8 (445.8) (432.9) 7.8 – – – (2.1) –
18.0 18.6 (17.4) (18.5) 0.6
19.6 14.0 – – 19.6 – – 5.5 (0.4) 5.5 – – (20.4) (26.2) (20.4) – – (11.4) – (11.4) – – – 12.9 –
14.0 15.2 – – 14.0 – 0.1 – (0.1) –
(0.7) (0.6) – – (0.7) (21.8) (21.5) 21.8 21.5 – 482.7 453.6 (467.7) (445.8) 15.0
Pension costs recognised in the income statement A credit of £nil (2014: £10.8 million) comprising the current service cost and the past service cost is included within employee costs
(note 5) and a charge of £0.1 million (2014: £0.5 million) comprising the net interest on the net defined benefit asset/liability and the
administrative expenses paid from plan assets is included within net finance costs (note 6).
A negative past service cost of £11.2 million was recognised in the prior period due to the closure of the plan to future accrual at
30 September 2014 and the cutting of the link to future salary increases with effect from this date. The net credit of £10.8 million
comprising this negative past service cost less the associated costs of £0.4 million was classed as a non-underlying item (note 4).
104
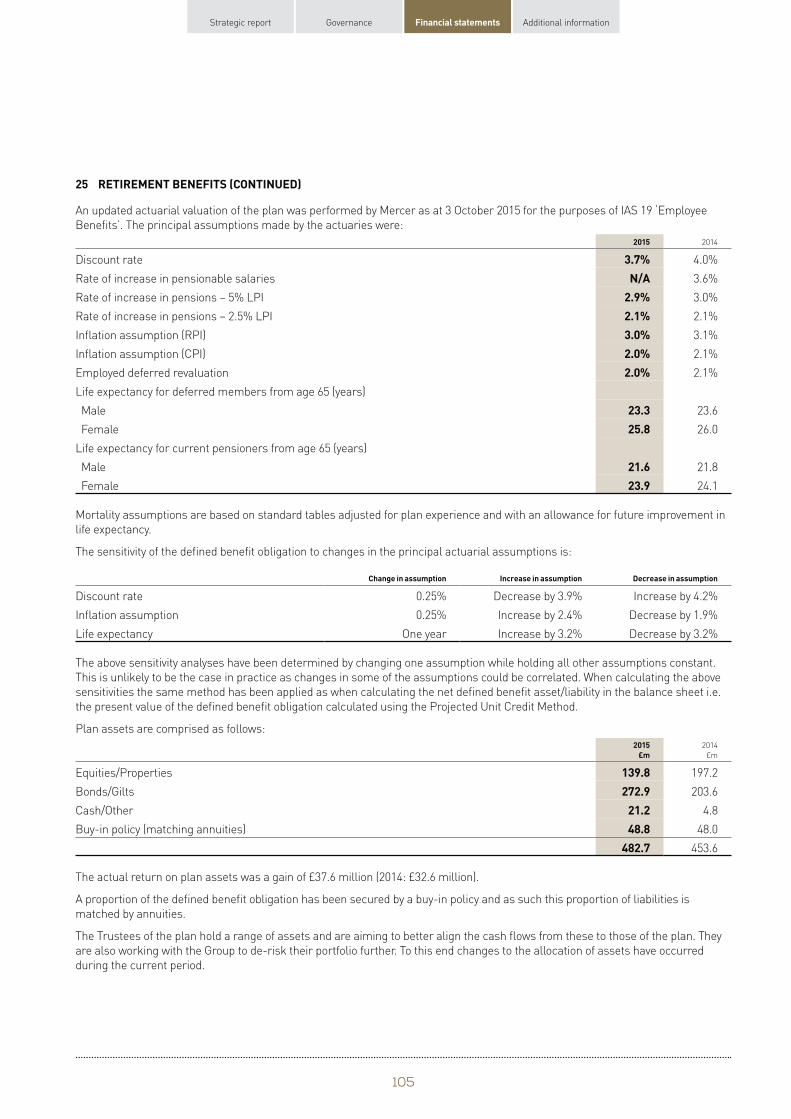
Strategic report Governance Financial statements Additional information
25 RETIREMENT BENEFITS (CONTINUED)
An updated actuarial valuation of the plan was performed by Mercer as at 3 October 2015 for the purposes of IAS 19 ‘Employee
Benefits’. The principal assumptions made by the actuaries were:
2015 2014
Discount rate 3.7% 4.0%
Rate of increase in pensionable salaries N/A 3.6%
Rate of increase in pensions – 5% LPI 2.9% 3.0%
Rate of increase in pensions – 2.5% LPI 2.1% 2.1%
Inflation assumption (RPI) 3.0% 3.1%
Inflation assumption (CPI) 2.0% 2.1%
Employed deferred revaluation 2.0% 2.1%
Life expectancy for deferred members from age 65 (years)
Male 23.3 23.6
Female 25.8 26.0
Life expectancy for current pensioners from age 65 (years)
Male 21.6 21.8
Female 23.9 24.1
Mortality assumptions are based on standard tables adjusted for plan experience and with an allowance for future improvement in
life expectancy.
The sensitivity of the defined benefit obligation to changes in the principal actuarial assumptions is:
Change in assumption Increase in assumption Decrease in assumption
Discount rate 0.25% Decrease by 3.9% Increase by 4.2%
Inflation assumption 0.25% Increase by 2.4% Decrease by 1.9%
Life expectancy One year Increase by 3.2% Decrease by 3.2%
The above sensitivity analyses have been determined by changing one assumption while holding all other assumptions constant.
This is unlikely to be the case in practice as changes in some of the assumptions could be correlated. When calculating the above
sensitivities the same method has been applied as when calculating the net defined benefit asset/liability in the balance sheet i.e.
the present value of the defined benefit obligation calculated using the Projected Unit Credit Method.
Plan assets are comprised as follows:
2014
£m
Equities/Properties 197.2
Bonds/Gilts 203.6
Cash/Other 4.8
Buy-in policy (matching annuities) 48.0
453.6
2015 £m
139.8 272.9
21.2 48.8
482.7
The actual return on plan assets was a gain of £37.6 million (2014: £32.6 million).
A proportion of the defined benefit obligation has been secured by a buy-in policy and as such this proportion of liabilities is
matched by annuities.
The Trustees of the plan hold a range of assets and are aiming to better align the cash flows from these to those of the plan. They
are also working with the Group to de-risk their portfolio further. To this end changes to the allocation of assets have occurred
during the current period.
105
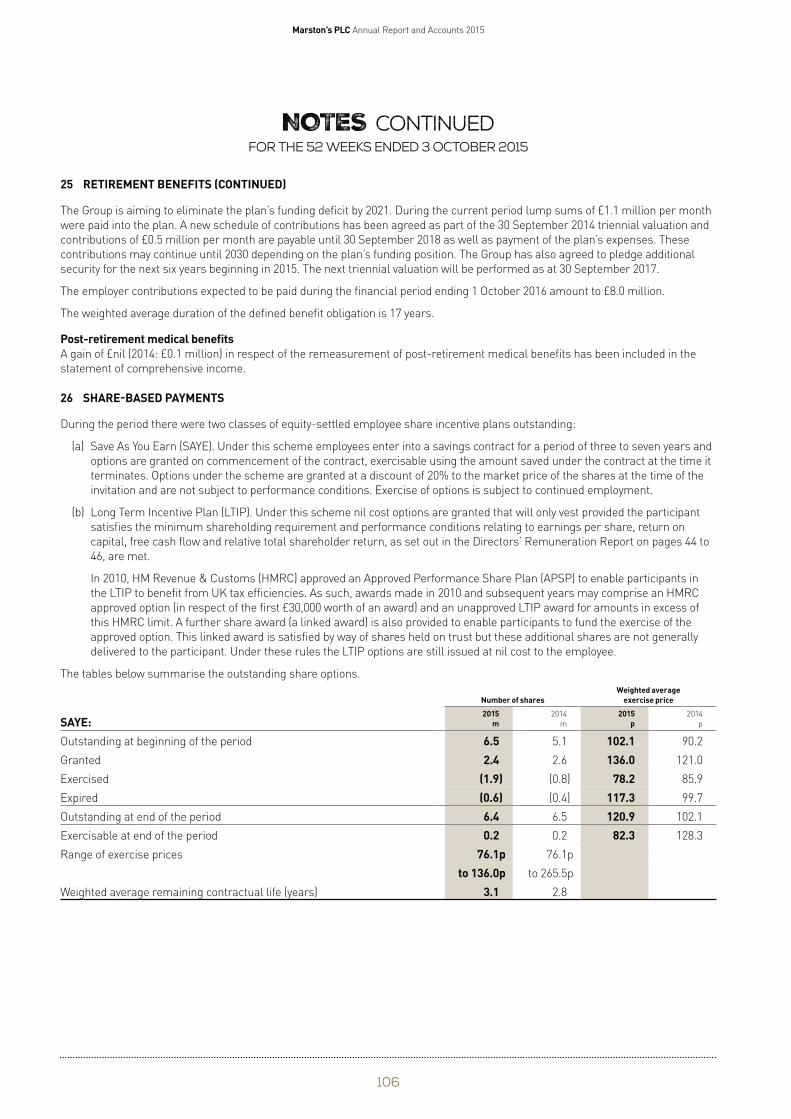
Marston’s PLC Annual Report and Accounts 2015
NOTES continued For the 52 weeks ended 3 October 2015
25 RETIREMENT BENEFITS (CONTINUED)
The Group is aiming to eliminate the plan’s funding deficit by 2021. During the current period lump sums of £1.1 million per month
were paid into the plan. A new schedule of contributions has been agreed as part of the 30 September 2014 triennial valuation and
contributions of £0.5 million per month are payable until 30 September 2018 as well as payment of the plan’s expenses. These
contributions may continue until 2030 depending on the plan’s funding position. The Group has also agreed to pledge additional
security for the next six years beginning in 2015. The next triennial valuation will be performed as at 30 September 2017.
The employer contributions expected to be paid during the financial period ending 1 October 2016 amount to £8.0 million.
The weighted average duration of the defined benefit obligation is 17 years.
Post-retirement medical benefits A gain of £nil (2014: £0.1 million) in respect of the remeasurement of post-retirement medical benefits has been included in the
statement of comprehensive income.
26 SHARE-BASED PAYMENTS
During the period there were two classes of equity-settled employee share incentive plans outstanding:
(a) Save As You Earn (SAYE). Under this scheme employees enter into a savings contract for a period of three to seven years and
options are granted on commencement of the contract, exercisable using the amount saved under the contract at the time it
terminates. Options under the scheme are granted at a discount of 20% to the market price of the shares at the time of the
invitation and are not subject to performance conditions. Exercise of options is subject to continued employment.
(b) Long Term Incentive Plan (LTIP). Under this scheme nil cost options are granted that will only vest provided the participant
satisfies the minimum shareholding requirement and performance conditions relating to earnings per share, return on
capital, free cash flow and relative total shareholder return, as set out in the Directors’ Remuneration Report on pages 44 to
46, are met.
In 2010, HM Revenue & Customs (HMRC) approved an Approved Performance Share Plan (APSP) to enable participants in
the LTIP to benefit from UK tax efficiencies. As such, awards made in 2010 and subsequent years may comprise an HMRC
approved option (in respect of the first £30,000 worth of an award) and an unapproved LTIP award for amounts in excess of
this HMRC limit. A further share award (a linked award) is also provided to enable participants to fund the exercise of the
approved option. This linked award is satisfied by way of shares held on trust but these additional shares are not generally
delivered to the participant. Under these rules the LTIP options are still issued at nil cost to the employee.
The tables below summarise the outstanding share options.
Weighted average Number of shares exercise price
2014
SAYE: p
Outstanding at beginning of the period 90.2
Granted 121.0
Exercised 85.9
Expired 99.7
Outstanding at end of the period 102.1
Exercisable at end of the period 128.3
Range of exercise prices
Weighted average remaining contractual life (years)
2015 2014 2015 m m p
6.5 5.1 102.1 2.4 2.6 136.0
(1.9) (0.8) 78.2 (0.6) (0.4) 117.3 6.4 6.5 120.9 0.2 0.2 82.3
76.1p 76.1p
to 136.0p to 265.5p
3.1 2.8
106
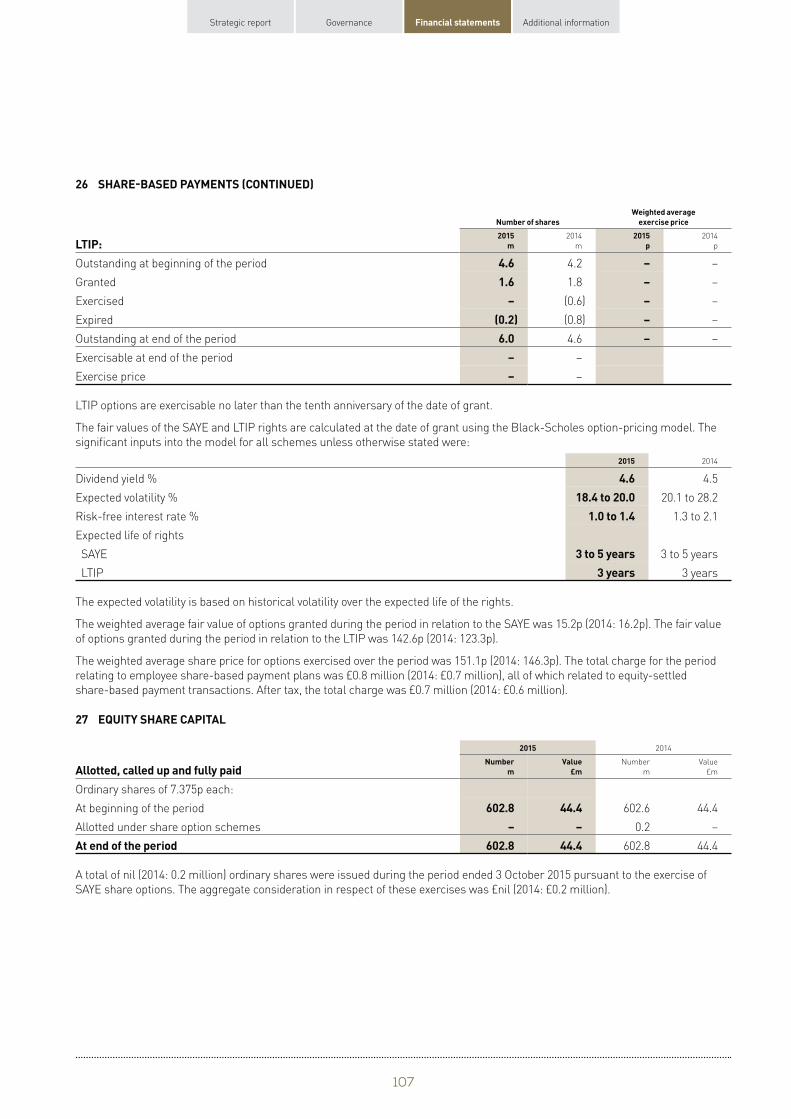
Strategic report Governance Financial statements Additional information
26 SHARE-BASED PAYMENTS (CONTINUED)
Weighted average Number of shares exercise price
2014
LTIP: p
Outstanding at beginning of the period –
Granted –
Exercised –
Expired –
Outstanding at end of the period –
Exercisable at end of the period
Exercise price
2015 2014 2015 m m p
4.6 4.2 – 1.6 1.8 –
– (0.6) – (0.2) (0.8) – 6.0 4.6 –
– –
– –
LTIP options are exercisable no later than the tenth anniversary of the date of grant.
The fair values of the SAYE and LTIP rights are calculated at the date of grant using the Black-Scholes option-pricing model. The
significant inputs into the model for all schemes unless otherwise stated were:
2015 2014
Dividend yield % 4.6 4.5
Expected volatility % 18.4 to 20.0 20.1 to 28.2
Risk-free interest rate % 1.0 to 1.4 1.3 to 2.1
Expected life of rights
SAYE 3 to 5 years 3 to 5 years
LTIP 3 years 3 years
The expected volatility is based on historical volatility over the expected life of the rights.
The weighted average fair value of options granted during the period in relation to the SAYE was 15.2p (2014: 16.2p). The fair value
of options granted during the period in relation to the LTIP was 142.6p (2014: 123.3p).
The weighted average share price for options exercised over the period was 151.1p (2014: 146.3p). The total charge for the period
relating to employee share-based payment plans was £0.8 million (2014: £0.7 million), all of which related to equity-settled
share-based payment transactions. After tax, the total charge was £0.7 million (2014: £0.6 million).
27 EQUITY SHARE CAPITAL
2015 2014
Allotted, called up and fully paid Number
m Value
£m Number
m
Value
£m
Ordinary shares of 7.375p each:
At beginning of the period 602.8 44.4 602.6 44.4
Allotted under share option schemes – – 0.2 –
At end of the period 602.8 44.4 602.8 44.4
A total of nil (2014: 0.2 million) ordinary shares were issued during the period ended 3 October 2015 pursuant to the exercise of
SAYE share options. The aggregate consideration in respect of these exercises was £nil (2014: £0.2 million).
107
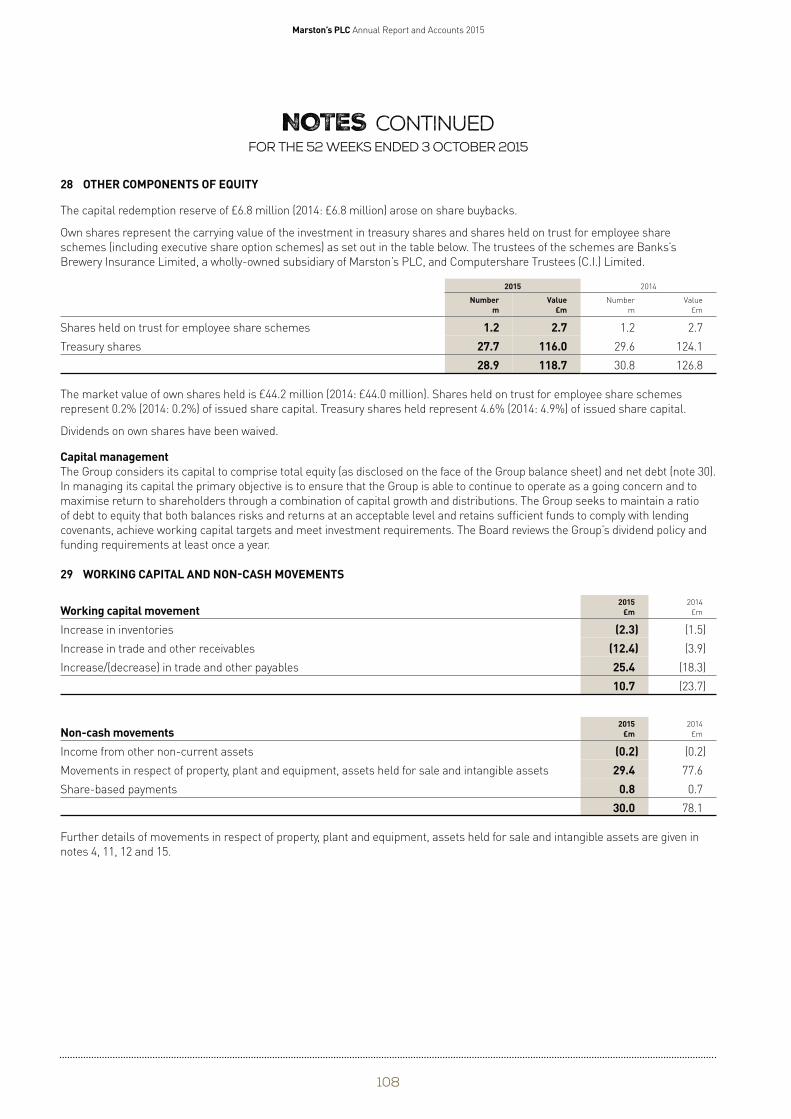
Marston’s PLC Annual Report and Accounts 2015
NOTES continued For the 52 weeks ended 3 October 2015
28 OTHER COMPONENTS OF EQUITY
The capital redemption reserve of £6.8 million (2014: £6.8 million) arose on share buybacks.
Own shares represent the carrying value of the investment in treasury shares and shares held on trust for employee share
schemes (including executive share option schemes) as set out in the table below. The trustees of the schemes are Banks’s
Brewery Insurance Limited, a wholly-owned subsidiary of Marston’s PLC, and Computershare Trustees (C.I.) Limited.
2015 2014
Number m
Value £m
Number
m
Value
£m
Shares held on trust for employee share schemes 1.2 2.7 1.2 2.7
Treasury shares 27.7 116.0 29.6 124.1
28.9 118.7 30.8 126.8
The market value of own shares held is £44.2 million (2014: £44.0 million). Shares held on trust for employee share schemes
represent 0.2% (2014: 0.2%) of issued share capital. Treasury shares held represent 4.6% (2014: 4.9%) of issued share capital.
Dividends on own shares have been waived.
Capital management The Group considers its capital to comprise total equity (as disclosed on the face of the Group balance sheet) and net debt (note 30).
In managing its capital the primary objective is to ensure that the Group is able to continue to operate as a going concern and to
maximise return to shareholders through a combination of capital growth and distributions. The Group seeks to maintain a ratio
of debt to equity that both balances risks and returns at an acceptable level and retains sufficient funds to comply with lending
covenants, achieve working capital targets and meet investment requirements. The Board reviews the Group’s dividend policy and
funding requirements at least once a year.
29 WORKING CAPITAL AND NON-CASH MOVEMENTS
Working capital movement 2015
£m 2014
£m
Increase in inventories (2.3) (1.5)
Increase in trade and other receivables (12.4) (3.9)
Increase/(decrease) in trade and other payables 25.4 (18.3)
10.7 (23.7)
Non-cash movements 2015
£m 2014
£m
Income from other non-current assets (0.2) (0.2)
Movements in respect of property, plant and equipment, assets held for sale and intangible assets 29.4 77.6
Share-based payments 0.8 0.7
30.0 78.1
Further details of movements in respect of property, plant and equipment, assets held for sale and intangible assets are given in
notes 4, 11, 12 and 15.
108
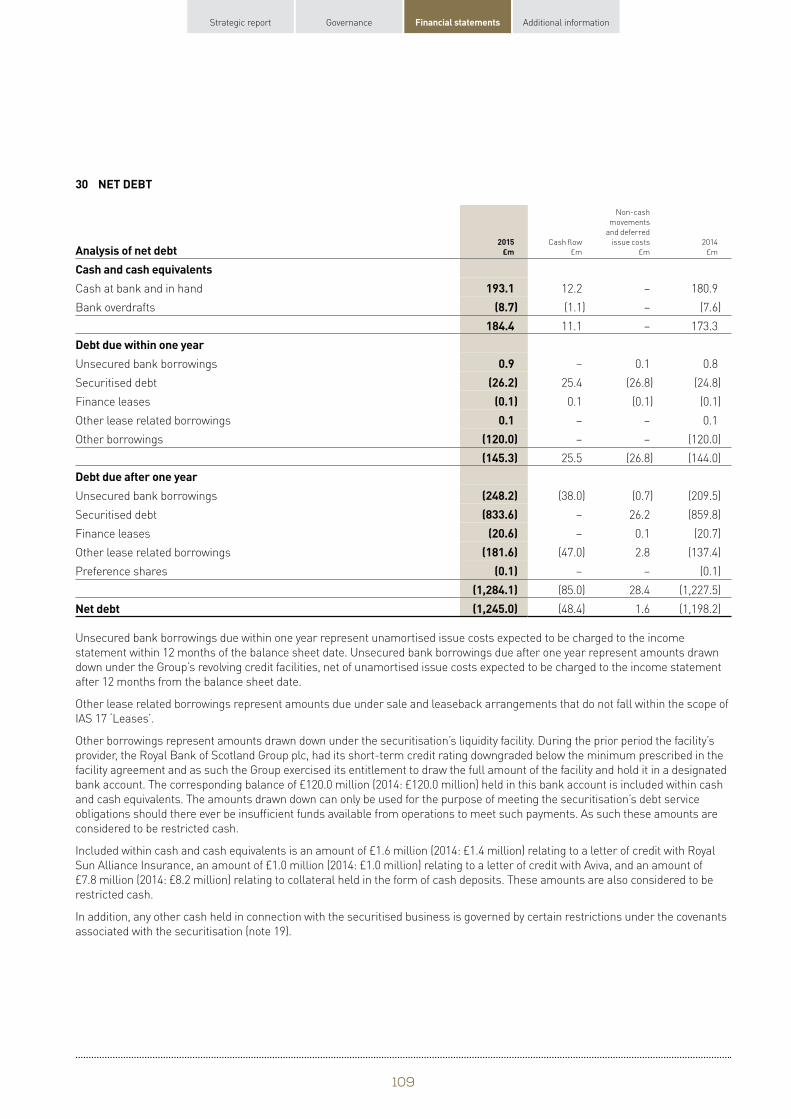
Strategic report Governance Financial statements Additional information
30 NET DEBT
Analysis of net debt 2015
£m Cash flow
£m
Non-cash
movements
and deferred
issue costs
£m
2014
£m
Cash and cash equivalents Cash at bank and in hand 193.1 12.2 – 180.9
Bank overdrafts (8.7) (1.1) – (7.6)
184.4 11.1 – 173.3
Debt due within one year Unsecured bank borrowings 0.9 – 0.1 0.8
Securitised debt (26.2) 25.4 (26.8) (24.8)
Finance leases (0.1) 0.1 (0.1) (0.1)
Other lease related borrowings 0.1 – – 0.1
Other borrowings (120.0) – – (120.0)
(145.3) 25.5 (26.8) (144.0)
Debt due after one year Unsecured bank borrowings (248.2) (38.0) (0.7) (209.5)
Securitised debt (833.6) – 26.2 (859.8)
Finance leases (20.6) – 0.1 (20.7)
Other lease related borrowings (181.6) (47.0) 2.8 (137.4)
Preference shares (0.1) – – (0.1)
(1,284.1) (85.0) 28.4 (1,227.5)
Net debt (1,245.0) (48.4) 1.6 (1,198.2)
Unsecured bank borrowings due within one year represent unamortised issue costs expected to be charged to the income
statement within 12 months of the balance sheet date. Unsecured bank borrowings due after one year represent amounts drawn
down under the Group’s revolving credit facilities, net of unamortised issue costs expected to be charged to the income statement
after 12 months from the balance sheet date.
Other lease related borrowings represent amounts due under sale and leaseback arrangements that do not fall within the scope of
IAS 17 ‘Leases’.
Other borrowings represent amounts drawn down under the securitisation’s liquidity facility. During the prior period the facility’s
provider, the Royal Bank of Scotland Group plc, had its short-term credit rating downgraded below the minimum prescribed in the
facility agreement and as such the Group exercised its entitlement to draw the full amount of the facility and hold it in a designated
bank account. The corresponding balance of £120.0 million (2014: £120.0 million) held in this bank account is included within cash
and cash equivalents. The amounts drawn down can only be used for the purpose of meeting the securitisation’s debt service
obligations should there ever be insufficient funds available from operations to meet such payments. As such these amounts are
considered to be restricted cash.
Included within cash and cash equivalents is an amount of £1.6 million (2014: £1.4 million) relating to a letter of credit with Royal
Sun Alliance Insurance, an amount of £1.0 million (2014: £1.0 million) relating to a letter of credit with Aviva, and an amount of
£7.8 million (2014: £8.2 million) relating to collateral held in the form of cash deposits. These amounts are also considered to be
restricted cash.
In addition, any other cash held in connection with the securitised business is governed by certain restrictions under the covenants
associated with the securitisation (note 19).
109
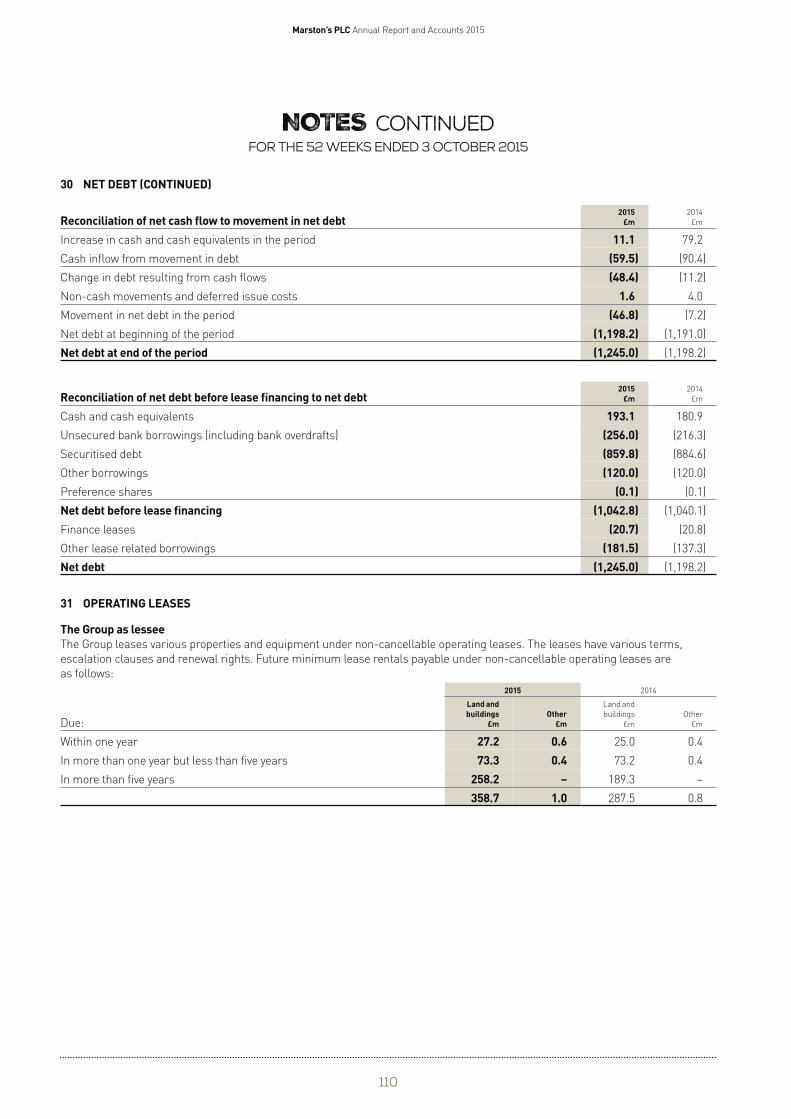
Marston’s PLC Annual Report and Accounts 2015
NOTES continued For the 52 weeks ended 3 October 2015
2015 £m
11.1 (59.5) (48.4)
1.6 (46.8)
(1,198.2) (1,245.0)
30 NET DEBT (CONTINUED)
Reconciliation of net cash flow to movement in net debt Increase in cash and cash equivalents in the period
Cash inflow from movement in debt
Change in debt resulting from cash flows
Non-cash movements and deferred issue costs
Movement in net debt in the period
Net debt at beginning of the period
Net debt at end of the period
Reconciliation of net debt before lease financing to net debt Cash and cash equivalents
Unsecured bank borrowings (including bank overdrafts)
Securitised debt
Other borrowings
Preference shares
Net debt before lease financing Finance leases
Other lease related borrowings
Net debt
31 OPERATING LEASES
The Group as lessee
2015 £m
193.1 (256.0) (859.8) (120.0)
(0.1) (1,042.8)
(20.7) (181.5)
(1,245.0)
2014
£m
79.2
(90.4)
(11.2)
4.0
(7.2)
(1,191.0)
(1,198.2)
2014
£m
180.9
(216.3)
(884.6)
(120.0)
(0.1)
(1,040.1)
(20.8)
(137.3)
(1,198.2)
The Group leases various properties and equipment under non-cancellable operating leases. The leases have various terms,
escalation clauses and renewal rights. Future minimum lease rentals payable under non-cancellable operating leases are
2015 2014
Land and buildings
£m Other
£m
Land and
buildings
£m
Other
£m
27.2 0.6 25.0 0.4
73.3 0.4 73.2 0.4
258.2 – 189.3 –
358.7 1.0 287.5 0.8
as follows:
Due:
Within one year
In more than one year but less than five years
In more than five years
110
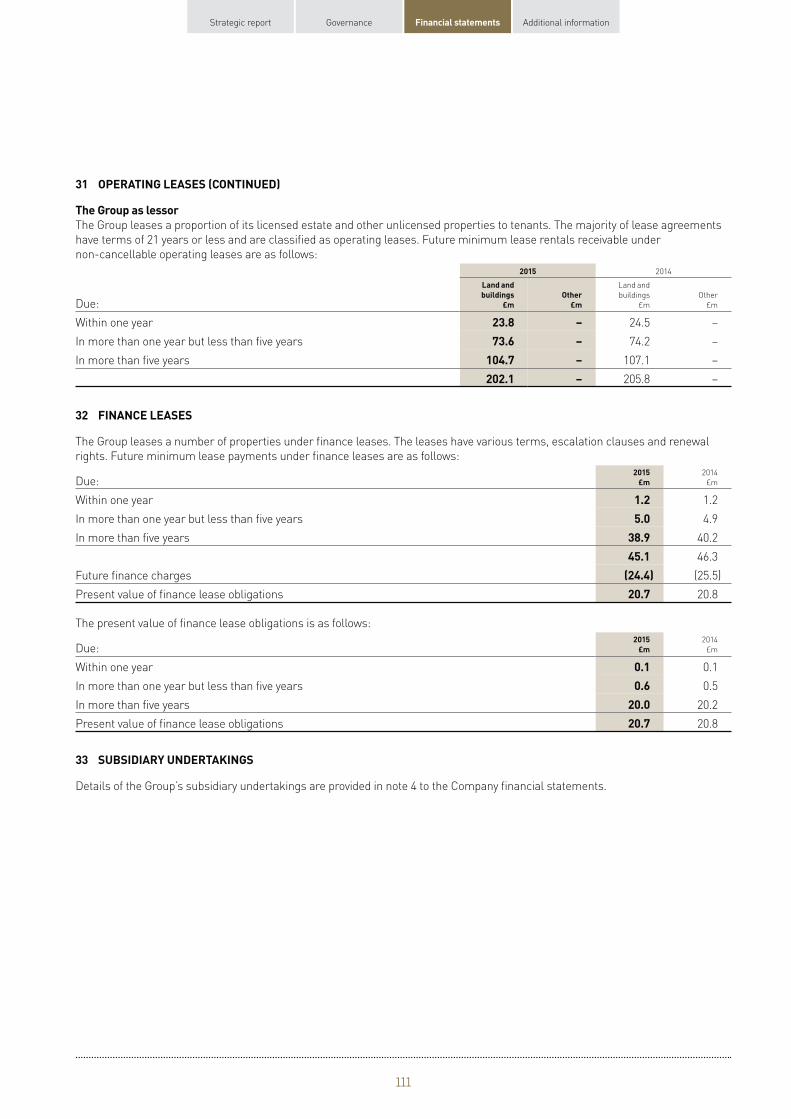
Strategic report Governance Financial statements Additional information
31 OPERATING LEASES (CONTINUED)
The Group as lessor The Group leases a proportion of its licensed estate and other unlicensed properties to tenants. The majority of lease agreements
have terms of 21 years or less and are classified as operating leases. Future minimum lease rentals receivable under
non-cancellable operating leases are as follows:
2014
Land and
buildings Other
Due: £m £m
Within one year 24.5 –
In more than one year but less than five years 74.2 –
In more than five years 107.1 –
205.8 –
2015
Land and buildings
£m Other
£m
23.8 – 73.6 –
104.7 – 202.1 –
32 FINANCE LEASES
The Group leases a number of properties under finance leases. The leases have various terms, escalation clauses and renewal
rights. Future minimum lease payments under finance leases are as follows:
Due: 2015
£m 2014
£m
Within one year 1.2 1.2
In more than one year but less than five years 5.0 4.9
In more than five years 38.9 40.2
45.1 46.3
Future finance charges (24.4) (25.5)
Present value of finance lease obligations 20.7 20.8
The present value of finance lease obligations is as follows:
2014
Due: £m
Within one year 0.1
In more than one year but less than five years 0.5
In more than five years 20.2
Present value of finance lease obligations 20.8
2015 £m
0.1 0.6
20.0 20.7
33 SUBSIDIARY UNDERTAKINGS
Details of the Group’s subsidiary undertakings are provided in note 4 to the Company financial statements.
111
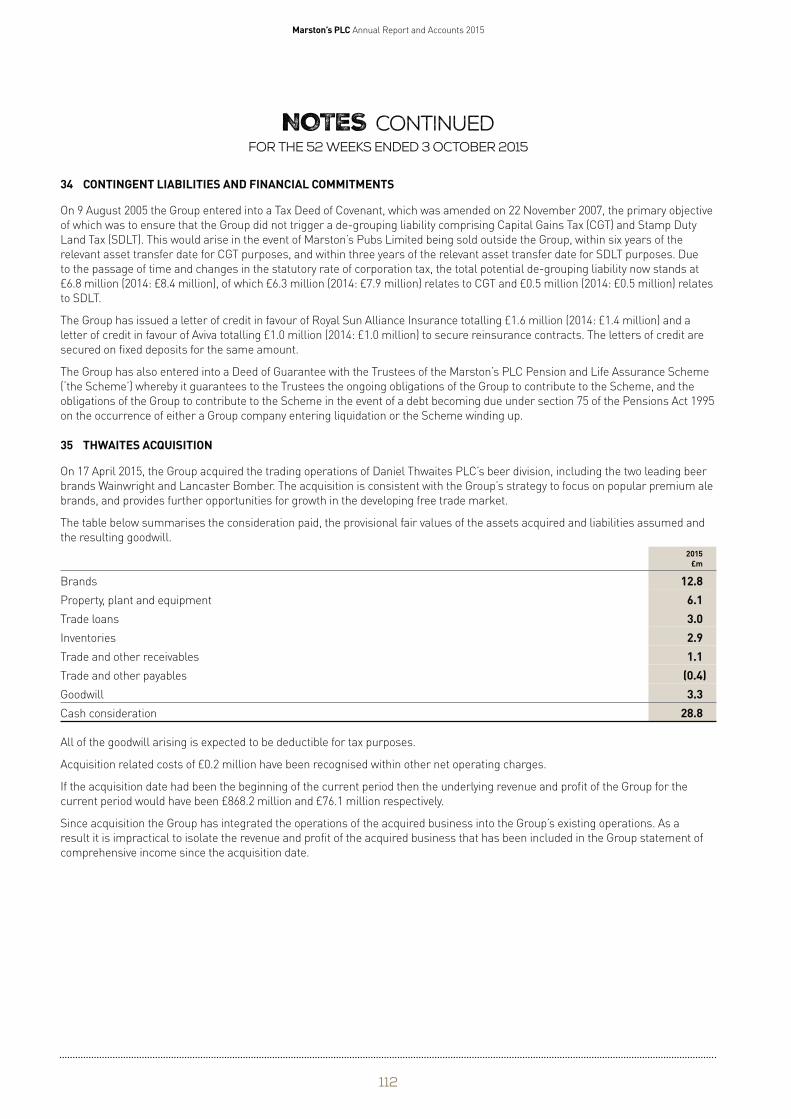
Marston’s PLC Annual Report and Accounts 2015
NOTES continued For the 52 weeks ended 3 October 2015
34 CONTINGENT LIABILITIES AND FINANCIAL COMMITMENTS
On 9 August 2005 the Group entered into a Tax Deed of Covenant, which was amended on 22 November 2007, the primary objective
of which was to ensure that the Group did not trigger a de-grouping liability comprising Capital Gains Tax (CGT) and Stamp Duty
Land Tax (SDLT). This would arise in the event of Marston’s Pubs Limited being sold outside the Group, within six years of the
relevant asset transfer date for CGT purposes, and within three years of the relevant asset transfer date for SDLT purposes. Due
to the passage of time and changes in the statutory rate of corporation tax, the total potential de-grouping liability now stands at
£6.8 million (2014: £8.4 million), of which £6.3 million (2014: £7.9 million) relates to CGT and £0.5 million (2014: £0.5 million) relates
to SDLT.
The Group has issued a letter of credit in favour of Royal Sun Alliance Insurance totalling £1.6 million (2014: £1.4 million) and a
letter of credit in favour of Aviva totalling £1.0 million (2014: £1.0 million) to secure reinsurance contracts. The letters of credit are
secured on fixed deposits for the same amount.
The Group has also entered into a Deed of Guarantee with the Trustees of the Marston’s PLC Pension and Life Assurance Scheme
(‘the Scheme’) whereby it guarantees to the Trustees the ongoing obligations of the Group to contribute to the Scheme, and the
obligations of the Group to contribute to the Scheme in the event of a debt becoming due under section 75 of the Pensions Act 1995
on the occurrence of either a Group company entering liquidation or the Scheme winding up.
35 THWAITES ACQUISITION
On 17 April 2015, the Group acquired the trading operations of Daniel Thwaites PLC’s beer division, including the two leading beer
brands Wainwright and Lancaster Bomber. The acquisition is consistent with the Group’s strategy to focus on popular premium ale
brands, and provides further opportunities for growth in the developing free trade market.
The table below summarises the consideration paid, the provisional fair values of the assets acquired and liabilities assumed and
the resulting goodwill.
2015 £m
Brands 12.8 Property, plant and equipment 6.1 Trade loans 3.0 Inventories 2.9 Trade and other receivables 1.1 Trade and other payables (0.4) Goodwill 3.3 Cash consideration 28.8
All of the goodwill arising is expected to be deductible for tax purposes.
Acquisition related costs of £0.2 million have been recognised within other net operating charges.
If the acquisition date had been the beginning of the current period then the underlying revenue and profit of the Group for the
current period would have been £868.2 million and £76.1 million respectively.
Since acquisition the Group has integrated the operations of the acquired business into the Group’s existing operations. As a
result it is impractical to isolate the revenue and profit of the acquired business that has been included in the Group statement of
comprehensive income since the acquisition date.
112
Strategic report Governance Financial statements Additional information
Independent auditors’ report to themembers of Marston's PLC
REPORT ON THE PARENT COMPANY FINANCIAL STATEMENTS
Our opinion In our opinion, Marston’s PLC’s Parent Company financial statements (the ‘financial statements’):
• give a true and fair view of the state of the Parent Company’s affairs as at 3 October 2015;
• have been properly prepared in accordance with United Kingdom Generally Accepted Accounting Practice; and
• have been prepared in accordance with the requirements of the Companies Act 2006.
What we have audited The financial statements, included within the Annual Report and Accounts (the ‘Annual Report’), comprise:
• the Company Balance Sheet as at 3 October 2015; and
• the notes to the financial statements, which include a summary of significant accounting policies and other
explanatory information.
Certain required disclosures have been presented elsewhere in the Annual Report, rather than in the notes to the financial
statements. These are cross-referenced from the financial statements and are identified as audited.
The financial reporting framework that has been applied in the preparation of the financial statements is applicable law and United
Kingdom Accounting Standards (United Kingdom Generally Accepted Accounting Practice).
OTHER REQUIRED REPORTING
Consistency of other information Companies Act 2006 opinion
In our opinion, the information given in the Strategic Report and the Directors’ Report for the financial period for which the financial
statements are prepared is consistent with the financial statements.
ISAs (UK & Ireland) reporting
Under International Standards on Auditing (UK and Ireland) (‘ISAs (UK & Ireland)’) we are required to report to you if, in our opinion,
information in the Annual Report is:
• materially inconsistent with the information in the audited financial statements; or
• apparently materially incorrect based on, or materially inconsistent with, our knowledge of the Company acquired in the course
of performing our audit; or
• otherwise misleading.
We have no exceptions to report arising from this responsibility.
Adequacy of accounting records and information and explanations received Under the Companies Act 2006 we are required to report to you if, in our opinion:
• we have not received all the information and explanations we require for our audit; or
• adequate accounting records have not been kept by the Parent Company, or returns adequate for our audit have not been
received from branches not visited by us; or
• the financial statements and the part of the Directors’ Remuneration Report to be audited are not in agreement with the
accounting records and returns.
We have no exceptions to report arising from this responsibility.
Directors’ remuneration Directors’ Remuneration Report – Companies Act 2006 opinion
In our opinion, the part of the Directors’ Remuneration Report to be audited has been properly prepared in accordance with the
Companies Act 2006.
Other Companies Act 2006 reporting
Under the Companies Act 2006 we are required to report to you if, in our opinion, certain disclosures of Directors’ remuneration
specified by law are not made. We have no exceptions to report arising from this responsibility.
113
Marston’s PLC Annual Report and Accounts 2015
Independent auditors’ report to themembers of Marston's PLC continued
RESPONSIBILITIES FOR THE FINANCIAL STATEMENTS AND THE AUDIT
Our responsibilities and those of the Directors As explained more fully in the Statement of Directors' Responsibilities set out on page 62, the Directors are responsible for the
preparation of the financial statements and for being satisfied that they give a true and fair view.
Our responsibility is to audit and express an opinion on the financial statements in accordance with applicable law and ISAs
(UK & Ireland). Those standards require us to comply with the Auditing Practices Board’s Ethical Standards for Auditors.
This report, including the opinions, has been prepared for and only for the Company’s members as a body in accordance with
Chapter 3 of Part 16 of the Companies Act 2006 and for no other purpose. We do not, in giving these opinions, accept or assume
responsibility for any other purpose or to any other person to whom this report is shown or into whose hands it may come save
where expressly agreed by our prior consent in writing.
What an audit of financial statements involves We conducted our audit in accordance with ISAs (UK & Ireland). An audit involves obtaining evidence about the amounts and
disclosures in the financial statements sufficient to give reasonable assurance that the financial statements are free from material
misstatement, whether caused by fraud or error. This includes an assessment of:
• whether the accounting policies are appropriate to the Parent Company’s circumstances and have been consistently applied and
adequately disclosed;
• the reasonableness of significant accounting estimates made by the Directors; and
• the overall presentation of the financial statements.
We primarily focus our work in these areas by assessing the Directors’ judgements against available evidence, forming our own
judgements, and evaluating the disclosures in the financial statements.
We test and examine information, using sampling and other auditing techniques, to the extent we consider necessary to provide
a reasonable basis for us to draw conclusions. We obtain audit evidence through testing the effectiveness of controls, substantive
procedures or a combination of both.
In addition, we read all the financial and non-financial information in the Annual Report to identify material inconsistencies with
the audited financial statements and to identify any information that is apparently materially incorrect based on, or materially
inconsistent with, the knowledge acquired by us in the course of performing the audit. If we become aware of any apparent material
misstatements or inconsistencies we consider the implications for our report.
OTHER MATTER
We have reported separately on the Group financial statements of Marston's PLC for the period ended 3 October 2015.
Mark Smith (Senior Statutory Auditor) for and on behalf of PricewaterhouseCoopers LLP
Chartered Accountants and Statutory Auditors
Birmingham
26 November 2015
114
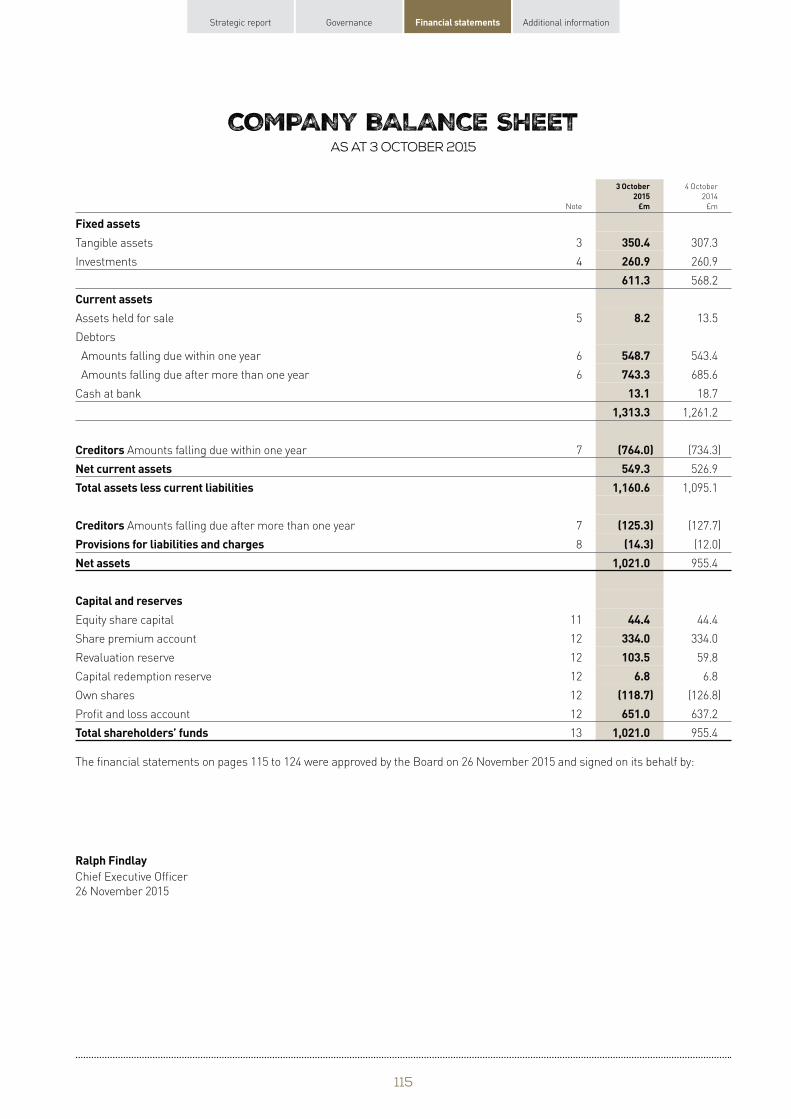
Strategic report Governance Financial statements Additional information
COMPANY BALANCE SHEEt As at 3 October 2015
Note
3 October 2015
£m
4 October
2014
£m
Fixed assets Tangible assets 3 350.4 307.3
Investments 4 260.9 260.9
611.3 568.2
Current assets Assets held for sale 5 8.2 13.5
Debtors
Amounts falling due within one year 6 548.7 543.4
Amounts falling due after more than one year 6 743.3 685.6
Cash at bank 13.1 18.7
1,313.3 1,261.2
Creditors Amounts falling due within one year 7 (764.0) (734.3)
Net current assets 549.3 526.9
Total assets less current liabilities 1,160.6 1,095.1
Creditors Amounts falling due after more than one year 7 (125.3) (127.7)
Provisions for liabilities and charges 8 (14.3) (12.0)
Net assets 1,021.0 955.4
Capital and reserves Equity share capital 11 44.4 44.4
Share premium account 12 334.0 334.0
Revaluation reserve 12 103.5 59.8
Capital redemption reserve 12 6.8 6.8
Own shares 12 (118.7) (126.8)
Profit and loss account 12 651.0 637.2
Total shareholders’ funds 13 1,021.0 955.4
The financial statements on pages 115 to 124 were approved by the Board on 26 November 2015 and signed on its behalf by:
Ralph Findlay Chief Executive Officer
26 November 2015
115
1
Marston’s PLC Annual Report and Accounts 2015
NOTES For the 52 weeks ended 3 October 2015
ACCOUNTING POLICIES
Basis of preparation The Company financial statements are prepared on the going concern basis, under the historical cost convention, as modified
by the revaluation of certain freehold and leasehold properties and derivative financial instruments, and in accordance with the
Companies Act 2006 and applicable UK accounting standards.
As a result of the issue by the Financial Reporting Council of revised financial reporting standards for the UK, the Company will be
required to adopt a new accounting framework in its individual financial statements for the financial period ending 1 October 2016
and all subsequent periods. The Company intends to adopt FRS 102 ‘The Financial Reporting Standard applicable in the UK and
Republic of Ireland’ and take advantage of the disclosure exemptions in paragraph 1.12 of that standard. Any objections to the use
of these disclosure exemptions may be served in writing to the Company’s registered office before 31 March 2016 by a shareholder
or shareholders holding in aggregate 5% or more of the total allotted shares in the Company.
As permitted by section 408(3) of the Companies Act 2006, no profit and loss account has been presented for the Company. As
permitted by section 408(2) of the Companies Act 2006, information about the Company’s employee numbers and costs has not
been presented.
Revenue and other operating income Revenue represents rent receivable from licensed properties, which is recognised in the period to which it relates. Other operating
income comprises mainly rent receivable from unlicensed properties.
Current and deferred tax The current tax charge is calculated on the basis of the tax laws enacted or substantively enacted at the balance sheet date and is
measured at the amount expected to be paid to or recovered from the tax authorities.
Deferred tax is recognised in respect of all timing differences that have originated but not reversed by the balance sheet date that
give rise to an obligation to pay more or less tax in the future. Timing differences are differences between the Company’s taxable
profits and profits as stated in the financial statements. Deferred tax assets and liabilities are not discounted and assets are only
recognised where recoverability is probable.
Deferred tax has been calculated at the tax rates expected to apply in the periods in which timing differences reverse, based on tax
rates and laws enacted or substantively enacted at the balance sheet date.
Fixed assets • Freehold and leasehold properties are stated at valuation or at cost. Fixtures, fittings, plant and equipment are stated at cost.
• Depreciation is charged to the profit and loss account on a straight-line basis to provide for the cost of the assets less residual
value over their useful lives.
• Freehold and long leasehold buildings are depreciated to their residual value over 50 years.
• Short leasehold properties are depreciated over the life of the lease.
• Fixtures, fittings, plant and equipment are depreciated over periods ranging from 3 to 15 years.
• Own labour and interest costs directly attributable to capital projects are capitalised.
• Land is not depreciated.
Properties are revalued by qualified valuers at least once in each rolling three year period, on an existing use basis. Substantially all
of the Company’s properties have been externally valued in accordance with the Royal Institution of Chartered Surveyors’ Red Book.
These valuations are performed directly by reference to observable prices in an active market or recent market transactions on
arm’s length terms. Internal valuations are performed on the same basis.
When a valuation is below current carrying value, the asset concerned is reviewed for impairment. Impairment losses are
charged to the revaluation reserve to the extent that a previous gain has been recorded, and thereafter to the profit and loss
account. Surpluses on revaluation are recognised in the revaluation reserve, except to the extent they reverse previously charged
impairment losses, in which case the reversal is recorded in the profit and loss account.
Assets held for sale Assets, typically properties, are categorised as held for sale when the value of the asset will be recovered through a sale
transaction rather than continuing use. This condition is met when the sale is highly probable, the asset is available for immediate
sale in its present condition and is being actively marketed. In addition, the Company must be committed to the sale and
completion should be expected to occur within one year from the date of classification. Assets held for sale are valued at the lower
of carrying value and fair value less costs to sell, and are no longer depreciated.
116
Strategic report Governance Financial statements Additional information
1 ACCOUNTING POLICIES (CONTINUED)
Disposals of fixed assets Profit/loss on disposal of fixed assets represents net sale proceeds less carrying value of the assets. Any element of the revaluation
reserve relating to the fixed assets disposed of is transferred to the profit and loss reserve at the date of sale.
Leases Rental costs under operating leases are charged to the profit and loss account over the term of the lease. The cost of assets held
under finance leases is included within tangible fixed assets and depreciation is provided in accordance with the policy for the class
of asset concerned. The corresponding obligations under those leases are shown as creditors. The finance charge element of
rentals is charged to the profit and loss account as incurred.
Lease premiums received are recognised on a straight-line basis over the life of the lease.
Obligations arising from sale and leaseback arrangements with repurchase options that do not fall within the scope of SSAP 21
‘Accounting for leases and hire purchase contracts’ are classified as other lease related borrowings and accounted for in
accordance with FRS 26 ‘Financial Instruments: Recognition and Measurement’.
Investments in subsidiaries Investments in subsidiaries are stated at cost, less any provision for diminution in value.
Provisions Provisions are recognised in the balance sheet when the Company has a present legal or constructive obligation as a result of a
past event and it is probable that an outflow of economic benefits will be required to settle the obligation.
Dividends Dividends proposed by the Board but unpaid at the period end are recognised in the financial statements when they have been
approved by the shareholders. Interim dividends are recognised when paid.
Preference shares Preference shares are treated as borrowings, and dividends payable on those preference shares are charged as interest in the
profit and loss account.
Group undertakings There is an intra group funding agreement in place between the Company and certain other members of the Group. This
agreement stipulates that all balances outstanding on any intercompany loan account between these companies which exceed £1
are interest bearing at a prescribed rate.
In the prior period it was agreed that no interest would be charged on any balances due to/from certain Group companies during
the period of their restructuring.
There is a 12.5% subordinated loan due to the Company from Marston’s Pubs Limited. No interest is payable on any other amounts
owed by/to Group companies who are not party to the intra group funding agreement.
All amounts owed by/to Group undertakings are unsecured and, with the exception of the subordinated loan, repayable on demand.
Derivative financial instruments The Company uses derivative financial instruments to hedge the Group’s exposure to fluctuations in interest rates. Derivative
financial instruments are initially recognised in the balance sheet at fair value and are subsequently remeasured to their fair value
at each balance sheet date. The Company has not designated any derivative financial instruments as hedging instruments and as
such any gains or losses on remeasurement are recognised in the profit and loss account immediately.
2 AUDITORS’ REMUNERATION
Fees payable to the Company’s Auditors for the audit of the Company’s annual accounts are disclosed in note 3 to the Group
financial statements. Fees paid to the Company’s Auditors for non-audit services to the Company itself are not required to be
disclosed as the Group financial statements disclose such fees on a consolidated basis.
117
Marston’s PLC Annual Report and Accounts 2015
NOTES continued For the 52 weeks ended 3 October 2015
3 TANGIBLE FIXED ASSETS
Land and buildings
£m
Fixtures, fittings,
plant and equipment
£m Total
£m
Cost or valuation At 5 October 2014 292.9 25.4 318.3
Additions 13.4 1.3 14.7
Net transfers to assets held for sale and disposals (7.6) (0.3) (7.9)
Revaluation 35.8 – 35.8
Net transfers from Group undertakings 1.1 0.2 1.3
At 3 October 2015 335.6 26.6 362.2
Depreciation At 5 October 2014 2.2 8.8 11.0
Charge for the period 1.5 2.2 3.7
Net transfers to assets held for sale and disposals – (0.3) (0.3)
Revaluation (2.6) – (2.6)
At 3 October 2015 1.1 10.7 11.8
Net book value at 4 October 2014 290.7 16.6 307.3
Net book value at 3 October 2015 334.5 15.9 350.4
The net book value of land and buildings is split as follows:
2014
£m
Freehold properties 202.0
Leasehold properties over 50 years unexpired 75.2
Leasehold properties under 50 years unexpired 13.5
290.7
2015 £m
237.1 74.7 22.7
334.5
Cost or valuation of land and buildings comprises:
2014
£m
Valuation 254.5
At cost 38.4
292.9
2015 £m
335.6 –
335.6
If the land and buildings had not been revalued, the historical cost net book value would be £242.7 million (2014: £242.8 million).
Cost at 3 October 2015 includes £3.5 million (2014: £2.5 million) of assets in the course of construction.
Capital expenditure authorised and committed at the period end but not provided for in the financial statements was £1.8 million
(2014: £0.5 million).
The net book value of land and buildings held under finance leases at 3 October 2015 was £28.0 million (2014: £21.8 million). The
net book value of land and buildings held as part of sale and leaseback arrangements that do not fall within the scope of SSAP 21
‘Accounting for leases and hire purchase contracts’ was £134.6 million (2014: £113.9 million).
118
3
4
Strategic report Governance Financial statements Additional information
TANGIBLE FIXED ASSETS (CONTINUED)
Revaluation/impairment At 1 February 2015 independent chartered surveyors revalued the Company’s freehold and leasehold properties on an open market
value basis. These valuations have been incorporated into the financial statements and the resulting revaluation adjustments have
been recognised in the revaluation reserve or profit and loss account as appropriate.
During the prior period various properties were reviewed for impairment and/or material changes in value. These valuation
adjustments were recognised in the revaluation reserve or the profit and loss account as appropriate.
The impact of the revaluations/impairments described above is as follows:
2015 £m
2014
£m
Profit and loss account: Revaluation loss charged as an impairment (12.5) (0.9)
Reversal of past impairment 3.5 –
(9.0) (0.9)
Revaluation reserve: Unrealised revaluation surplus 52.2 11.7
Reversal of past revaluation surplus (4.8) (0.3)
47.4 11.4
Net increase in shareholders’ funds/fixed assets 38.4 10.5
FIXED ASSET INVESTMENTS
Subsidiary undertakings
£m
Cost At 5 October 2014 316.5
Capital contribution in respect of equity-settled share-based payments 0.8
At 3 October 2015 317.3
Impairments At 5 October 2014 55.6
Charged in the period 0.8
At 3 October 2015 56.4
Net book value at 4 October 2014 260.9
Net book value at 3 October 2015 260.9
The cost and the accumulated impairment of fixed asset investments at 5 October 2014 have been restated to reflect the
cumulative impact of capital contributions to Marston’s Trading Limited in respect of equity-settled share-based payments and the
associated impairment of these amounts.
119
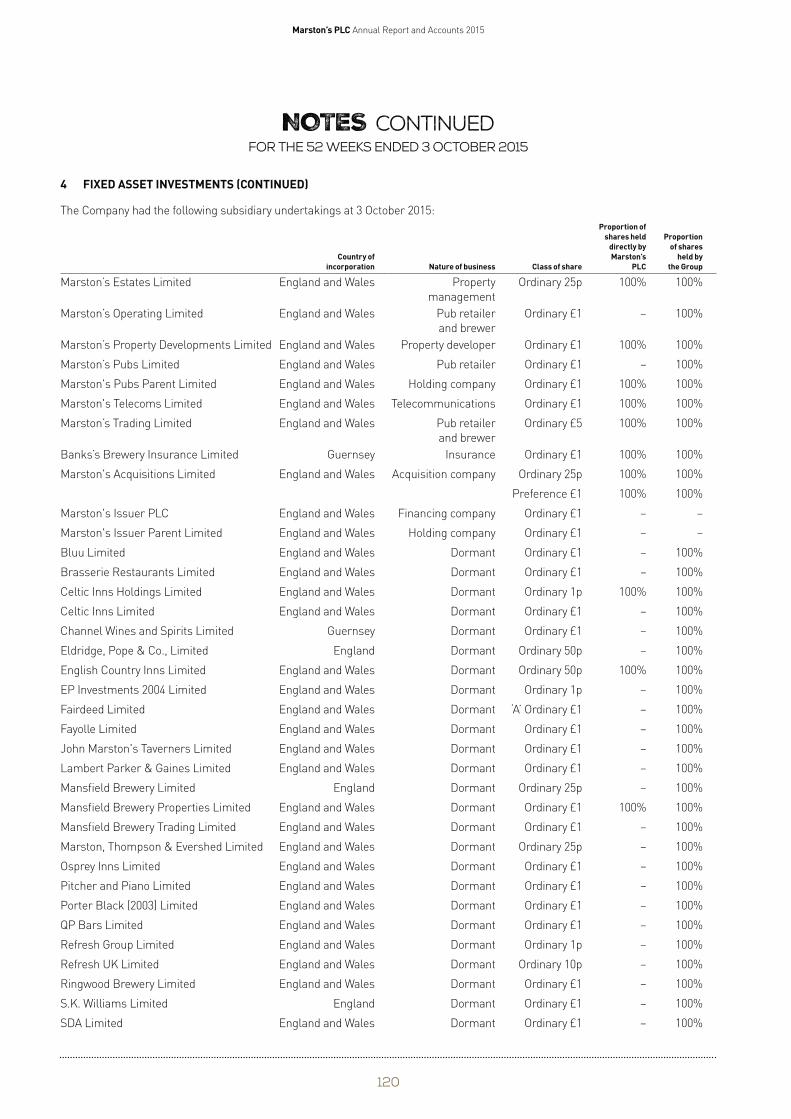
Marston’s PLC Annual Report and Accounts 2015
NOTES continued For the 52 weeks ended 3 October 2015
4 FIXED ASSET INVESTMENTS (CONTINUED)
The Company had the following subsidiary undertakings at 3 October 2015:
Proportion of shares held Proportion
directly by of shares Country of Marston’s held by
incorporation Nature of business Class of share PLC the Group
Marston’s Estates Limited England and Wales Property Ordinary 25p 100% 100%
management
Marston’s Operating Limited England and Wales Pub retailer Ordinary £1 – 100%
and brewer
Marston’s Property Developments Limited England and Wales Property developer Ordinary £1 100% 100%
Marston’s Pubs Limited England and Wales Pub retailer Ordinary £1 – 100%
Marston's Pubs Parent Limited England and Wales Holding company Ordinary £1 100% 100%
Marston's Telecoms Limited England and Wales Telecommunications Ordinary £1 100% 100%
Marston’s Trading Limited England and Wales Pub retailer Ordinary £5 100% 100%
and brewer
Banks’s Brewery Insurance Limited Guernsey Insurance Ordinary £1 100% 100%
Marston's Acquisitions Limited England and Wales Acquisition company Ordinary 25p 100% 100%
Preference £1 100% 100%
Marston's Issuer PLC England and Wales Financing company Ordinary £1 – –
Marston's Issuer Parent Limited England and Wales Holding company Ordinary £1 – –
Bluu Limited England and Wales Dormant Ordinary £1 – 100%
Brasserie Restaurants Limited England and Wales Dormant Ordinary £1 – 100%
Celtic Inns Holdings Limited England and Wales Dormant Ordinary 1p 100% 100%
Celtic Inns Limited England and Wales Dormant Ordinary £1 – 100%
Channel Wines and Spirits Limited Guernsey Dormant Ordinary £1 – 100%
Eldridge, Pope & Co., Limited England Dormant Ordinary 50p – 100%
English Country Inns Limited England and Wales Dormant Ordinary 50p 100% 100%
EP Investments 2004 Limited England and Wales Dormant Ordinary 1p – 100%
Fairdeed Limited England and Wales Dormant ‘A’ Ordinary £1 – 100%
Fayolle Limited England and Wales Dormant Ordinary £1 – 100%
John Marston's Taverners Limited England and Wales Dormant Ordinary £1 – 100%
Lambert Parker & Gaines Limited England and Wales Dormant Ordinary £1 – 100%
Mansfield Brewery Limited England Dormant Ordinary 25p – 100%
Mansfield Brewery Properties Limited England and Wales Dormant Ordinary £1 100% 100%
Mansfield Brewery Trading Limited England and Wales Dormant Ordinary £1 – 100%
Marston, Thompson & Evershed Limited England and Wales Dormant Ordinary 25p – 100%
Osprey Inns Limited England and Wales Dormant Ordinary £1 – 100%
Pitcher and Piano Limited England and Wales Dormant Ordinary £1 – 100%
Porter Black (2003) Limited England and Wales Dormant Ordinary £1 – 100%
QP Bars Limited England and Wales Dormant Ordinary £1 – 100%
Refresh Group Limited England and Wales Dormant Ordinary 1p – 100%
Refresh UK Limited England and Wales Dormant Ordinary 10p – 100%
Ringwood Brewery Limited England and Wales Dormant Ordinary £1 – 100%
S.K. Williams Limited England Dormant Ordinary £1 – 100%
SDA Limited England and Wales Dormant Ordinary £1 – 100%
120
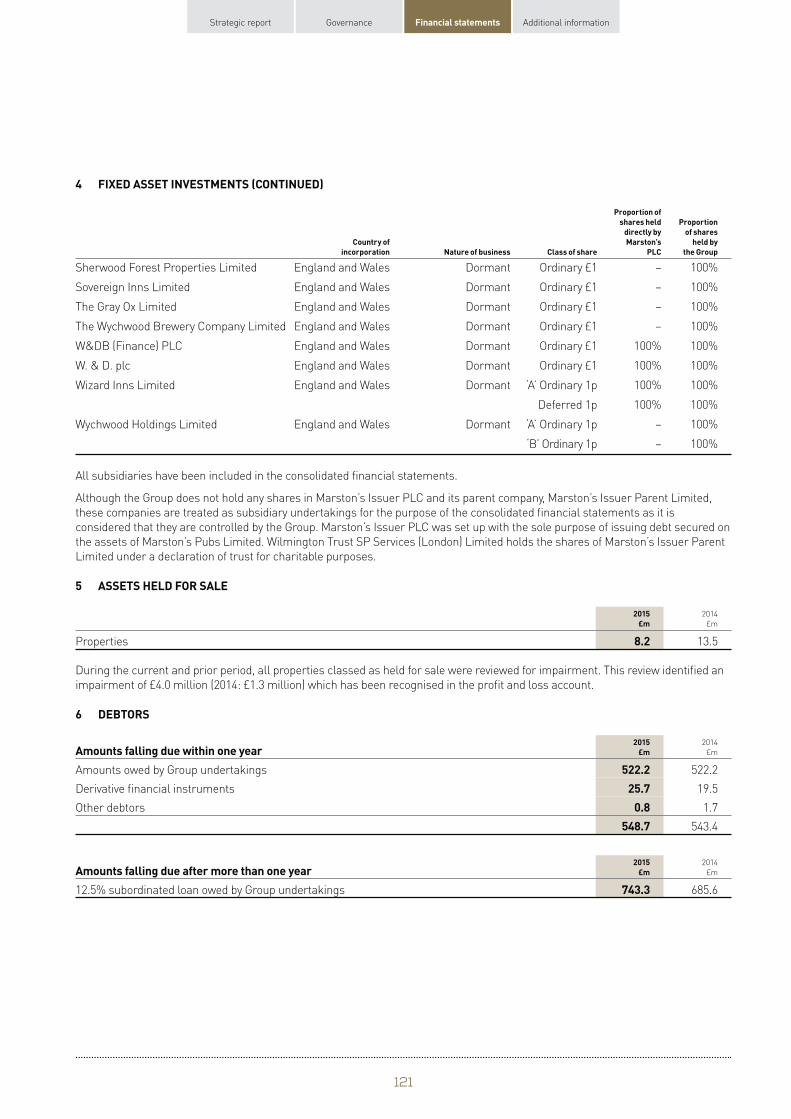
5
6
Strategic report Governance Financial statements Additional information
4 FIXED ASSET INVESTMENTS (CONTINUED)
Country of incorporation Nature of business Class of share
Proportion of shares held
directly by Marston’s
PLC
Proportion of shares
held by the Group
Sherwood Forest Properties Limited England and Wales Dormant Ordinary £1 – 100%
Sovereign Inns Limited England and Wales Dormant Ordinary £1 – 100%
The Gray Ox Limited England and Wales Dormant Ordinary £1 – 100%
The Wychwood Brewery Company Limited England and Wales Dormant Ordinary £1 – 100%
W&DB (Finance) PLC England and Wales Dormant Ordinary £1 100% 100%
W. & D. plc England and Wales Dormant Ordinary £1 100% 100%
Wizard Inns Limited England and Wales Dormant ‘A’ Ordinary 1p 100% 100%
Deferred 1p 100% 100%
Wychwood Holdings Limited England and Wales Dormant ‘A’ Ordinary 1p – 100%
‘B’ Ordinary 1p – 100%
All subsidiaries have been included in the consolidated financial statements.
Although the Group does not hold any shares in Marston’s Issuer PLC and its parent company, Marston’s Issuer Parent Limited,
these companies are treated as subsidiary undertakings for the purpose of the consolidated financial statements as it is
considered that they are controlled by the Group. Marston’s Issuer PLC was set up with the sole purpose of issuing debt secured on
the assets of Marston’s Pubs Limited. Wilmington Trust SP Services (London) Limited holds the shares of Marston’s Issuer Parent
Limited under a declaration of trust for charitable purposes.
ASSETS HELD FOR SALE
2015 £m
2014
£m
Properties 8.2 13.5
During the current and prior period, all properties classed as held for sale were reviewed for impairment. This review identified an
impairment of £4.0 million (2014: £1.3 million) which has been recognised in the profit and loss account.
DEBTORS
Amounts falling due within one year 2015
£m 2014
£m
Amounts owed by Group undertakings 522.2 522.2
Derivative financial instruments 25.7 19.5
Other debtors 0.8 1.7
548.7 543.4
Amounts falling due after more than one year 2015
£m 2014
£m
12.5% subordinated loan owed by Group undertakings 743.3 685.6
121
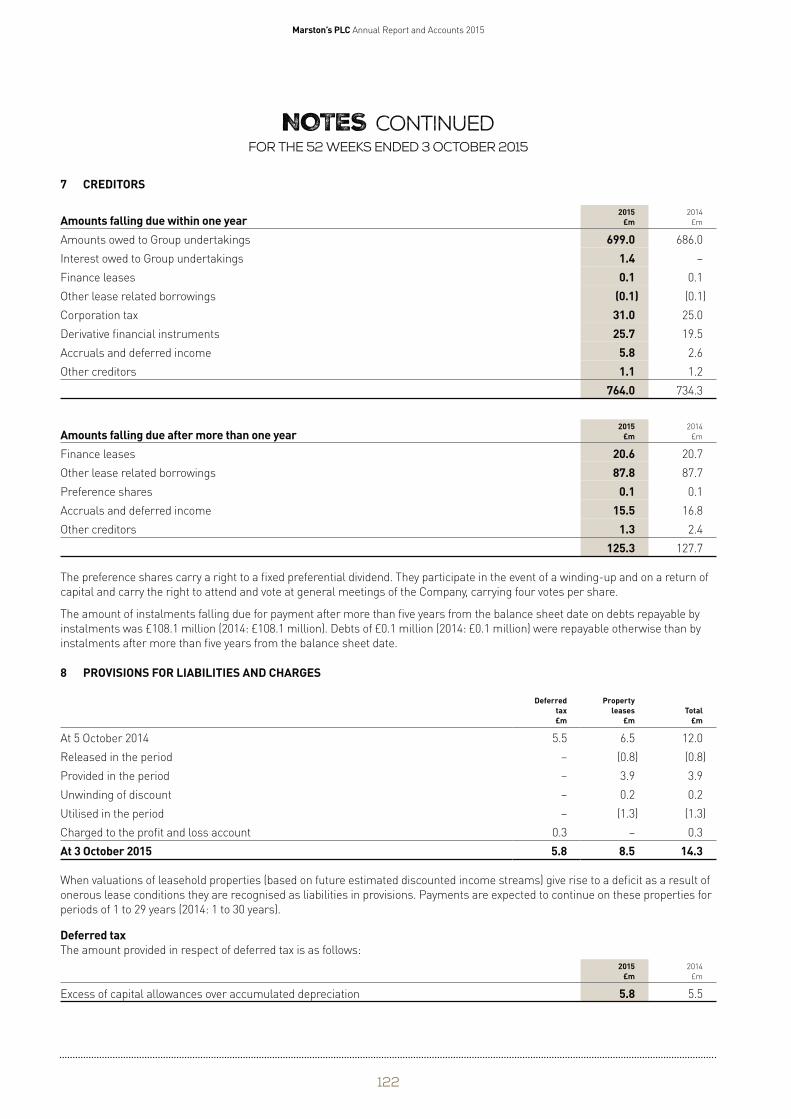
7
Marston’s PLC Annual Report and Accounts 2015
NOTES continued For the 52 weeks ended 3 October 2015
CREDITORS
Amounts falling due within one year 2015
£m 2014
£m
Amounts owed to Group undertakings 699.0 686.0
Interest owed to Group undertakings 1.4 –
Finance leases 0.1 0.1
Other lease related borrowings (0.1) (0.1)
Corporation tax 31.0 25.0
Derivative financial instruments 25.7 19.5
Accruals and deferred income 5.8 2.6
Other creditors 1.1 1.2
764.0 734.3
Amounts falling due after more than one year 2015
£m 2014
£m
Finance leases 20.6 20.7
Other lease related borrowings 87.8 87.7
Preference shares 0.1 0.1
Accruals and deferred income 15.5 16.8
Other creditors 1.3 2.4
125.3 127.7
The preference shares carry a right to a fixed preferential dividend. They participate in the event of a winding-up and on a return of
capital and carry the right to attend and vote at general meetings of the Company, carrying four votes per share.
The amount of instalments falling due for payment after more than five years from the balance sheet date on debts repayable by
instalments was £108.1 million (2014: £108.1 million). Debts of £0.1 million (2014: £0.1 million) were repayable otherwise than by
instalments after more than five years from the balance sheet date.
8 PROVISIONS FOR LIABILITIES AND CHARGES
Deferred tax £m
Property leases
£m Total
£m
At 5 October 2014 5.5 6.5 12.0
Released in the period – (0.8) (0.8)
Provided in the period – 3.9 3.9
Unwinding of discount – 0.2 0.2
Utilised in the period – (1.3) (1.3)
Charged to the profit and loss account 0.3 – 0.3
At 3 October 2015 5.8 8.5 14.3
When valuations of leasehold properties (based on future estimated discounted income streams) give rise to a deficit as a result of
onerous lease conditions they are recognised as liabilities in provisions. Payments are expected to continue on these properties for
periods of 1 to 29 years (2014: 1 to 30 years).
Deferred tax The amount provided in respect of deferred tax is as follows:
2014
£m
Excess of capital allowances over accumulated depreciation 5.5
2015 £m
5.8
122
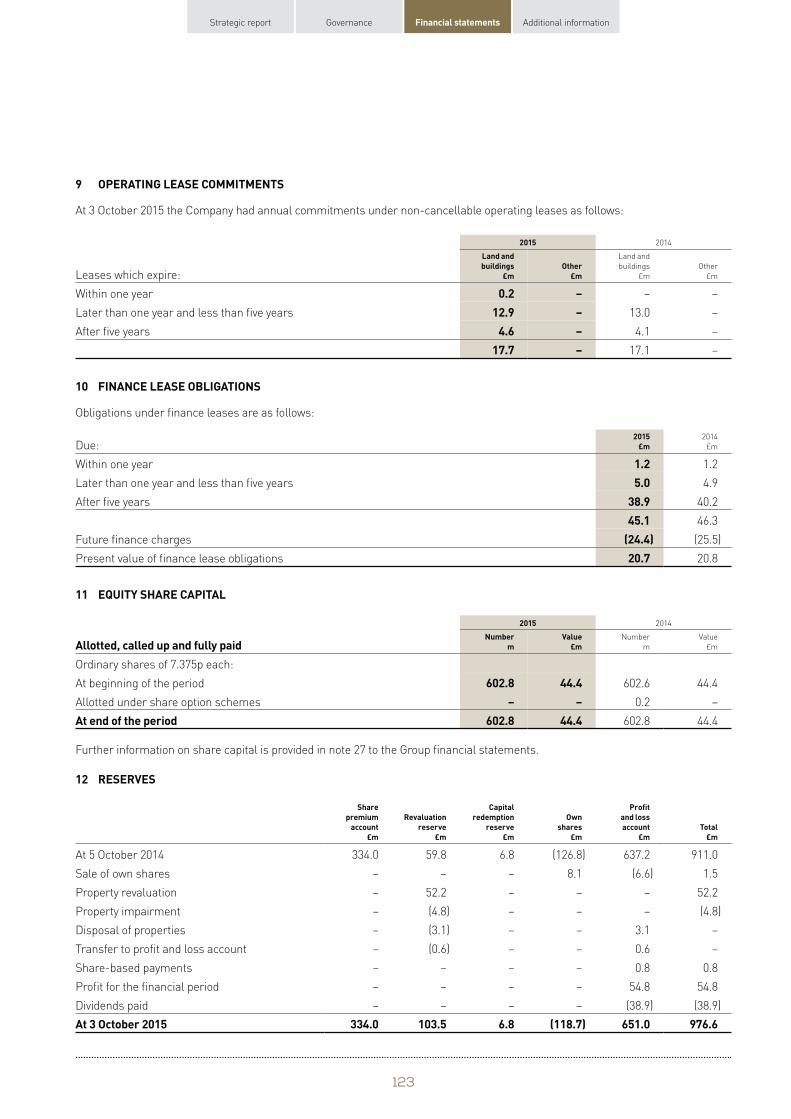
9
Strategic report Governance Financial statements Additional information
OPERATING LEASE COMMITMENTS
At 3 October 2015 the Company had annual commitments under non-cancellable operating leases as follows:
2015 2014
Leases which expire:
Land and buildings
£m Other
£m
Land and
buildings
£m
Other
£m
Within one year 0.2 – – –
Later than one year and less than five years 12.9 – 13.0 –
After five years 4.6 – 4.1 –
17.7 – 17.1 –
10 FINANCE LEASE OBLIGATIONS
Obligations under finance leases are as follows:
Due: 2015
£m 2014
£m
Within one year 1.2 1.2
Later than one year and less than five years 5.0 4.9
After five years 38.9 40.2
45.1 46.3
Future finance charges (24.4) (25.5)
Present value of finance lease obligations 20.7 20.8
11 EQUITY SHARE CAPITAL
2015 2014
Allotted, called up and fully paid Number
m Value
£m Number
m
Value
£m
Ordinary shares of 7.375p each:
At beginning of the period 602.8 44.4 602.6 44.4
Allotted under share option schemes – – 0.2 –
At end of the period 602.8 44.4 602.8 44.4
Further information on share capital is provided in note 27 to the Group financial statements.
12 RESERVES
Share premium
account £m
Revaluation reserve
£m
Capital redemption
reserve £m
Own shares
£m
Profit and loss account
£m Total
£m
At 5 October 2014 334.0 59.8 6.8 (126.8) 637.2 911.0
Sale of own shares – – – 8.1 (6.6) 1.5
Property revaluation – 52.2 – – – 52.2
Property impairment – (4.8) – – – (4.8)
Disposal of properties – (3.1) – – 3.1 –
Transfer to profit and loss account – (0.6) – – 0.6 –
Share-based payments – – – – 0.8 0.8
Profit for the financial period – – – – 54.8 54.8
Dividends paid – – – – (38.9) (38.9)
At 3 October 2015 334.0 103.5 6.8 (118.7) 651.0 976.6
123
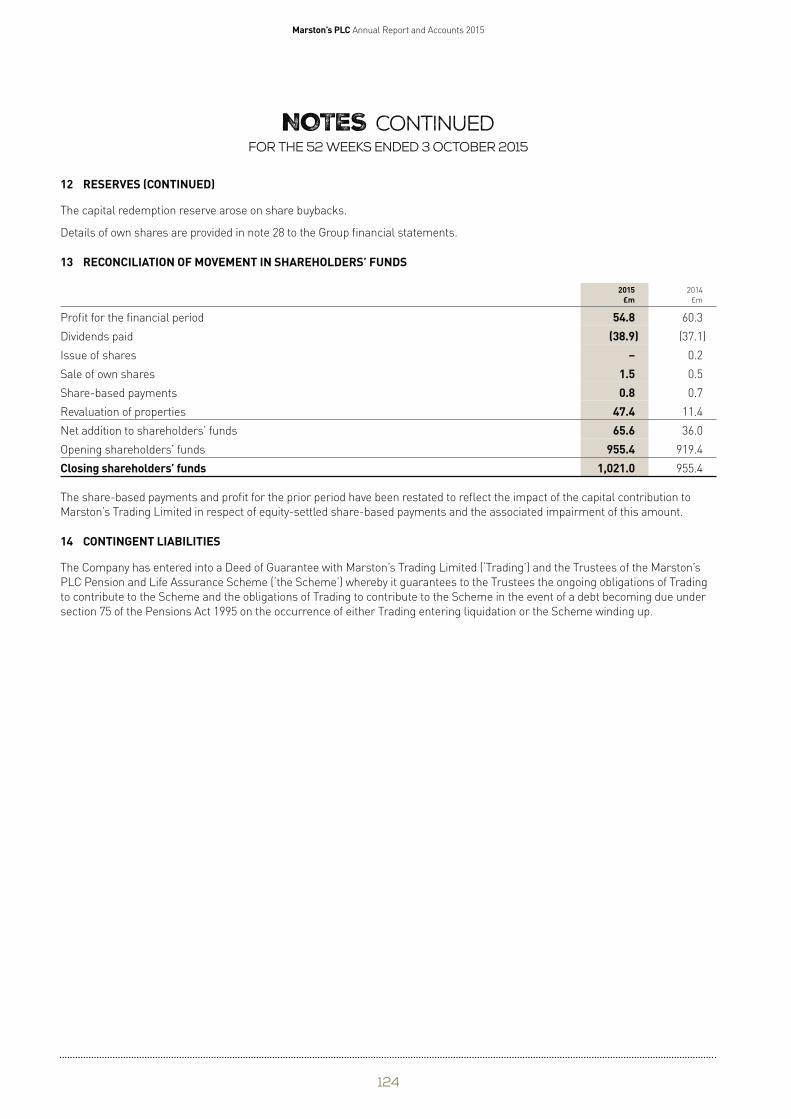
Marston’s PLC Annual Report and Accounts 2015
NOTES continued For the 52 weeks ended 3 October 2015
12 RESERVES (CONTINUED)
The capital redemption reserve arose on share buybacks.
Details of own shares are provided in note 28 to the Group financial statements.
13 RECONCILIATION OF MOVEMENT IN SHAREHOLDERS’ FUNDS
2015 £m
54.8 (38.9)
– 1.5 0.8
47.4 65.6
955.4 1,021.0
Profit for the financial period
Dividends paid
Issue of shares
Sale of own shares
Share-based payments
Revaluation of properties
Net addition to shareholders’ funds
Opening shareholders’ funds
Closing shareholders’ funds
2014
£m
60.3
(37.1)
0.2
0.5
0.7
11.4
36.0
919.4
955.4
The share-based payments and profit for the prior period have been restated to reflect the impact of the capital contribution to
Marston’s Trading Limited in respect of equity-settled share-based payments and the associated impairment of this amount.
14 CONTINGENT LIABILITIES
The Company has entered into a Deed of Guarantee with Marston’s Trading Limited (‘Trading’) and the Trustees of the Marston’s
PLC Pension and Life Assurance Scheme (‘the Scheme’) whereby it guarantees to the Trustees the ongoing obligations of Trading
to contribute to the Scheme and the obligations of Trading to contribute to the Scheme in the event of a debt becoming due under
section 75 of the Pensions Act 1995 on the occurrence of either Trading entering liquidation or the Scheme winding up.
124
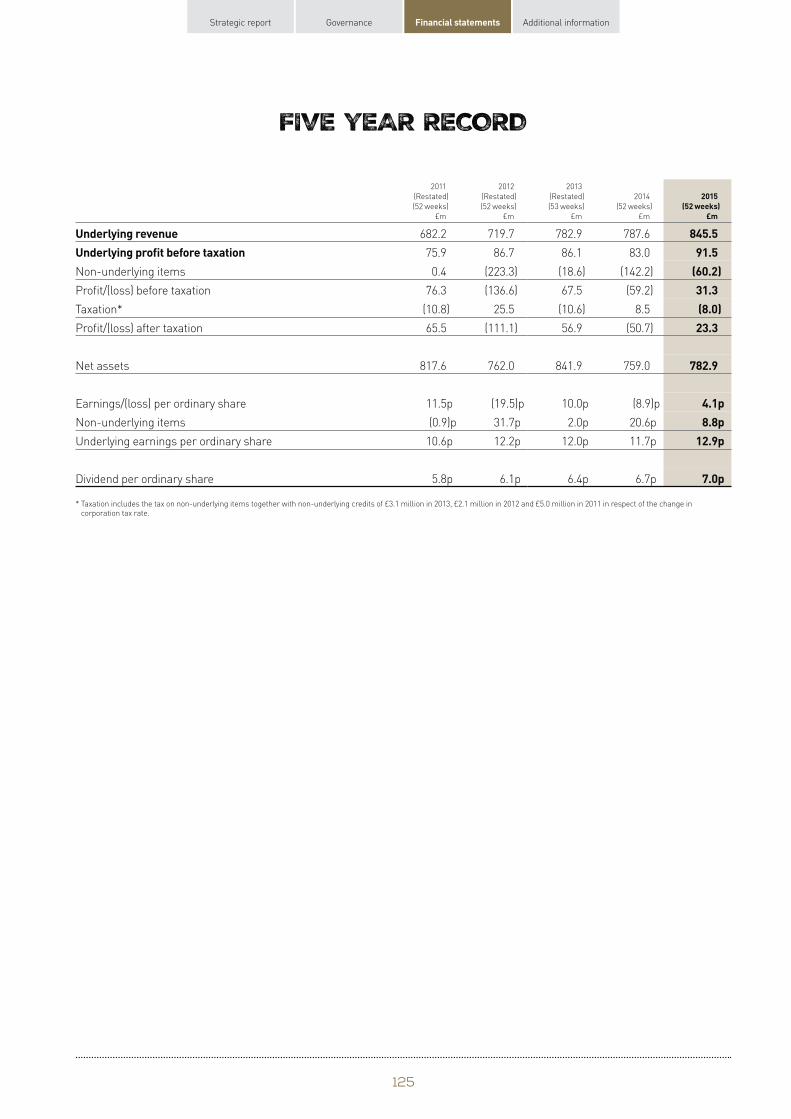
Strategic report Governance Financial statements Additional information
FIVE YEAR RECORD
2011
(Restated)
(52 weeks)
£m
2012
(Restated)
(52 weeks)
£m
2013
(Restated)
(53 weeks)
£m
2014
(52 weeks)
£m
2015 (52 weeks)
£m
Underlying revenue 682.2 719.7 782.9 787.6 845.5 Underlying profit before taxation 75.9 86.7 86.1 83.0 91.5 Non-underlying items 0.4 (223.3) (18.6) (142.2) (60.2) Profit/(loss) before taxation 76.3 (136.6) 67.5 (59.2) 31.3 Taxation* (10.8) 25.5 (10.6) 8.5 (8.0) Profit/(loss) after taxation 65.5 (111.1) 56.9 (50.7) 23.3
Net assets 817.6 762.0 841.9 759.0 782.9
Earnings/(loss) per ordinary share 11.5p (19.5)p 10.0p (8.9)p 4.1p Non-underlying items (0.9)p 31.7p 2.0p 20.6p 8.8p Underlying earnings per ordinary share 10.6p 12.2p 12.0p 11.7p 12.9p
Dividend per ordinary share 5.8p 6.1p 6.4p 6.7p 7.0p
* Taxation includes the tax on non-underlying items together with non-underlying credits of £3.1 million in 2013, £2.1 million in 2012 and £5.0 million in 2011 in respect of the change in corporation tax rate.
125
Marston’s PLC Annual Report and Accounts 2015
Information for Shareholders
Annual General Meeting (AGM) The Company’s AGM will be held on 26 January 2016 at 12 noon at Wolverhampton Wanderers Football Club, Molineux Stadium,
Waterloo Road, Wolverhampton WV1 4QR.
Financial calendar Ex-dividend date for final dividend 17 December 2015
Record date for final dividend 18 December 2015
AGM and Interim Management Statement 26 January 2016
Final dividend payment date 1 February 2016
Half-year results May 2016
Ex-dividend date for interim dividend May 2016
Interim dividend payment date July 2016
Full-year results 24 November 2016
These dates are indicative only and may be subject to change.
The Marston’s website Shareholders are encouraged to visit our website www.marstons.co.uk for further information about the Company. The dedicated
Investors section on the website contains information specifically for shareholders including share price information, historical
dividend amounts and payment dates together with this year’s (and prior years’) Annual Report and Accounts.
Registrars The Company’s shareholder register is maintained by our Registrar Equiniti. If you have any queries relating to your Marston’s PLC
shareholding you should contact Equiniti directly by one of the methods below:
Online: www.shareview.co.uk – from here you will be able to securely email Equiniti with your query
Telephone: 0371 384 2274*
Text phone: 0371 384 2255*
By post: Equiniti, Aspect House, Spencer Road, Lancing, West Sussex, BN99 6DA
* Lines are open from 8.30am to 5.30pm (UK time), Monday to Friday, excluding English public holidays.
Dividend payments By completing a bank mandate form dividends can be paid directly into your bank or building society account. Those selecting this
payment method will benefit from receiving cleared funds in their bank account on the payment date, avoiding postal delays and
removing the risk of any cheques being lost in the post. To change how you receive your dividends contact Equiniti or visit
www.shareview.co.uk
Duplicate documents If you have received two or more sets of the documents concerning the AGM this means that there is more than one account in
your name on the shareholder register, perhaps because either your name or your address appear on each account in a slightly
different way. If you think this might be the case and would like to combine your accounts, please contact Equiniti.
Moving house? It is important that you notify Equiniti of your new address as soon as possible. If you hold 1,500 shares or fewer, and reside in the
UK, this can be done quickly over the telephone. However, for holdings greater than 1,500 shares your instruction will need to be in
writing, quoting your full name, shareholder reference number (if known), previous address and new address.
Electronic communications Changes in legislation in recent years allow the Company to use its corporate website as the main way to communicate with
shareholders. Annual Report and Accounts are only sent to those shareholders who have opted to receive a paper copy. Registering
to receive shareholder documentation from the Company electronically will allow shareholders to:
• view the Annual Report and Accounts on the day it is published;
• receive an email alert when the Annual Report and Accounts and any other shareholder documents are available;
• cast their AGM votes electronically; and
• manage their shareholding quickly and securely online, through www.shareview.co.uk
This reduces our impact on the environment, minimises waste and reduces printing and mailing costs. For further information and
to register for electronic shareholder communications visit www.shareview.co.uk
126
Strategic report Governance Financial statements Additional information
Buying and selling shares in the UK
If you wish to buy or sell Marston’s PLC shares and hold a share certificate, you can:
• use the services of a stockbroker or high street bank; or
• use a telephone or online service.
If you sell your shares in this way you will need to present your share certificate at the time of sale. Details of low cost dealing
services may be obtained from www.shareview.co.uk or 0345 603 7037**.
** Lines are open Monday to Friday, 8.00am to 4.30pm for dealing and until 6.00pm for enquiries (UK time), excluding English public holidays.
share fraud warning
Share fraud includes scams where investors are called out of the blue and offered an inflated price for shares they own or
shares that often turn out to be worthless or non-existent. These calls come from fraudsters operating ‘boiler rooms’ that
are mostly based abroad. While high profits are promised, those who buy or sell shares in this way usually lose their money.
The Financial Conduct Authority (FCA) has found most share fraud victims are experienced investors who lose an average of
£20,000, with around £200 million lost in the UK each year.
If you are offered unsolicited investment advice, discounted shares, a premium price for shares you own, or free company or
research reports, you should take these steps before handing over any money:
• Get the name of the person and organisation contacting you.
• Check the Financial Services Register at www.fca.org.uk/register to ensure they are authorised.
• Use the details on the FCA Register to contact the firm.
• Call the FCA Consumer Helpline on 0800 111 6768 if there are no contact details on the Register or you are told they are out
of date.
• Search the FCA list of unauthorised firms and individuals to avoid doing business with.
• Remember, if it sounds too good to be true, it probably is.
If you use an unauthorised firm to buy or sell shares or other investments, you will not have access to the Financial
Ombudsman Service or Financial Services Compensation Scheme if things go wrong.
If you are approached about a share scam you should tell the FCA using the share fraud reporting form at www.fca.org.uk,
where you will find out about the latest investment scams. You can also call the Consumer Helpline on 0800 111 6768.
If you have already paid money to share fraudsters you should contact Action Fraud on 0300 123 2040.
Company details Registered office: Marston’s House, Brewery Road, Wolverhampton, WV1 4JT
Telephone: 01902 711811
Company registration number: 31461
127
Marston’s PLC Annual Report and Accounts 2015
Glossary
BBPA British Beer & Pub Association – a body representing Britain’s brewers and pub companies
BIS Department for Business, Innovation and Skills – Government department of economic growth
Brinner Food concept: where breakfast meets dinner
Challenge 21 BBPA scheme to prevent underage sales – if a customer buying alcohol looks under the age of 21 they will be asked
to provide proof of their age
Challenge 25 Extension to Challenge 21 – scheme where customers will be asked to prove their age if they look under 25
CROCCE Cash Return on Cash Capital Employed – calculated in the same way as ROC
CSR Corporate Social Responsibility – businesses’ response to their impact on society
EBIT Earnings before interest and tax
EBITDA Earnings before interest, tax, depreciation and amortisation
EPS Earnings per share
Export Anything sold outside the UK
FCF Free Cash Flow – operating cash flow of the business after tax and interest
FRC Financial Reporting Council – independent regulator
Free trade Independently owned pubs and clubs
Generous George Destination pub brand
LPG (emissions) Liquefied petroleum gas, used as a fuel in heating appliances, cooking equipment and vehicles
National on-trade Managed house pub groups, tenanted pub groups, brewers
NED Non-executive Director
Off-trade Business with food and drink retailers, such as supermarkets (also known as take home)
On-trade Business with hotels, bars, restaurants and pub companies
PBT Profit before tax
ROC Return on Capital – calculated in the same way as CROCCE
Take home Supermarkets, cash and carry, convenience stores (also known as off-trade)
TSR Total Shareholder Return – a combination of share price appreciation and dividends paid
Picture Reference
Pen Y Bont Farm, Mold – front cover and page 12 The Gunn Inn, West Sussex – page 2
The Poppy Fields, Maidstone – front cover The Highland Gate, Stirling – page 3
The Elephant at the Market, Newbury – front cover and page 11 Meadow Farm Lodge, Redditch – page 6
The Sweet Chestnut, Dunfermline – page 2 The Farmhouse at Mackworth, Derby – page 11
Pitcher & Piano, Swansea – page 2 The Firestation, Waterloo – pages 12 and 13
The Penny Hedge, Whitby – pages 2 and 12 The Goodfellowship, Hull – page 12
Marston’s Brewery, Burton upon Trent – page 2 The Queen of the Loch, Balloch – pages 14 and 15
A full list of new openings during the year is available on our website www.marstons.co.uk
128

Designed and produced by Radley Yeldar | r y.com
This report has been printed on materials that are FSC Certified and sourced from a mill which is ISO14001 accredited.
The report is printed by an FSC and ISO14001 certified printer, using vegetable oil based inks and an alcohol free process.

marston's plc
Marston's House, Brewery Road, Wolverhampton WV1 4JT
Telephone 01902 711811 Registered No. 31461