Making Clean Electrification Possible
36
Making Clean Electrification Possible: Version 1.1 April 2021 30 Years to Electrify the Global Economy The Making Mission Possible Series Executive Summary
Transcript of Making Clean Electrification Possible
Making Clean Electrification Possible:
Version 1.1
April 2021
30 Years to Electrify the Global Economy
The Making Mission Possible Series
Executive Summary
30 Years to Electrify the Global EconomyMaking Clean Electrification Possible
The Energy Transitions Commission (ETC) is a global coalition of leaders from across the energy landscape committed to achieving net-zero emissions by mid-century, in line with the Paris climate objective of limiting global warming to well below 2°C and ideally to 1.5°C.
Our Commissioners come from a range of organisations – energy producers, energy-intensive industries, technology providers, finance players and environmental NGOs – which operate across developed and developing countries and play different roles in the energy transition. This diversity of viewpoints informs our work: our analyses are developed with a systems perspective through extensive exchanges with experts and practitioners. The ETC is chaired by Lord Adair Turner who works with the ETC team, led by Faustine Delasalle. Our Commissioners are listed on the next page.
Making Clean Electrification Possible: 30 Years to Electrify the Global Economy and Making the Hydrogen Economy Possible: Accelerating Clean Hydrogen in an Electrified Economy were developed by the Commissioners with the support of the ETC Secretariat, provided by SYSTEMIQ. They bring together and build on past ETC publications, developed in close consultation with hundreds of experts from companies, industry initiatives, international organisations, non-governmental organisations and academia.
The reports draw upon analyses carried out by ETC knowledge partners SYSTEMIQ and BloombergNEF, alongside analyses developed by Climate Policy Initiative, Material Economics, McKinsey & Company, Rocky Mountain Institute, The Energy and Resources Institute, and Vivid Economics for and in partnership with the ETC in the past. We also reference analyses from the International Energy Agency and IRENA. We warmly thank our knowledge partners and contributors for their inputs.
This report constitutes a collective view of the Energy Transitions Commission. Members of the ETC endorse the general thrust of the arguments made in this report but should not be taken as agreeing with every finding or recommendation. The institutions with which the Commissioners are affiliated have not been asked to formally endorse the report.
The ETC Commissioners not only agree on the importance of reaching net-zero carbon emissions from the energy and industrial systems by mid-century, but also share a broad vision of how the transition can be achieved. The fact that this agreement is possible between leaders from companies and organisations with different perspectives on and interests in the energy system should give decision makers across the world confidence that it is possible simultaneously to grow the global economy and to limit global warming to well below 2˚C, and that many of the key actions to achieve these goals are clear and can be pursued without delay.
Learn more at: www.energy-transitions.orgwww.linkedin.com/company/energy-transitionscommission www.twitter.com/ETC_energy
2 Making Clean Electrification Possible – 30 Years to Electrify the Global Economy
Our Commissioners
Mr. Marco Alvera, Chief Executive Officer – SNAM
Mr. Thomas Thune Anderson, Chairman of the Board – Ørsted
Mr. Manish Bapna, Interim CEO & President - WRI
Mr. Spencer Dale, Group Chief Economist – BP
Mr. Bradley Davey, Chief Commercial Officer – ArcelorMittal
Mr. Pierre-André de Chalendar, Chairman and Chief Executive Officer – Saint Gobain
Dr. Vibha Dhawan, Director-General, The Energy and Resources Institute
Mr. Agustin Delgado, Chief Innovation and Sustainability Officer – Iberdrola
Ms. Marisa Drew, Chief Sustainability Officer & Global Head Sustainability Strategy, Advisory and Finance – Credit Suisse
Mr. Will Gardiner, Chief Executive Officer – DRAX
Mr. John Holland-Kaye, Chief Executive Officer - Heathrow Airport
Mr. Chad Holliday, Chairman – Royal Dutch Shell
Mr. Fred Hu, Founder and Chairman – Primavera Capital
Dr. Timothy Jarratt, Chief of Staff - National Grid
Mr. Hubert Keller, Managing Partner – Lombard Odier
Ms. Zoe Knight, Managing Director and Group Head of the HSBC Centre of Sustainable Finance – HSBC
Mr. Jules Kortenhorst, Chief Executive Officer – Rocky Mountain Institute
Mr. Mark Laabs, Managing Director – Modern Energy
Mr. Richard Lancaster, Chief Executive Officer – CLP
Mr. Colin Le Duc, Founding Partner – Generation IM
Mr. Li Zheng, Executive Vice President – Institute of Climate Change and Sustainable Development, Tsinghua University
Mr. Li Zhenguo, President – LONGi Solar
Mr. Martin Lindqvist, Chief Executive Officer and President – SSAB
Mr. Auke Lont, Chief Executive Officer and President – Statnett
Mr. Johan Lundén, SVP Head of Project and Product Strategy Office – Volvo Group
Dr. María Mendiluce, Chief Executive Officer – We Mean Business
Mr. Jon Moore, Chief Executive Officer – BloombergNEF
Mr. Julian Mylchreest, Managing Director, Global Co-Head of Natural Resources (Energy, Power & Mining) – Bank of America
Ms. Damilola Ogunbiyi, Chief Executive Officer – Sustainable Energy For All
Mr. Paddy Padmanathan, President and CEO – ACWA Power
Mr. Vinayak Pai, Group President EMEA & APAC – Worley
Ms. Nandita Parshad, Managing Director, Sustainable Infrastructure Group – EBRD
Mr. Sanjiv Paul, Vice President Safety Health and Sustainability – Tata Steel
Mr. Alistair Phillips-Davies, CEO – SSE
Mr. Andreas Regnell, Senior Vice President Strategic Development – Vattenfall
Mr. Siddharth Sharma, Group Chief Sustainability Officer – Tata Sons Private Limited
Mr. Mahendra Singhi, Managing Director and CEO – Dalmia Cement (Bharat) Limited
Mr. Sumant Sinha, Chairman and Managing Director – Renew Power
Mr. Ian Simm, Founder and Chief Executive Officer – Impax
Lord Nicholas Stern, IG Patel Professor of Economics and Government - Grantham Institute - LSE
Dr. Günther Thallinger, Member of the Board of Management – Allianz
Mr. Simon Thompson, Chairman – Rio Tinto
Dr. Robert Trezona, Head of Cleantech – IP Group
Mr. Jean-Pascal Tricoire, Chairman and Chief Executive Officer – Schneider Electric
Ms. Laurence Tubiana, Chief Executive Officer - European Climate Foundation
Lord Adair Turner, Co-Chair – Energy Transitions Commission
Senator Timothy E. Wirth, President Emeritus – United Nations Foundation
Mr. Zhang Lei, Chief Executive Officer – Envision Group
Dr. Zhao Changwen, Director General Industrial Economy – Development Research Center of the State Council
Ms. Cathy Zoi, President – EVgo
Making Clean Electrification Possible – 30 Years to Electrify the Global Economy 3
To limit global warming to below 2°C and as close as possible to 1.5°C, the world must reduce net greenhouse gas emissions to net zero by mid-century. To achieve that, we must electrify as many economic activities as possible, use hydrogen primarily made from electricity in many others, and totally decarbonise electricity supply. Other technologies such as carbon capture and storage or use (CCS/U) and sustainable bioenergy will also need to be deployed. But clean electricity is at the core of the zero-carbon economy.
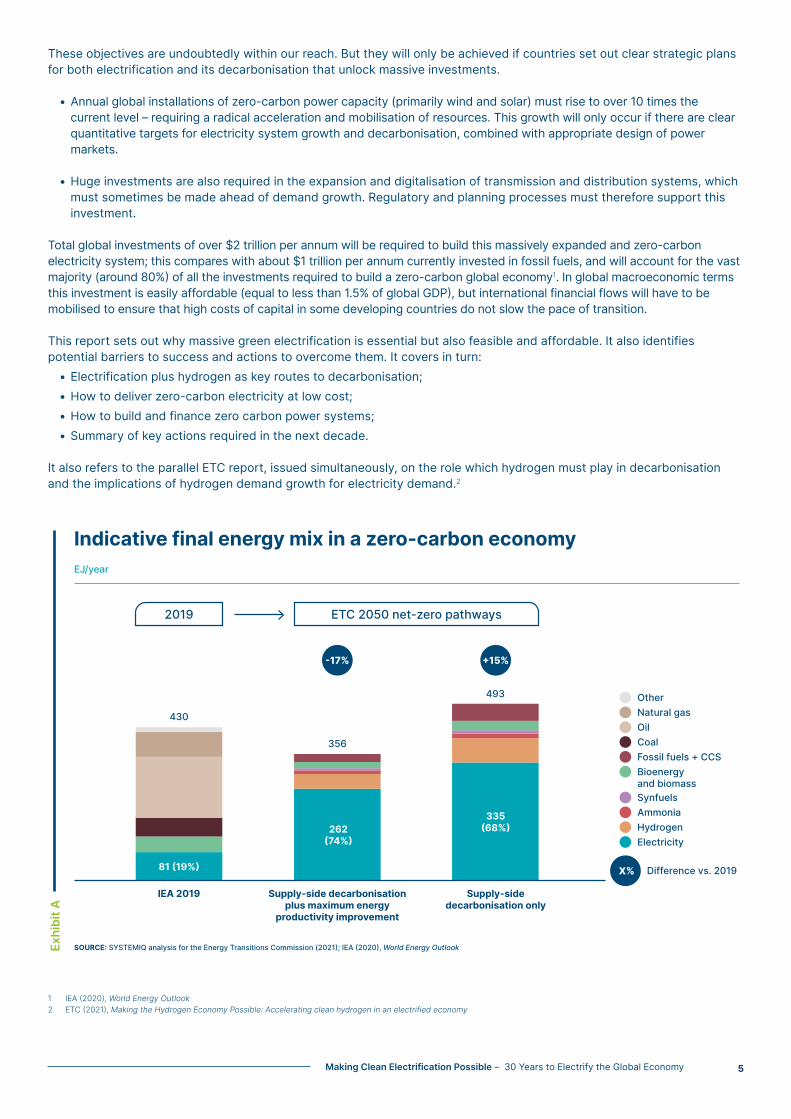
Direct electrification will be key to decarbonising many sectors of the economy, including road transport and building heating, with electricity’s share of final energy demand growing from only 20% today to over 60% by mid-century. Hydrogen will also play a major role in decarbonising harder-to-abate sectors such as steel and long-distance shipping, and will likely account for another 15-20% of final energy demand [Exhibit A].
Together this requires a dramatic increase in global electricity supply, from today’s 27,000 TWh to as much as 130,000 TWh by 2050. Improved energy productivity can reduce the required increase by up to 40,000 TWh, and thus the costs of the transition. It should therefore be a key priority. Indeed, electrification will itself be the most important driver of improved energy productivity. However, no amount of energy efficiency improvement will remove the need for significant increases in electricity supply.
Achieving massive clean electrification will be a major challenge, but if managed effectively the transition will pay for itself. It will also deliver major local environmental benefits with better air quality and reduced noise pollution. Dramatic cost reductions mean that renewables are now the cheapest way to generate electricity. Collapsing battery costs make it possible to balance intermittent supply and variable demand over the daily cycle, and a range of storage and flexibility mechanisms – including the use of hydrogen – will provide increasingly cost-effective solutions to the challenge of seasonal balancing. Total system generation costs for electricity systems as much as 90% dependent on variable renewables will be no higher than for today’s fossil fuel-based systems.
Achieving early power decarbonisation – ahead of economy-wide decarbonisation – must therefore be at the heart of all countries’ paths to net zero emissions. The Energy Transitions Commission believes that:
• All developed economies can and should commit to be net zero economies by 2050 and to achieve near total electricity decarbonisation by the mid-2030s (e.g. with grid emissions intensity targets of below 30gCO2 per kWh), eliminating coal use almost immediately and with clear plans to phase out unabated gas. In these regions, total electricity use will typically grow 2-2.5 times by 2050.
• Developing economies can and should commit to be net-zero economies by 2060 at the latest, and to achieve near total decarbonisation of power by the mid-2040s. Electricity use will often need to grow 5-6 times by 2050, with the growth in electricity generation being met almost entirely by zero-carbon sources, and a phase out of existing coal plants in the 2030s and 2040s.
• Low-income economies (e.g. in Sub-Saharan Africa) can and should aim to “leap-frog” fossil fuels. They can massively expand electricity provision – to meet as much as a tenfold growth in electricity use by 2050 – by building zero-carbon power systems while never going through a fossil fuel phase.
Executive Summary
Making Clean Electrification Possible – 30 Years to Electrify the Global Economy4
These objectives are undoubtedly within our reach. But they will only be achieved if countries set out clear strategic plans for both electrification and its decarbonisation that unlock massive investments.
• Annual global installations of zero-carbon power capacity (primarily wind and solar) must rise to over 10 times the current level – requiring a radical acceleration and mobilisation of resources. This growth will only occur if there are clear quantitative targets for electricity system growth and decarbonisation, combined with appropriate design of power markets.
• Huge investments are also required in the expansion and digitalisation of transmission and distribution systems, which must sometimes be made ahead of demand growth. Regulatory and planning processes must therefore support this investment.
Total global investments of over $2 trillion per annum will be required to build this massively expanded and zero-carbon electricity system; this compares with about $1 trillion per annum currently invested in fossil fuels, and will account for the vast majority (around 80%) of all the investments required to build a zero-carbon global economy1. In global macroeconomic terms this investment is easily affordable (equal to less than 1.5% of global GDP), but international financial flows will have to be mobilised to ensure that high costs of capital in some developing countries do not slow the pace of transition.
This report sets out why massive green electrification is essential but also feasible and affordable. It also identifies potential barriers to success and actions to overcome them. It covers in turn:
• Electrification plus hydrogen as key routes to decarbonisation; • How to deliver zero-carbon electricity at low cost; • How to build and finance zero carbon power systems; • Summary of key actions required in the next decade.
It also refers to the parallel ETC report, issued simultaneously, on the role which hydrogen must play in decarbonisation and the implications of hydrogen demand growth for electricity demand.2
1 IEA(2020),World Energy Outlook2 ETC(2021),Making the Hydrogen Economy Possible: Accelerating clean hydrogen in an electrified economy
Exhi
bit A
Indicative final energy mix in a zero-carbon economy
SOURCE: SYSTEMIQ analysis for the Energy Transitions Commission (2021); IEA (2020), World Energy Outlook
EJ/year
493
SynfuelsAmmoniaHydrogenElectricity
Difference vs. 2019
IEA 2019
ETC 2050 net-zero pathways2019
Supply-side decarbonisationplus maximum energyproductivity improvement
Supply-sidedecarbonisation only
OilCoalFossil fuels + CCSBioenergy and biomass
OtherNatural gas
X%
430
-17% +15%
356
81 (19%)
262(74%)
335(68%)
Making Clean Electrification Possible – 30 Years to Electrify the Global Economy 5
C
M
Y
CM
MY
CY
CMY
K
Power Info1-2_OUTLINED_print.pdf 1 23/04/2021 15:38
I. Driving massive electrification to deliver a zero-carbon economy
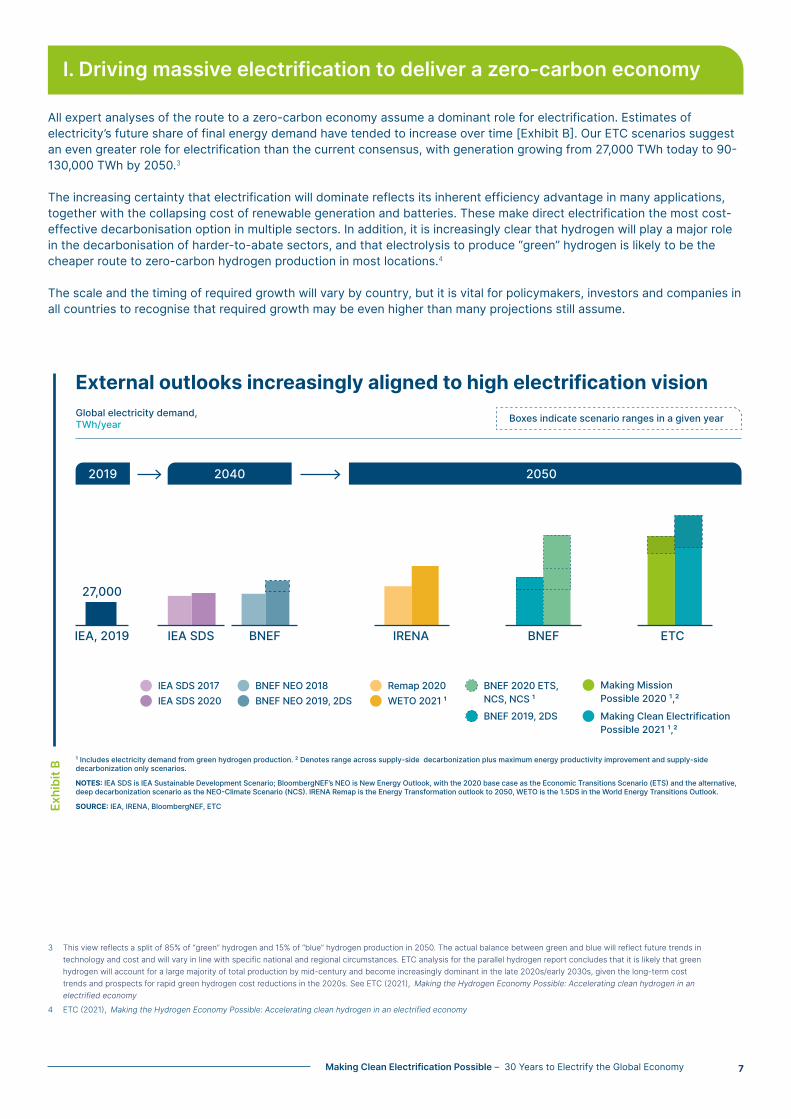
All expert analyses of the route to a zero-carbon economy assume a dominant role for electrification. Estimates of electricity’s future share of final energy demand have tended to increase over time [Exhibit B]. Our ETC scenarios suggest an even greater role for electrification than the current consensus, with generation growing from 27,000 TWh today to 90-130,000 TWh by 2050.3
The increasing certainty that electrification will dominate reflects its inherent efficiency advantage in many applications, together with the collapsing cost of renewable generation and batteries. These make direct electrification the most cost-effective decarbonisation option in multiple sectors. In addition, it is increasingly clear that hydrogen will play a major role in the decarbonisation of harder-to-abate sectors, and that electrolysis to produce “green” hydrogen is likely to be the cheaper route to zero-carbon hydrogen production in most locations.4
The scale and the timing of required growth will vary by country, but it is vital for policymakers, investors and companies in all countries to recognise that required growth may be even higher than many projections still assume.
3 Thisviewreflectsasplitof85%of“green”hydrogenand15%of“blue”hydrogenproductionin2050.The actual balance between green and blue will reflect future trends in technology and cost and will vary in line with specific national and regional circumstances. ETCanalysisfortheparallelhydrogenreportconcludesthatitislikelythatgreenhydrogenwillaccountforalargemajorityoftotalproductionbymid-centuryandbecomeincreasinglydominantinthelate2020s/early2030s,giventhelong-termcosttrendsandprospectsforrapidgreenhydrogencostreductionsinthe2020s.SeeETC (2021), Making the Hydrogen Economy Possible: Accelerating clean hydrogen in an electrified economy
4 ETC (2021), Making the Hydrogen Economy Possible: Accelerating clean hydrogen in an electrified economy
Exhi
bit B
External outlooks increasingly aligned to high electrification vision
¹ Includes electricity demand from green hydrogen production. ² Denotes range across supply-side decarbonization plus maximum energy productivity improvement and supply-side decarbonization only scenarios.
NOTES: IEA SDS is IEA Sustainable Development Scenario; BloombergNEF’s NEO is New Energy Outlook, with the 2020 base case as the Economic Transitions Scenario (ETS) and the alternative, deep decarbonization scenario as the NEO-Climate Scenario (NCS). IRENA Remap is the Energy Transformation outlook to 2050, WETO is the 1.5DS in the World Energy Transitions Outlook.
SOURCE: IEA, IRENA, BloombergNEF, ETC
Global electricity demand,TWh/year Boxes indicate scenario ranges in a given year
20502019
IEA, 2019 IEA SDS
27,000
2040
IRENABNEF
IEA SDS 2017IEA SDS 2020
BNEF NEO 2018 BNEF NEO 2019, 2DS
Remap 2020WETO 2021 ¹
BNEF 2020 ETS, NCS, NCS ¹
Making Mission Possible 2020 ¹,²
Making Clean ElectrificationPossible 2021 ¹,²
BNEF 2019, 2DS
ETC BNEF
Making Clean Electrification Possible – 30 Years to Electrify the Global Economy 7
Mass electrification – the massive growth in electricity and hydrogen demandEconomic growth and rising prosperity will drive increasing electricity demand in existing applications. For instance, as incomes rise, and societies urbanise, demand for air-conditioning, and the use of information technology, will inevitably increase.
In addition, major new applications for electricity or hydrogen will emerge, some of which have implications for the timing of electricity demand, and thus for the challenges of balancing electricity systems based primarily on intermittent renewable supply.
Road TransportBattery electric vehicles (BEVs) will play a dominant role in road transport decarbonisation.
• In the light duty vehicle (LDV) sector, falling battery prices now make it inevitable that EVs will at some stage be cheaper to buy upfront than internal combustion engines (ICEs) and far cheaper to operate. But it will take many years for the stock of LDVs to be largely electrified given the typical pace of vehicle turnover. Public policy should therefore drive the economically feasible transition as rapidly as possible via charging infrastructure investment, purchase incentives for BEVs, fuel economy standards, bans on new ICE sales from 2030, and encouraging the early retirement of ICEs.
• In the heavy goods vehicle (HGV) sector, falling battery costs, increasing battery density, and improved potential charging speeds, make it likely that BEVs will play an important role, but for large trucks traveling very long distances and with limited charging infrastructure, hydrogen fuel cell electric vehicles (FCEVs) may also play a significant role.
In total, electric road transport could produce demand for 17,000 to 18,000 TWh of electricity by 2050, of which 1,300-1,900 TWh used to produce green hydrogen.
If vehicle charging is concentrated in times of peak electricity demand, this growing demand could significantly increase distribution network costs and the cost of balancing electricity supply and demand. However, these cost impacts can be dramatically reduced by optimal time of day charging and by some use of vehicle batteries as a power storage resource. Public policy must therefore support time-of-use pricing and smart charging applications, while distribution network investment must anticipate reinforcements needs.
Shipping and aviationDirect electrification will play a significant role in the decarbonisation of short distance shipping and aviation. But the primary path to decarbonisation of long-distance shipping and aviation will likely involve the use of liquid fuels burnt in largely unchanged engines. These could come from low-carbon sustainable bio-resources (converted into alcohols or biofuels) or from a power-to-liquid production route (ammonia in the case of shipping and synthetic jet fuel in the case of aviation) which would require additional electricity for their production. Our scenarios for these sectors suggest potential demand for 9,000-13,000 TWh of electricity by 2050, with the majority used to produce green hydrogen.
Commercial and residential buildingsElectricity use in commercial and residential buildings will in part be driven by existing applications: electrical appliances, air conditioning, and information technology equipment. In addition, electricity is almost certain to play a greatly expanded role in space heating given the inherent efficiency advantage of heat pumps. Strong policy will however be required to achieve the adoption of zero-carbon routes, given the significant upfront cost involved in installing heat pumps and improving building insulation, which is often needed to bring houses up to appropriate insulation standards. In total, electricity use in building heating could reach around 20,000-22,000 TWh by 2050.
Making Clean Electrification Possible – 30 Years to Electrify the Global Economy8
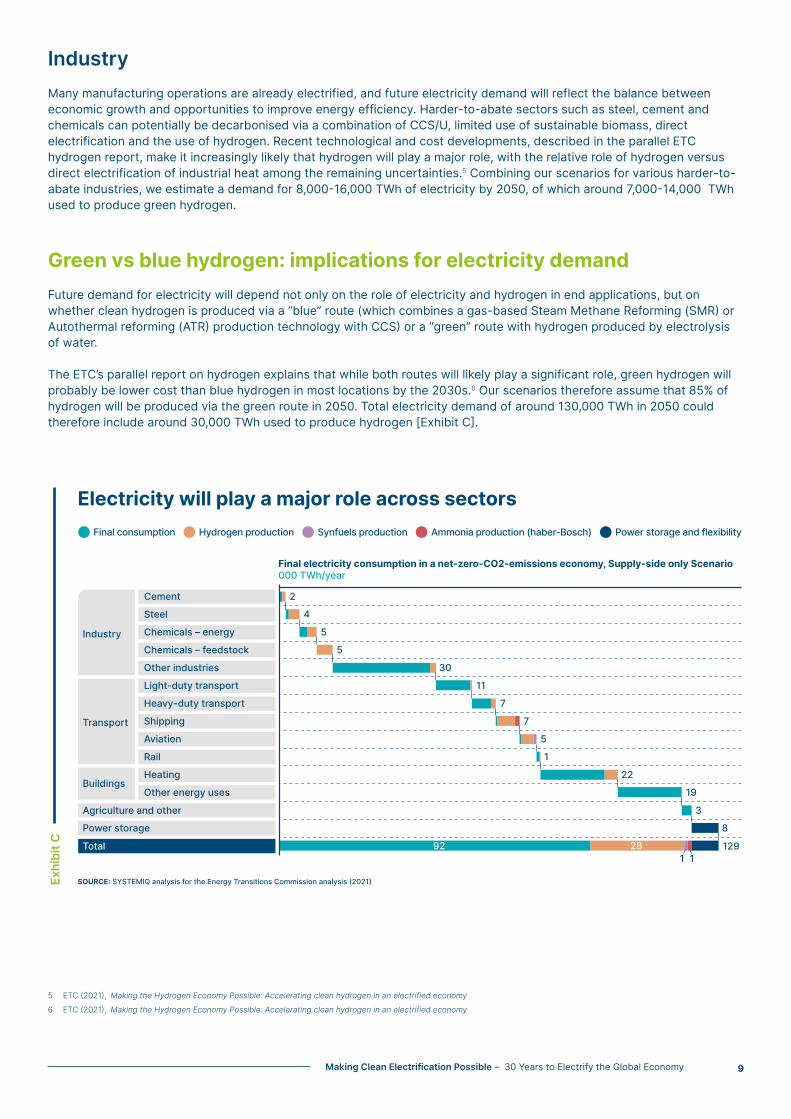
IndustryMany manufacturing operations are already electrified, and future electricity demand will reflect the balance between economic growth and opportunities to improve energy efficiency. Harder-to-abate sectors such as steel, cement and chemicals can potentially be decarbonised via a combination of CCS/U, limited use of sustainable biomass, direct electrification and the use of hydrogen. Recent technological and cost developments, described in the parallel ETC hydrogen report, make it increasingly likely that hydrogen will play a major role, with the relative role of hydrogen versus direct electrification of industrial heat among the remaining uncertainties.5 Combining our scenarios for various harder-to-abate industries, we estimate a demand for 8,000-16,000 TWh of electricity by 2050, of which around 7,000-14,000 TWh used to produce green hydrogen.
Green vs blue hydrogen: implications for electricity demandFuture demand for electricity will depend not only on the role of electricity and hydrogen in end applications, but on whether clean hydrogen is produced via a “blue” route (which combines a gas-based Steam Methane Reforming (SMR) or Autothermal reforming (ATR) production technology with CCS) or a “green” route with hydrogen produced by electrolysis of water.
The ETC’s parallel report on hydrogen explains that while both routes will likely play a significant role, green hydrogen will probably be lower cost than blue hydrogen in most locations by the 2030s.6 Our scenarios therefore assume that 85% of hydrogen will be produced via the green route in 2050. Total electricity demand of around 130,000 TWh in 2050 could therefore include around 30,000 TWh used to produce hydrogen [Exhibit C].
5 ETC (2021), Making the Hydrogen Economy Possible: Accelerating clean hydrogen in an electrified economy
6 ETC (2021), Making the Hydrogen Economy Possible: Accelerating clean hydrogen in an electrified economy
Electricity will play a major role across sectors
Final electricity consumption in a net-zero-CO2-emissions economy, Supply-side only Scenario 000 TWh/year
Industry
Cement 2
Steel 4
Chemicals – energy 5
Chemicals – feedstock 5
Other industries 30
Light-duty transport 11
Heavy-duty transport 7
Shipping 7
Aviation 5
Rail 1
Heating 22
Other energy uses 19
Agriculture and other 3
Power storage 8
1 1Total
Transport
Buildings
SOURCE: SYSTEMIQ analysis for the Energy Transitions Commission analysis (2021)
Final consumption Hydrogen production Synfuels production Ammonia production (haber-Bosch) Power storage and flexibility
1292892
Exhi
bit C
Making Clean Electrification Possible – 30 Years to Electrify the Global Economy 9
Improving the energy productivity of the global economyImproving energy productivity is an essential lever to reduce the scale of the investment required in the decarbonisation of energy provision. Electrification will itself drive a major improvement in energy efficiency. Electric motors are over three times more efficient than ICE vehicles at converting input energy into vehicle motion; heat pumps can deliver heat inside a home three times more efficiently than the most efficient gas boiler.
But there are also multiple other opportunities to increase energy efficiency, for instance by:
• Improving the thermal insulation of buildings, reducing the energy inputs required to deliver adequate warmth or cool7;
• Increasing the efficiency of heat pump/air-conditioners8;
• Improving electric engines and car design, and as a result raising the kilometres per kWh of electricity used.
Wider “energy productivity” (useful end-services delivered per unit of energy used) could be significantly increased by shifting to a more circular economy, with increased recycling and reuse of materials, and by developing shared use of currently underutilised assets (in particular passenger vehicles). Behavioural change (e.g. greater cycling and less car use) also has significant potential to reduce energy demand. 9
Public policy and private investment should therefore focus strongly on opportunities for energy productivity improvement. But even maximum conceivable progress would still see electricity demand increase to something like 90,000 TWh globally by 2050, three times today’s level.
Much of this electricity will replace existing inefficient forms of energy. As a result, total final energy use may only increase by 15% by 2050, and might even fall by around 15%, if societies seized all opportunities for energy efficiency and productivity improvement.10 At the primary energy level, the improvement in energy efficiency is greater still, since producing electricity from solar, wind, hydro or nuclear sources eliminates the energy losses which inevitably result from fossil fuel extraction and thermal generation.
Global and regional ramp-upsAchieving a zero-carbon economy will require big increases in electricity supply in almost all countries. However, the scale of increase, the mix of sectors, and the timing of ramp up will differ significantly between different country groups.
• Already rich developed economies could see increases of 2-2.5 times by 2050. But with growth here primarily arising from the new applications in road transport and electric heating, and from production of hydrogen to decarbonise harder-to-abate sectors such as shipping, steel and aviation, growth may be “S-shaped”, fairly slow in the 2020s, but accelerating thereafter.
• China is likely to see similar total growth by 2050 (from 7,000 TWh in 2020 to 15,000 TWh by 2050), but with economic growth still running at over 5% per annum, use in existing applications will likely drive strong growth strongly even in the 2020s.
• In developing countries (e.g. India), economic growth and rising living standards will likely drive fairly rapid growth equally across the decades. Total electricity use could grow 5-6 times by 2050.
• Low-income economies could see massive growth in electricity use, e.g. 10 times growth over 30 years, with the profile over time determined by the success of economic growth strategies and ability to expand energy access, including via the mobilisation of international financial flows to support investment.
The overall global picture could see rapid growth across all decades, but with the highest demand additions in the early 2040s.
7 ETC(2019),Mission Possible sectoral focus: building heating8 RMI(2018),Solving the Global Cooling Challenge: How to Counter the Climate Threat from Room Air Conditioners9 ETC(2020),Making Mission Possible10 ThisissimilarlyreflectedinIEAScenarios.TheIEA’s2020StatedPoliciesScenarioshowstotalfinalenergydemandpotentiallygrowingfrom420exajoules(EJ)in2019to515EJin2040,itsSustainableDevelopmentScenariodescribesafeasibleworldinwhichfinalenergydemandcouldfallby7%toreach390EJoverthenext20years.
Making Clean Electrification Possible – 30 Years to Electrify the Global Economy10
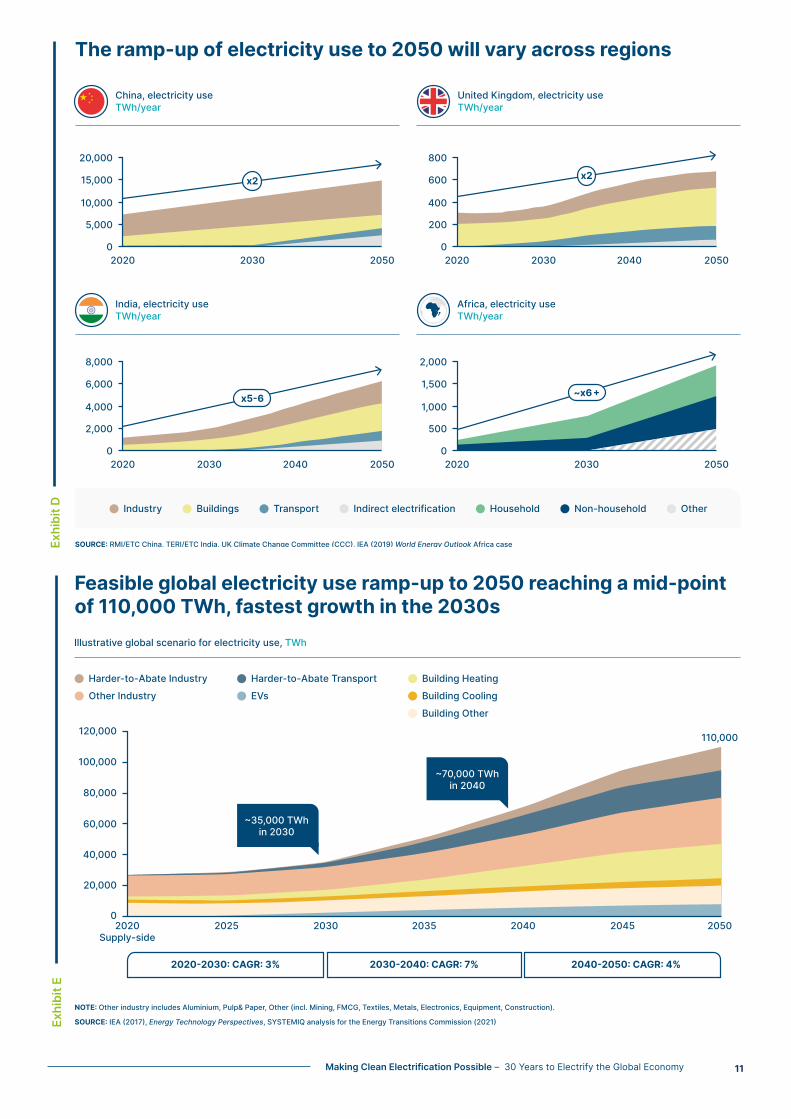
The ramp-up of electricity use to 2050 will vary across regions
SOURCE: RMI/ETC China, TERI/ETC India, UK Climate Change Committee (CCC), IEA (2019) World Energy Outlook Africa case
China, electricity useTWh/year
BuildingsIndustry Indirect electrificationTransport Non-householdHousehold Other
United Kingdom, electricity useTWh/year
India, electricity useTWh/year
Africa, electricity useTWh/year
20,000
15,000
10,000
5,000
02020 2030 2050
x2
800
600
400
200
02020 2030 2040 2050
x2
8,000
6,000
4,000
2,000
02020 2030 2040 2050
x5-6
2,000
1,500
1,000
500
02020 2030 2050
~x6 +
Exhi
bit D
Feasible global electricity use ramp-up to 2050 reaching a mid-point of 110,000 TWh, fastest growth in the 2030s
NOTE: Other industry includes Aluminium, Pulp& Paper, Other (incl. Mining, FMCG, Textiles, Metals, Electronics, Equipment, Construction).
SOURCE: IEA (2017), Energy Technology Perspectives, SYSTEMIQ analysis for the Energy Transitions Commission (2021)
Illustrative global scenario for electricity use, TWh
120,000
100,000
80,000
~35,000 TWhin 2030
~70,000 TWhin 2040
60,000
40,000
20,000
02020
Supply-side2025 2030 2035 2040 2045 2050
110,000
Harder-to-Abate Industry Harder-to-Abate Transport
Other Industry
Building Heating
Building Cooling
Building Other
EVs
2020-2030: CAGR: 3% 2030-2040: CAGR: 7% 2040-2050: CAGR: 4%
Exhi
bit E
Making Clean Electrification Possible – 30 Years to Electrify the Global Economy 11
12 Making Clean Electrification Possible – 30 Years to Electrify the Global Economy
II. Delivering zero-carbon electricity at low cost: high variable renewable power systems are technically feasible and cost-effective
Massive clean electrification can be achieved at minimal cost to the global economy and in most countries. Dramatic falls in the cost of renewable generation and of key storage technologies now make it possible to decarbonise power generation at nil or in some cases negative cost. Transmission and distribution costs may on average increase, but intelligent time-of-day demand management and flexibility levers could significantly mitigate this effect.
On a global scale, there are sufficient resources to support clean electrification powered primarily with renewable resources, but long-distance international transmission and/or nuclear power may need to play a role in countries where high population density restricts land supply. All countries should therefore plan for all growth of electricity supply to come from zero-carbon sources, and should develop plans to phase out existing fossil fuel generation.
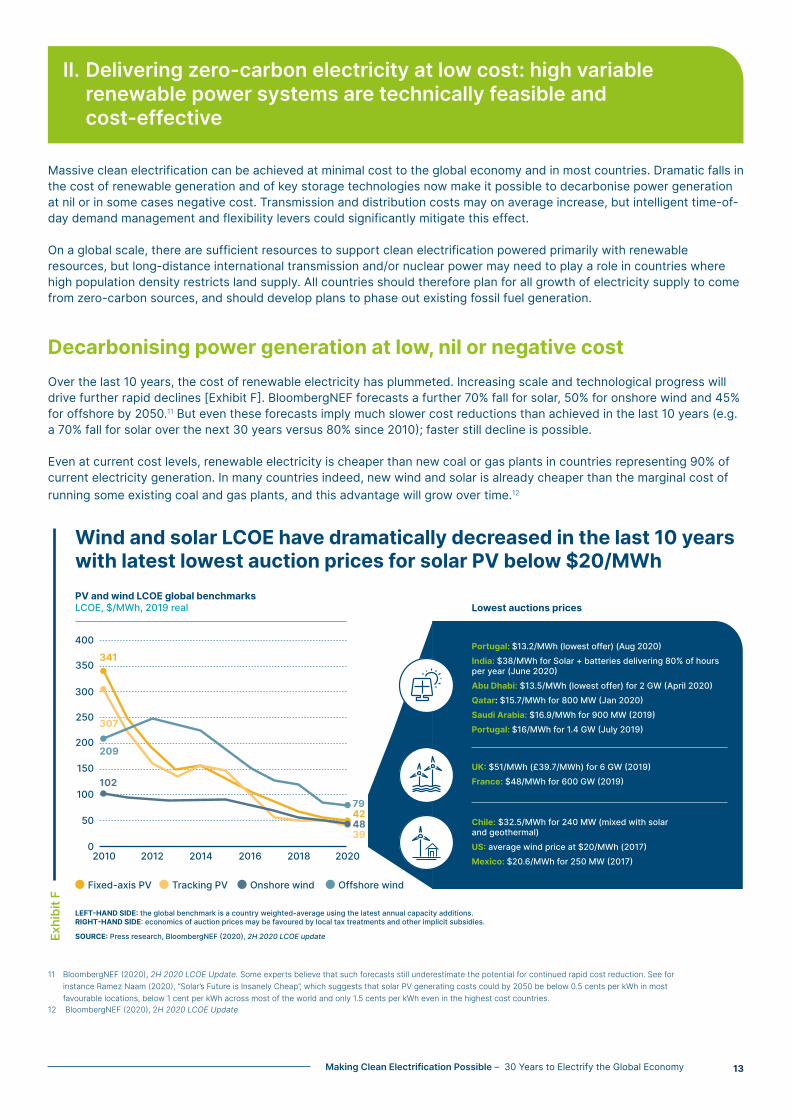
Decarbonising power generation at low, nil or negative costOver the last 10 years, the cost of renewable electricity has plummeted. Increasing scale and technological progress will drive further rapid declines [Exhibit F]. BloombergNEF forecasts a further 70% fall for solar, 50% for onshore wind and 45% for offshore by 2050.11 But even these forecasts imply much slower cost reductions than achieved in the last 10 years (e.g. a 70% fall for solar over the next 30 years versus 80% since 2010); faster still decline is possible.
Even at current cost levels, renewable electricity is cheaper than new coal or gas plants in countries representing 90% of current electricity generation. In many countries indeed, new wind and solar is already cheaper than the marginal cost of running some existing coal and gas plants, and this advantage will grow over time.12
11 BloombergNEF(2020),2H 2020 LCOE Update. Someexpertsbelievethatsuchforecastsstillunderestimatethepotentialforcontinuedrapidcostreduction.SeeforinstanceRamezNaam(2020),“Solar’sFutureisInsanelyCheap”,whichsuggeststhatsolarPVgeneratingcostscouldby2050bebelow0.5centsperkWhinmostfavourablelocations,below1centperkWhacrossmostoftheworldandonly1.5centsperkWheveninthehighestcostcountries.
12 BloombergNEF(2020),2H 2020 LCOE Update
Exhi
bit F
Wind and solar LCOE have dramatically decreased in the last 10 years with latest lowest auction prices for solar PV below $20/MWhPV and wind LCOE global benchmarksLCOE, $/MWh, 2019 real Lowest auctions prices
LEFT-HAND SIDE: the global benchmark is a country weighted-average using the latest annual capacity additions. RIGHT-HAND SIDE: economics of auction prices may be favoured by local tax treatments and other implicit subsidies.
SOURCE: Press research, BloombergNEF (2020), 2H 2020 LCOE update
2010 2012 2014 2016 2018 20200
50
100
150
200
250
341
307
102
39484279
209
300
350
400
Fixed-axis PV Tracking PV Onshore wind Offshore wind
Portugal: $13.2/MWh (lowest offer) (Aug 2020)India: $38/MWh for Solar + batteries delivering 80% of hours per year (June 2020)Abu Dhabi: $13.5/MWh (lowest offer) for 2 GW (April 2020)Qatar: $15.7/MWh for 800 MW (Jan 2020)Saudi Arabia: $16.9/MWh for 900 MW (2019)Portugal: $16/MWh for 1.4 GW (July 2019)
UK: $51/MWh (£39.7/MWh) for 6 GW (2019)France: $48/MWh for 600 GW (2019)
Chile: $32.5/MWh for 240 MW (mixed with solar and geothermal)US: average wind price at $20/MWh (2017)Mexico: $20.6/MWh for 250 MW (2017)
Making Clean Electrification Possible – 30 Years to Electrify the Global Economy 13
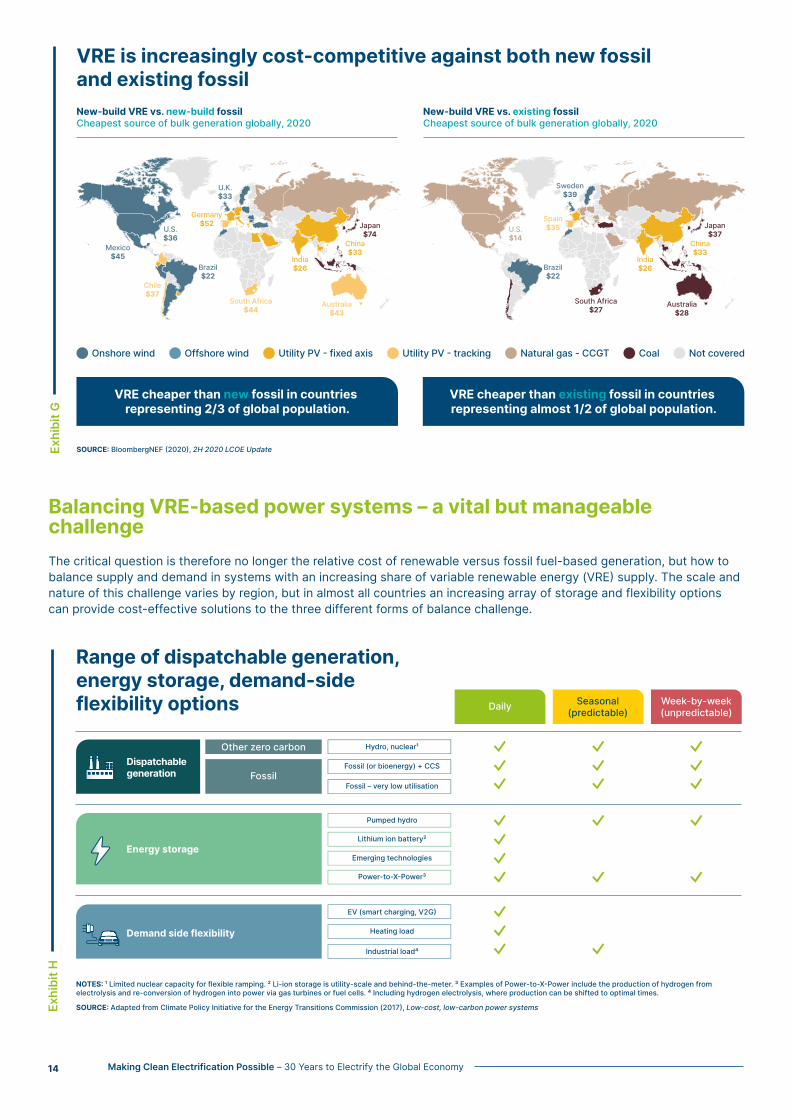
Balancing VRE-based power systems – a vital but manageable challengeThe critical question is therefore no longer the relative cost of renewable versus fossil fuel-based generation, but how to balance supply and demand in systems with an increasing share of variable renewable energy (VRE) supply. The scale and nature of this challenge varies by region, but in almost all countries an increasing array of storage and flexibility options can provide cost-effective solutions to the three different forms of balance challenge.
Exhi
bit H
Range of dispatchable generation, energy storage, demand-side flexibility options
NOTES: ¹ Limited nuclear capacity for flexible ramping. ² Li-ion storage is utility-scale and behind-the-meter. ³ Examples of Power-to-X-Power include the production of hydrogen from electrolysis and re-conversion of hydrogen into power via gas turbines or fuel cells. ⁴ Including hydrogen electrolysis, where production can be shifted to optimal times.
SOURCE: Adapted from Climate Policy Initiative for the Energy Transitions Commission (2017), Low-cost, low-carbon power systems
Daily Seasonal(predictable)
Week-by-week(unpredictable)
Dispatchablegeneration
Energy storage
Demand side flexibility
Other zero carbon Hydro, nuclear¹
Fossil (or bioenergy) + CCS
Fossil – very low utilisation
Pumped hydro
Lithium ion battery²
Emerging technologies
Power-to-X-Power³
EV (smart charging, V2G)
Heating load
Industrial load⁴
Fossil
Exhi
bit G
New-build VRE vs. existing fossilCheapest source of bulk generation globally, 2020
Onshore wind
Australia$43
Brazil$22
Japan$74
Chile$37
Offshore wind Utility PV - fixed axis Utility PV - tracking Natural gas - CCGT Coal Not covered
VRE is increasingly cost-competitive against both new fossil and existing fossilNew-build VRE vs. new-build fossilCheapest source of bulk generation globally, 2020
SOURCE: BloombergNEF (2020), 2H 2020 LCOE Update
VRE cheaper than new fossil in countries representing 2/3 of global population.
VRE cheaper than existing fossil in countries representing almost 1/2 of global population.
China$33
South Africa$44
U.S.$36
Mexico$45
U.K.$33
Germany$52
India$26
Australia$28
Brazil$22
Japan$37
China$33
South Africa$27
U.S.$14
Sweden$39
Spain$35
India$26
Making Clean Electrification Possible – 30 Years to Electrify the Global Economy14
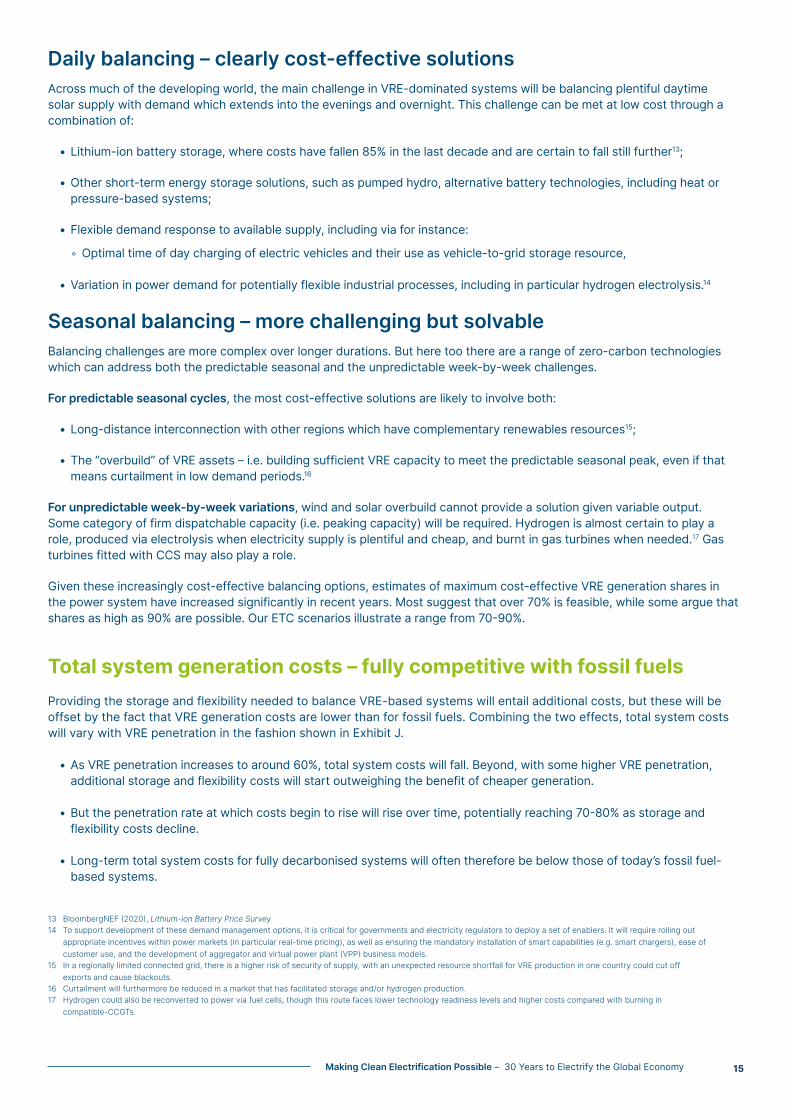
Daily balancing – clearly cost-effective solutionsAcross much of the developing world, the main challenge in VRE-dominated systems will be balancing plentiful daytime solar supply with demand which extends into the evenings and overnight. This challenge can be met at low cost through a combination of:
• Lithium-ion battery storage, where costs have fallen 85% in the last decade and are certain to fall still further13;
• Other short-term energy storage solutions, such as pumped hydro, alternative battery technologies, including heat or pressure-based systems;
• Flexible demand response to available supply, including via for instance:
◦ Optimal time of day charging of electric vehicles and their use as vehicle-to-grid storage resource,
• Variation in power demand for potentially flexible industrial processes, including in particular hydrogen electrolysis.14
Seasonal balancing – more challenging but solvable Balancing challenges are more complex over longer durations. But here too there are a range of zero-carbon technologies which can address both the predictable seasonal and the unpredictable week-by-week challenges.
For predictable seasonal cycles, the most cost-effective solutions are likely to involve both:
• Long-distance interconnection with other regions which have complementary renewables resources15;
• The “overbuild” of VRE assets – i.e. building sufficient VRE capacity to meet the predictable seasonal peak, even if that means curtailment in low demand periods.16
For unpredictable week-by-week variations, wind and solar overbuild cannot provide a solution given variable output. Some category of firm dispatchable capacity (i.e. peaking capacity) will be required. Hydrogen is almost certain to play a role, produced via electrolysis when electricity supply is plentiful and cheap, and burnt in gas turbines when needed.17 Gas turbines fitted with CCS may also play a role.
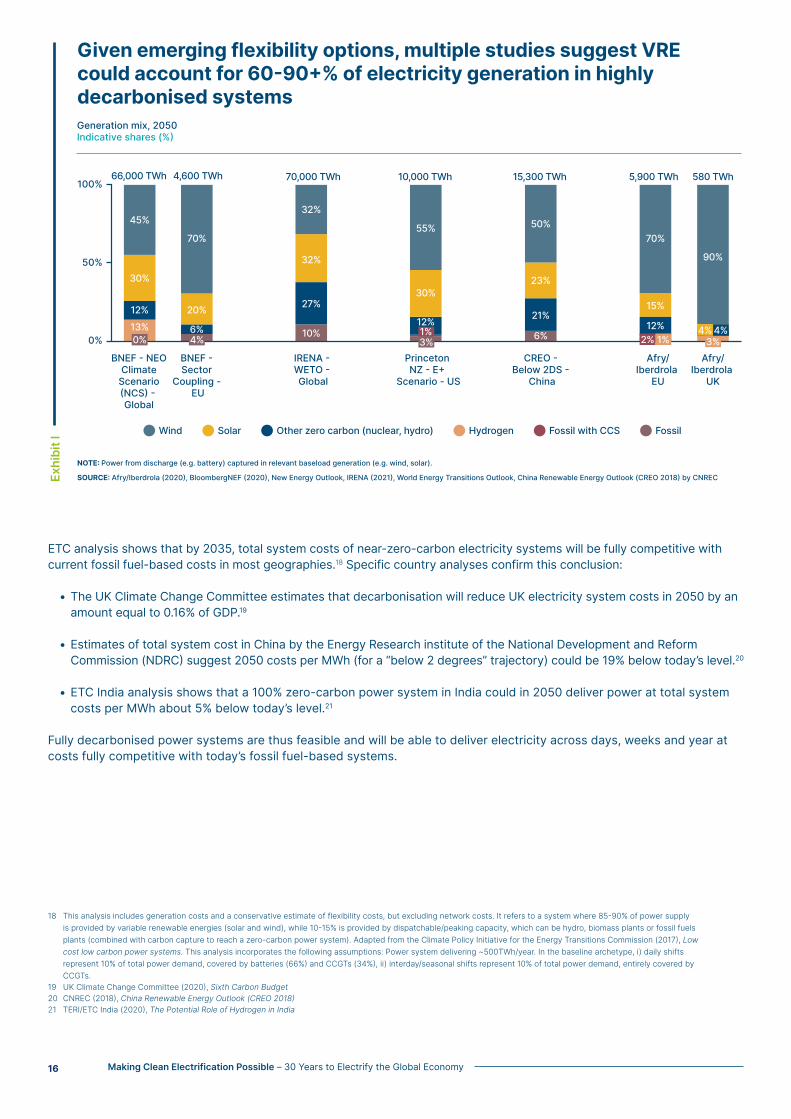
Given these increasingly cost-effective balancing options, estimates of maximum cost-effective VRE generation shares in the power system have increased significantly in recent years. Most suggest that over 70% is feasible, while some argue that shares as high as 90% are possible. Our ETC scenarios illustrate a range from 70-90%.
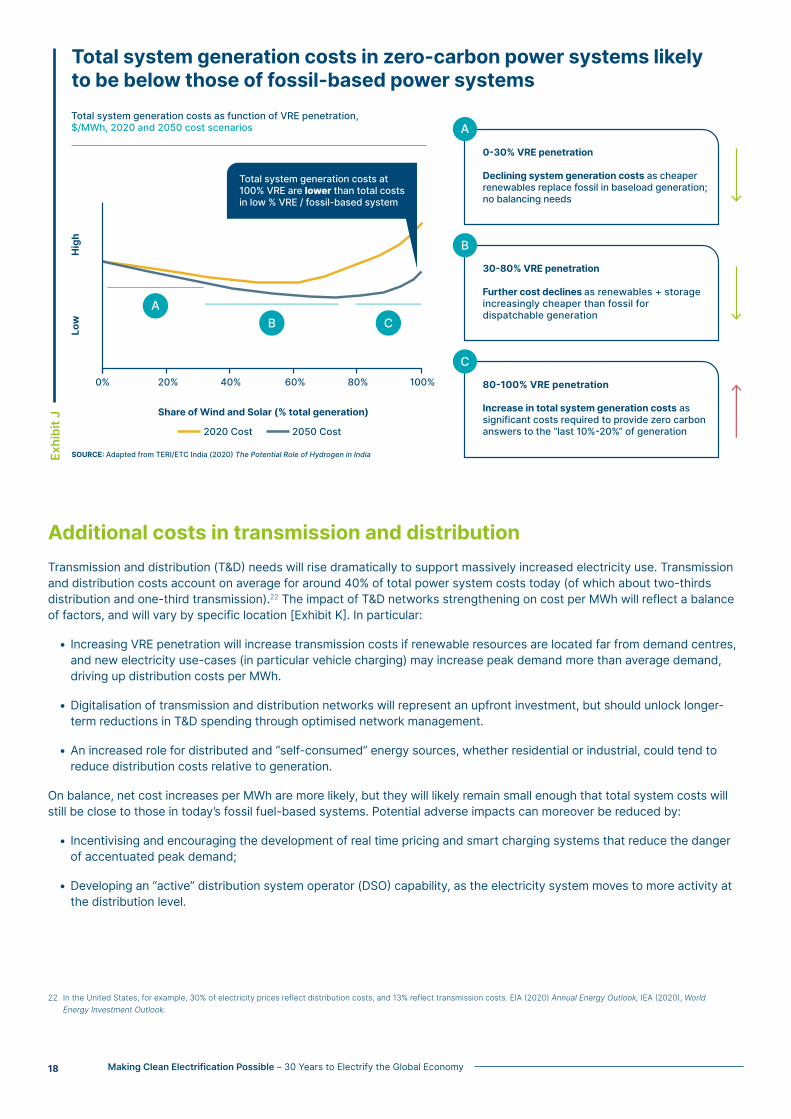
Total system generation costs – fully competitive with fossil fuels Providing the storage and flexibility needed to balance VRE-based systems will entail additional costs, but these will be offset by the fact that VRE generation costs are lower than for fossil fuels. Combining the two effects, total system costs will vary with VRE penetration in the fashion shown in Exhibit J.
• As VRE penetration increases to around 60%, total system costs will fall. Beyond, with some higher VRE penetration, additional storage and flexibility costs will start outweighing the benefit of cheaper generation.
• But the penetration rate at which costs begin to rise will rise over time, potentially reaching 70-80% as storage and flexibility costs decline.
• Long-term total system costs for fully decarbonised systems will often therefore be below those of today’s fossil fuel-based systems.
13 BloombergNEF(2020),Lithium-ion Battery Price Survey14 Tosupportdevelopmentofthesedemandmanagementoptions,itiscriticalforgovernmentsandelectricityregulatorstodeployasetofenablers.Itwillrequirerollingoutappropriateincentiveswithinpowermarkets(inparticularreal-timepricing),aswellasensuringthemandatoryinstallationofsmartcapabilities(e.g.smartchargers),easeofcustomeruse,andthedevelopmentofaggregatorandvirtualpowerplant(VPP)businessmodels.
15 Inaregionallylimitedconnectedgrid,thereisahigherriskofsecurityofsupply,withanunexpectedresourceshortfallforVREproductioninonecountrycouldcutoffexportsandcauseblackouts.
16 Curtailmentwillfurthermorebereducedinamarketthathasfacilitatedstorageand/orhydrogenproduction.17 Hydrogencouldalsobereconvertedtopowerviafuelcells,thoughthisroutefaceslowertechnologyreadinesslevelsandhighercostscomparedwithburningincompatible-CCGTs.
Making Clean Electrification Possible – 30 Years to Electrify the Global Economy 15
ETC analysis shows that by 2035, total system costs of near-zero-carbon electricity systems will be fully competitive with current fossil fuel-based costs in most geographies.18 Specific country analyses confirm this conclusion:
• The UK Climate Change Committee estimates that decarbonisation will reduce UK electricity system costs in 2050 by an amount equal to 0.16% of GDP.19
• Estimates of total system cost in China by the Energy Research institute of the National Development and Reform Commission (NDRC) suggest 2050 costs per MWh (for a “below 2 degrees” trajectory) could be 19% below today’s level.20
• ETC India analysis shows that a 100% zero-carbon power system in India could in 2050 deliver power at total system costs per MWh about 5% below today’s level.21
Fully decarbonised power systems are thus feasible and will be able to deliver electricity across days, weeks and year at costs fully competitive with today’s fossil fuel-based systems.
18 Thisanalysisincludesgenerationcostsandaconservativeestimateofflexibilitycosts,butexcludingnetworkcosts.Itreferstoasystemwhere85-90%ofpowersupplyisprovidedbyvariablerenewableenergies(solarandwind),while10-15%isprovidedbydispatchable/peakingcapacity,whichcanbehydro,biomassplantsorfossilfuelsplants(combinedwithcarboncapturetoreachazero-carbonpowersystem).AdaptedfromtheClimatePolicyInitiativefortheEnergyTransitionsCommission(2017),Low cost low carbon power systems. Thisanalysisincorporatesthefollowingassumptions:Powersystemdelivering~500TWh/year.Inthebaselinearchetype,i)dailyshiftsrepresent10%oftotalpowerdemand,coveredbybatteries(66%)andCCGTs(34%),ii)interday/seasonalshiftsrepresent10%oftotalpowerdemand,entirelycoveredbyCCGTs.
19 UKClimateChangeCommittee(2020),Sixth Carbon Budget 20 CNREC(2018),China Renewable Energy Outlook (CREO 2018)21 TERI/ETCIndia(2020),The Potential Role of Hydrogen in India
Exhi
bit I
Wind Solar Other zero carbon (nuclear, hydro) Hydrogen Fossil with CCS Fossil
Given emerging flexibility options, multiple studies suggest VRE could account for 60-90+% of electricity generation in highly decarbonised systems
NOTE: Power from discharge (e.g. battery) captured in relevant baseload generation (e.g. wind, solar).
SOURCE: Afry/Iberdrola (2020), BloombergNEF (2020), New Energy Outlook, IRENA (2021), World Energy Transitions Outlook, China Renewable Energy Outlook (CREO 2018) by CNREC
Generation mix, 2050Indicative shares (%)
0%
BNEF - NEOClimateScenario(NCS) - Global
66,000 TWh 4,600 TWh 70,000 TWh 10,000 TWh 15,300 TWh 5,900 TWh 580 TWh
BNEF - Sector Coupling - EU
IRENA - WETO - Global
Princeton NZ - E+
Scenario - US
CREO - Below 2DS - China
Afry/Iberdrola EU
Afry/Iberdrola UK
50%
100%
45%
70%
32%
55% 50%70%
90%
15%
12%
23%
21%
6%
30%
12%
32%
27%
10%
20%
6%
30%
12%13%0% 4% 3% 2% 1% 3%
4%4%1%
Making Clean Electrification Possible – 30 Years to Electrify the Global Economy16
17Making Clean Electrification Possible – 30 Years to Electrify the Global Economy
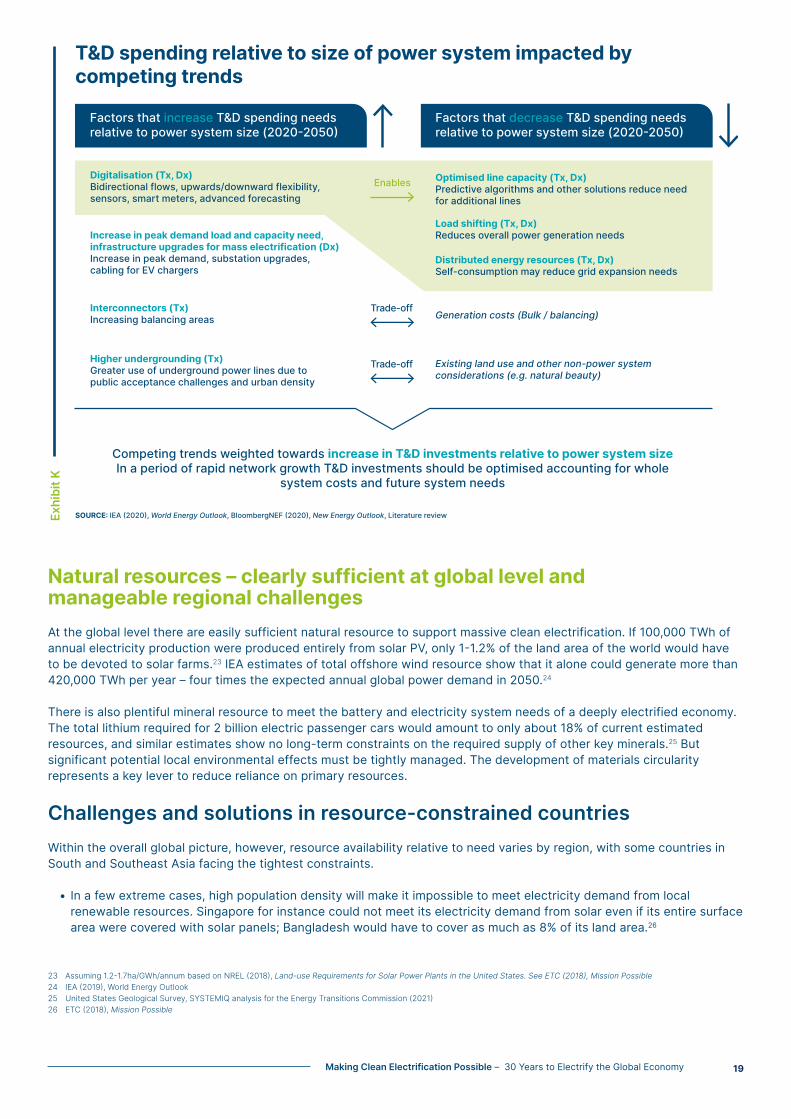
Additional costs in transmission and distributionTransmission and distribution (T&D) needs will rise dramatically to support massively increased electricity use. Transmission and distribution costs account on average for around 40% of total power system costs today (of which about two-thirds distribution and one-third transmission).22 The impact of T&D networks strengthening on cost per MWh will reflect a balance of factors, and will vary by specific location [Exhibit K]. In particular:
• Increasing VRE penetration will increase transmission costs if renewable resources are located far from demand centres, and new electricity use-cases (in particular vehicle charging) may increase peak demand more than average demand, driving up distribution costs per MWh.
• Digitalisation of transmission and distribution networks will represent an upfront investment, but should unlock longer-term reductions in T&D spending through optimised network management.
• An increased role for distributed and “self-consumed” energy sources, whether residential or industrial, could tend to reduce distribution costs relative to generation.
On balance, net cost increases per MWh are more likely, but they will likely remain small enough that total system costs will still be close to those in today’s fossil fuel-based systems. Potential adverse impacts can moreover be reduced by:
• Incentivising and encouraging the development of real time pricing and smart charging systems that reduce the danger of accentuated peak demand;
• Developing an “active” distribution system operator (DSO) capability, as the electricity system moves to more activity at the distribution level.
22 IntheUnitedStates,forexample,30%ofelectricitypricesreflectdistributioncosts,and13%reflecttransmissioncosts.EIA(2020)Annual Energy Outlook, IEA(2020),World Energy Investment Outlook.
Exhi
bit J
Total system generation costs in zero-carbon power systems likely to be below those of fossil-based power systems
SOURCE: Adapted from TERI/ETC India (2020) The Potential Role of Hydrogen in India
0% 20% 40%
2020 Cost
60%
Share of Wind and Solar (% total generation)
Low
High
80% 100%
Total system generation costs as function of VRE penetration, $/MWh, 2020 and 2050 cost scenarios
0-30% VRE penetration
Declining system generation costs as cheaper renewables replace fossil in baseload generation; no balancing needs
30-80% VRE penetration
Further cost declines as renewables + storage increasingly cheaper than fossil for dispatchable generation
80-100% VRE penetration
Increase in total system generation costs as significant costs required to provide zero carbon answers to the “last 10%-20%” of generation
A
A
B
B
C
C
2050 Cost
Total system generation costs at 100% VRE are lower than total costs in low % VRE / fossil-based system
Making Clean Electrification Possible – 30 Years to Electrify the Global Economy18
Natural resources – clearly sufficient at global level and manageable regional challengesAt the global level there are easily sufficient natural resource to support massive clean electrification. If 100,000 TWh of annual electricity production were produced entirely from solar PV, only 1-1.2% of the land area of the world would have to be devoted to solar farms.23 IEA estimates of total offshore wind resource show that it alone could generate more than 420,000 TWh per year – four times the expected annual global power demand in 2050.24
There is also plentiful mineral resource to meet the battery and electricity system needs of a deeply electrified economy. The total lithium required for 2 billion electric passenger cars would amount to only about 18% of current estimated resources, and similar estimates show no long-term constraints on the required supply of other key minerals.25 But significant potential local environmental effects must be tightly managed. The development of materials circularity represents a key lever to reduce reliance on primary resources.
Challenges and solutions in resource-constrained countries Within the overall global picture, however, resource availability relative to need varies by region, with some countries in South and Southeast Asia facing the tightest constraints.
• In a few extreme cases, high population density will make it impossible to meet electricity demand from local renewable resources. Singapore for instance could not meet its electricity demand from solar even if its entire surface area were covered with solar panels; Bangladesh would have to cover as much as 8% of its land area.26
23 Assuming1.2-1.7ha/GWh/annumbasedonNREL(2018),Land-use Requirements for Solar Power Plants in the United States. See ETC (2018), Mission Possible24 IEA(2019),WorldEnergyOutlook25 UnitedStatesGeologicalSurvey,SYSTEMIQanalysisfortheEnergyTransitionsCommission(2021)26 ETC(2018),Mission Possible
Exhi
bit K
T&D spending relative to size of power system impacted by competing trends
SOURCE: IEA (2020), World Energy Outlook, BloombergNEF (2020), New Energy Outlook, Literature review
Factors that increase T&D spending needs relative to power system size (2020-2050)
Factors that decrease T&D spending needs relative to power system size (2020-2050)
Digitalisation (Tx, Dx)Bidirectional flows, upwards/downward flexibility, sensors, smart meters, advanced forecasting
Optimised line capacity (Tx, Dx)Predictive algorithms and other solutions reduce need for additional lines
Load shifting (Tx, Dx)Reduces overall power generation needs
Distributed energy resources (Tx, Dx)Self-consumption may reduce grid expansion needs
Generation costs (Bulk / balancing)
Existing land use and other non-power system considerations (e.g. natural beauty)
Increase in peak demand load and capacity need, infrastructure upgrades for mass electrification (Dx)Increase in peak demand, substation upgrades, cabling for EV chargers
Interconnectors (Tx)Increasing balancing areas
Higher undergrounding (Tx)Greater use of underground power lines due to public acceptance challenges and urban density
Competing trends weighted towards increase in T&D investments relative to power system sizeIn a period of rapid network growth T&D investments should be optimised accounting for whole
system costs and future system needs
Enables
Trade-off
Trade-off
Making Clean Electrification Possible – 30 Years to Electrify the Global Economy 19
• In other cases, local resource is in principle sufficient, but well-designed national strategies are needed to avoid constraints on the required pace of growth. For instance, while India has sufficient land to support a solar-led power system delivering 7,000 TWh by 2050, rapid development could be limited by barriers to land acquisition.27
The more extreme challenges can be overcome either by long-distance energy transport or through deployment of land-efficient zero-carbon generation options.
• Long-distance energy transport could be via HVDC electricity transmission or in the form of hydrogen or ammonia. Given the dramatically low solar and wind costs which will apply in some favourable locations, clean energy transport is likely to be economic over even very long distances (e.g. from western Australia to Singapore) for countries with low local resources. But maximising these opportunities will sometimes require international cooperation and trust to overcome concerns about energy security.
• Land-efficient zero-carbon generation options could include:
◦ Nuclear power deployed as a major supplement to VRE;
◦ New renewable technologies including: ‣ Floating offshore wind turbines – for countries that lack extensive shallow sea beds; ‣ Airborne wind power generation through kites, rigid wings, or airborne rotors – to expand accessible wind resources; ‣ Floating solar deployment over lakes and reservoirs, reducing land requirements;
◦ CCS applied mainly to fossil fuel generation.
Phasing out unabated fossil fuel plantsGiven resource availability, technical feasibility, and cost competitiveness, all countries should ensure that the near totality of electricity generation growth now comes from zero-carbon sources.
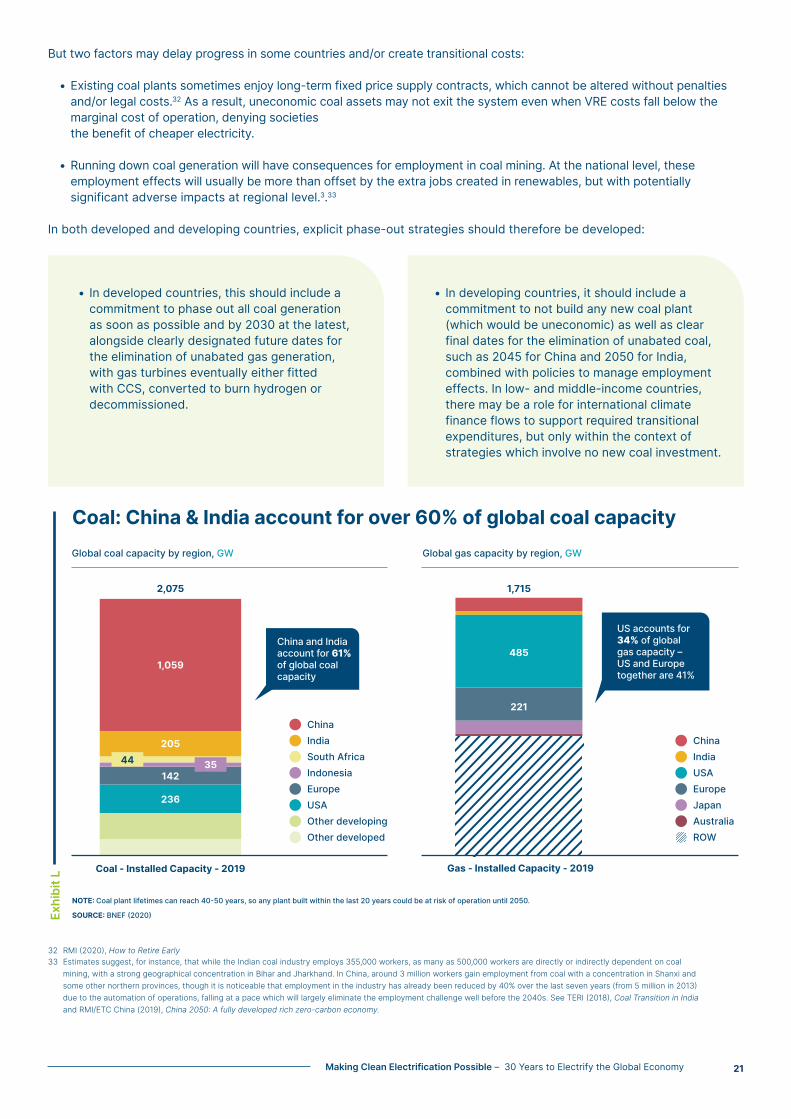
In addition, countries must develop strategies for the eventual phase-out of existing unabated fossil fuel generation. Global coal capacity of 2,075 GW accounts for 9,000 TWh of today’s generation and 9.5 Gt of CO2 emissions, with China and India accounting for around 60% of the total.28 Current global gas capacity of 1,715 GW generates 6,000 TWh and produces 3 Gt of CO2, with the US accounting for 34% of the total.29 [Exhibit L]. IEA estimates for methane emissions from the oil and gas industry (with around 60% of those accounted for by gas operations), were over 80 Mt of CH4 in 2019 – converted into CO2 equivalent amounts, this is larger than the total energy-related CO2 emissions of the European Union.30 Clear strategies for phase-out are essential to make net-zero emissions by mid-century a feasible global objective.
In many locations, phase-out will entail minimal or nil economic cost as VRE generation costs fall below the marginal cost of running either gas or coal plants. Capacity utilisation will therefore naturally decline, with many fossil plants shifting to become providers of flexible response in systems increasingly dominated by VRE. Some estimates suggest indeed that the pace of economically optimal reduction could be very rapid. For instance, BloombergNEF project that, in China, wind and solar generation costs could outcompete most existing coal plants by the mid/late 2020s.31 Optimal policy could entail not only running many plants at lower capacity utilisation, but retiring some early.
27 AnalysisinTERI/ETC India (2020) The Potential Role of Hydrogen in India28 BloombergNEF (2020), New Energy Outlook29 BloombergNEF (2020), New Energy Outlook30 Assumingthatonetonneofmethaneisequivalentto30tonnesofCO2.IEA(2021),Methane Tracker.31 BloombergNEF(2020),New Energy Outlook
Making Clean Electrification Possible – 30 Years to Electrify the Global Economy20
But two factors may delay progress in some countries and/or create transitional costs:
• Existing coal plants sometimes enjoy long-term fixed price supply contracts, which cannot be altered without penalties and/or legal costs.32 As a result, uneconomic coal assets may not exit the system even when VRE costs fall below the marginal cost of operation, denying societies the benefit of cheaper electricity.
• Running down coal generation will have consequences for employment in coal mining. At the national level, these employment effects will usually be more than offset by the extra jobs created in renewables, but with potentially significant adverse impacts at regional level.3.33
In both developed and developing countries, explicit phase-out strategies should therefore be developed:
32 RMI(2020),How to Retire Early33 Estimatessuggest,forinstance,thatwhiletheIndiancoalindustryemploys355,000workers,asmanyas500,000workersaredirectlyorindirectlydependentoncoalmining,withastronggeographicalconcentrationinBiharandJharkhand.InChina,around3millionworkersgainemploymentfromcoalwithaconcentrationinShanxiandsomeothernorthernprovinces,thoughitisnoticeablethatemploymentintheindustryhasalreadybeenreducedby40%overthelastsevenyears(from5millionin2013)duetotheautomationofoperations,fallingatapacewhichwilllargelyeliminatetheemploymentchallengewellbeforethe2040s.SeeTERI(2018),Coal Transition in IndiaandRMI/ETCChina(2019), China 2050: A fully developed rich zero-carbon economy.
Global coal capacity by region, GW Global gas capacity by region, GW
Coal: China & India account for over 60% of global coal capacity
NOTE: Coal plant lifetimes can reach 40-50 years, so any plant built within the last 20 years could be at risk of operation until 2050.
SOURCE: BNEF (2020)
Coal - Installed Capacity - 2019
ChinaIndia China
IndiaUSAEuropeJapanAustraliaROW
South AfricaIndonesiaEuropeUSAOther developingOther developed
China and India account for 61% of global coal capacity
2,075
1,059
205
142
236
44 35
Gas - Installed Capacity - 2019
1,715
485
221
US accounts for 34% of global gas capacity – US and Europe together are 41%
Exhi
bit L
• In developing countries, it should include a commitment to not build any new coal plant (which would be uneconomic) as well as clear final dates for the elimination of unabated coal, such as 2045 for China and 2050 for India, combined with policies to manage employment effects. In low- and middle-income countries, there may be a role for international climate finance flows to support required transitional expenditures, but only within the context of strategies which involve no new coal investment.
• In developed countries, this should include a commitment to phase out all coal generation as soon as possible and by 2030 at the latest, alongside clearly designated future dates for the elimination of unabated gas generation, with gas turbines eventually either fitted with CCS, converted to burn hydrogen or decommissioned.
Making Clean Electrification Possible – 30 Years to Electrify the Global Economy 21
III. Building and financing zero-carbon power systems
Delivering the clean electricity needed in a zero-carbon economy requires a massive increase in investment in renewables, other zero-carbon generation technologies, as well as in electricity transmission and distribution networks. Annual deployment of solar and wind must increase 10 to 15 times above current levels over the next two decades. In total, gross power system investments for direct and indirect electrification could amount to around $80 trillion over the next 30 years, equivalent to around 1.3% of global GDP over that period.34
This required investment is feasible but will only occur fast enough if governments create sufficient market certainty; putting in place clear deployment objectives, supported by appropriate power market design, together with actions to identify and remove potential barriers to development.
Scale and timing of require investment needsPrecise investment needs will depend on future technology and cost trends, and the mix will vary by region. But global scenarios illustrate the huge scale of investment required.
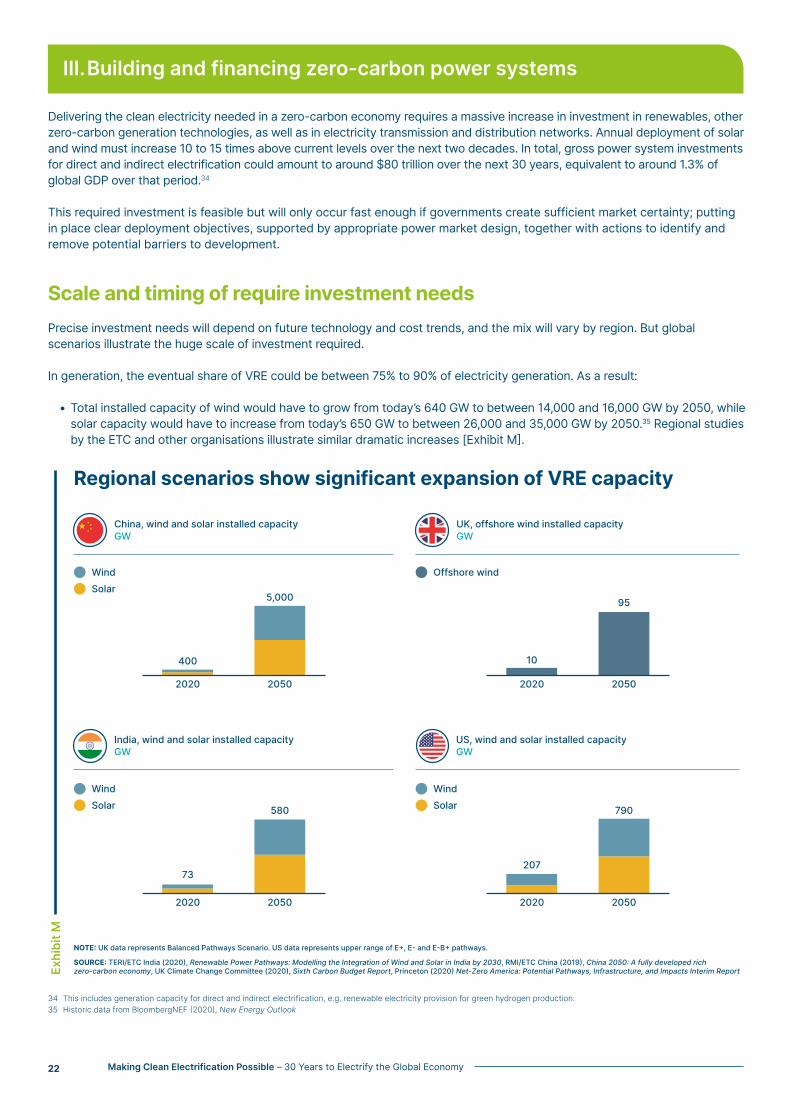
In generation, the eventual share of VRE could be between 75% to 90% of electricity generation. As a result:
• Total installed capacity of wind would have to grow from today’s 640 GW to between 14,000 and 16,000 GW by 2050, while solar capacity would have to increase from today’s 650 GW to between 26,000 and 35,000 GW by 2050.35 Regional studies by the ETC and other organisations illustrate similar dramatic increases [Exhibit M].
34 Thisincludesgenerationcapacityfordirectandindirectelectrification,e.g.renewableelectricityprovisionforgreenhydrogenproduction. 35 HistoricdatafromBloombergNEF(2020),New Energy Outlook
Exhi
bit M
Regional scenarios show significant expansion of VRE capacity
NOTE: UK data represents Balanced Pathways Scenario. US data represents upper range of E+, E- and E-B+ pathways.
SOURCE: TERI/ETC India (2020), Renewable Power Pathways: Modelling the Integration of Wind and Solar in India by 2030, RMI/ETC China (2019), China 2050: A fully developed rich zero-carbon economy, UK Climate Change Committee (2020), Sixth Carbon Budget Report, Princeton (2020) Net-Zero America: Potential Pathways, Infrastructure, and Impacts Interim Report
China, wind and solar installed capacityGW
UK, offshore wind installed capacityGW
India, wind and solar installed capacityGW
US, wind and solar installed capacityGW
2020
400
2050
5,000
2020
73
2050
580
2020
207
2050
790
2020
10
2050
95
WindSolar
WindSolar
WindSolar
Offshore wind
Making Clean Electrification Possible – 30 Years to Electrify the Global Economy22
• To achieve these 2050 capacity levels, new wind installations would need to grow from around 50 GW per annum in 2017-2019 to betwee n 700-800 GW by 2040-45, with solar installations growing from 115 GW per annum to 1,400-2,000 GW.36
• In addition, countries will need to invest in a mix of nuclear, hydro, and CCS plants, along with battery and other storage capacity.
• Total investment requirements in electricity generation could therefore increase from today’s $300 billion per annum to a peak of about $2 trillion in 2040-45 before declining slowly thereafter.
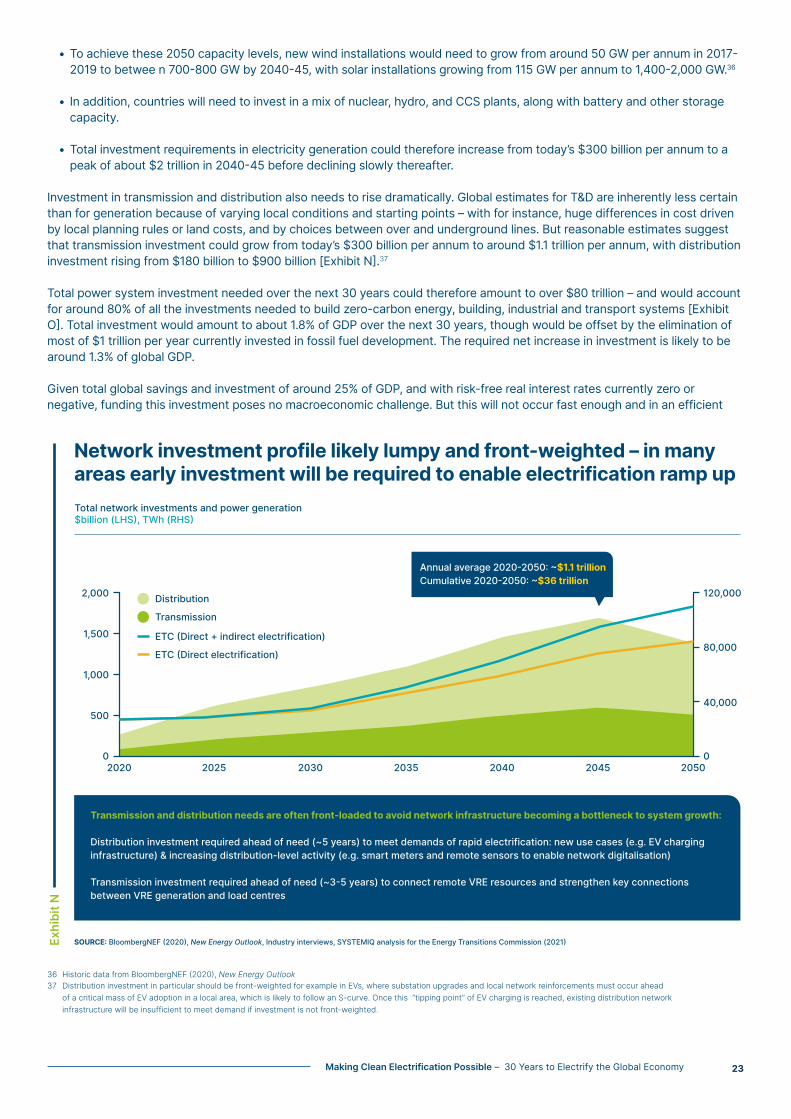
Investment in transmission and distribution also needs to rise dramatically. Global estimates for T&D are inherently less certain than for generation because of varying local conditions and starting points – with for instance, huge differences in cost driven by local planning rules or land costs, and by choices between over and underground lines. But reasonable estimates suggest that transmission investment could grow from today’s $300 billion per annum to around $1.1 trillion per annum, with distribution investment rising from $180 billion to $900 billion [Exhibit N].37
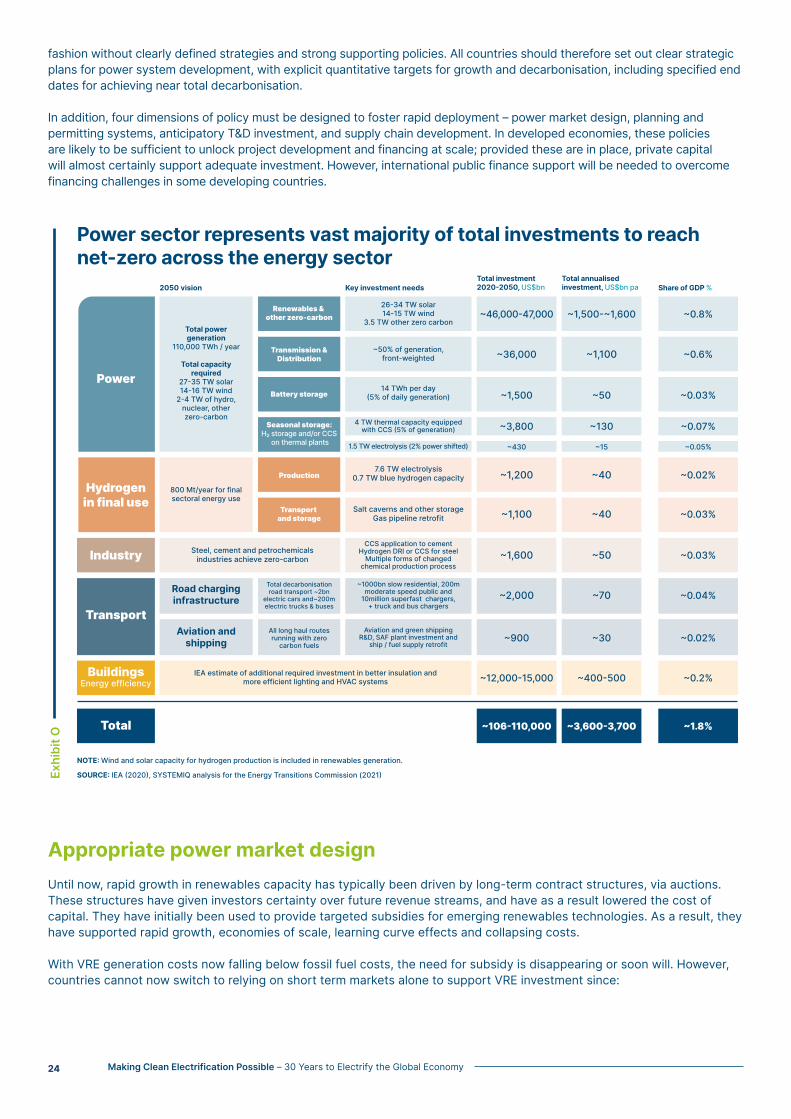
Total power system investment needed over the next 30 years could therefore amount to over $80 trillion – and would account for around 80% of all the investments needed to build zero-carbon energy, building, industrial and transport systems [Exhibit O]. Total investment would amount to about 1.8% of GDP over the next 30 years, though would be offset by the elimination of most of $1 trillion per year currently invested in fossil fuel development. The required net increase in investment is likely to be around 1.3% of global GDP.
Given total global savings and investment of around 25% of GDP, and with risk-free real interest rates currently zero or negative, funding this investment poses no macroeconomic challenge. But this will not occur fast enough and in an efficient
36 HistoricdatafromBloombergNEF(2020),New Energy Outlook37 Distributioninvestmentinparticularshouldbefront-weightedforexampleinEVs,wheresubstationupgradesandlocalnetworkreinforcementsmustoccuraheadofacriticalmassofEVadoptioninalocalarea,whichislikelytofollowanS-curve.Oncethis“tippingpoint”ofEVchargingisreached,existingdistributionnetworkinfrastructurewillbeinsufficienttomeetdemandifinvestmentisnotfront-weighted.
Annual average 2020-2050: ~$1.1 trillionCumulative 2020-2050: ~$36 trillion
Distribution
Transmission
ETC (Direct + indirect electrification)
ETC (Direct electrification)
2,000
1,500
1,000
500
0 0
40,000
80,000
120,000
2020 2025 2030 2035 2040 2045 2050
Network investment profile likely lumpy and front-weighted – in many areas early investment will be required to enable electrification ramp up
SOURCE: BloombergNEF (2020), New Energy Outlook, Industry interviews, SYSTEMIQ analysis for the Energy Transitions Commission (2021)
Total network investments and power generation$billion (LHS), TWh (RHS)
Transmission and distribution needs are often front-loaded to avoid network infrastructure becoming a bottleneck to system growth:
Distribution investment required ahead of need (~5 years) to meet demands of rapid electrification: new use cases (e.g. EV charging infrastructure) & increasing distribution-level activity (e.g. smart meters and remote sensors to enable network digitalisation)
Transmission investment required ahead of need (~3-5 years) to connect remote VRE resources and strengthen key connections between VRE generation and load centres
Exhi
bit N
Making Clean Electrification Possible – 30 Years to Electrify the Global Economy 23
fashion without clearly defined strategies and strong supporting policies. All countries should therefore set out clear strategic plans for power system development, with explicit quantitative targets for growth and decarbonisation, including specified end dates for achieving near total decarbonisation.
In addition, four dimensions of policy must be designed to foster rapid deployment – power market design, planning and permitting systems, anticipatory T&D investment, and supply chain development. In developed economies, these policies are likely to be sufficient to unlock project development and financing at scale; provided these are in place, private capital will almost certainly support adequate investment. However, international public finance support will be needed to overcome financing challenges in some developing countries.
Appropriate power market designUntil now, rapid growth in renewables capacity has typically been driven by long-term contract structures, via auctions. These structures have given investors certainty over future revenue streams, and have as a result lowered the cost of capital. They have initially been used to provide targeted subsidies for emerging renewables technologies. As a result, they have supported rapid growth, economies of scale, learning curve effects and collapsing costs.
With VRE generation costs now falling below fossil fuel costs, the need for subsidy is disappearing or soon will. However, countries cannot now switch to relying on short term markets alone to support VRE investment since:
Exhi
bit O
Power sector represents vast majority of total investments to reach net-zero across the energy sector
NOTE: Wind and solar capacity for hydrogen production is included in renewables generation.
SOURCE: IEA (2020), SYSTEMIQ analysis for the Energy Transitions Commission (2021)
2050 vision Key investment needsTotal investment 2020-2050, US$bn
Total annualisedinvestment, US$bn pa
Power
Renewables & other zero-carbon ~46,000-47,000
~1,500
~1,500-~1,600
~50
~1,200 ~40
~1,100 ~40
~1,600 ~50
~2,000 ~70
~3,800 ~130
~430 ~15
~36,000 ~1,100
Battery storage
Production
Transport and storage
Seasonal storage: H₂ storage and/or CCS on thermal plants
Transmission &Distribution
Industry
Total
Transport
Hydrogenin final use
Total power generation
110,000 TWh / year
Total capacity required
27-35 TW solar14-16 TW wind2-4 TW of hydro, nuclear, other zero-carbon
800 Mt/year for final sectoral energy use
Steel, cement and petrochemicals industries achieve zero-carbon
26-34 TW solar14-15 TW wind
3.5 TW other zero carbon
~50% of generation, front-weighted
14 TWh per day(5% of daily generation)
7.6 TW electrolysis0.7 TW blue hydrogen capacity
Salt caverns and other storageGas pipeline retrofit
CCS application to cementHydrogen DRI or CCS for steelMultiple forms of changed chemical production process
~12,000-15,000 ~400-500BuildingsEnergy efficiency
IEA estimate of additional required investment in better insulation and more efficient lighting and HVAC systems
~1000bn slow residential, 200m moderate speed public and 10million superfast chargers, + truck and bus chargers
Total decarbonisation road transport ~2bn electric cars and~200m electric trucks & buses
Road charginginfrastructure
~900 ~30Aviation and green shipping R&D, SAF plant investment and ship / fuel supply retrofit
4 TW thermal capacity equipped with CCS (5% of generation)
1.5 TW electrolysis (2% power shifted)
~106-110,000 ~3,600-3,700
Share of GDP %
~0.8%
~0.03%
~0.02%
~0.03%
~0.03%
~0.04%
~0.07%
~0.05%
~0.6%
~0.2%
~0.02%
~1.8%
Aviation and shipping
All long haul routes running with zero carbon fuels
Making Clean Electrification Possible – 30 Years to Electrify the Global Economy24
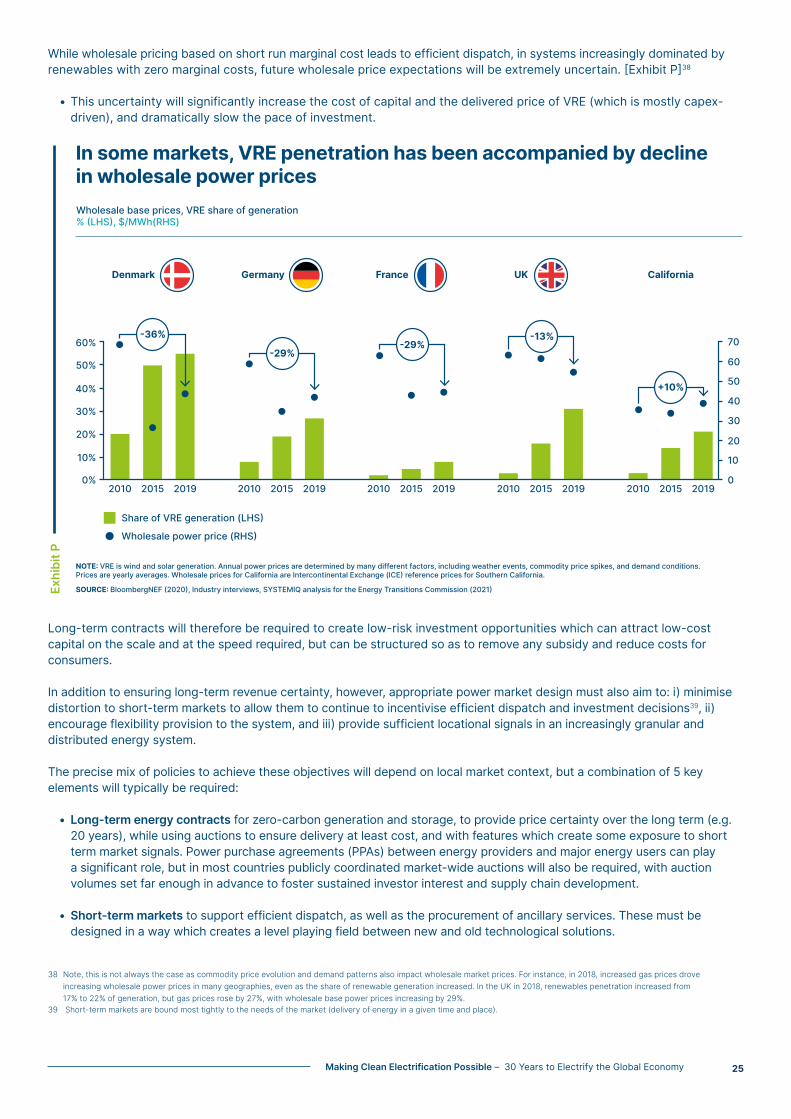
While wholesale pricing based on short run marginal cost leads to efficient dispatch, in systems increasingly dominated by renewables with zero marginal costs, future wholesale price expectations will be extremely uncertain. [Exhibit P]38
• This uncertainty will significantly increase the cost of capital and the delivered price of VRE (which is mostly capex-driven), and dramatically slow the pace of investment.
Long-term contracts will therefore be required to create low-risk investment opportunities which can attract low-cost capital on the scale and at the speed required, but can be structured so as to remove any subsidy and reduce costs for consumers.
In addition to ensuring long-term revenue certainty, however, appropriate power market design must also aim to: i) minimise distortion to short-term markets to allow them to continue to incentivise efficient dispatch and investment decisions39, ii) encourage flexibility provision to the system, and iii) provide sufficient locational signals in an increasingly granular and distributed energy system.
The precise mix of policies to achieve these objectives will depend on local market context, but a combination of 5 key elements will typically be required:
• Long-term energy contracts for zero-carbon generation and storage, to provide price certainty over the long term (e.g. 20 years), while using auctions to ensure delivery at least cost, and with features which create some exposure to short term market signals. Power purchase agreements (PPAs) between energy providers and major energy users can play a significant role, but in most countries publicly coordinated market-wide auctions will also be required, with auction volumes set far enough in advance to foster sustained investor interest and supply chain development.
• Short-term markets to support efficient dispatch, as well as the procurement of ancillary services. These must be designed in a way which creates a level playing field between new and old technological solutions.
38 Note,thisisnotalwaysthecaseascommoditypriceevolutionanddemandpatternsalsoimpactwholesalemarketprices.Forinstance,in2018,increasedgaspricesdroveincreasingwholesalepowerpricesinmanygeographies,evenastheshareofrenewablegenerationincreased.IntheUKin2018,renewablespenetrationincreasedfrom17%to22%ofgeneration,butgaspricesroseby27%,withwholesalebasepowerpricesincreasingby29%.
39 Short-termmarketsareboundmosttightlytotheneedsofthemarket(deliveryofenergyinagiventimeandplace).
Exhi
bit P
Share of VRE generation (LHS)
Wholesale power price (RHS)
In some markets, VRE penetration has been accompanied by decline in wholesale power prices
NOTE: VRE is wind and solar generation. Annual power prices are determined by many different factors, including weather events, commodity price spikes, and demand conditions. Prices are yearly averages. Wholesale prices for California are Intercontinental Exchange (ICE) reference prices for Southern California.
SOURCE: BloombergNEF (2020), Industry interviews, SYSTEMIQ analysis for the Energy Transitions Commission (2021)
Wholesale base prices, VRE share of generation% (LHS), $/MWh(RHS)
60%
California
50%
40%
30%
20%
10%
0%2010 2015 2019 2010 2015 2019 2010 2015 2019 2010 2015 2019 2010 2015 2019
0
10
20
30
40
50
60
70
FranceGermanyDenmark UK
-36%
-29%-29%
+10%
-13%
Making Clean Electrification Possible – 30 Years to Electrify the Global Economy 25
• Long-term peak capacity mechanisms, which ensure sufficient capacity to balance supply and demand, but avoiding any bias in favour of existing fossil fuel-based plants.
• The development of flexibility enablers, such as real-time pricing as well as smart charging facilities, that support demand management and distributed storage.
• A set of market enablers to underpin the smooth functioning and correct signals across the system, including system operator capabilities and a transparent decision-making process.
26 Making Clean Electrification Possible – 30 Years to Electrify the Global Economy
These principles and priorities are relevant across the world. But some developing countries face additional challenges. Some have regulated markets which do not ensure efficient least-cost dispatch, running existing fossil fuel plants even when VRE is cheaper. And in several countries, VRE developments are stymied because of inadequate contract certainty and low credit worthiness of distribution companies. Specific priorities in these countries will sometimes include:
• Progressive evolution towards liberalised markets, while maintaining a role for long-term contracts;
• Reforms to improve rate of cost recovery and off-taker creditworthiness;
• Regulations to ensure improved grid connection access for VRE generation.
Planning, permitting and land acquisition systems to support rapid VRE developmentRenewables development, even if eventually approved, is often greatly delayed by lengthy planning and permitting procedures, and/or by local opposition on the grounds of localised impact or noise pollution. In addition, in some developing countries (for instance, in India) processes for land acquisition can be lengthy and expensive as a result of uncertainty over ownership and slow legal procedures. Countries therefore need to develop explicit strategies for future VRE development which include:
• Strategic assessment of the long-term need and likely location of VRE installations, if possible developing types of resource (e.g. offshore wind) which reduce competition for land;
• Streamlined permitting processes with coordination across different regulatory bodies;
• Encouragement to distributed generation and/or community ownership models which can build local support.
Frameworks for anticipatory transmission and distribution investmentPlanning and permitting procedures and local opposition are important potential barriers to transmission as much as generation investment. In addition, transmission and distribution investments have 4 specific features with implications for optimal policy approach:
• Transmission investments are often “lumpy” in nature, with large initial investments in long distance lines producing big step changes in asset bases and costs.
• Investments in both T&D are often needed ahead of demand growth, with low initial utilisation before usage rises to fill the capacity and justify the investment.
• Some transmission investments – such as long-distance links to cheap renewable supply – could add permanently to total T&D costs, but reduce total system cost.
• Investment costs vary greatly according to the local environmental and aesthetic choices. For instance, long-distance transmission costs per km can increase 5 times if undergrounding is required.40
In many countries, existing investment approval processes under existing network regulation are not well designed to address these challenges and should be changed to support:
• Developments which are required ahead of demand (“anticipatory investment”), or which will produce generation cost benefits for consumers that will offset higher T&D charges;
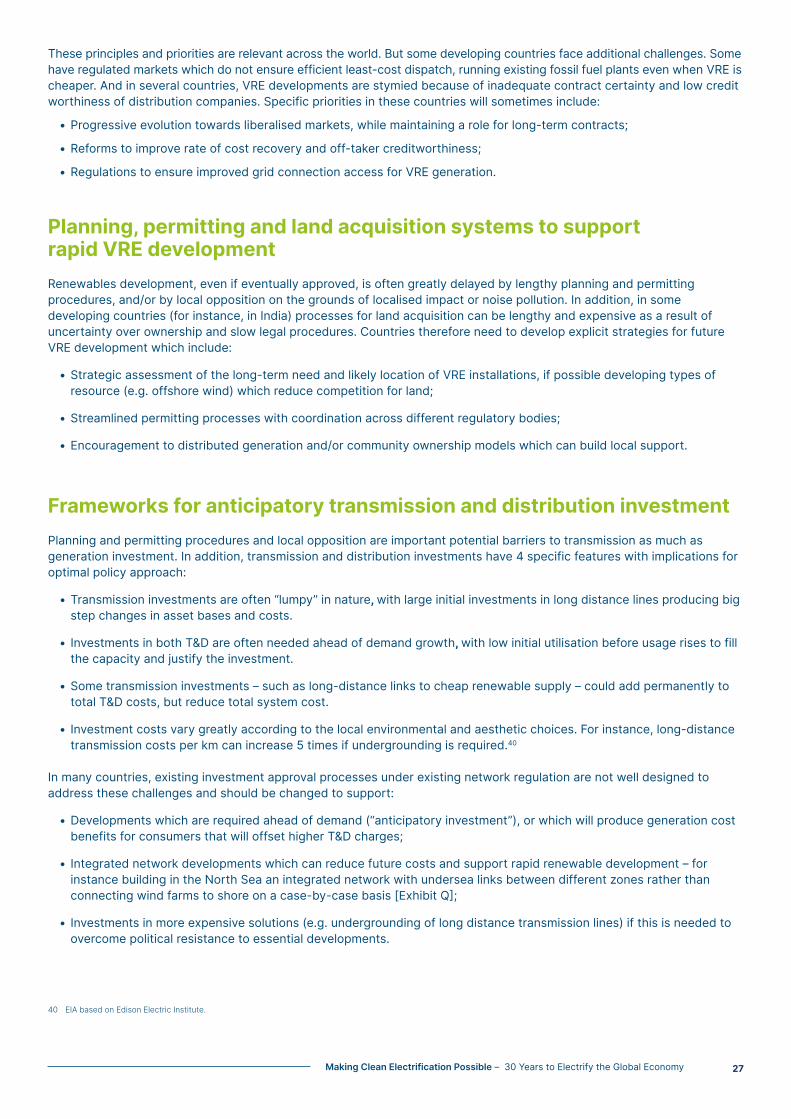
• Integrated network developments which can reduce future costs and support rapid renewable development – for instance building in the North Sea an integrated network with undersea links between different zones rather than connecting wind farms to shore on a case-by-case basis [Exhibit Q];
• Investments in more expensive solutions (e.g. undergrounding of long distance transmission lines) if this is needed to overcome political resistance to essential developments.
40 EIAbasedonEdisonElectricInstitute.
Making Clean Electrification Possible – 30 Years to Electrify the Global Economy 27
Ensuring timely connections to remote VRE resources requires coordinated network planning
SOURCE: National Grid ESO
UK offshore wind network development models
Current approach Integrated approach
2.5GW
7GW
3.5GW
3.1GW
8.07GW
0.3GW
GreatBritain
2.5GW
0.3GW
8.07GW
3.1GW
3.5GW
7GW
GreatBritain
Planning and permitting processes for T&D networks should also be reformed to support rapid development while addressing legitimate local concerns and political opposition. These will need to involve:
• Long-term planning which identifies needs far in advance;
• Designation of some projects as national infrastructure priorities, with special regulatory regimes to support rapid implementation;
• “One stop shop” approval processes which ensure coordination across multiple layers of government and multiple regulators.
Political support, explaining the need for T&D development to make emissions reductions possible, is also vital.
Developing supply chains to support rapid investment growthAdequately fast investment in clean power generation and networks will require the development of extensive supply chains, including key materials and capabilities:
• Expanded solar PV and wind turbine production, which requires glass and electronic components for solar panels, and steel, rare-earth magnets, and precision ball-bearings for wind turbines;
• Large scale solar and wind installation capacity (both onshore and offshore), creating demand for specific sub-contractor capabilities and skills;
• Rapid growth in battery production from around 100 GWh per annum today to over 5,000 GWh per annum by 2035, with proportional increases in key mineral supplly41;
• Equally large growth in hydrogen electrolyser production, potentially growing from 1 GW of capacity per annum today to above 400 GW by 2040.42
41 SYSTEMIQanalysisfortheEnergyTransitionsCommission(2021)
42 ETC (2021), Making the Hydrogen Economy Possible: Accelerating clean hydrogen in an electrified economy
Exhi
bit Q
Making Clean Electrification Possible – 30 Years to Electrify the Global Economy28
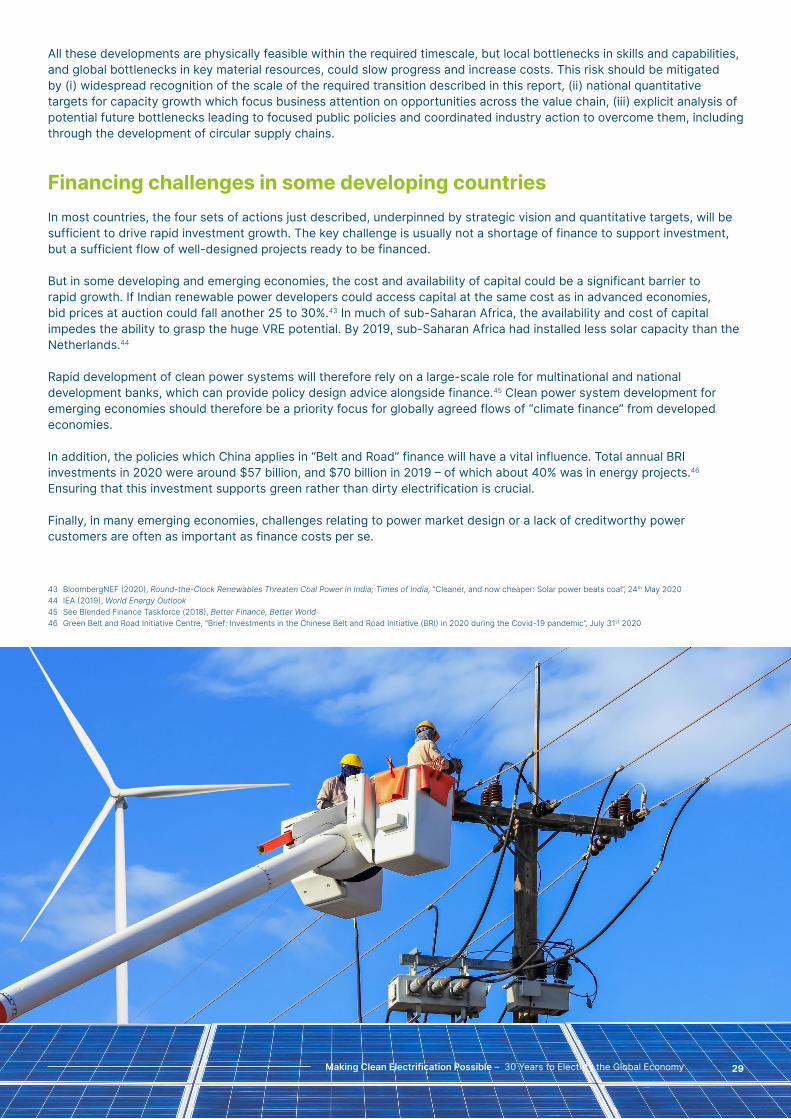
All these developments are physically feasible within the required timescale, but local bottlenecks in skills and capabilities, and global bottlenecks in key material resources, could slow progress and increase costs. This risk should be mitigated by (i) widespread recognition of the scale of the required transition described in this report, (ii) national quantitative targets for capacity growth which focus business attention on opportunities across the value chain, (iii) explicit analysis of potential future bottlenecks leading to focused public policies and coordinated industry action to overcome them, including through the development of circular supply chains.
Financing challenges in some developing countriesIn most countries, the four sets of actions just described, underpinned by strategic vision and quantitative targets, will be sufficient to drive rapid investment growth. The key challenge is usually not a shortage of finance to support investment, but a sufficient flow of well-designed projects ready to be financed.
But in some developing and emerging economies, the cost and availability of capital could be a significant barrier to rapid growth. If Indian renewable power developers could access capital at the same cost as in advanced economies, bid prices at auction could fall another 25 to 30%.43 In much of sub-Saharan Africa, the availability and cost of capital impedes the ability to grasp the huge VRE potential. By 2019, sub-Saharan Africa had installed less solar capacity than the Netherlands.44
Rapid development of clean power systems will therefore rely on a large-scale role for multinational and national development banks, which can provide policy design advice alongside finance.45 Clean power system development for emerging economies should therefore be a priority focus for globally agreed flows of “climate finance” from developed economies.
In addition, the policies which China applies in “Belt and Road” finance will have a vital influence. Total annual BRI investments in 2020 were around $57 billion, and $70 billion in 2019 – of which about 40% was in energy projects.46 Ensuring that this investment supports green rather than dirty electrification is crucial.
Finally, in many emerging economies, challenges relating to power market design or a lack of creditworthy power customers are often as important as finance costs per se.
43 BloombergNEF(2020),Round-the-Clock Renewables Threaten Coal Power in India;Times of India, “Cleaner,andnowcheaper:Solarpowerbeatscoal”,24thMay202044 IEA(2019),World Energy Outlook 45 SeeBlendedFinanceTaskforce(2018),Better Finance, Better World46 GreenBeltandRoadInitiativeCentre,“Brief:InvestmentsintheChineseBeltandRoadInitiative(BRI)in2020duringtheCovid-19pandemic”,July31st2020
29Making Clean Electrification Possible – 30 Years to Electrify the Global Economy
Required actions in the 2020s
Clean electrification must be at the core of all strategies to achieve a zero-carbon economy by mid-century, and it is undoubtedly possible for countries to meet the objectives proposed in this report, with:
• Developed countries reaching close to complete decarbonisation of electricity supply (<30gCO2/kWh) by 2035 while growing electricity use 2-2.5 times by 2050;
• Emerging economies meeting all growth in electricity supply from zero-carbon sources, with close to complete decarbonisation of electricity supply around the mid-2040s, and electricity use rising 5-6 times by 2050;
• Low-income countries building zero-carbon power systems which can support a 10 times increase in electricity use.
However, these feasible objectives will only be met if countries take strong action in the 2020s, setting out both what needs to be achieved by 2030 and how they will achieve it. Specific objectives by 2030 must reflect national circumstances, but the Infographic sets out key categories and general principles to ensure:
• Sufficiently rapid progress on electrification to make the mid-century targets feasible – e.g. making sure that close to 100% of auto sales are electric by 2030 in developed countries;
• Major deployment of wind and solar, to reach around 40% of global generation in 2030, up from 10% today;
• Major progress towards phasing out fossil fuels in power generation, with grid emissions intensities rapidly declining.
Policies to achieve these objectives will also vary by country, but common elements must include:
1. Clear medium-term targets (e.g. quantitative targets for renewables, future bans on ICE sales) embedded in a strategic vision for economy decarbonisation, including an economy-wide carbon price;
2. Incentives for renewables deployment at scale, in particular through appropriate power market design (e.g. continued use of long-term electricity auctions to drive rapid growth of renewable capacity);
3. Building the infrastructure (e.g. T&D grids, EV charging) and capabilities (e.g. from system operators) required for mass electrification and power system decarbonisation;
4. An integrated power system vision, with appropriate planning and permitting to speed up implementation;
5. Unlocking financial flows, especially for developing countries;
6. Developing the technologies and business models of the future, including focused subsidy support for the key technologies which will be required to support further progress beyond 2030. This includes technologies to support power system balancing for high VRE penetration (e.g. hydrogen electrolysis and storage), technologies to drive improved energy efficiency (e.g. more efficient heat pumps/AC), technologies to support wider direct electrification (e.g. next generation batteries).
C
M
Y
CM
MY
CY
CMY
K
Power Info1-2_OUTLINED_print.pdf 2 23/04/2021 15:38
Making Clean Electrification Possible – 30 Years to Electrify the Global Economy30
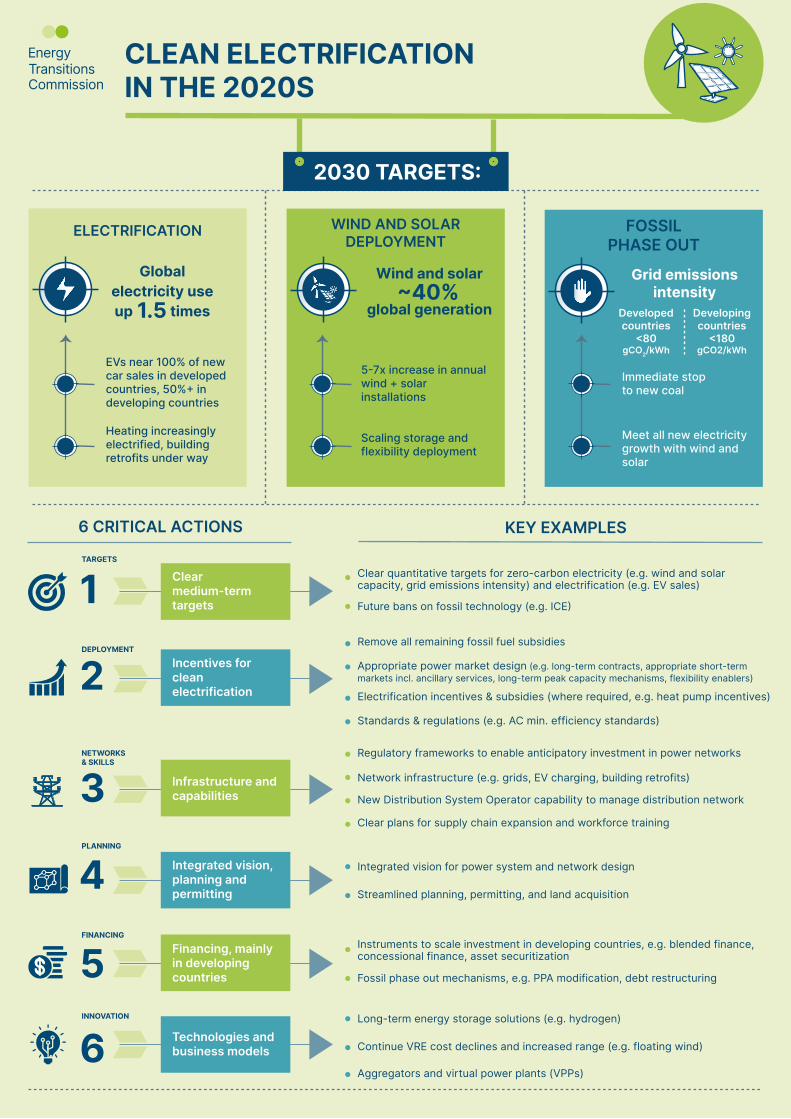
C
M
Y
CM
MY
CY
CMY
K
Power Info1-2_OUTLINED_print.pdf 2 23/04/2021 15:38
Glossary
Abatement cost: The cost of reducing CO2 emissions, usually expressed in US$ per tonne of CO2.
Aggregators: New market players that can bundle the energy consumption or generation of several consumer-level electricity market actors (i.e. Distributed Energy Resources) to engage as a single entity – a virtual power plant (VPP) – and sell this flexibility (i.e. ‘avoided’ electricity consumption through temporary reduction in electricity consumption when there is high demand for electricity) or electricity (e.g. from behind-the-meter storage or distributed generation) in power or ancillary service markets.
Autothermal Reforming (ATR): A catalytic process in which natural gas reacts with oxygen to produce hydrogen and CO2.
BECCS: A technology that combines bioenergy with carbon capture and storage to produce energy and net negative greenhouse gas emissions, i.e., removal of carbon dioxide from the atmosphere.
Behind-the-meter: A generation or storage system (e.g., rooftop solar PV, home batteries) which produces power on site at a commercial, residential, or industrial site, behind the utility meter.
BEV: Battery-electric vehicle.
Biomass or bio-feedstock: Organic matter, i.e. biological material, available on a renewable basis. Includes feedstock derived from animals or plants, such as wood and agricultural crops, organic waste from municipal and industrial sources, or algae.
Bioenergy: Renewable energy derived from biological sources, in the form of solid biomass, biogas or biofuels.
Capital expenditure (CAPEX): Monetary investments into physical assets (e.g., equipment, plants).
Carbon capture and storage or use (CCS/U): We use the term “carbon capture” to refer to the process of capturing CO2 on the back of energy and industrial processes. Unless specified otherwise, we do not include direct air capture (DAC) when using this term. The term “carbon capture and storage” refers to the combination of carbon capture with underground carbon storage; while “carbon capture and use” refers to the use of carbon in carbon-based products in which CO2 is sequestered over the long term (e.g., in concrete, aggregates, carbon fibre). Carbon-based products that only delay emissions in the short term (e.g., synfuels) are excluded when using this terminology.
Carbon emissions / CO2 emissions: We use these terms interchangeably to describe anthropogenic emissions of carbon dioxide in the atmosphere.
Carbon offsets: Reductions in emissions of carbon dioxide (CO2) or greenhouse gases made by a company, sector or economy to compensate for emissions made elsewhere in the economy.
Carbon price: A government-imposed pricing mechanism, the two main types being either a tax on products and services based on their carbon intensity, or a quota system setting a cap on permissible emissions in the country or region and allowing companies to trade the right to emit carbon (i.e. as allowances). This should be distinguished from some companies’ use of what are sometimes called “internal” or “shadow” carbon prices, which are not prices or levies, but individual project screening values.
Circular economy models: Economic models that ensure the recirculation of resources and materials in the economy, by recycling a larger share of materials, reducing waste in production, light-weighting products and structures, extending the lifetimes of products, and deploying new business models based around sharing of cars, buildings, and more.
Combined cycle gas turbine (CCGT): An assembly of heat engines that work in tandem from the same source of heat to convert it into mechanical energy driving electric generators. Newer CCGT models can be compatible with a retrofitting process to enable the plant to switch from burning methane to burning hydrogen for power generation.
Contract for difference (CfD): A contract between a buyer and seller that stipulates that the buyer must pay the seller the difference between the current value of an asset (spot price) and a pre-determined fixed contract value (strike price). Where public actors act as the buyer this model can be used to cover the cost premium faced by green commodity producers deploying low-carbon technologies that are higher cost than traditional fossil technology. For example, CfDs have been used in the offshore wind industry where generators are reimbursed the difference between the fluctuating wholesale electricity prices and a fixed strike price, typically determined via a public auction. Under a ‘two-way’ CfD design, where the spot price rises above the strike price the winning bidder must pay back the differential.
Distributed Energy Resource (DER): Small and medium-sized power resources connected to the distribution network,
including storage, distributed generation, demand response, EVs and their charging equipment.
Distribution System Operator (DSO): Emerging system operator capability to manage and optimise the transport of electrical power through the fixed infrastructure of a local distribution network. This includes procuring flexibility services from network users, managing local generation and network congestion, and managing flows of energy from and to the wider electricity grid, coordinating with the Transmission System Operator (TSO).
Decarbonisation solutions: We use the term “decarbonisation solutions” to describe technologies or business models that reduce anthropogenic carbon emissions by unit of product or service delivered though energy productivity improvement, fuel/feedstock switch, process change or carbon capture. This does not necessarily entail a complete elimination of CO2 use, since (i) fossil fuels might still be used combined with CCS/U, (ii) the use of biomass or synthetic fuels can result in the release of CO2, which would have been previously sequestered from the atmosphere though biomass growth or direct air capture, and (iii) CO2 might still be embedded in the materials (eg, in plastics).
Direct air capture (DAC): The extraction of carbon dioxide from atmospheric air.
Direct reduced iron (DRI): Iron (so called “sponge iron”) produced from iron ore utilising either natural gas or hydrogen. This DRI is then converted to steel in a second step called electric arc furnace (EAF). The DRI-EAF is an alternative primary steel production process enabling decarbonisation of the traditional coke-fired blast furnace/basic oxygen furnace (BF-BOF).
Electrolysis: A technique that uses electric current to drive an otherwise non-spontaneous chemical reaction. One form of electrolysis is the process that decomposes water into hydrogen and oxygen, taking place in an electrolyser and producing “green hydrogen”. It can be zero-carbon if the electricity used is zero-carbon.
Embedded carbon emissions: Lifecycle carbon emissions from a product, including carbon emissions from the materials input production and manufacturing process.
Emissions from the energy and industrial system: All emissions arising either from the use of energy or from chemical reactions in industrial processes across the energy, industry, transport and buildings sectors. It excludes emissions from the agriculture sector and from land use changes.
Making Clean Electrification Possible – 30 Years to Electrify the Global Economy32
Emissions from land use: All emissions arising from land use change, in particular deforestation, and from the management of forest, cropland and grazing land. The global land use system is currently emitting CO2 as well as other greenhouse gases, but may in the future absorb more CO2 than it emits.
Energy productivity: Energy use per unit of GDP.
Final energy consumption: All energy supplied to the final consumer for all energy uses.
Fuel cell electric vehicle (FCEV): Electric vehicle using a fuel cell generating electricity to power the motor, generally using oxygen from the air and compressed hydrogen.
Greenhouse gases (GHGs): Gases that trap heat in the atmosphere. Global GHG emission contributions by gas – CO2 (76%), methane (16%), nitrous oxide (6%) and fluorinated gases (2%).
Heavy Goods Vehicles (HGV) or Heavy Duty Vehicle (HDV): Both terms are used interchangeably and refer to trucks ranging from 3.5 tonnes to over 50 tonnes.
High Voltage Direct Current (HVDC) transmission: A power transmission technology utilising direct current for the bulk transmission of electrical power. It is particularly useful for high capacities and longer distances due to minimal energy transmission losses compared to classical AC technology.
Hydrocarbons: An organic chemical compound composed exclusively of hydrogen and carbon atoms. Hydrocarbons are naturally occurring compounds and form the basis of crude oil, natural gas, coal and other important energy sources.
Internal combustion engine (ICE): A traditional engine, powered by gasoline, diesel, biofuels or natural gas. It is also possible to burn ammonia or hydrogen in an ICE.
Learning rate: The learning rate describes the cost decline for one unit (e.g., electrolyser) for each doubling of the total cumulative number of previously produced units.
Levelised cost of electricity (LCOE): A measure of the average net present cost of electricity generation for a generating plant over its lifetime. The LCOE is calculated as the ratio between all the discounted costs over the lifetime of an electricity-generating plant divided by a discounted sum of the actual energy amounts delivered.
Liquified Natural Gas (LNG): LNG is the clear and non-toxic liquid state of natural gas at temperatures below -162ºC. It enables the transport and storage of natural gas without pressurisation, especially over longer distances via ships.
Natural carbon sinks: Natural reservoirs storing more CO2 than they emit. Forests, plants, soils and oceans are natural carbon sinks.
Nature-based solutions: Actions to protect, sustainably manage and restore natural or modified ecosystems which constitute natural carbon sinks, while simultaneously providing human, societal and biodiversity benefits.
Near-total-variable-renewable power system: We use this term to refer to a power system where 85-90% of power supply is provided by variable renewable energies (solar and wind), while 10-15% is provided by dispatchable/peaking capacity, which can be hydro, biomass plants or fossil fuels plants (combined with carbon capture to reach a zero-carbon power system).
Net-zero-carbon-emissions / Net-zero-carbon / Net-zero: We use these terms interchangeably to describe the situation in which the energy and industrial system as a whole or a specific economic sector releases no CO2 emissions – either because it doesn’t produce any or because it captures the CO2 it produces to use or store. In this situation, the use of offsets from other sectors (“real net-zero”) should be extremely limited and used only to compensate for residual emissions from imperfect levels of carbon capture, unavoidable end-of-life emissions, or remaining emissions from the agriculture sector.
Operating Expenditures (OPEX): Expenses incurred through normal business operations to ensure the day-to-day functioning of a business (e.g., labour costs, administrative expenses, utilities).
Partial Oxidation (POX): A non-catalytic chemical process to convert hydrocarbon residues or natural gas with oxygen to hydrogen and carbon dioxide.
Power Purchase Agreement (PPA): A PPA describes the contractual obligations between an electricity generator and buyer. Typically, these contracts are used to guarantee long-term offtake security for the supplier prior to the construction of a new generation asset.
Proton Exchange or Polymer Electrolyte Membrane (PEM) electrolyser: A specific water electrolysis technology which operates under acidic conditions using a polymer to separate the electrodes.
Primary energy consumption: Crude energy directly used at the source or supplied to users without transformation – that is, energy that has not been subjected to a conversion or transformation process.
Steam methane reforming (SMR): A process in which methane from natural gas is heated and reacts with steam to produce hydrogen.
SMR/ATR/POX with carbon capture and storage (SMR/ATR/POX + CCS): Hydrogen production from SMR/ATR/POX, where the carbon emitted from the combustion of natural gas is captured to be stored.
Sustainable biomass / bio-feedstock / bioenergy: In this report, the term ‘sustainable biomass’ is used to describe biomass that is produced without triggering any destructive land use change (in particular deforestation), is grown and harvested in a way that is mindful of ecological considerations (such as biodiversity and soil health), and has a lifecycle carbon footprint at least 50% lower than the fossil fuels alternative (considering the opportunity cost of the land, as well as the timing of carbon sequestration and carbon release specific to each form of bio-feedstock and use).
Synfuels: Hydrocarbon liquid fuels produced from hydrogen, carbon dioxide and electricity. They can be zero-carbon if the electricity input is zero-carbon and the CO2 is from direct air capture. Also known as “synthetic fuels”, “power-to-fuels” or “electro-fuels”.
Technology Readiness Level (TRL): Describes the level of matureness a certain technology has reached from initial idea to large-scale, stable commercial operation. The IEA reference scale is used.
Transmission System Operator: Existing system operator capability responsible for managing flow of electricity through the electricity transmission system, ensuring its stable and secure operation and matching demand and supply in time and space.
Virtual Power Plants (VPP): Aggregation of many disperse Distributed Energy Resources (DERs) with the aim of enabling DERs to provide services to the grid. VPP operators aggregate DERs to behave similar to a conventional power plant, with features such as minimum / maximum capacity, ramp-up, ramp-down, etc. and to participate in markets to sell electricity or ancillary services.
Zero-carbon energy sources: Term used to refer to renewables (including solar, wind, hydro, geothermal energy), sustainable biomass, nuclear and fossil fuels if and when their use can be decarbonised through carbon capture.
Making Clean Electrification Possible – 30 Years to Electrify the Global Economy 33
Photograph on opposite page by chuttersnap
Acknowledgements
The team would also like to thank the ETC members and experts for their active participation:Rajit Nanda (ACWA Power); Elke Pfeiffer (Allianz); Javier Bonaplata, Nicola Davidson (ArcelorMittal); Abyd Karmali (Bank of America); Ian Luciani, William Zimmern (BP); Jeanne Ng (CLP); Cameron Butler, Rob Kelly, Wei Sue (Climateworks Australia); Dana Barsky (Credit Suisse); Bin Lyu (Development Research Center of the State Council); Rebecca Heaton, Richard Gow (DRAX); Adil Hanif (EBRD); Rebecca Collyer, Pete Harrison, Phillip Niessen (European Climate Foundation); Patrick Curran (Grantham Institute, London School of Economics); Matt Gorman (Heathrow Airport); Andrea Griffin (HSBC); Francisco Laveron Simavilla, Angel Landa Ugarte, Juan Rivier Abbad (Iberdrola); Chris Dodwell (Impax Asset Management); Ben Murphy (IP Group), Christopher Kaminker (Lombard Odier); (LONGi Solar); James Smith-Dingler, Elizabeth Watson (Modern Energy); Matt Hinde, Terry McCormick, Nick Saunders, Nicholas Young, Joseph Northwood, Tracey Walker, Mayoma Onwochei (National Grid); Jakob Askou Bøss, Anders Holst Nymark, Øyvind Vessia (Ørsted); Aditi Garg (ReNew Power); Xavier Chalbot, Jonathan Grant (Rio Tinto); Mallika Ishwaran, Charlotte Brookes (Royal Dutch Shell); Emmanuel Normant (Saint Gobain); Sandrine de Guio, Emmanuel Laguarrigue, Vincent Minier, Vincent Petit (Schneider Electric); Brian Dean (SE4All); Camilla Palladino, Xavier Lorenzo Rousseau (SNAM); Jesper Kansbod, Martin Pei (SSAB); Alistair McGirr, William Steggals, Matthew Pringle, Angus MacRae, Pavel Miller (SSE); Jan Braten, Kristian Marstrand Pladsen (Statnett); Brian Dean (Sustainable Energy For All); Abhishek Goyal (Tata Group); Madhulika Sharma (Tata Steel); Reid Detchon (United Nations Foundation); Mikael Nordlander (Vattenfall); Johan Engebratt and Niklas Gustafsson (Volvo Group); Rasmus Valanko (We Mean Business); Jennifer Layke, Asger Garnak, Karl Hausker (World Resources Institute), Paul Ebert, Phil O’Neill, Geeta Thakoral (Worley)
The team would also like to thank the ETC’s broader network of experts for their input: Alex Campbell (International Hydropower Association), David Nelson, Udetanshu (CPI); Paul Graham (CSIRO); Kash Burchett; Ben Dixon, Catharina Dyvik, Iman Effendi; Rafal Malinowski; Sanna O’Connor-Morberg, Guido Schmidt-Traub, Sophie Slot, Katherine Stodulka; Julia Turner (SYSTEMIQ); Mike Thompson, Owen Bellamy, David Joffe, Mike Hensley, Chloe Nemo (UK Climate Change Committee); Dolf Gielen, Francisco Boshell, Asami Miketa, Elena Ocenic, Arina Anisie, (IRENA); Karl Zammit-Maempel (Climate Champions); Constant Alarcon (C40); Chris Radojewski (Powering Past Coal Alliance)
The team that developed this report comprised: Lord Adair Turner (Chair), Faustine Delasalle (Director), Ita Kettleborough (Deputy-Director), Elena Pravettoni (Lead author), Mark Meldrum, Laetitia de Villepin, Meera Atreya, Alasdair Graham, Alex Hall, Lloyd Pinnell, Tommaso Mazzanti, Hettie Morrison, Aparajit Pandey, Francisco Pereira, Caroline Randle, Andreas Wagner (SYSTEMIQ).
This report builds on analyses developed by our knowledge partners, whom we would like to thank again for the quality of their inputs: Albert Cheung, Logan Goldie-Scot, Seb Henbest, Benjamin Kafri, Tifenn Brandilly, Sanjeet Sanghera, Nikolas Soulopoulos, Emma Champion, Tara Narayanan, Brianna Lazerwitz (BloombergNEF); David Nelson, Felicity Carus and Brendan Pierpont (Climate Policy Initiative); Per Klevnäs, Anders Ahlen and Cornelia Jonsson (Material Economics); Arnout de Pee, Eveline Speelman, Hamilton Boggs, Cynthia Shih and Maaike Witteveen (McKinsey & Company); Elizabeth Hartman, Ji Chen, Yiyan Cao, Caroline Zhu, Bingqi Liu, Uday Varadarajan, Koben Calhoun (Rocky Mountain Institute); Thomas Spencer, Neshwin Nigel Rodrigues, Raghav Pachouri, G Renjith, A K Saxena (The Energy and Resources Institute).
Making Clean Electrification Possible – 30 Years to Electrify the Global Economy34
35Making Clean Electrification Possible – 30 Years to Electrify the Global Economy
Making Clean Electrification Possible:
Version 1.1
April 2021
30 Years to Electrify the Global Economy
The Making Mission Possible Series
Executive Summary