Maize prices in South Africa: Can the producer increase...
24
Maize prices in South Africa: Can the producer increase his revenue by marketing grain through cattle? By Maré, F.A.; Nell, W.T.; & Willemse, B.J. Contributed Paper presented at the Joint 3 rd African Association of Agricultural Economists (AAAE) and 48 th Agricultural Economists Association of South Africa (AEASA) Conference, Cape Town, South Africa, September 19-23, 2010.
-
Upload
duongthien -
Category
Documents
-
view
216 -
download
0
Transcript of Maize prices in South Africa: Can the producer increase...
Maize prices in South Africa: Can the producer increase his revenue by
marketing grain through cattle?
By
Maré, F.A.; Nell, W.T.; & Willemse, B.J.
Contributed Paper presented at the Joint 3rd African Association of Agricultural
Economists (AAAE) and 48th Agricultural Economists Association of South Africa
(AEASA) Conference, Cape Town, South Africa, September 19-23, 2010.

0
Maize prices in South Africa: Can the producer increase his revenue by marketing grain through cattle?
F. A. Maré 1, W. T. Nell2 & B. J. Willemse3
Submitted as a contributed paper at the AEASA Conference 2010
Cape Town, South Africa
Corresponding author:
Frikkie A. Maré
Department of Agricultural Economics
University of the Free State
P.O. Box 339
BLOEMFONTEIN 9300
South Africa
E‐mail: [email protected]
Tel: +27 51 401 2696
Fax: +27 51 401 2696
1 Post‐graduate student and junior lecturer, Department of Agricultural Economics, University of the Free State, South Africa 2Senior lecturer, Division: Agricultural Management, Department of Agricultural Economics, University of the Free State, South Africa 3 Departmental chairperson and senior lecturer, Department of Agricultural Economics, University of the Free State, South Africa
1
Maize prices in South Africa: Can the producer increase his revenue by marketing grain through cattle?
Abstract
Since the decline in the price of maize from the beginning of 2010, meat has become the new buzzword
under maize producers as they are desperately looking for alternatives to increase the value of their
crops. It seems as if the price of maize may stay low at levels equal to export parity prices for the next
year or two due to very large yields and an increasing level of ending stocks each year. On the other
hand, there is the meat sector which is doing extremely well and had even shown positive growth during
the worldwide financial crisis. A substantial decrease in the price of beef therefore seems unlikely and
makes it a very attractive alternative market for maize. The question, however, is whether the value of
maize can be increased by marketing it through beef, and what factors influence the profitability of this
marketing alternative. A model simulating different scenarios with regards to the physical and financial
information of a feedlot indicates that in the most cases a feedlot will have a positive margin and thus
increases the value of the maize that is fed. The factors that were found to affect the margin the most in
a negatively correlated relation, are the weaner price, maize price, feed conversion ratio, mortality rate
and feed concentrate price, while those affecting the margin in a positively correlated way are the
carcass price, slaughter percentage and average daily gain.
1. Introduction
Since the maize price in South Africa started to decline at the beginning of 2010 as a result of a near
record crop, maize producers realised that they were facing problems to cover input costs. The reasons
for the significant and relative fast decline in maize prices will be discussed at a later stage. This situation
leads to a scenario where the producers of maize are looking for alternative marketing methods in order
to add value and obtain higher prices for their products. Although there are alternative marketing
options available to producers that can be used to obtain a higher price for their crops, the success of
these options is difficult to determine.
One of these options, for example, is an export pool that Grain SA wants to administer to isolate
approximately 3 million ton of maize for the export market, to move the price on the domestic usage
part of the crop towards a higher price level than export price level (Laubscher, 2010). Although the
export of this maize may influence the price of the next crop, the transaction will take place at the
current maize price and producers, with a low yield per hectare, may have to sell their crops at prices
that will barely cover production costs. Van Rooyen (2010) suggested that the issue regarding low maize
prices in South Africa may change if local markets can be developed for the local maize and oilseed
production. One of these markets is the bio‐fuel market which will not only use the oversupply of maize,
2
but will contribute significantly to the fuel needs of the country. Bio‐fuel production will also supply the
markets with useful by‐products such as DDGS, which can be used as a protein feed for livestock, and
CO2 gas. Although the bio‐fuel concept in South Africa looks very appetising, taking in mind the almost
105 000 work opportunities it will create, the Government had decided that maize may not be used for
ethanol production due to the fact that it is a staple food (Van Rooyen, 2010).
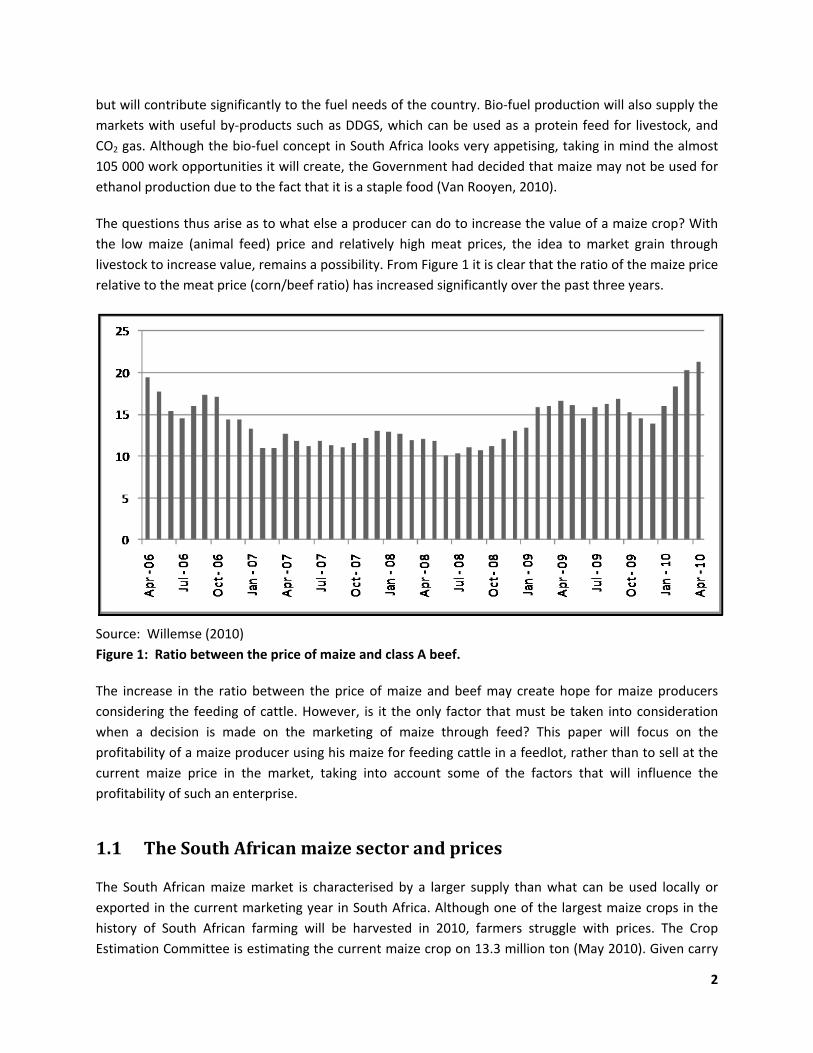
The questions thus arise as to what else a producer can do to increase the value of a maize crop? With
the low maize (animal feed) price and relatively high meat prices, the idea to market grain through
livestock to increase value, remains a possibility. From Figure 1 it is clear that the ratio of the maize price
relative to the meat price (corn/beef ratio) has increased significantly over the past three years.
Source: Willemse (2010)
Figure 1: Ratio between the price of maize and class A beef.
The increase in the ratio between the price of maize and beef may create hope for maize producers
considering the feeding of cattle. However, is it the only factor that must be taken into consideration
when a decision is made on the marketing of maize through feed? This paper will focus on the
profitability of a maize producer using his maize for feeding cattle in a feedlot, rather than to sell at the
current maize price in the market, taking into account some of the factors that will influence the
profitability of such an enterprise.
1.1 The South African maize sector and prices
The South African maize market is characterised by a larger supply than what can be used locally or
exported in the current marketing year in South Africa. Although one of the largest maize crops in the
history of South African farming will be harvested in 2010, farmers struggle with prices. The Crop
Estimation Committee is estimating the current maize crop on 13.3 million ton (May 2010). Given carry

3
over stock from the previous season and domestic usage of 10 million ton, a surplus above domestic
usage of 5 million ton is available. Domestic export capacity is estimated at a maximum of 2.5 million
ton per year. The strengthening value of the rand against the US dollar also adds to a lower export price
that producers are receiving (CEC, 2010). High production costs during the planting season will make it
almost impossible for farmers with low yields per hectare to realise any profits (Willemse, 2010).
To understand the current scenario, it is necessary to look at more specific figures regarding maize
production and price as well as the exchange rate. As indicated, and from Figure 2, it is evident that the
R/$ exchange rate strengthened significantly and have reached levels of around R7,50/$, following a
steady rate of strengthening from the peak of R11,55/$ in October 2008. The strengthening of the Rand
was caused by the financial crisis, with its origin in the US financial sector, which resulted in a
realignment of exchange rates in most countries. With the current uncertainty about sovereign defaults,
starting with Greece and impacting on the European economies and currencies, the outlook for further
currency realignments will result in further maize price volatility in South Africa.
Source: JSE (2010)
Figure 2: R/$ exchange rate for 2008 ‐ 2010.
The demand and supply for maize in South Africa from 2006/07 to 2008/09 in realised figures and
2009/10 to 2010/11 as estimations are presented in Table 1. With a carry over stock of almost 1.13
million ton from the 2008/09 season and an estimated yield of 13.1 million ton, and yellow maize
imports of 27 000 ton for the 2009/10 season, there are a total commercial supply of almost 14.7 million
ton available. The increase of 1.7 million ton in supply is larger than the 200 000 ton increase in
domestic demand, and ending stocks will thus close with 1.5 million ton more this year (April 2010). The
estimate for the 2010/11 marketing year suggests that the trend of very good yields may continue and a
further built‐up in carry over stock may take place (taking exports into account).
4
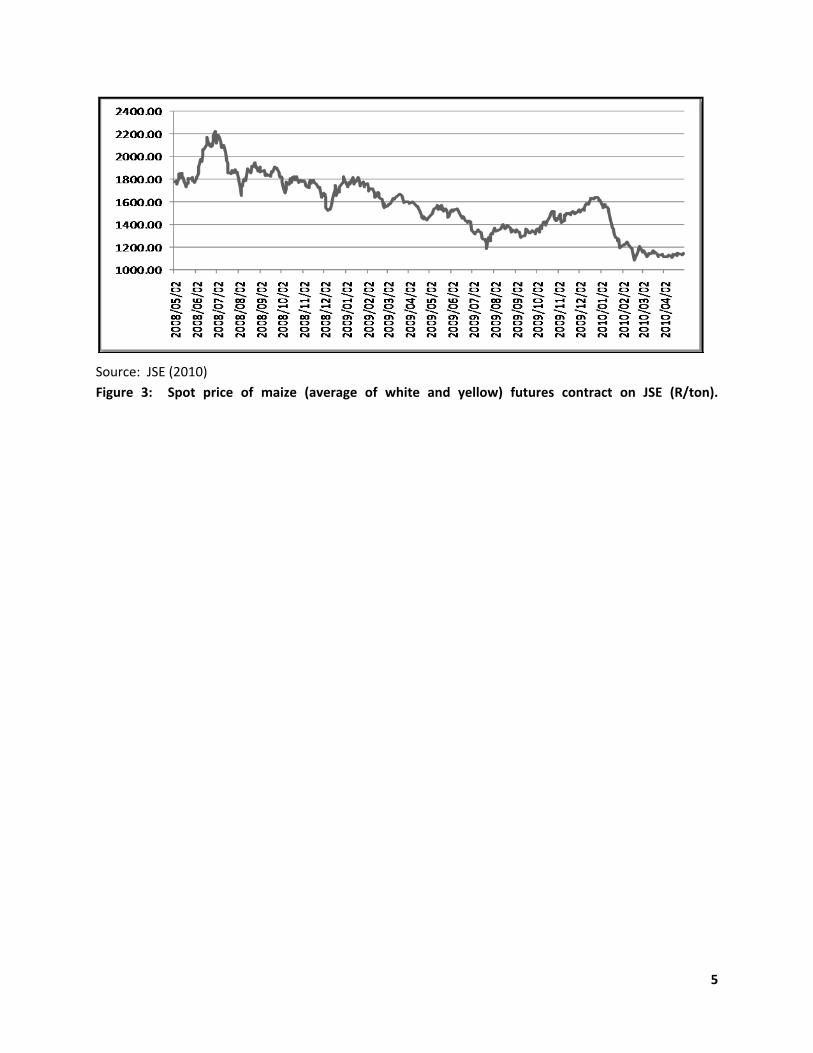
Since the first crop estimate in 2010, the market realised that a large crop was on hand and the price of
maize to be dropped significantly from levels of about R1 650 per ton to R1 100 per ton in about six
weeks. Figure 3 shows the maize spot price of maize futures contracts on the JSE and indicates that the
price of maize in general has stabilised at just above R1 000 per ton, which is equal to export parity price
(Randfontein basis).
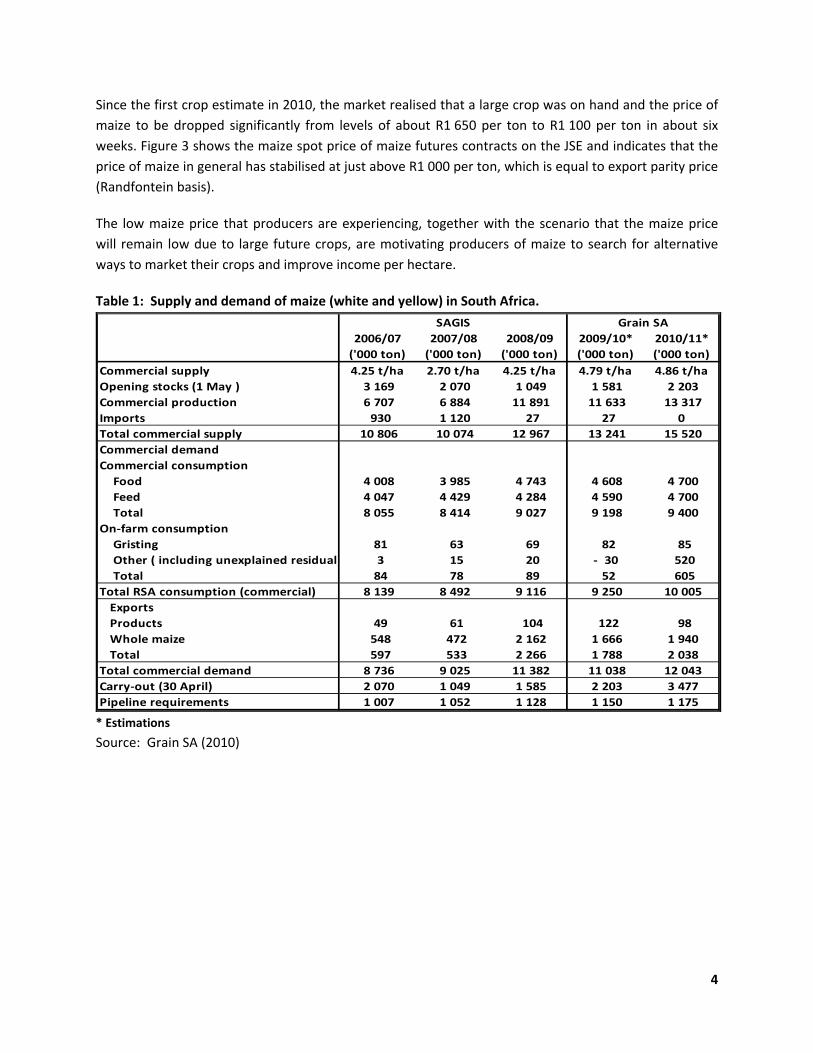
The low maize price that producers are experiencing, together with the scenario that the maize price
will remain low due to large future crops, are motivating producers of maize to search for alternative
ways to market their crops and improve income per hectare.
Table 1: Supply and demand of maize (white and yellow) in South Africa.
2006/07 2007/08 2008/09 2009/10* 2010/11*
('000 ton) ('000 ton) ('000 ton) ('000 ton) ('000 ton)
Commercial supply 4.25 t/ha 2.70 t/ha 4.25 t/ha 4.79 t/ha 4.86 t/ha
Opening stocks (1 May ) 3 169 2 070 1 049 1 581 2 203
Commercial production 6 707 6 884 11 891 11 633 13 317
Imports 930 1 120 27 27 0
Total commercial supply 10 806 10 074 12 967 13 241 15 520
Commercial demand
Commercial consumption
Food 4 008 3 985 4 743 4 608 4 700
Feed 4 047 4 429 4 284 4 590 4 700
Total 8 055 8 414 9 027 9 198 9 400
On‐farm consumption
Gristing 81 63 69 82 85
Other ( including unexplained residual) 3 15 20 ‐ 30 520
Total 84 78 89 52 605
Total RSA consumption (commercial) 8 139 8 492 9 116 9 250 10 005
Exports
Products 49 61 104 122 98
Whole maize 548 472 2 162 1 666 1 940
Total 597 533 2 266 1 788 2 038
Total commercial demand 8 736 9 025 11 382 11 038 12 043
Carry‐out (30 April) 2 070 1 049 1 585 2 203 3 477
Pipeline requirements 1 007 1 052 1 128 1 150 1 175
SAGIS Grain SA
* Estimations
Source: Grain SA (2010)
5
Source: JSE (2010)
Figure 3: Spot price of maize (average of white and yellow) futures contract on JSE (R/ton).

6
1.2 The South African beef sector and prices
The gross value of South African agricultural production was calculated on R124 463 million in
2008/2009 (DAFF, 2009). Animal products, field crops and horticulture products respectively contributed
48.2%, 26.7% and 25.1% to the above mentioned figure. Taking a look at industries it can be seen that
the poultry industry made the largest contribution with 16.7%, while cattle and weaners slaughtered
contributed 10.6%. Although the contribution of slaughtered beef seems to be low, it must be kept in
mind that this sector is solely responsible for more than a tenth of the total gross value of agricultural
production. The gross income for the three major agricultural products is presented in Figure 4.
Although red meat had lost its first place to poultry from 2007/2008 to 2008/2009, it still is the second
largest contributor, with maize in the third place. Red meat production is thus a large sector in the South
African agricultural context, and its value is still increasing over time.
Source: DAFF (2009)
Figure 4: Gross income from major agricultural products.
The market and price outlook for beef in South African agriculture seems to be quite good. The Bureau
for Food and Agricultural Policy (2009) indicates in its baseline that the prices for all meat types will
increase over the next five years (Figure 5). Despite the economic recession during 2008/09, the price of
meat has increase between 8% and 15% in 2008. The price of mutton is expected to steadily increase
over the next five years, while the price for beef, pork and chicken may follow a cyclical upward trend
influenced by feed prices. The effect of the 2010 Soccer World Cup on meat demand may not be big and
an increase in demand of only 2 636 ton is expected. This can lead to an increase in prices only for a
short period and may not influence the average prices for 2010. It is expected that the total production

7
of meat could increase with 8% over the next five years, while demand could increase with 11%, leaving
South Africa as a net importer of meat.
Source: BFAP (2009)
Figure 5: South African meat prices.
The production of beef remained fairly constant over the period 2008‐2009 (Figure 6) on the back of
high feed costs. Lower feed prices in 2009 and 2010 are expected to simulate production from 2010
onwards. The expected softening of beef demand during 2008/09, with the economic downturn, has not
materialised. However, the restaurant and take‐away industries have been negatively affected by the
tendency of consumers to buy fresh meat for home entertainment. As the economy recovers, beef
consumption is projected to grow at a moderate rate due to projected growth in personal disposable
income of the South African population. The gap between beef and weaner prices is expected to widen
due to possible higher feed costs in the future. This may result in a decline of profit for the farmer who
sells his calves as weaners to the feedlot industry.

8
Source: BFAP (2009)
Figure 6: Beef production, consumption and price.
According to the demand, supply and price of beef it seems as if the beef industry will continue on a
positive trend for the producers of beef in South Africa. One of the reasons for the positive future of this
commodity is the fact that the price of beef continued to increase even through the economic recession.
2. Previous research on feedlot profitability
The feeding of maize cattle became a practice after World War II when feedlots started using the post‐
war oversupply of grain for cattle feed (McCluskey, Wahl, Li & Wandschneider, 2005). Feedlots worked
on the principle to buy weaned calves and feed them with a ration containing energy, protein, roughage
minerals, vitamins, antibiotics and hormones, which resulted in the highest possible weight increase
during the shortest possible period of time. The objective is to resell the weaners when they have
reached their targeted slaughtering weight. The slaughtering weight of the animal can differ according
to the market requirements for the acceptable live weight and fat content (DAER, 2010).
In previous studies done to determine the factors that influence feedlot profitability and risk, actual data
from various feedlots were used to perform econometric analysis (Small, Mark & Klopfenstein, 2010;
Mark, Schroeder & Jones, 2000; Langemeier, Schroeder & Mintert, 1992). According to Small et al.
(2010) the factors that influenced the profitability of cattle feedlots the most in Nebraska, USA, were (in
order from most to least important) the carcass price, price margin, weaner price and corn price, while
the other factors were not significant. Mark et al. (2000) found that carcass price and weaner price had
the largest impact on feedlot profitability, although corn prices, interest rates and animal performance
also played a role. They suggested that feedlots should focus their risk management on the first two
factors, but also keep the other in mind. In the study of Langemeier et al. (1992) conducted at a feedlot
in Kansas, USA, they found that carcass price, weaner price, corn price, interest rates, feed conversion
and average daily gain were significant in influencing profitability and together explained 98% of the

9
variability in profitability. The price of hay and mortality rate did not significantly influence the
profitability and was left out of the final results.
Although these studies are useful in the description of the factors that influence profitability, the
findings cannot be used to simulate future scenarios regarding feedlot profitability. The study done by
Langemeier et al. (1992), for instance, suggested that mortality did not have an influence on
profitability; this, however, is only true for the feedlot which data they had used for the analysis (the
mortality rate was very low). If the same study would have been done on a feedlot with a higher
mortality rate, the controversy might have been correct. This question is relevant in the case of an on
farm feedlot with a smaller operational scale than that of established feedlots with a lot of managerial
experience. It is therefore important to include various parametric budgets with a feedlot enterprise
planning or budget to determine the sensitivity of the specific case towards the various variables.
3. Methodology and assumptions
This study is based on a scenario simulating the information (physical and financial) of a smaller, on
farm, beef feedlot through a model specifically designed for this purpose by using Microsoft Excel 2007.
The model is designed to configure all fixed and variable costs, including the interest on these costs, and
the total production value of the enterprise after mortality to finally suggest the margin after interest of
the feedlot. The model also calculate the production cost ratio, price margin, feed margin as well as the
increased value of the on farm maize that was fed (assuming that the maize was not bought, but
produced on the farm). This model is presented in Addendum A. All the variables used in the model are
averages and stay the same for analysis purposes, except where otherwise indicated.
The following scenario and assumption were used in this model:
Firstly, it is accepted that it was not necessary to invest in any fixed structures, based on the assumption
that the necessary infrastructure for the feedlot was available on the farm. Five‐hundred weaners of
230 kg per weaner live weight were bought from outside the farm at R15.50/kg live weight and the
transport cost was assumed as R17.00 per weaner. The weaners were fed a mixture of maize and feed
concentrate that resulted in a Feed Conversion Ratio (FCR) of 5.8 kg feed per kilogram live weight gain,
and an Average Daily Gain (ADG) of 1.5 kg per day. The on‐farm price of maize was R1 100 per ton or
R1.10 per kg, while the price of the feed concentrate was R3 000 per ton or R3.00 per kg. Maize and
concentrate were fed respectively to the ratio of 88:12. The total average veterinary cost was R75.00
per weaner, including antibiotics and growth stimulants or implants. Fixed costs included labour at a
minimum wage of R55 per worker per day and a fuel price of R8.18 per litre, while all interest rates were
accepted as 10% per annum. The Gross Production Value was based on a mortality rate of 1.5%,
transport cost to the abattoir at R17.00 per weaner, an average live marketing weight of 400 kg per
weaner, a slaughter percentage of 55%, an A2/3 grading and a carcass price of R26.00 per kg.
10
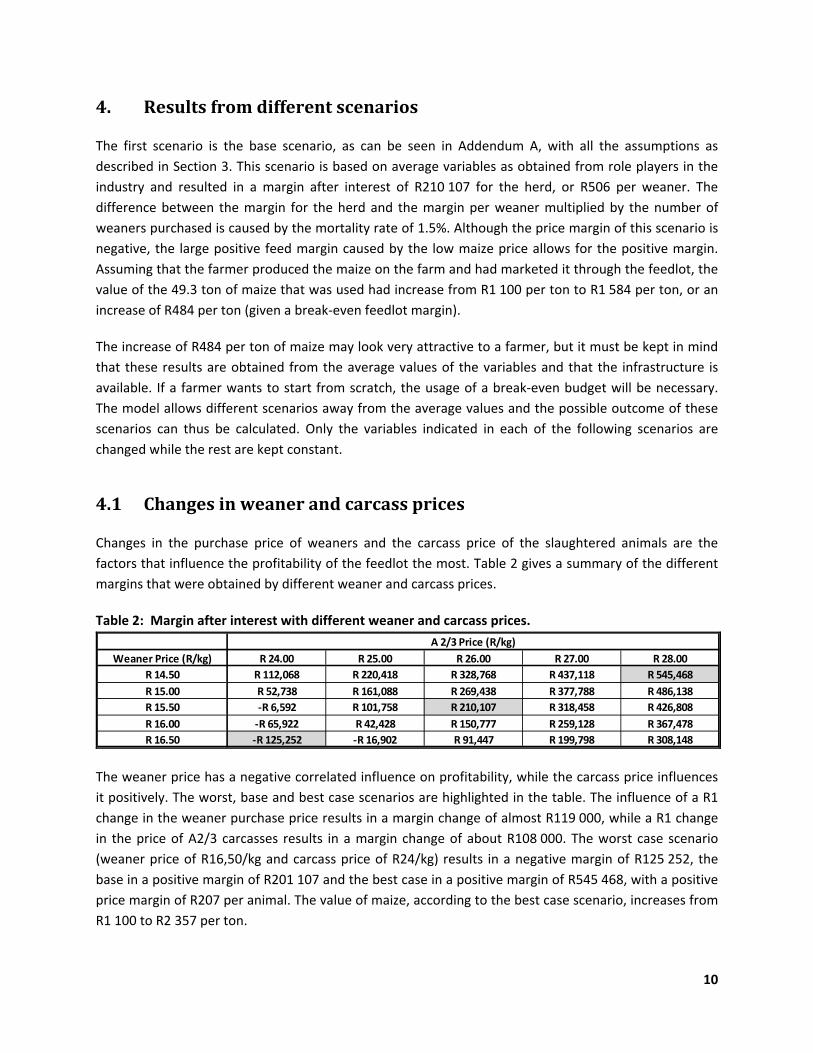
4. Results from different scenarios
The first scenario is the base scenario, as can be seen in Addendum A, with all the assumptions as
described in Section 3. This scenario is based on average variables as obtained from role players in the
industry and resulted in a margin after interest of R210 107 for the herd, or R506 per weaner. The
difference between the margin for the herd and the margin per weaner multiplied by the number of
weaners purchased is caused by the mortality rate of 1.5%. Although the price margin of this scenario is
negative, the large positive feed margin caused by the low maize price allows for the positive margin.
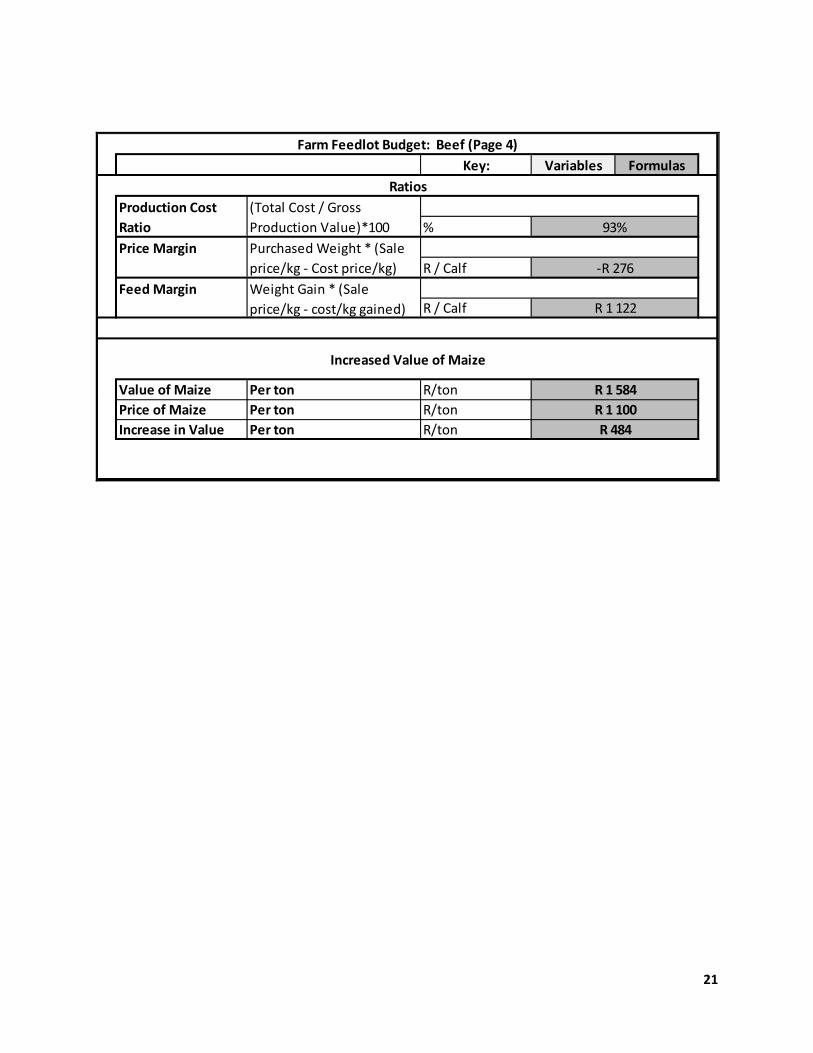
Assuming that the farmer produced the maize on the farm and had marketed it through the feedlot, the
value of the 49.3 ton of maize that was used had increase from R1 100 per ton to R1 584 per ton, or an
increase of R484 per ton (given a break‐even feedlot margin).
The increase of R484 per ton of maize may look very attractive to a farmer, but it must be kept in mind
that these results are obtained from the average values of the variables and that the infrastructure is
available. If a farmer wants to start from scratch, the usage of a break‐even budget will be necessary.
The model allows different scenarios away from the average values and the possible outcome of these
scenarios can thus be calculated. Only the variables indicated in each of the following scenarios are
changed while the rest are kept constant.
4.1 Changes in weaner and carcass prices
Changes in the purchase price of weaners and the carcass price of the slaughtered animals are the
factors that influence the profitability of the feedlot the most. Table 2 gives a summary of the different
margins that were obtained by different weaner and carcass prices.
Table 2: Margin after interest with different weaner and carcass prices.
Weaner Price (R/kg) R 24.00 R 25.00 R 26.00 R 27.00 R 28.00
R 14.50 R 112,068 R 220,418 R 328,768 R 437,118 R 545,468
R 15.00 R 52,738 R 161,088 R 269,438 R 377,788 R 486,138
R 15.50 ‐R 6,592 R 101,758 R 210,107 R 318,458 R 426,808
R 16.00 ‐R 65,922 R 42,428 R 150,777 R 259,128 R 367,478
R 16.50 ‐R 125,252 ‐R 16,902 R 91,447 R 199,798 R 308,148
A 2/3 Price (R/kg)
The weaner price has a negative correlated influence on profitability, while the carcass price influences
it positively. The worst, base and best case scenarios are highlighted in the table. The influence of a R1
change in the weaner purchase price results in a margin change of almost R119 000, while a R1 change
in the price of A2/3 carcasses results in a margin change of about R108 000. The worst case scenario
(weaner price of R16,50/kg and carcass price of R24/kg) results in a negative margin of R125 252, the
base in a positive margin of R201 107 and the best case in a positive margin of R545 468, with a positive
price margin of R207 per animal. The value of maize, according to the best case scenario, increases from
R1 100 to R2 357 per ton.

11
4.2 Changes in maize and concentrate prices
The change in maize price has a relatively large negative correlated influence on the margin of the
feedlot, as can be seen in Table 3, due to the high ratio of maize that is used in this particular feed mix.
Table 3: Margin after interest with different maize and concentrate prices.
Maize Price (R/Ton) R 3,200 R 3,100 R 3,000 R 2,900 R 2,800
R 900 R 286,235 R 292,245 R 298,255 R 304,265 R 310,275
R 1,100 R 198,085 R 204,095 R 210,107 R 216,115 R 222,125
R 1,300 R 109,935 R 115,945 R 121,957 R 127,965 R 133,975
R 1,500 R 21,785 R 27,795 R 33,807 R 39,815 R 45,825
R 1,700 ‐R 66,365 ‐R 60,355 ‐R 54,343 ‐R 48,335 ‐R 42,325
R 1,900 ‐R 154,515 ‐R 148,505 ‐R 142,493 ‐R 136,485 ‐R 130,475
Concentrate Price (R/ton)
The change in price of the feed concentrate also has a negative correlated impact, but other than maize
the inclusion in the mix is relatively small and so is the effect on the margin. An increase of R100 per ton
in the price of maize will result in a negative correlated change of about R44 000 in the margin, while a
R100 change in the price of concentrate will have an influence of R6 000 on the margin. The worst case
scenario results in a negative margin of R154 515, the base in a margin of R201 107 and the best case in
a margin of R310 275. The break‐even price of maize, if the price of concentrate is kept at R3 000 per
ton, is about R1 580 per ton. The value of maize, according to the best case scenario, increases from
R900 to R1 615 per ton. It is important to note that the margin is negative in the worst case scenario,
and will decrease the value of the maize to levels below R1 900 per ton, which is the cost price of maize
in this scenario.
4.3 Changes in the maize and weaner prices
The relationship between the price of maize and the price of weaners, as provided in Table 4, is one of
the important factors in the determination of the maximum price the feedlot is able to pay for weaners
to operate at a positive margin.
Table 4: Margin after interest with different maize and weaner prices.
Maize Price (R/Ton) R 16.50 R 16.00 R 15.50 R 15.00 R 14.50
R 900 R 179,595 R 238,926 R 298,257 R 357,588 R 416,919
R 1,100 R 91,445 R 150,776 R 210,107 R 269,438 R 328,769
R 1,300 R 3,295 R 62,626 R 121,957 R 181,288 R 240,619
R 1,500 ‐R 84,855 ‐R 25,524 R 33,807 R 93,138 R 152,469
R 1,700 ‐R 173,005 ‐R 113,674 ‐R 54,343 R 4,988 R 64,319
R 1,900 ‐R 261,155 ‐R 201,824 ‐R 142,493 ‐R 83,162 ‐R 23,831
Weaner Price (R/kg)
The negative correlated impact of both the maize and weaner price on the margin creates a situation
where the feedlot is able to pay higher prices for weaners at low maize price and vice versa. At a maize
price of R1 300 per ton, the feedlot is still able to make a small positive margin at a price of R16,50 per

12
kilogram for the weaners, but as soon as the price of maize increases to R1 500 per ton, the break‐even
price of weaners drops to about R16,00 per kilogram. The worst case scenario that can happen between
the borders set apart in the table, will result in a negative margin of R261 155, while the best case
scenario can realise a positive margin of R416 919.
4.4 Changes in the maize and carcass prices
The price of maize determines the maximum price a feedlot can pay for weaners and it is also the
determinant of the minimum carcass price, as described in Table 5, to still operate at a positive margin.

13
Table 5: Margin after interest with different maize and carcass prices.
Maize Price (R/Ton) R 24.00 R 25.00 R 26.00 R 27.00 R 28.00
R 900 R 81,556 R 189,906 R 298,256 R 406,606 R 514,956
R 1,100 ‐R 6,594 R 101,756 R 210,107 R 318,456 R 426,806
R 1,300 ‐R 94,744 R 13,606 R 121,957 R 230,306 R 338,656
R 1,500 ‐R 182,894 ‐R 74,544 R 33,807 R 142,156 R 250,506
R 1,700 ‐R 271,044 ‐R 162,694 ‐R 54,343 R 54,006 R 162,356
R 1,900 ‐R 359,194 ‐R 250,844 ‐R 142,493 ‐R 34,144 R 74,206
A2/3 Price (R/kg)
In this case the maize price is negatively correlated with the margin, while the carcass price is positively
correlated with the margin. The higher the price of maize, the higher the price of the carcass should be
to realise profits. The base scenario with a maize price of R1 100 per ton will operate at a negative
margin if the carcasses are sold at less than about R24.10 per kilogram. An increase in the price of maize
to R1 500 per ton will cause the break‐even price of carcasses to around R25.70 per kilogram. The worst
case scenario for the relationship between maize and carcass prices appears at a maize price of R1 900
per ton and a carcass price of R24.00 per kilogram, realising a negative margin of R359 194, while the
best case scenario realises a positive margin of R514 956. The price of carcasses at the time of marketing
should be estimated very carefully and have to be compared to the average maize price over the feeding
period. An underestimation of only R2 per kilogram for the carcass price can cause a decrease of almost
R217 000 in the margin of the feedlot.
4.5 Changes in feed conversion ratio (FCR) and average daily gain (ADG)
FCR and ADG are the measurements of animal performance (productivity) as well as feed quality. The
FCR is the amount (kg) of feed needed by the animal to gain 1 kg of live weight and is thus negatively
correlated with the margin, while the ADG is positively correlated because it measures the mass (kg) an
animal gain per day, and thus decreases the number of days the animal must be fed to reach its target
weight.
Table 6: Margin after interest with different FCR and ADG ratios.
FCR 1.3 (131) 1.4 (121) 1.5 (113) 1.6 (106) 1.7 (100)
5.4 R 238,331 R 247,785 R 255,977 R 263,146 R 269,471
5.6 R 215,341 R 224,795 R 232,987 R 240,156 R 246,481
5.8 R 192,351 R 201,805 R 210,107 R 217,166 R 223,491
6.0 R 169,361 R 178,815 R 187,117 R 194,176 R 200,501
6.2 R 146,371 R 155,825 R 164,127 R 171,186 R 177,511
Average Daily Gain (Days to Feed)
According to Table 5, a change of 0.2 kg feed per kg weight in the FCR results in a negatively correlated
margin change of about R23 000, while a change of 0.1 kg in ADG results in a positively correlated

14
change of R6 000 to R11 000 in the margin, depending on the number of days it shortened the feeding
duration. The worst case scenario results in a margin of R146 371, the base in a margin of R201 107 and
the best case in a margin of R269 471. The value of maize, according to the best case scenario, increases
from R1 100 to R1 767 per ton, and according to the worst case scenario to R1 416 per ton.
4.6 Changes in mortality rate and number of weaners purchased
Although the numbers of weaners in Table 6 that are kept in the feedlot, only affect the total margin in a
positively correlated way and have no effect on the margin per weaner or on the change in the value of
maize, it is included for reference purposes so that the total margin can be compared with different
numbers of weaners in the feedlot.
Table 7: Margin after interest with different numbers of weaners and mortality rates.
Mortality Rate (%) 200 350 500 650 800
0.5 R 95,449 R 167,036 R 238,623 R 310,210 R 381,797
1.0 R 89,746 R 157,055 R 224,364 R 291,673 R 358,983
1.5 R 84,043 R 147,074 R 210,107 R 273,136 R 336,169
2.0 R 78,340 R 137,093 R 195,848 R 254,599 R 313,355
2.5 R 72,637 R 127,112 R 181,589 R 236,062 R 290,541
Amount of Calves Purchased
The mortality rate, on the other hand, does influence the margin and is negatively correlated with the
margin. Using the 500 weaners, for example, a change of 0.5% in the mortality rate will be negatively
correlated with a change of just more than R14 000 in the margin. The margin of the best case scenario
at a mortality rate of 0.5% will then be R238 623, and the worst case at 2.5% will be R181 589. The
difference between the two margins of R57 034 will let the value of the maize decrease from R1 650 for
the best case, to R1 519 for the worst case. In feedlots a large number of animals are confined to a
relatively small space. The spread of diseases thus happens rapidly and very good precautions must be
taken to control diseases and to limit the mortality rate. Therefore, the managerial capability of the
farmer will be an important factor in this decision.
4.7 Changes in slaughter percentage and carcass prices
The last set of scenarios that were tested is presented in Table 8 and reveals the effect of different
slaughter percentages and carcass prices on the margin of the feedlot.
Table 8: Margin after interest with different slaughter percentages and carcass prices.

15
Slaughter % R 24.00 R 25.00 R 26.00 R 27.00 R 28.00
58.0% R 135,247 R 249,507 R 363,767 R 478,027 R 592,287
56.5% R 64,327 R 175,632 R 286,937 R 398,242 R 509,547
55.0% ‐R 6,593 R 101,757 R 210,107 R 318,457 R 426,807
53.5% ‐R 77,513 R 27,882 R 133,277 R 238,672 R 344,067
52.0% ‐R 148,433 ‐R 45,993 R 56,447 R 158,887 R 261,327
A2/3 Price (R/kg)
Although the large negatively correlated effect of the carcass price variation was already tested on the
margin, it was used again to show its effect when combined with the slaughter percentage. The
slaughter percentage has a positively correlated effect on the margin, and the margin will decrease with
a decrease in slaughter percentage. The value with which a unit changes in the slaughter percentage will
change the margin increases as the carcass price increases due to the direct relationship between the
two in the calculation of gross production value. At a carcass price of R24.00 per kilogram, a 1.5%
change in slaughter percentage will change the margin with about R71 000, while the same unit change
in the slaughter percentage at a carcass price of R28.00 per kilogram will change the margin with almost
R83 000. Holding the base scenario in mind where the carcass price is R26.00 per kilogram, a decline of
3% in the slaughter percentage will cause the margin to decrease from R201 107 to R56 447, while an
increase of 3% in the slaughter percentage will cause the margin to increase to R363 767.
5. Conclusion and recommendations
The questions that needed to be answered by the different scenarios that were used in this paper, is
whether it is possible to add value to maize by marketing it through cattle, and what factors influence
the success of such a feedlot. From the results that were obtained with the different scenarios, it is clear
that the value of maize can be increased in most of the cases, compared to selling at spot market prices
of R1 100 per ton.
The possibility of a farm operated feedlot to increase the value of the farm’s maize crop is determined
by the profitability or margin of the feedlot. The higher the margin after interest is, the higher the added
value to the maize will be. The primary objective of the feedlot is thus obvious to maximise its margin. In
order to reach this goal numerous key factors must be maximised or minimised depending on its
correlated influence on the margin. The most important of these factors, which are both quantifiable
and measurable, identified in the study are the following:
weaner price,
carcass price,
slaughter percentage,
feeding cost (maize price),
feed conversion ratio (FCR),
mortality rate and
average daily gain.
16
The ability of the farmer to manipulate the exact level of several of these influences is very limited, since
most of them are driven by supply and demand in the market. Therefore, the production process, while
the calves are in the feedlot, must run on maximum efficiency. Although the weaner price, carcass price
and slaughter percentage have a bigger influence on the margin, feeding cost represents the largest
proportion of the cost allocated to the amount of weight gained. The quality and price of the diet
therefore have a considerable impact on the efficiency of converting feed into meat and thus on the
margin of the feedlot. The largest part of a feedlot diet is usually made up by maize, and maize thus also
contributes to the largest proportion of the price of the total feed mix. The very low maize price that is
currently experienced, makes it relatively easy for a feedlot to operate at a positive margin and it is thus
possible for a famer to increase the value of the maize that was produced on the farm and fed to
weaners. Regarding the quality of the diet, the slaughter percentage, FCR and ADG are measurements of
animal performance or productivity and are partly determined by the quality of the diet. It is thus
recommended that different diets and their productivity should be well researched so that the diet with
the best returns can be used.
The two factors that influence the margin of the feedlot the most are the price of the weaners that are
purchased and the price of the carcasses that must be sold. The first fact that must be kept in mind is
that the business of a feedlot is not static but happens over a period of time, usually between 100 and
120 days. The carcass price at the time the weaners must be sold may thus not be the same than at the
time they were purchased. An increase in the carcass price over the four months that the animals are
fed is very welcome, but what if the price decreases significantly over that time. Good precautions must
be taken at the time the weaners are bought to estimate the price at the time of marketing to its most
accurate point. The low maize price may lead to a high demand for weaners that will increase the price
of weaners for the time being. These weaners will all be fed in feedlots and marketed at about the same
time as carcasses, which may cause a high supply in the market putting pressure on the price of
carcasses. The high weaner price, and low carcass price four months later, may lead to very low or even
negative margins for the feedlots and great care must thus be taken that a feedlot do not end up being
caught in this scenario.
The mortality rate of a feedlot, if it moves between acceptable margins, plays a minor role in the
determination of the margin of the feedlot if it is compared to the other factors. It must, however, be
kept in mind that the mortality rate can increase very rapidly. In a feedlot there is a large number of
animals confined to a relatively small space, all receiving the same food and treatment. This do not only
quicken the spread of diseases, but if there are something wrong with the feed all the animals will be
affected. The feedlot environment must thus be kept as hygienically and healthy as possible through the
usage of a good veterinarian programme and effective waste management. Other hygienic factors that
may have an influence on the margin because it reduce productivity of the animals are the amount of
flies, water quality, feed quality and moisture content of the soil (mud) (Milton as cited by Smith, 2010).
The conclusion of this study is that a feedlot can be profitable and increase the value of the farm
produced maize if the right steps are followed and care is taken to ensure the smooth operation of the
feedlot. The feedlot sector is very capital intensive to start with. Farmers that consider the feeding of

17
weaners can thus try to cooperate to reduce the initial capital investment per farmer. The large effect of
demand and supply in the South African beef market increases the price risk of a feedlot and the same
study must be done on other meat‐producing enterprises, such as poultry, to determine if it may be
equally or more profitable than the beef sector.

18
Addendum A Feedlot Profitability Base Model
Key: Variables Formulas
Amount Calves Purchased Heads 500
Average Purchased Weight kg / Calf 230
Purchased Price per live kg R / kg R 15.50
Transport Cost per Calf R / Calf R 17.00
Purchase Price for Calf R / Calf
Purchase Price for Herd R / Herd
Days in Feedlot Days
Average Daily Gain kg 1.50
Feed Conversion Ratio kg feed / kg gain 5.8
Daily Feed Consumption kg/Calf/day
Total kg feed / Calf kg 986
Total kg feed / Herd kg 493000
Maize Amount (kg) 867.68 433840
88% Price (R/kg) R 1.10
Concentrate Amount (kg) 118.32 59160
12% Price (R/kg) R 3.00
Feed Cost / Calf R
Feed Cost / Herd R
Veterinarian Cost Dose / Calf 1 500
Price (R/Dose) R 75.00 R 37 500
Medicine Cost / Calf R
Medicine Cost / Herd R
Per Calf R
For Herd R
Farm Feedlot Budget: Beef (Page 1)
Variable Cost
113
R 3 582
R 1 791 000
8.70
Calves Purchased
Total Variable Cost
Variab
le CostV
ariable Cost
Feed Purchased
Medicine Purchased
Total Variable Cost
R 37 500
R 75
R 654 704
R 1 309
R 4 966
R 2 483 204

19
Key: Variables Formulas
Workforce Nr of Workers
Wage R/worker/day R 55.00
Per Calf R / Calf
For Herd R / Herd
Fuel Price R / Liter R 8.18
Fuel Consumption Liter / day
Fuel Cost R / day
Maintenance (100% of Fuel)R / day
Per Calf R / Calf
For Herd R / Herd
Amount per Feed Cycle R / Feed Cycle
Per Calf R / Calf
For Herd R / Herd
Per Calf R
For Herd R
100% Interest Rate 10.00%
Per Calf R / Calf
For Herd R / Herd
50% Interest Rate 10.00%
Per Calf R / Calf
For Herd R / Herd
70% Interest Rate 10.00%
Per Calf R / Calf
For Herd R / Herd
50% Interest Rate 10.00%
Per Calf R / Calf
For Herd R / Herd
Per Calf R / Calf
For Herd R / Herd
Fixed Costs (% of
time stock is kept)
Medicine (% of time
stock is kept)
Calves (100% of
time stock is kept)
Feed (% of time
stock is kept)
Total Interest Paid
Interest Paid
Interest P
aid
Total Interest Paid
R 21
R 21
R 10 597
R 151.33
R 34 301
R 57 017
R 10 421
R 836
R 750
Farm Feedlot Budget: Beef (Page 2)
Fixed Cost
R 4
Fixed Cost
Fixed Cost
R 151.33
Fuel and
Maintenance
Total Fixed Cost
R 68 274
Interest Paid
R 114
R 69
Labour
Total Fixed Costs
R 137
R 2
R 2
R 94
R 2 244.91
2
18.5
Miscellaneous (5%
of other fixed cost)
R 47 143
R 2 245

20
Key: Variables Formulas
Mortality Rate Percentage 1.50%
Amount of Calves Sold Heads
Transport Cost per Calf R/Calf R 17.00
Average Live Weight kg 400
Slaughter Percentage Percentage 55.00%
Carcass Weight kg
A 2/3 Carcass Price R/kg R 26.00
Per Carcass R / kg
For Herd R / kg
Per Carcass R / Calf
For Herd R / Herd
Per Calf R / Calf
For Herd R / Herd
Per Calf R / Calf
For Herd R / Herd
Per Calf R / Calf
For Herd R / Herd
Per Calf R / Calf
For Herd R / Herd
Per Calf R / Calf
For Herd R / Herd
Per Carcass R / Calf
For Herd R / Herd
Gross Production
Value
Calves Sold
Production Value
R 2 808 728
Farm Feedlot Budget: Beef (Page 3)
Feedlot Margin
Gross Production Value
R 5 703
Feedlot M
argin
R 278 380
R 642
‐R 2 483 204
220
Feedlot Margin
(Total Variable Cost)
R 210 107
R 506
‐R 68 274
‐R 137
Margin after
Interest
(Total Interest Paid)
Margin After Interest
Production Value
Productio
n Valu
e
R 737
‐R 4 966
R 5 703
‐R 47 143
Gross Production
Value
R 2 808 728
‐R 94
R 325 524
Nett Margin
(Total Fixed Cost)
Gross Margin
493
21
Key: Variables Formulas
%
R / Calf
R / Calf
Value of Maize Per ton R/ton
Price of Maize Per ton R/ton
Increase in Value Per ton R/ton
93%
(Total Cost / Gross
Production Value)*100
Production Cost
Ratio
‐R 276
R 1 122
Farm Feedlot Budget: Beef (Page 4)
Increased Value of Maize
R 1 584
R 1 100
R 484
Price Margin Purchased Weight * (Sale
price/kg ‐ Cost price/kg)
Feed Margin Weight Gain * (Sale
price/kg ‐ cost/kg gained)
Ratios
22
References
BFAP. (2009). The South African agricultural baseline 2009. Bureau for Food and Agricultural Policy.
CEC. (2010). Third production forecast for summer crops for the 2009/10 production season. Crop
Estimation Committee. 22 April 2010.
DAER. (2010). Beef Production: The Basics. Department: Agriculture, Environmental affairs and Rural
development, KZNTL. Available from http://agriculture.kzntl.gov.za.
DAFF. (2009). Economic review of the South African agriculture 2008/2009. Department of Agriculture,
forestry & fisheries.
GrainSA. (2010). Die vraag en aanbod van mielies in die RSA. 24 May 2010. Available from
www.grainsa.co.za.
JSE. (2010). SAFEX Spot prices history. Johannesburg Stock Exchange. 30 April 2010. Available from
www.jse.co.za.
Langemeier, M., Schroeder, T.C. & Mintert, J. (1992). Determinants of Cattle Finishing Profitability.
Southern Journal of Agricultural Economics. Dec (1992): 41 ‐ 47
Laubscher, K. (2010). The opportunity cost phenomenon. SA Grain. 12(4): 4 ‐5.
Mark, D.R., Schroeder, T.C. & Jones, R. (2000). Identifying Economic Risk in Cattle Feeding. Journal of
Agribusiness. 18,3: 331 ‐ 344.
McCluskey, J.J., Wahl, T.I., Li, Q. & Wandschneider, P.R. (2005). U.S. Grass‐Fed Beef: Marketing Health
Benefits. Journal of Food Distribution Research, 36(3):1‐8.
Small, R.M., Mark, D.R. & Klopfenstein, T.J. (2010). Determinants of Profit Variability in Calf‐Fed and
Yearling Production Systems. Nebraska Beef Report. 2010: 52 ‐ 55.
Smith, M. (2010). Voer gerus, maar volg regte resep. Landbou Weekblad. 1654: 72.
Van Rooyen, C. (2010). Graanbedryf kort reddingsplan. Landbou Weekblad. 1654: 4 ‐ 5.
Willemse, B.J. (2010). Saaiboere kry seer skop. Landbou Weekblad. 1654: 8 ‐ 9.