Low Velocity Instrumented Impact Testing of Four NewDamage
42
)0 Low Velocity Instrumented Impact Testing of Four NewDamage Tolerant Carbon_poxy Composite Systems ' I = ±L: i .. Z_- I I I:: , D. G. Lance and A. T. Nettles (NASA-TP-aO_9 i IMpAcT TE_TTNG CARgON/ffPOXY COMPOSITE L,_ ve-L.,. [TY [NSTRU_ENTF'-, OF FOU"_ NEW DA _IAGE T_LERANT SYSTFMS (NASA) 39 p CKCI. 11D i _90-ZS_o8 unclas Hl/2_ 079331_ 7 https://ntrs.nasa.gov/search.jsp?R=19900015882 2018-12-18T17:38:16+00:00Z
Transcript of Low Velocity Instrumented Impact Testing of Four NewDamage

)0
Low Velocity InstrumentedImpact Testing of FourNewDamage TolerantCarbon_poxy CompositeSystems
' I= ±L: i .. Z_-
I
I
I:: ,
D. G. Lance
and A. T. Nettles
(NASA-TP-aO_9i IMpAcT TE_TTNG
CARgON/ffPOXY COMPOSITE
L,_ ve-L.,. [TY [NSTRU_ENTF'-,OF FOU"_ NEW DA _IAGE T_LERANT
SYSTFMS (NASA) 39 pCKCI. 11D
i
_90-ZS_o8
unclas
Hl/2_ 079331_
7
https://ntrs.nasa.gov/search.jsp?R=19900015882 2018-12-18T17:38:16+00:00Z

m
-- ---_ --= -- _T
= -........-:-.--- _ ......... :?_ _-- ._
,o

NASATechnical
Paper3029
1990
National Aeronautics andSpace Administration
Office of Management
Scientific and TechnicalInformation Division
Low Velocity InstrumentedImpact Testing of FourNew Damage TolerantCarbon/Epoxy CompositeSystems
D. G. Lance
and A. T. Nettles
George C. Marshall Space Flight Center
Marshall Space Flight Center, Alabama


TABLE OF CONTENTS
I. INTRODUCTION ......................................................................................
II. MATERIALS AND EXPERIMENTAL METHODS ..............................................
1. Material ...............................................................................................
2. Impact Testing .......................................................................................
3. Visual Damage ......................................................................................
4. Specimen Cross-Sectioning ........................................................... _ ..........
III. RESULTS AND DISCUSSION ......................................................................
I. Force-Time Plots From Impact Tests .............................................................
2. Absorbed Energy-Time Plots From Impact Tests ...............................................
3. Maximum Force Versus Impact Energy Plots ...................................................
4. Visible Surface Damage ............................................................................
5. Cross-Sectional Visual Damage ...................................................................
IV. CONCLUSIONS ........................................................................................
APPENDIX A - Instrumented Output, Cross-Sectional Photographs, and
Surface Photographs for Each Material ................................................
APPENDIX B - Cross-Sectional Photographs of the IM7/1939
Front Surface Cracks .....................................................................
REFERENCES ..................................................................................................
Page
1
1
1
2
2
2
3
3
3
4
9
31
35
PRECEDING PAGE BLANK NOT FILMED
ifi
II l.Aliit .,k._LL... Nl ltll0h

LIST OF ILLUSTRATIONS
Figure
I.
2.
3.
4.
5.
6.
Title
Maximum load versus Impact energy for T650/1939 ......................................
Maximum load versus impact energy for T650/1962 ......................................
Maximum load versus Impact energy for IM7/1939 .......................................
Maxnnum load versus Impact energy for IM7/1962 .......................................
Maximum load versus impact energy for T300/934 .................. . ....................
Maximum load versus impact energy for all materials ....................................
Page
6
6
7
7
8
8
iv

TECHNICAL PAPER
LOW VELOCITY INSTRUMENTED IMPACT TESTING OF FOUR NEW DAMAGE
TOLERANT CARBON/EPOXY COMPOSITE SYSTEMS
I. INTRODUCTION
Since foreign object impact is a serious concern with carbon fiber reinforced polymeric materials,
an effort has been made by some manufacturers to produce more damage tolerant resins. Furthermore,
the newer generation of intermediate modulus carbon fibers have a much higher strain to failure, as well
as a higher strength, than the earlier types of carbon fibers. Impregnating the improved fibers with the
new damage resistant resins produces materials that can withstand a larger impact energy before material
damage occurs.
Low-velocity instrumented impact methods have proven to be very useful in the study of damage
tolerance of composite materials (Refs. I-4). Such data as maximum force of impact, force-time graphs,
and absorbed energy of impact can help the researcher characterize different composite materials for
damage tolerance. Cross-sectioning of the specimen through the damage zone has also proven to yield
practical information (Refs. 3,5-9). By utilizing this destructive analysis technique, the impact energies
that cause matrix cracking, delaminations, and fiber breakage can all be identified. Furthermore, a
comparison of the damage tolerance capabilities of various materials can be accomplished by observing
which materials have the most amount of matrix cracking or larger extent of delaminations for a given
impact energy. Comparisons can also be made between the visible surface damage and the internal
damage identified by the cross-sectional examination.
Although a large amount of literature exists on impact damage testing and characterization of
composite materials, data is lacking on the recently developed carbon fiber/epoxy resin systems. In order
for the newer generation composites to be incorporated into high performance applications, much
research needs to be accomplished to better understand the response of these composite materials to
impacts. It is the purpose of this paper to present some preliminary experimental results on four new
composite prepreg systems and compare these to an earlier generation fiber/resin system to see if there
are indeed any improvements in impact resistance, and to characterize those improvements.
II. MATERIALS AND EXPERIMENTAL METHODS
1. Material
Five different prepreg systems were used to construct the panels tested for this study. The T650/
1939 and T650/1962 prepregs were manufactured by Amoco Performance Products. The IM7 carbon
fibers were produced by Hercules Incorporated and impregnated by Amoco with the 1939 and 1962 resin
systems. The T300 fibers were produced by Amoco and impregnated by Fiberite with the 934 resin.

TheT300/394wasemployedasabaselinematerialfor this studybecauseof the largedatabasealreadyin existenceon thismaterial.Theothermaterialswerechosenbecauseof their recentintroductioninto the marketandpromiseof damageresistance.TheT300 is an intermediatemodulusfiber, andthe934 is a standardepoxy resin.The T650and IM7 are intermediatemodulus/high-strengthfibers.The1939and 1962resinsareboth claimedto be damagetolerantepoxies.
Theseprepregswere fabricatedinto 16-ptypanelswith quasi-isotropiclay-up configuration,(0, +45,-45,90)_2. Each material was cured with a hot pressaccordingto the supplier's recom-mendations.TheT300/934rangedin thicknessfrom 1.76mmto 180mm, theT650/1939from !.82 mmto 1.92mm, theT650/1962between1.92mm and2.00 ram, theIM7/1939 wasbetween2.28and2.32mm thick, and the IM7/1962 had a thicknessrangingfrom 1.96 to 2.04 mm.
Specimens10.16cm2 were machinedfrom the compositepanelsfor impact testing.
2. Impact Testing
The specimens were impacted using a Dynatup model 8200 drop weight apparatus. The data was
obtained with a Dynatup 730 Data Acquisition Systern. The impactor had a mass of 1.77 kg with a
I .27-cm diameter hemispherical tup. The specimens were held tightly between two aluminum plates by a
pneumatic clamping mechanism. The plates had holes 7.62 cm in diameter within which the composite
panel was exposed. The specimens were all impacted at their centers.
U
3 Visual Damage
For each level of impact energy on each type of specimen, the visual damage to both sides of the
panel was recorded and photographed.
4 Specimen Cross'Sectioning
For each impact energy level on each type of specimen, a cross-sectional cut was made perpen-
dicular to the outer fibers and through the point of impact with a Buehler diamond wafering blade. The
specimens were then examined and photographed by a Zeiss stereo-optical microscope at magnifications
between 8 x and 20 x. Several of the IM7/1939 specimens were cross-sectionally cut parallel to the outer
fibers and through the front surface crack. These specimens were photographed at magnifications
between, 8 x and 50 x.
III RESULTS AND DISCUSSION
1 Force-Time Plots From Impact Tests
The force-time plots, generated by the data acquisition system, of each specimen damaged from a
drop height which induced fiber breakage showed a sharp drop in force at the maximum recorded load.

For impacttestswhichproducedno fiberbreakagetherewasnosharpdropin force, but ratheragradualreduction.Force-timeplots for eachdrop heightusedon eachmaterialarepresentedin appendixA.
2. Absorbed Energy-Time Plots From Impact Tests
The smooth curves included on the force-time plots in appendix A are absorbed energy-time
plots. A constant percentage of initial impact energy was lost during the impact of all of the materials
tested, until the point of fiber breakage where the the output listed virtually 100 percent of the impact
energy being absorbed. It must not be interpreted that all of the energy loss was released as damage to the
impacted specimen. It has been found that vibrational waves most likely account for a substantial
percentage of the lost impact energy (Ref. 4).
3. Maximum Force Versus Impact Energy Plots
Maximum force of impact values were plotted against their corresponding impact energy levels
for each material. These results are given in figures I through 5. The individual plot for each material
shows a somewhat linear correlation between the maximum force and the increasing impact energy until
the critical impact energy level at which point the maximum force drops slightly and then levels out. The
critical impact energy level is the impact energy corresponding to the peak force from the force-energy
plots and takes place just before fiber breakage occurs. From the comparison of the maximum force
versus impact energy plots for all the materials (fig. 6) it can be seen that the plot actually loosely follows
an inverse parabolic curve.
4. Visible Surface Damage
The visible surface damage was recorded after impact for each specimen. The following results
are given for all five materials tested. In addition, several photographs of the damaged specimens are
presented in appendix A. The apparent fabric pattern surface of the composites in the photographs was
due to the imprint of the Teflon release cloth used during the curing of the specimens. In order to reveal
hard-to-see damaged areas on the front and back sides of the specimen, a fiber optic light source was
placed on the surface of the panel with light angled sharply across the impacted area. This method of
illumination greatly enhanced the photographs as well as enabled the researcher to record minute surface
damage earlier than might otherwise be detected.
The T300/934 plates displayed no damage until a small crack appeared on the back surface of the
specimen at 4. ! J. With the next impact energy level of 5.0 J, the plate showed a significant dent on the
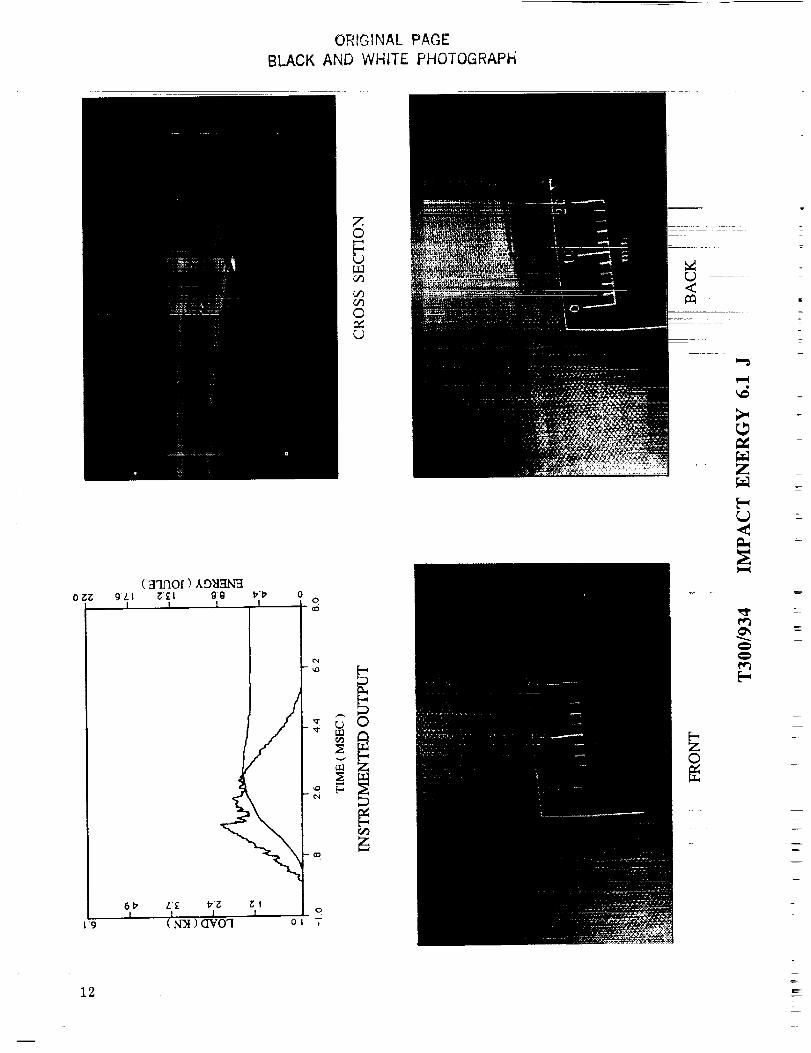
front and a fairly large split on the back. Fiber breakage was first recorded within the front dent at 6.1 J.
A hole was nearly punched through the specimen at 11.3 J.
The T650/1939 plates first displayed damage as a hairline crack along the back surface visible at
6.2 J, but a full split did not occur on the back side until l1.3 J. At an impact energy of 8.2 J, a dent
appeared on the front surface. Fiber breakage was not observed within the dent until 15.2 J. The last
impact, having an energy of 20.3 J, nearly punctured the specimen.

TheT650/1962platesallowednovisibledamageuntil acrackoccurredon thebacksurfaceat animpactof 7.1 J. A minor dentwasproducedwith an impactof 9. t J. Fiberbreakagewasnot observeduntil 15.I J of impactenergy.
The IM7/1939 plates withstood damage until 6. I J when a front surface dent and a rear surface
crack occurred. At an impact of 8.2 J, a small crack appeared beside the impactor dent on the front
surface of the specimen. The crack was perpendicular to the direction of the outer layer of fibers. At 10.2
J, these perpendicular surface cracks were noticed on either side of the impactor dent. The perpendicular
cracks were found on the front surface of all specimens impacted with energies above 8.2 J. In all cases,
the cracks were from 3 mm to 8 mm in length. Larger dents with fiber breakage occurred at the 15.3 J
energy level.
The IM7/1962 plates showed no damage until a hairline crack appeared on the back surface and a
minor dent appeared on the impacted side at the 7.0 J energy Ievell The damage on the back" surface
fluctuated between a hairline crack and several long cracks until the impact energy of 17.2 J when the
surface split and raised. A barely visible dent was noticed at the 12.2 J energy level. At 19. I J, minor
fiber breakage occurred in the front Surface dent.
5. Cross-Sectional Visual Damage
A cross-sectional cut was made perpendicular to the outer fibers for each plate and the specimens
were examined and photographed. Photographs of each material impacted at each energy level are
presented in appendix A.
The T300/934 showed damage on the first impact which had an energy of 1.0 J. Minor delamina-
tions and a small matrix crack were noticed at this energy level. An impact of 4. I J produced a slight
ridge on the back side of the specimen due to the great level of delaminations and matrix cracking. Fiber
breakage occurred at the 6.0 J energy level. Impact energies of 7. I J and above rapidly increased theamount of destruction towards a puncture hole l
The T650/1939 displayed several minor delaminations at an impact of 5.1 J. The next energy
level of 6.2 J produced no damage. At the next impact energy level of 7.1 J, many delminations and
much matrix cracking occurred. Fiber breakage was not noticed until 12.8 J.
The T650/1962 withstood damage until 7. I J when a hairline delamination occurred. There were
no noticeable cracks until the 12.2 J impact. At 15.0 J fiber breakage occurred within the specimen.
The IM7/1+939 showed no damage until the 6, ! J impact which caused delmination. Matrix crack-
ing was first recorded at 8,2 J. Fiber breakage first occurred at the 14.4 J energy level. The impact of
highest force, 19.4 J, produced a near hole in the composite material, For some of the IM7/1939
specimens, a cross-sectional cut was made through the small surface crack on the front surface. For all of
the impacts, the crack occurred only through the outer layer and perpendicular to the fiber direction in
this layer. Under magnification it was clear that, at the site of the crack, the outer fibers were completely
broken. For the more forceful impacts, deliminations were noticed under the topmost layer in the cracked
region. Several cross-sectional photographs of these cracks are provided in appendix B.
4
L + ::

The IM7/1962 displayed hairline delaminations on the first impact which had an energy of 4.0 J.
Matrix cracking was first evident at 7.0 J. The damage from the impacts between the 8.2 J and 12.2 J
energy levels were long delaminations with a few matrix cracks. Much matrix cracking was the result of
the 16. ! J impact. At 18.3 J a small amount of fiber breakage occurred within the specimen. With regards
to fiber breakage damage tolerance, the IM7/1962 performed superior to all the other materials. The
1M7/1962 supported a force of almost 800 N more than the second most damage resistant material,
T650/1962, before fiber breakage occurred.
IV. CONCLUSION
This study was designated as an impiricai presentation to benefit the designing engineer by show-
ing the response of four damage tolerant composite systems to a blunt, low velocity impact.
Low velocity impact testing of composite panels can provide essential data on a fiber/resin
system. Force-time plots of the impact event show the maximum force that the composite plate can sup-
port before fiber breakage occurs. Graphs of the maximum Ioad versus impact energy show the critical
energy level at which fiber breakage takes place and extensive tensile strength losses may occur. Surface
photograhic documentation provides a means of identifying damage without the destructive evaluation of
the material. Cross-sectional photography provides a detailed account of the damage modes a specimen
undergoes due to impacts of varying energies.
The damage modes for all the specimens followed in the same order. Minor internal delamina-
tions were the first damage to appear. Soon afterward, matrix cracking began within the specimen. A rear
crack and then a front dent were the next damages to occur. The next damage level was fiber breakage
within the specimen, followed by fiber breakage appearing within the front dent. Fiber breakage was next
seen on the back surface of the panel, followed by a puncture hole.
The T300/934 was employed as a baseline material because of the large data base that exists for
that fiber/resin system. The T300/934 supported a maximuum impact load of 2,367 N. The IM7/1939
upheld a force of 3,894 N, 65 percent greater than the maximum impact load capability of the T300/934.
The T650/1939 supported a maximum load of 4,481 N, 89 percent greater than the maximum force of the
T300/394. The T650/1962 held 5,408 N before breakage which was an increase of 129 percent over the
T300/934. The IM7/! 962 upheld a load of 6,203 N, a 162 percent improvement from the T300/934. The
T300/934 had an impact energy of 9.1 at its maximum load. The IM7/1939's maximum load occurred at
an impact of !1.2 J, the T650/1939 impact of I1.3 J provided its greatest load, the T650/1962 had an
impact energy of 14.2 at its maximum force, and the IM7/1962's greatest load occurred at an impact
energ of 17.5 J.
Throughout the study, the 1962 resin system proved to be more damage resistant than the 1939
resin system. The IM7/1962 prepreg had more superior impact damage resistance than the other three
damage tolerant composite materials.

6500
55OO
Z 4500
o 3500
2500
1500
T650/1939 16 Ply
II• i
• IO I OI
500
0 2 4 6 8 10 12 14 16 18 20 22
Impact E (J)
Figure I. Maximum load versus impact energy tk)r T650, 1939.
6500T650/1962 16 Ply
5500
Z 4500
3500O
2500
1500
500
• II II ii II• II
' I " I * i • I ' i ' I " I ' I • I ' i "
0 2 4 6 8 10 12 14 16 18 20 22
Impact E (J)
Figure 2. Maximum load versus impact energy for T650/1962.
E
L
_zz

6500
55OO
Z 4500
'_ 350O
=_ 2500
1500
50O
IM7/1939 16 Ply
0
• I ' I ' l " I ' I " I ' I ' I ' I ' I '
2 4 6 8 10 12 14 16 18 20 22
Impact E (J)
Figure 3. Maximurn load versus inipact energy for IM7,'1939.
6500
5500
A
Z-.-, 4500
cllo 3500
,,,a
== 2500
1500
5OO
IM7/1962 16 Ply
#
0• I ' I " I " I • I " I I " I ' I " I "
2 4 6 8 10 12 14 16 18 20 22
Impact E (J)
Figure 4. Maximum load versus impact energy for IM7/1962.

6500
5500
4500
o 3500
m 2500
T300/934!6 Ply
• 0 0 0 O0 0 •
1500 •
500 , , , i , i • , • i, i , a , i • , • i • _0 2 4 6 8 10 12 14 16 18 20 22
Impact E (J)
Figure 5. Maximum load versus impact energy for T300/934.
8
.... = ..........
6500
5500
Z 4500
= 3500
Nm 2500
1500
50O
All Materials
0
u T65_1939o T65_1962• IM_1939• IM_1962
• T300/934
00 • •
• O013 _v 0 0 0og• • ,o; ,% •
,Q• rlgE
' I " I ' I ' I " I " I " I " I ' I " I '
2 4 6 8 10 12 14 16 18 20 22
Impact E (J)
Figure 6. Maximum load versus impact energy for all materials.
m
z

APPENDIX A
Instrumented Output, Cross-Sectional Photographs and
Surface Photographs of Each Material
9

ORIGINAL PAGE
BLACK AND WHITE PHOIOGRAPrl
0'_ g'Li,I
6"17I
( _r-lflOf ) t9_I3NFI_£1 Og 1717
I I I
L£ _'_I I
( N)I ) dVO'lI
0o
Z©
©
c_
o
i1"9
r,.)<
[-,
©
(.4
[-,r..)
e_
e_
[.-,
lo

0"_ g'LII
( _lq.rlOf ) hO_laN_t_'£1 99
I I17I;'
6"P L'£ VZ _'II I I I
t9 (N)I ) OVO7
ORIGINAL PAGE
BLACK AND WHITE PHOTOGRAPH
0
P" O
E)
O
OI.
<m
[-..,2:©
m
z
[..,r..)
[..,
11
ORIGINAL PAGE
BLACK AND WHITE PHOTOGRAPH
0_
1'9
( H_VlOf ) ADHHNH9"LL _'£1 O'g
I t 1
I
<
I I(INT1)(IV01
z©
C_3
©
I o©
_N
I o0t ,
In(
e_
e_
L
=
L _
=
=
r
12

ORIGINAL PACE
BLACK AND WHITE PHOiOGRAPh
O'E_
1'9
( H3£10f ) XDHHNH9LI g'£1 g'g I;"_'I I I
z©
[-,L_
cf_
©
52
6I:, L'£I I
( N:,i ) (]r_O'l
00
v
© [..,
1_I oO'L ,
<
Z
13

ORIGINAL PAGE
BLACK AND WHITE PHOTOGRAPH
0"_
19
( _'IfaOf ) hO_l_q3g'Ll E£1 g'g _W'
I I I I
6_I
L'£ 1='_ _'tI I I o
( N)I ) GVOq ot .
z©
L)_J
©
L)
, _ o
._, _
<

1"9
ORIGINAL PAGE
BLACK AND WHITE PHO]'OGRAPh
L'Z _'Z Z'[I I i o
( N)I ) (IVO'I o[ T
F--.
[.f]
ro<
[.-,
©
r_
[..[O
M%
15

19
ORIGINAL PAGE
BLACK AND WHITE PHOTOGRAPH
ZO[-r,j
r_
r._©
( _l'=IElOf ) )LDH_I_t9'/.1 _£| 8_ 1:,17
l I I I 0
8_'I
%,-
v
L£ t__ 8"lI I I o
( N_I ) (]YO1 o_ T
,= _ _
<
(",1
r,,,#
[-
o=
16

ORIGINAL PAGE
BLAC;K AND WHITE PHOTOGRAPi-I
Z©
L)uJ
©
_J
( 3'-LrlOl" ) ,_O_dO'_ g'LI _'£[
I I
['g
gg 1_1_ o
I I I ©°
6t_ L'£ I_'E EII I I I o
(N-}I)(IVOq ol T
E)
<
r_
;E
E-rj
E_Z
17

0_
19
ORIGINAL PAGE
BLACK AND WHITE PHO]OGRAPt_
Z©E.-rj
r./3©
L)
( 33/10f ) ,,_9_131q39'Lt _'¢I 0'0 _'I_
I I 1 1
61;, L'£ '1;,_ UII I I I
( N)I ) (IV0"I o
oc_tel
¢x4
xr
,,:f
,,,O
¢,i
O
!
b-.,
rji : ::<m
©
r,.)
t"q
1#3
[--
Z©
18

ORIGINAL PAGE
BLACK AND WHITE PHOTOGRAPh
0'_
1"9
6'_ /..'£ _'E E'LI I I
(tN)I) (IVO']
F-
Z©
©
e,.)
©
I
r,.)<
t"q
Z
[.-,r,..)
¢'q
19

ORIG{NAL PAGE
BLACK AND WHITE PHOTOGRAPH
0_
9
( 7:r'If'lOf) .kO_l__N_[9"LI _:'£1 gg _I_
I I I I
61:, L£ t,'_ _'II I l
(_N'3t)OV01
00
',CO
Ot ,
Z©F-,
r.¢3
©
¢..)
Z0
20

0"_
|'g
ORIGINAL PAGE
BLACK AND WHITE PHOTOGRAPH
z©[.-L.)
cf_
rd_
©
L.)
( 3"Irlof ) AO_l_'q_lg'LI Z'£[ 9"g I_'p 0
I I I I g
6"P' L'£ _'Z Z'II I l I
(N)I )(1VO'I 0
_0
v
,0 F-.oi
0
i
r,j<
r:
Z
2i

(HqflO[ ) AD_IBNH0"_, gL l _'£ 1 gg t:"t_ 0
I . I I I _o
ORIGINAL PAGEBLACK AND WHITE PHOTOGRAPH
Z©[.-rj
oo
©
(J
I I Ii9 (NM )ovoq
I
r._
o
i
rj<
,d
Z
22

OZ_
19
( 33flOf ) AO_I3N_g'LI _'£I g'g _,17 0
I I I I o
ORIGINAL PAGE
BLACK AND WHITE PHOTOGRAPH
z©[.._,r,.)
©
617I
J
L'£ oI
( N)I ) (_VO"I ot T
[-,,D
c.)<
¢'!.
Z
r_
23

0"_i;
19
24
ORIQINAE PAGE
SLACK AND WHITE PHOTOGRAPH
Z©[-,r,j
r_C/3©
L_
( H_L_O[ ) xg_IHNH9"L! E'£1 g'g VI7 0
I I I I oao
1L£ 1;,_; _|I I I o
( N)I ) (]VO"I 0"1 T
k'N
,, ©
¢4
QD
Q.)<
¢",1r,i
:¢
Z
[.-,r,j
[-,z©
_=
r
z
E--
z

ORIGINAE PAGE
BLACK AND WHITE PHOTOGRAPH
,,o
,o p
en
ZOI
[..
r.,O
0
U
8<
o
0'!, ,
25

OI_IGINAU PAGE
BLACK AND WHITE PHOTOGRAPH
Z©[...,r,j
©
1-
26
I
Z
Z©

ORIGINAl_" PAGEBLACK AND WHITE PHOTOGRAPH
1"9
0o
o0| ,
z©
©
c_
<
©
2?

O'KK
28=
ORIGiNAE PAGE
BLACK AND WHITE PHOTOGRAPH
Z©
fj
r/)
©
L)
( "_"LQOf) .,_9_I3N'-,_9"LI _'£I gg 17'I;, 0
I I I I o
61;, L'£ I;"_ i_'l
I • I I o
ig ( N)! ) GVO"I oi 7
ao
=
_'2
Z
E
F
w.
--=

ORIGtNAE PAGE
BLACK AND WHITE PHOTOGRAPH
0_ g'LI _'£L g'g 1;,'17I I I I
/I
/
\
0o
Z©E-L_
©c_L_
v
G_
L)<C_
_Q
E-wL_
w,w
eq
b,Z©
29

7
.... i
r
_r
r
z
L

APPENDIX B
Cross-Sectional Photographs of the IM7/1939Front Surface Cracks
31
PRECEDING PAGE BLANK NOT FILMED Jt_NJl;NJJON_.J_

ORIGINAL PAGE
BLACK AND WHITE PHOTOGRAPH
32
c_
L_.<
_j
L,).<LI.
r./3
LI-,©
Z©m,,,.i
E-r,jLTj
(/}©
r,j
I---.
X
m
,.._4
LIj
r_
[..-,L><:
LT.©
Z©
[.-(JuJr.#3
c.f)
©
L.)
_. rlb
-- L)
m.0_- r..D
Z (,,;<
o
oz
_Z
c..;< .,e
<
ozo
U.
r
...............................
: _ : : : ±:: :: g±:: : =

ORIGINAL PAGE
BLACK AND WHITE PHOTOGRAPH
Oc-,I
<
©
Z
ob.<
Z
<N
0
r_
[-.,
<¢1..,
<
U..,©
z©[...,
©
r,.)
¢-q
¢1.,©
Z<
©
>
,.-1
Z<
0
r,j<
rO
<[..1.,
©Z©[.-
r./'3
©
r,j
r_
r_
r_.<
[.... _
O_
0
o
33

DRIGINAE PAGE
BLACK AND WHITE PHOTOGRAPH
34
0
rj<
L)[.L0Z0[-<r,j
Z0<
0
<
0Z0
0
_ r_v
o r_
Z
_u r_
i.k r.,l'J _©
>
o
< ;_.-
z_0_
r,.)z
× 0_.,
Nr,.)
N _
a, z
Z _
ce I[_o
z

REFERENCES
.
.
.
.
,
.
,
Winkel, J.D., and Adams, D.F.: "Instrumented Drop Weight Impact Testing of Cross-Ply and
Fabric Composites." Composites Vol. 16, October 1985, pp. 268-278.
Aleska, J.C.: "Low Energy Impact Behavior of Composite Panels." Journal of Testing and Evalua-
tion, Vol. 6, May 1978, pp. 202-210.
Sjoblom, P.O., Harntess, J.T., and Cordell, T. M.: "On Low-Velocity Impact Testing of Composite
Materials.'" Journal of Composite Materials, Vol. 22, January 1988, pp. 30-52.
Nettles, A.T.: "Instrumented Impact and Residual Tensile Strength Testing of Eight-Ply Carbon/
Epoxy Specimens." NASA TP 2981, January 1990.
Chang, F.K., Choi, H.Y., and Jeng, S.T." "Characterization of Impact Damage in Laminated" S "Composite.. SAMPE Journal Vol. 26, No. 1 January/February 1990.
Steilbrink, K.' "Examination of Impact Resistance of FRP-Suggestion for a Standard Test Method."
Mechanical Characterization of Load Bearing Fiber Composites and Laminates. Elsevir Applied
Science Publishers, A.H. Cardon and C. Verchery eds., London and New York.
Cantweli, W.J., and Morton, J." "Detection of Impact Damage in CFR Laminates." Composite
Structures, Vol. 3, 1985, pp. 241-257.
. Cantwell, W.J., Curtis, P.T., and Morton, J." "An Assessment of the Impact Performance of DFRP
Reinforced With High-Strain Carbon Fibers." Composite Science and Technology, Vol. 25, No. 2,
1986, pp. 133-148.
9. Wyrick, D.A., and Adams, D.F." "Damage Sustained by a Carbon/Epoxy Composite Material
Subjected to Repeated Impact." Composites, Vol. 19, No. !, January 1988.
_f

r,L +Iv ,, _ ++A, ++, + +,It +I, . i++_I
!,I + + ,'+It:m,, ,it ii. qP
Report Documentation Page
I+ Report No.
NASA TP- 3029
4. Title and Subtitle
I 2. Government Accession No.
Low Velocity Instrumented Impact Testing of Four New
Damage Tolerant Carbon/Epoxy Composite Systems
7. Author(s)
D.G. Lance and A.T. Nettles
9, Performing Organization Name and Address
George C. Marshall Space Flight Center
Marshall Space Flight Center, Alabama 35812
Sponsoring Agency Name and Address
National Aeronautics and Space Administration
Washington, D.C. 20546
3. Recipient's Catalog No.
5. Report Date
July 1990
6. Performing Organization Code
8. Performing Organization Report No.
10. Work Unit No.
M-636
11. Contract or Grant No.
13. Type of Report and Period Covered
Technical Paper
14. Sponsoring Agency Code
15, Supplementary Notes
Prepared by Materials and Processes Laboratory, Science and Engineering Directorate.
16 ,i_i_si ra_ i-
Low velocity drop weight instrumented impact testing was utilized to examine the damage
resistance of four recently developed carbon fiber/epoxy resin systems. A fifth material, T300/934,
for which a large data base exists, was also tested for comparison purposes. A 16-ply quasi-isotropic
lay-up configuration was used for all the specimens. Force/absorbed energy-time plots were
generated for each impact test. The specimens were cross-sectionally analyzed to record the damage
corresponding to each impact energy level. Maximum force of impact versus impact energy plots
were constructed to compare the various systems for impact damage resistance. Results show that
the four new damage tolerant fiber/resin systems far outclassed the T300/934 material. The most
damage tolerant material tested was the IM7/1962 fiber/resin system.
17. Key Words (Suggested by Author(s))
Composite Materials
Epoxy Resins
Damage Tolerance
Instrumented Impact Testing
19. Security Ctassif. (of this report)
Unclassified
18. Distribution Statement
Unclassified-Unlimited
Subject Category: 24
20. Security Classif. (of this page)
Unclassified
IASA FORM1626OCT86For sale by the National Technical Information Service,
21. No. of pages40
22 Price
A03
Springfield, VA 22161-2171
NASA-Langley, I_O
=
F