Spinal Cord, Spinal Nerves A&P lab Dr. Kandula. Anatomy of Spinal Cord.
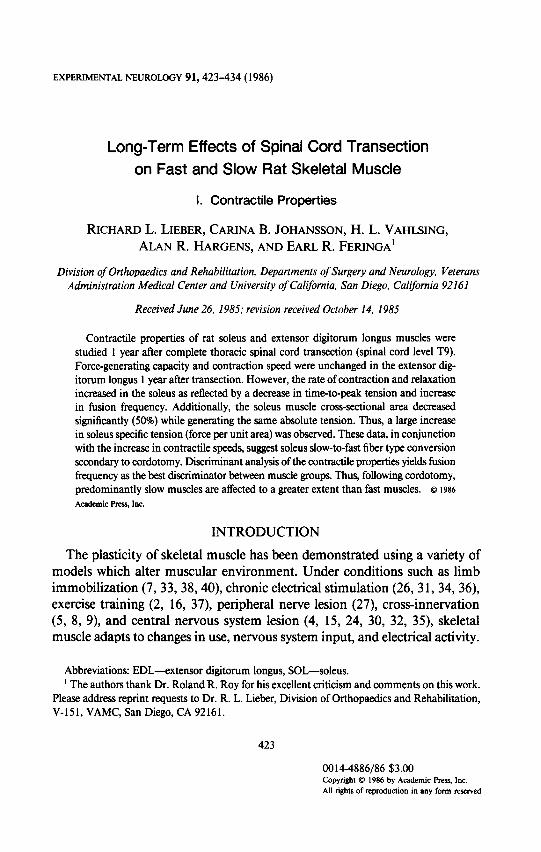
EXPERIMENTAL NEUROLOGY 91,423-434 (1986)
Long-Term Effects of Spinal Cord Transection on Fast and Slow Rat Skeletal Muscle
I. Contractile Properties
RICHARD L. LIEBER, CARINA B. JOHANSSON, H. L. VAHLSING, ALAN R.HARGENS,ANDEARLR. FERINGA’
Division of Orthopaedics and Rehabilitation, Departments of Surgery and Neurology, Veterans Administration Medical Center and University of California, San Diego, California 92161
Received June 26, 1985; revision received October 14, 1985
Contractile properties of rat soleus and extensor digitorum longus muscles were studied 1 year after complete thoracic spinal cord transection (spinal cord level T9). Force-generating capacity and contraction speed were unchanged in the extensor dig- itorum longus 1 year after transection. However, the rate of contraction and relaxation increased in the soleus as reflected by a decrease in time-to-peak tension and increase in fusion frequency. Additionally, the soleus muscle cross-sectional area decreased significantly (50%) while generating the same absolute tension. Thus, a large increase in soleus specific tension (force per unit area) was observed. These data, in conjunction with the increase in contractile speeds, suggest soleus slow-to-fast fiber type conversion secondary to cordotomy. Discriminant analysis of the contractile properties yields fusion frequency as the best discriminator between muscle groups. Thus, following cordotomy, predominantly slow muscles are affected to a greater extent than fast muscles. Q 1986
Academic PI-M, Inc.
INTRODUCTION
The plasticity of skeletal muscle has been demonstrated using a variety of models which alter muscular environment. Under conditions such as limb immobilization (7, 33,38,40), chronic electrical stimulation (26, 31, 34, 36), exercise training (2, 16, 37), peripheral nerve lesion (27), cross-innervation (5, 8, 9), and central nervous system lesion (4, 15, 24, 30, 32, 35), skeletal muscle adapts to changes in use, nervous system input, and electrical activity.
Abbreviations: EDL-e.xtensor digitorum longus, SOL-soleus. ’ The authors thank Dr. RolandR. Roy for his excellent criticism and comments on this work.
Please address reprint requests to Dr. R. L. Lieber, Division of Orthopaedics and Rehabilitation, V- 15 1, VAMC, San Diego, CA 92 16 1.
423
0014-4886/86 $3.00 Copyright 0 1986 by Academic Press, Inc. All rights of reproduction in any form reserved
424 LIEBER ET AL.
Previous studies of spinal cord transection in the rat (13) and cat (4, 32, 35) suggest that transection decreases muscle force-generating capacity. In addi- tion, contraction speed generally increases in “slow” muscle ( 13, 35) but re- mains unchanged in “fast” muscle (13,32,35). The short duration of previous studies relative to the life span of the animal (to 10% of life span) leave un- answered questions regarding the extent of muscle adaptation to spinal cord transection. Because of the relatively short life span of the rat (2 to 3 years), it is possible to use this model to study long-term effects of spinal cord tran- section
Using the rat transection model, we studied the loss of corticospinal neurons from 5 weeks after spinal cord transection to 25 weeks after transection (19, 20). To quantify further changes occurring after 25 weeks, we extended these observations to one year (21, 22), when muscle contractile properties were also evaluated. Although contractile properties of skeletal muscle are not the most sensitive indicator of muscle change, they indicate thefunctional significance of fiber type changes that occur secondary to cordotomy. Our purpose was thus to determine the contractile properties of the rat soleus (SOL) and extensor digitorum longus (EDL) 1 year (about 50% of the rat life span) following spinal cord transection.
METHODS
Experimental Preparation. An inbred isogeneic strain of Wistar rats was developed by brother-and-sister mating for more than 80 generations in order to decrease fiber type and size variability between rats (17). Two groups of rats were studied. Control rats (N = 14) were permitted normal growth for 1 year after entry into the study at age 6 weeks. At age 6 weeks [about 2 weeks after the muscle fiber types were differentiated (12)], experimental rats (N = 10) were anesthetized with acepromazine/ketamine ( 1 and 50 mg/ 100 g body mass, respectively). After T6/T7 laminectomy, the spinal cord and its coverings were completely transected with a scalpel. The completeness of the transection was verified by two investigators using the operating microscope while applying gentle traction to the animal’s head and tail. No portion of the spinal cord was removed. Longitudinal sections from the injured area in similarly treated rats have demonstrated that this procedure results in complete anatomic transection of the cord (17, 18).
Postoperative care of the cordotomized rats required special cage bedding to prevent pressure sores. Initially, there was a flaccid paraplegia with the limbs dragging behind the rats as they crawled about in the cage. They were able to move, using their forelimbs, and had no difficulty reaching food and water. During the first weeks, the bladder was emptied every 8 hours by the method of Crede. At approximately 3 to 4 weeks, the bladder became auto-
MUSCLE CONTRACTION AFTER CORDOTOMY 425
matic. During the same period, the paralyzed hind limbs of the animals changed from flaccid to spastic. After spasticity developed, the limbs were almost always held in extention. No recovery of voluntary activity was ob- served in the hindquarters of these animals.
Functional Evaluation. Prior to killing, each animal was evaluated clinically. In some animals, reflex movements of the hindquarters occurred in brief flurries of clonus-like activity. No spontaneous or stimulus-induced voluntary movements of the hindquarters were observed in any animal. This is in agree- ment with studies indicating that upper neuron regeneration in transected rats is meager to nonexistent (17, 18).
After clinical examination, intramuscular EMGs were recorded from both experimental and control animals. For comparative purposes, a group with lower motor neuron paralysis due to sciatic nerve transection was also studied. The experimental animals showed evidence of decreased motor activity but no evidence of lower motor neuron abnormalities, i.e., fibrillations, fascicu- lations, or positive waves. Animals with sciatic nerve transections demon- strated all these abnormalities. Thus, the EMG readings from the cordotomized rats were qualitatively similar to those found in upper motor neuron-paralyzed patients.
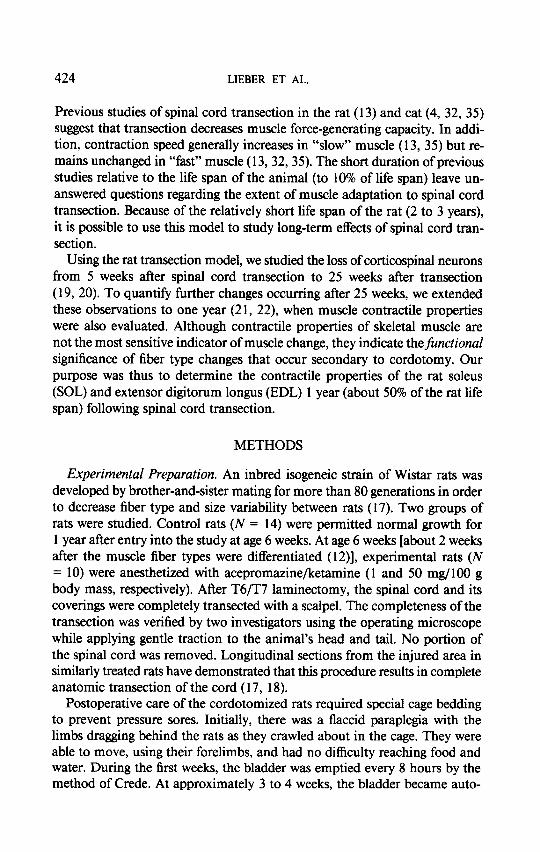
Measurement of Contractile Properties. The contractile properties of the SOL and EDL muscles were tested in both groups of rats at age 58 weeks using the apparatus shown in Fig. 1. Rats were anesthetized by injection of an acepromazine/ketamine cocktail (1 and 50 mg/lOO g body mass, i.p., re- spectively). In this apparatus, the distal femur and proximal tibia were im- mobilized using 1.2-mm Kirschner wires. The distal tendon of the EDL (or
FIG. 1. Experimental apparatus used to measure contractile properties in rat muscles. The distal femur and proximal tibia were immobilized with Kirschner wires. Contractile force from the distal portion of the soleus (SOL) or extensor digitorum longus (EDL) muscles was measured by the force transducer and acquired by the LSI-1 l/23+ data acquisition system.

426 LIEBER ET AL.
SOL) was attached to a force transducer using a clamp that minimized stress concentration at the transducer. The compliance of this testing system was about 10 pm/g and the resonant frequency 275 Hz. The intact peroneal (or tibial) nerve was stimulated under computer control to elicit muscle contrac- tion and the muscle force was acquired by the LSI-1 l/23+ minicomputer system (28).
After setting muscle length to that at which twitch tension is maximum (b,) by generating a length-twitch tension curve (3, lo), the following con- tractile properties were measured at room temperature (about 22°C): (i) time to peak tension (in ms), (ii) fusion frequency (in Hz), (iii) maximum tetanic tension (PO, in N), and (iv) twitch:tetanus ratio (Tw:Tet ratio).
Specific tension (force per unit area) was calculated by dividing the maxi- mum tetanic tension by the maximum muscle cross-sectional area measured morphometrically from the histologic sections. Contractile data were analyzed from digitized tension records. Time-to-peak tension values were determined by the computer analysis algorithm with a time resolution of 0.33 ms (data acquisition rate of 3000 Hz). To decrease the effect of signal noise, successive trace variation, and analog-to-digital converter resolution, three twitch traces were acquired from each muscle and averaged to yield one value for time to peak tension. Practical time resolution using this protocol was about 4 ms for each muscle. Fusion frequency was determined by stimulating the muscle from 5 Hz to 60 Hz in ~-HZ increments. The trace that showed minimal tension fluctuation at the stimulation frequency was defined as the fused tetanus. Typically, this value was determined with an accuracy of about 5 Hz. Maximum tetanic tension was determined by computer. To minimize error, the maximum tension values from three separate traces were averaged to obtain a single value for maximum tension.
Statistical Analysis. Contractile properties of the SOL and EDL were an- alyzed separately using BMDP program PlV ( 14). For each parameter listed above, a one-way ANOVA was used to compare a given parameter (see above) across all four muscle groups (normal-SOL, transected-SOL, normal-EDL, and transected-EDL). After the preliminary one-way ANOVA, multiple t tests were carried out between all possible pairs of means. Thus, values presented for P include compensation for the number of tests conducted (39). Differences between groups were considered significant for P values < 0.05. After the ANOVA, discriminant analysis was carried out using BMDP program P7M with F-to-enter = 4.000 and F-to-remove = 3.996. This was to determine the contractile parameter(s) that best differentiate(s) between the four muscle groups.
RESULTS
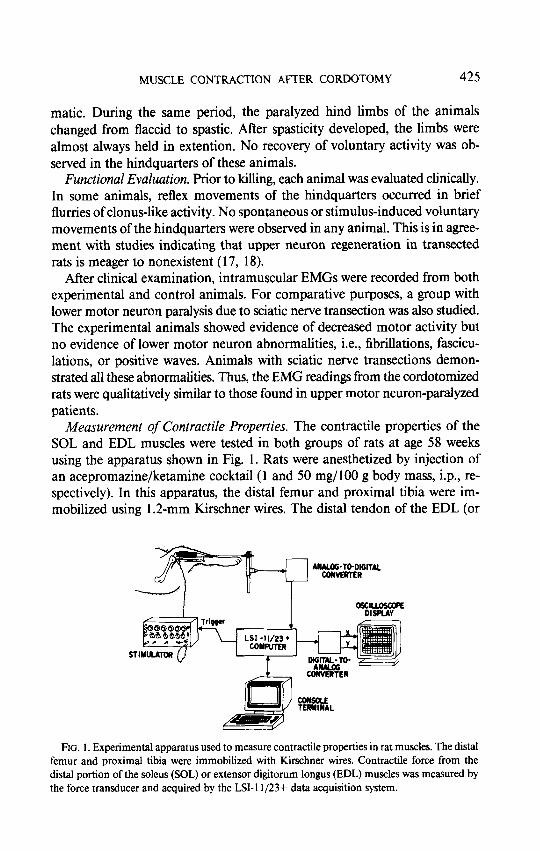
The responses of the SOL from normal and transected rats stimulated at 5 and 10 Hz are shown in the upper and lower panels of Fig. 2, respectively.
MUSCLE CONTRACTION AFfER CORDOTOMY 427
Normal Soleus
Transected Soleus
FIG. 2. Contractile records from normal SOL (upper panel) and transected SOL (lower panel). Both muscles were stimulated at 5 and 10 Hz. Note that the transected SOL showed more complete relaxation and greater tension implying faster contraction-relaxation time. Vertical calibration bar = 0.61 N, horizontal calibration bar = 180 ms.
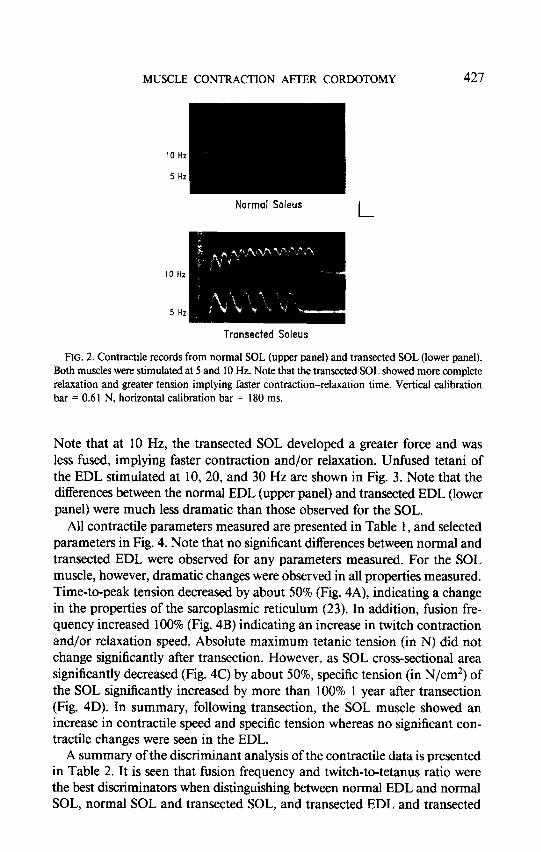
Note that at 10 Hz, the transected SOL developed a greater force and was less fused, implying faster contraction and/or relaxation. Unfused tetani of the EDL stimulated at 10, 20, and 30 Hz are shown in Fig. 3. Note that the differences between the normal EDL (upper panel) and transected EDL (lower panel) were much less dramatic than those observed for the SOL.
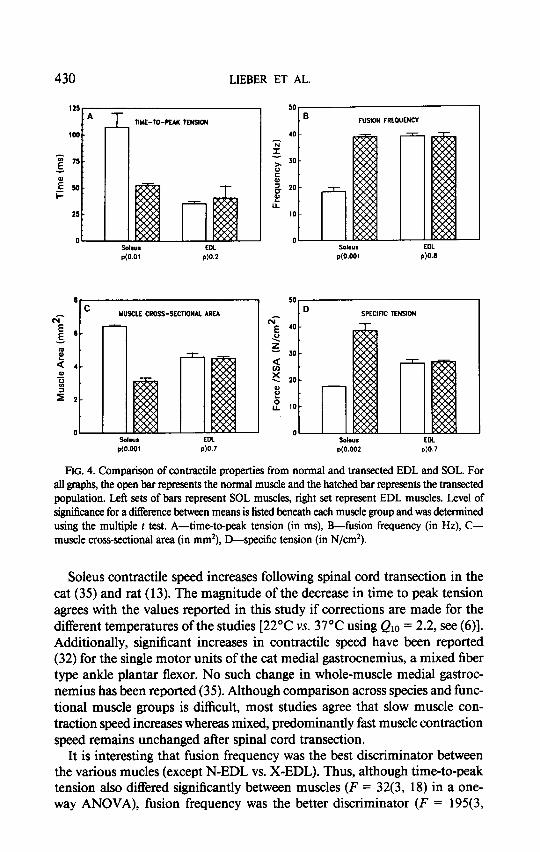
All contractile parameters measured are presented in Table 1, and selected parameters in Fig. 4. Note that no significant differences between normal and transected EDL were observed for any parameters measured. For the SOL muscle, however, dramatic changes were observed in all properties measured. Time-to-peak tension decreased by about 50% (Fig. 4A), indicating a change in the properties of the sarcoplasmic reticulum (23). In addition, fusion fre- quency increased 100% (Fig. 4B) indicating an increase in twitch contraction and/or relaxation speed. Absolute maximum tetanic tension (in N) did not change significantly after transection. However, as SOL cross-sectional area significantly decreased (Fig. 4C) by about 50%, specific tension (in N/cm2) of the SOL significantly increased by more than 100% 1 year after transection (Fig. 4D). In summary, following transection, the SOL muscle showed an increase in contractile speed and specific tension whereas no significant con- tractile changes were seen in the EDL.
A summary of the discriminant analysis of the contractile data is presented in Table 2. It is seen that fusion frequency and twitch-to-tetanus ratio were the best discriminators when distinguishing between normal EDL and normal SOL, normal SOL and transected SOL, and transected EDL and transected
428
Normal EDL
L
Transected EDL
FIG. 3. Contractile records from normal EDL (upper panel) and transected EDL (lower panel). Both muscles were stimulated at 10, 20, and 30 Hz. Qualitative differences between normal and transected muscles were not as dramatic as those observed with the SOL muscle. Vertical calibration bar = 0.49 N, horizontal calibration bar = 180 ms.
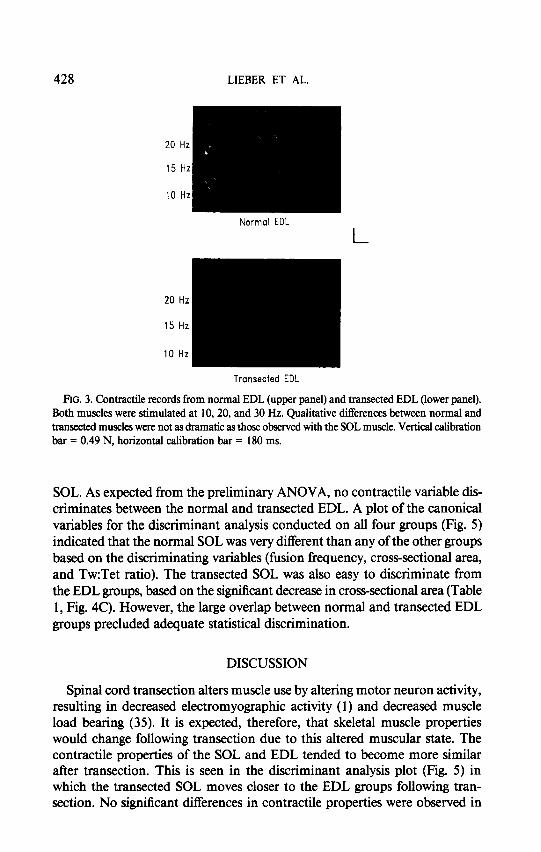
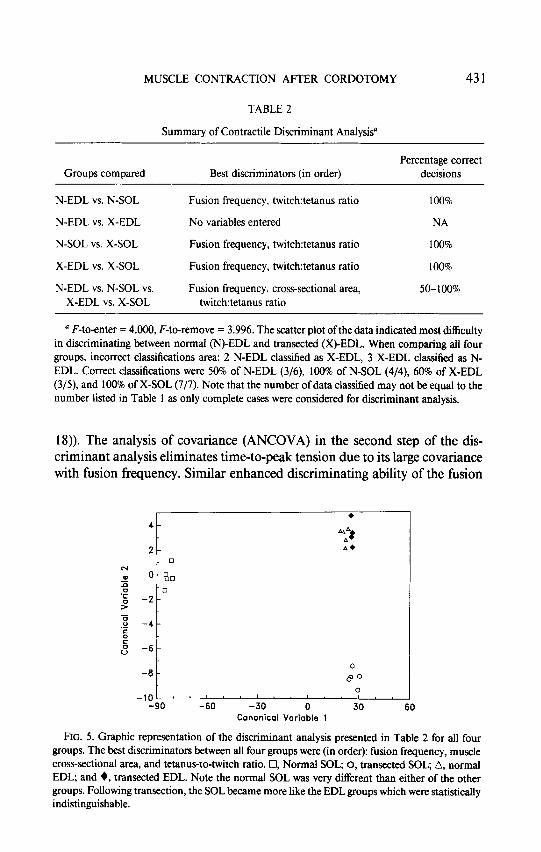
SOL. As expected from the preliminary ANOVA, no contractile variable dis- criminates between the normal and transected EDL. A plot of the canonical variables for the discriminant analysis conducted on all four groups (Fig. 5) indicated that the normal SOL was very different than any of the other groups based on the discriminating variables (fusion frequency, cross-sectional area, and Tw:Tet ratio). The transected SOL was also easy to discriminate from the EDL groups, based on the significant decrease in cross-sectional area (Table 1, Fig. 4C). However, the large overlap between normal and transected EDL groups precluded adequate statistical discrimination.
DISCUSSION
Spinal cord transection alters muscle use by altering motor neuron activity, resulting in decreased electromyographic activity (1) and decreased muscle load bearing (35). It is expected, therefore, that skeletal muscle properties would change following transection due to this altered muscular state. The contractile properties of the SOL and EDL tended to become more similar after transection. This is seen in the discriminant analysis plot (Fig. 5) in which the transected SOL moves closer to the EDL groups following tran- section. No significant differences in contractile properties were observed in

MUSCLE CONTRACTION AFTER CORDGTOMY 429
TABLE 1
Summary of Contractile Data from Four Groups of Rat Musclesa
Parameter Normal EDL
@EM, NJ Normal SOL
(SW NJ Xsected EDL
@EM, NJ Xsected SOL
(SEW W
Time-to-peak tension (ms)
35.2 -* 107 *- 40.7 o-----o 52.5 (2.61, 9) (13.4, 6) (4.68, 6) (2.21, 8)
0 0
* *
Maximum force (N)
1.27 *-* 1.15 *- 1.19 m 1.19 (0.05 1, 9) (0.016, 6) (0.005 1, 7) (0.025, 8)
0 0 0 0
Cross-sectional 0.0456 *A 0.0641 *-* 0.0447 - 0.0312 area (cm2) (0.0025,6) (0.001, 4) (0.001, 6) (0.002, 8)
0 0
Twitch:tetanus 0.596 t-e 0.160 t--l 0.719 t- L 0.380 ratio (0.038, 9) (0.028, 6) (0.064, 6) (0.039, 8)
0 0 * *
Fusion frequency 0-W
38.9 t-------e 18.3 - 38.6 -0 38.8 (1.11, 9) (1.67, 6) (1.43, 7) (0.8 18, 8)
0 0
0 0
Specific tension 26.3 *-* 17.5 *- * 26.8 *-* 38.6 PVcm2) (1.35, 6) (0.314, 4) (0.643, 6) (2.52, 7)
0 0
0 Mean values are connected by asterisks if the means differed significantly (P < 0.05) or by open circles if the means were not significantly different.
the EDL after transection. This can be appreciated graphically by the large overlap in normal EDL and transected EDL properties (Fig. 5). The SOL, however, demonstrated dramatic contractile changes. A large decrease in time to peak tension and increase in fusion frequency suggest a large degree of slow-to-fast fiber type transformation. This hypothesis is supported by the observation that, although the muscle cross-sectional area decreased more than 50%, no change in PO was observed. Thus, the large increase in specific tension (from 18 to 39 N/cm*, Fig. 4D) probably reflects the larger specific tension of fast versus slow muscle fibers in rat (11).
430 LIEBER ET AL.
125
1 A 1, TINE-TO-PEAK TENSION
EOL
PlO.2
YUSCLf CROSS-SECTIONAL AREA
Sd.“,
p(0.001
EOL
dO.7
FUSION FREWENCY
p(O.001 P10.5
- ID SPECIFIC TENSION
Sol.“,
p(O.002
EOL
dO.7
FIG. 4. Comparison of contractile properties from normal and transected EDL and SOL. For all graphs, the open bar represents the normal muscle and the hatched bar represents the transected population. Left sets of bars represent SOL muscles, right set represent EDL muscles. Level of significance for a difI&ence between means is listed beneath each muscle group and was determined using the multiple t test. A-time-to-peak tension (in ms), B-fusion frequency (in Hz), C- muscle cross-sectional area (in mm’), D-specific tension (in N/cm*).
Soleus contractile speed increases following spinal cord transection in the cat (35) and rat ( 13). The magnitude of the decrease in time to peak tension agrees with the values reported in this study if corrections are made for the different temperatures of the studies [22”C vs. 37°C using Q,o = 2.2, see (6)]. Additionally, significant increases in contractile speed have been reported (32) for the single motor units of the cat medial gastrocnemius, a mixed fiber type ankle plantar flexor. No such change in whole-muscle medial gastroc- nemius has been reported (35). Although comparison across species and func- tional muscle groups is difficult, most studies agree that slow muscle con- traction speed increases whereas mixed, predominantly fast muscle contraction speed remains unchanged after spinal cord transection.
It is interesting that fusion frequency was the best discriminator between the various mucles (except N-EDL vs. X-EDL). Thus, although time-to-peak tension also differed significantly between muscles (F = 32(3, 18) in a one- way ANOVA), fusion frequency was the better discriminator (F = 195(3,
MUSCLE CONTRACTION AFTER CORDOTOMY 431
TABLE 2
Summary of Contractile Discriminant Analysis0
Groups compared Best discriminators (in order) Percentage correct
decisions
N-EDL vs. N-SOL
N-EDL vs. X-EDL
N-SOL vs. X-SOL
X-EDL vs. X-SOL
N-EDL vs. N-SOL vs. X-EDL vs. X-SOL
Fusion frequency, twitch:tetanus ratio
No variables entered
Fusion frequency, twitchtetanus ratio
Fusion frequency, twitch:tetanus ratio
Fusion frequency, cross-sectional area, twitch:tetanus ratio
100%
NA
100%
100%
50-100%
’ F-to-enter = 4.000, F-to-remove = 3.996. The scatter plot ofthe data indicated most difficulty in discriminating between normal (N)-EDL and transected (X)-EDL. When comparing all four groups, incorrect classifications area: 2 N-EDL classified as X-EDL, 3 X-EDL classified as N- EDL. Correct classifications were 50% of N-EDL (3/6), 100% of N-SOL (4/4), 60% of X-EDL (3/5), and 100% of X-SOL (7/7). Note that the number of data classified may not be equal to the number listed in Table 1 as only complete cases were considered for discriminant analysis.
18)). The analysis of covariance (ANCOVA) in the second step of the dis- criminant analysis eliminates time-to-peak tension due to its large covariance with fusion frequency. Similar enhanced discriminating ability of the fusion
L 0 c-4 0 o-90 .a .P 0 :, -2- > z 2 -4- 5 6 u -&
0 -0 - 80
Cl -lo-_ . I- ’ . ‘- ’ ’ ’
-90 -60 -30 0 30 60 Canonical Variable 1
FIG. 5. Graphic representation of the discriminant analysis presented in Table 2 for all four groups. The best discriminators between all four groups were (in order): fusion frequency, muscle cross-sectional area, and tetanus-to-twitch ratio. Cl, Normal SOL, 0, transected SOL; A, normal EDL; and +, transected EDL. Note the normal SOL was very different than either of the other groups. Following transection, the SOL became more like the EDL groups which were statistically indistinguishable.
432 LIEBER ET AL.
frequency parameter was shown by Roy et al. (35) in which a clear shift is seen in the tension-frequency plots with no significant difference in contraction time.
Relative Tw:Tet ratios of EDL and SOL muscle (Table 1) were reversed relative to those reported in the literature for skeletal muscle at 22°C. The reason for this discrepancy is not clear. Possibly, the relatively large compliance of our measuring system (10 pm/g) masked the small twitch forces of the SOL (25) resulting in unusually small values for the SOL Tw:Tet ratio. The physiologic significance of the Tw:Tet ratio is not completely understood (12). An increase in speed of contraction and relaxation would be expected to increase twitch tension relative to tetanic tension thus increasing the Tw: Tet ratio. Additionally, slow-to-fast fiber type transformation would be ex- pected to increase both the tetanic and twitch tension due to the larger specific tension of fast vs. slow fibers. Tetanic tension would increase to a greater extent than the twitch due to the steeper length-tetanic-tension relationship vs. the length-twitch-tension relationship (3). The combined effect of the in- crease in speed and fiber type transformation would thus increase the Tw:Tet ratio which was observed for the SOL, and, to a lesser extent, the EDL (Table 1). Therefore, although the absolute Tw:Tet ratios do not agree with the lit- erature values, the change in ratio following transection is reasonable.
The maintenance of force-generating capacity reported here for both the EDL and SOL is contrary to most studies. A 20 to 60% decrease in PO after cordotomy was reported in the cat (32, 35). (It may be difficult to compare the cat studies with the rat data presented here as the specific tension of fast and slow muscle fibers from the cat differ from those in the rat and the du- rations of the studies are not comparable.) The fact that the SOL maintained absolute force-generating capacity accompanied by a 50% decrease in SOL cross-sectional area implies that the muscle fibers of the SOL significantly increased their specific tension after transection. These data are explained in conjunction with the morphometric data presented in the following re- pod (2%
REFERENCES
1. ALAIMO, M. A., J. L. SMITH, R. R. ROY, AND V. R. EDGERTON. 1984. EMG activity of slow and fast ankle extensors following spinal cord transection. J. Appl. Physioi.: Resp. Environ. Exercise Physiol. 56: 1608- 16 13.
2. ANDERSEN, P., AND J. HENRIKSSON. 1977. Training induced changes in the subgroups of human type II skeletal muscle fibres. Actu Physiol. &and. 99: 123-125.
3. BAHLER, A. S., J. T. FALES, AND K. L. ZIERLER. 1968. The active state of skeletal muscle. J. Gen. Physiol. 51: 2239-2253.
4. BALDWIN, K. M., R. R. ROY, R. D. SACKS, C. BLANCO, AND V. R. EDGERTON. 1984. Relative independence of metabolic enzymes and neuromuscular activity. J. Appl. Physiol.: Respir. Environ. Exercise Physiol. 56(6): 1602-1607.
MUSCLE CONTRACTION AFTER CORDGTOMY 433
5. BARANY, M., AND R. I. CLOSE. 1970. The transformation of myosin in cross-innervated rat muscles. J. Physiol. (London) 213: 455-474.
6. BENNETT, A. F. 1984. Thermal dependence of muscle function. Am. J. Physiol. 247: R2 17- R229.
7. BOOTH, F. W., AND J. R. KELSO. 1973. Effect of hind-limb immobilization on contractile and histochemical properties of skeletal muscle. Pfltigers Arch. 342: 23 l-238.
8. BULLER, A. J., J. C. ECCLES, AND R. M. ECCLES. 1960. Differentiation of fast and slow muscles in the cat hindlimb. J. Physiol. (London) 150: 399-416.
9. BULLER, A. J., J. C. ECCLES, AND R. M. ECCLES. 1960. Interactions between motorneurons and muscles in respect to the characteristic speeds of their responses. J. Physiol. (London) 150: 417-439.
10. BURKE, R. E., D. N. LEVINE, P. TSAIRIS, AND F. E. ZAJAC. 1973. Physiological types and histochemical profiles in motor units of the cat gastrocnemius. J. Physiol. (London) 234: 723-748.
11. CLOSE, R. 1969. Dynamic properties of fast and slow skeletal muscles of the rat after nerve cross-union. J. Physiol. (London) 204: 33 l-346.
12. CLOSE, R. I. 1972. Dynamic properties of mammalian skeletal muscles. Physiol. Rev. 52: 129-197.
13. DAVEY, D. F., C. DUNLOP, J. F. Y. HOH, AND S. Y. P. WONG. 198 1. Contractile properties and ultrastructure of extensor digitorum longus and soleus muscles in spinal cord transected rats. Aust. J. Exp. Biol. Med. Sci. 59: 383-404.
14. DIXON, W. J. 1983. BMDP Statistical Software. Univ. of California Press, Los Angeles. 15. EDGERTON, V. R., L. A. SMITH, E. ELDRED, T. C. COPE, AND L. M. MENDELL. 1980. Muscle
motor unit properties of exercised and non-exercised chronic spinal cats. Pages 355-371 in D. PETrE, Ed., Plasticity of Muscle. de Gruyter, New York.
16. EDGERTON, V. R. 1978. Mammalian muscle fiber types and their adaptability. Am. Zool. 18: 113-125.
17. FERINGA, E. R., W. K. KINNING, A. G. BRITTEN, AND H. L. VAHLSING. 1976. Recovery in rats after spinal cord injury. Neurology 26: 839-843.
18. FERINGA, E. R., S. W. DAVIS, H. L. VAHLSING, AND L. M. SHUER. 1978. Fink-Heimer/ Nauta demonstration of regenerating axons in the rat spinal cord. Arch. Neural. 35: 522- 526.
19. FERINGA, E. R., H. L. VAHLSING, AND B. E. SMITH. 1983. Retrograde transport in corticospinal neurons after spinal cord transection. Neurology 33: 478-482.
20. FERINGA, E. R., W. J. GILBERTIE, AND H. L. VAHLSING. 1984. Histologic evidence for death of cortical neurons aRer spinal cord transection. Neurology 34: 1002-1006.
21. FERINGA, E. R., AND H. L. VAHLSING. 1985. Labeled corticospinal neurons one year after spinal cord transection. Neurosci. Lett. 58: 283-286.
22. FERINGA, E. R., AND H. L. VAHLSING. 1985. Corticospinal neurons one year after spinal cord transection. Neurology 35(Suppl. 1): 246.
23. Rrrs, R. H., W. W. WINDER, M. H. BROOKE, K. K. KAISER, AND J. 0. HOLLOSZY. 1980. Contractile, biochemical, and histochemical properties of thyrotoxic rat soleus muscle. Am. J. Physiol. (Cell Physiol.) I: C 15-C20.
24. GRIMBY, G., C. BROBERG, I. KROTKIEWSKA, AND M. KROTKIEWSKA. 1976. Muscle fiber composition in patients with traumatic cord lesion. Scund. J. Rehab. Med. 8: 37-42.
25. HILL, A. V. 1970. First and Last Experiments in Muscle Mechanics, pp. 36-37. Cambridge Univ. Press, Cambridge.
26. HUDLICKA, O., K. R. TYLER, T. SRIHARI, A. HEILIG, AND D. PEITE. 1982. The effect of different patterns of long-term stimulation on contractile properties and myosin light chains in rabbit fast muscles. Pjh’igers Arch 393: 164- 170.
434 LIEBER ET AL.
27. KEAN, C. J. C., D. M. L~w-rs, AND J. D. MCGARRICK. 1974. Dynamic properties ofdenervated fast and slow twitch muscle of the cat. J. Physiol. (London) 237: 103- 113.
28. LIEBER, R. L., D. E. SMITH, AND A. R. HARGENS. 1986. On-line acquisition and analysis of skeletal muscle contraction in a multi-user environment. Camp. Meth. Prog. Biomed., in Press.
29. LIEBER, R. L., J. 0. FRIDBN, A. R. HARGENS, AND E. R. FERINGA. 1986. Long-term effects of spinal cord transection on fast and slow tat skeletal muscle. II. Morphomettic properties. Exp. Neural. 91: 435-448.
30. LOFTON, S., J. MUNSON, G. SYPERT, AND R. FOEHRY. 1982. Altered distribution of motor unit types following spinal transection. Sot. Neurosci. Abstr. 8: 966.
31. LOMO, T., R. H. WESTGAARD, AND L. ENGELBRETSEN. 1980. Different stimulation patterns affect contractile properties of denervated rat soleus muscles. Pages 297-309 in D. PETTE, Ed., Plasticity of Muscle, de Gruyter, New York.
32. MAYER, R. F., R. E. BURKE, J. TOOP, B. WALMSLEY, AND J. A. HODGSON. 1981. The effect of spinal cord transection on the motor units in cat medial gastrocnemius muscles. Muscle Nerve 7: 23-3 1.
33. MATER, R. F., R. E. BURKE, J. TOOP, J. A. HODGSON, K. KANDA, AND B. WALMSLEY. 1981. The effect of long-term immobilization on the motor unit population of the cat medial gastrocnemius muscle. Neuroscience 6: 725-739.
34. PIXIE, D., M. SMITH, H. STAUDTE, AND G. VRBOVA. 1973. Effects of long-term electrical stimulation on some contractile and metabolic characteristics of fast rabbit muscles. fltigers Arch. 338: 257-272.
35. ROY, R. R., R. D. SACKS, K. M. BALDWIN, M. SHORT, AND V. R. EDGERTON. 1984. Inter- relationships of contraction time, V,, and myosin ATPase after spinal transection. J. Appl. Physiol.: Respir. Environ. Exercise Physiol. 56: 1594-160 1.
36. SALMONS, S., AND F. A. STRETER. 1976. Si8niticance of impulse activity in the transformation of skeletal muscle type. Nature 263: 30-34.
37. SALMONS, S., AND J. HENRIKSSO N. 198 1. The adaptive response of skeletal muscle to increased use. Muscle Nerve 4: 94-105.
38. SIMARD, C. P., S. A. SPECTOR, AND V. R. EDGERTON. 1982. Contractile properties of rat hindlimb muscles immobilized at different lengths. Exp. Neural. 77: 467-482.
39. SOKOL, R. R., AND F. J. ROHLF. 1969. Biometry. Freeman, San Francisco. 40. SPECTOR, S. A., C. P. SIMARD, M. FOURIER, E. STERNLICHT, AND V. R. EDGERTON. 1982.
Architectural alterations of rat hind-limbs skeletal muscles immobilized at ditTerent lengths. Exp. Neural. 76: 94-l 10.