Long-range Electron Transfer in Biology · RR RPP P l −∆G° k° ET Figure 1 Driving ......
12
Long-range Electron Transfer in Biology Jay R. Winkler California Institute of Technology, Pasadena, CA, USA 1 Introduction 1 2 Electron-transfer Theory 1 3 Chemically Modified Proteins 3 4 Protein – Protein Reactions 6 5 Photosynthesis and Respiration 8 6 Concluding Remarks 10 7 Related Articles 10 8 References 10 1 INTRODUCTION Electron-transfer (ET) reactions, the simplest chemical transformations, play vital roles in a diverse ensemble of biological processes. Biological electron transfer is an extraordinarily vibrant field of inquiry, responsible for thousands of original research articles during the past decade. This chapter will focus on studies of ET in chemically modified proteins, protein – protein complexes, and two key biological energy transduction pathways, photosynthesis (see Photosynthesis) and respiration (see Cytochrome Oxidase). Aerobic organisms derive most of the energy needed for life processes by the burning of foodstuffs with molecular oxygen in air. 1 In the first part of the respiratory process, hydrogen atoms are extracted from organic molecules. The hydrogen carriers provide reducing equivalents to the respiratory chain located in cell organelles (mitochondria) or, in bacteria, in the cell membrane. These chains consist of a series of membrane- bound protein complexes in which the hydrogen atoms are split into protons and electrons. The electrons are passed down the chain and reduce molecular oxygen to water, whereas protons are left behind on one specific side of the membrane. In addition, the electron current through the chain is coupled to the pumping of additional protons from water to the same side of the membrane. 2 The two proton currents lead to an increased positive charge and decreased pH on this side. The resulting electrochemical potential across the membrane drives the synthesis of ATP, the universal energy currency of living cells. Photosynthesis is the natural complement to respiration. Photons from the sun induce charge separation in a membrane- bound redox chain, ultimately producing a transmembrane potential for ATP synthesis. In green plants, algae, and cyanobacteria, the photogenerated holes oxidize water to oxygen. The photochemically generated reducing equivalents produce NADPH that, along with ATP, is used in carbon dioxide fixation. Highly optimized ET reactions are essential for the operation of these biochemical machines. Much of the research on biological electron transfer aims to define the electronic and structural factors that regulate the rates and efficiencies of these essential transformations. This chapter will focus on studies of ET through proteins, particularly metalloproteins. ET processes involving DNA molecules have been the subject of extensive research as well, 3–6 but this work is beyond the scope of this chapter. 2 ELECTRON-TRANSFER THEORY The unique simplicity of ET reactions has fostered the development of a powerful theoretical formalism that describes the rates of these processes in terms of a small number of parameters. 7 The conceptual breakthrough that led to the development of ET theory involved the recognition of the pivotal role played by the Franck – Condon principle. 8,9 Owing to the much higher electron velocities, nuclei remain fixed during the actual electron transfer from donor to acceptor. The transition state for this reaction must lie at a point in nuclear-configuration space where the reactant and product states are degenerate (Figure 1). Hence, through fluctuations of the reacting molecules and their surroundings, the transition- state configuration will be reached and an electron can transfer. 2.1 Activation Barriers According to classical (Marcus) theory, the activation barrier for an adiabatic ET reaction depends on two parameters, the driving force (−G ◦ ) and the reorganization energy (λ). 7 The reorganization parameter reflects the extent of outer- sphere (λ OUT ) and inner-sphere (λ IN ) nuclear rearrangement that accompanies charge transfer. The λ values for a cross reaction between two different reagents can be estimated from the average of the electron self-exchange reorganization energies for each redox partner (i.e. λ 12 ≈ λ 11 /2 + λ 22 /2). The unique prediction from Marcus theory is that rates reach a maximum when the driving force equals the reorganization energy. At higher driving forces, rates are predicted to decline (inverted effect) owing to less favorable Franck–Condon factors for the electron transfer. The central lesson of classical theory is that nuclear rearrangements accompanying ET must be compensated by reaction driving force (Figure 1). The balance between G ◦ and λ is a direct consequence of protein structure. Electron transfer in proteins generally involves redox centers separated by long distances. The electronic interaction
Transcript of Long-range Electron Transfer in Biology · RR RPP P l −∆G° k° ET Figure 1 Driving ......

Long-range ElectronTransfer in Biology
Jay R. WinklerCalifornia Institute of Technology, Pasadena, CA, USA
1 Introduction 12 Electron-transfer Theory 13 Chemically Modified Proteins 34 Protein–Protein Reactions 65 Photosynthesis and Respiration 86 Concluding Remarks 107 Related Articles 108 References 10
1 INTRODUCTION
Electron-transfer (ET) reactions, the simplest chemicaltransformations, play vital roles in a diverse ensembleof biological processes. Biological electron transfer is anextraordinarily vibrant field of inquiry, responsible forthousands of original research articles during the past decade.This chapter will focus on studies of ET in chemicallymodified proteins, protein–protein complexes, and two keybiological energy transduction pathways, photosynthesis (seePhotosynthesis) and respiration (see Cytochrome Oxidase).
Aerobic organisms derive most of the energy needed for lifeprocesses by the burning of foodstuffs with molecular oxygenin air.1 In the first part of the respiratory process, hydrogenatoms are extracted from organic molecules. The hydrogencarriers provide reducing equivalents to the respiratory chainlocated in cell organelles (mitochondria) or, in bacteria, in thecell membrane. These chains consist of a series of membrane-bound protein complexes in which the hydrogen atoms are splitinto protons and electrons. The electrons are passed down thechain and reduce molecular oxygen to water, whereas protonsare left behind on one specific side of the membrane. Inaddition, the electron current through the chain is coupled tothe pumping of additional protons from water to the sameside of the membrane.2 The two proton currents lead to anincreased positive charge and decreased pH on this side.The resulting electrochemical potential across the membranedrives the synthesis of ATP, the universal energy currency ofliving cells.
Photosynthesis is the natural complement to respiration.Photons from the sun induce charge separation in a membrane-bound redox chain, ultimately producing a transmembranepotential for ATP synthesis. In green plants, algae, and
cyanobacteria, the photogenerated holes oxidize water tooxygen. The photochemically generated reducing equivalentsproduce NADPH that, along with ATP, is used in carbondioxide fixation.
Highly optimized ET reactions are essential for theoperation of these biochemical machines. Much of the researchon biological electron transfer aims to define the electronicand structural factors that regulate the rates and efficienciesof these essential transformations. This chapter will focus onstudies of ET through proteins, particularly metalloproteins.ET processes involving DNA molecules have been the subjectof extensive research as well,3–6 but this work is beyond thescope of this chapter.
2 ELECTRON-TRANSFER THEORY
The unique simplicity of ET reactions has fosteredthe development of a powerful theoretical formalism thatdescribes the rates of these processes in terms of a smallnumber of parameters.7 The conceptual breakthrough that ledto the development of ET theory involved the recognition ofthe pivotal role played by the Franck–Condon principle.8,9
Owing to the much higher electron velocities, nuclei remainfixed during the actual electron transfer from donor to acceptor.The transition state for this reaction must lie at a pointin nuclear-configuration space where the reactant and productstates are degenerate (Figure 1). Hence, through fluctuations ofthe reacting molecules and their surroundings, the transition-state configuration will be reached and an electron can transfer.
2.1 Activation Barriers
According to classical (Marcus) theory, the activationbarrier for an adiabatic ET reaction depends on two parameters,the driving force (−�G◦) and the reorganization energy (λ).7
The reorganization parameter reflects the extent of outer-sphere (λOUT) and inner-sphere (λIN) nuclear rearrangementthat accompanies charge transfer. The λ values for a crossreaction between two different reagents can be estimatedfrom the average of the electron self-exchange reorganizationenergies for each redox partner (i.e. λ12 ≈ λ11/2 + λ22/2).The unique prediction from Marcus theory is that rates reacha maximum when the driving force equals the reorganizationenergy. At higher driving forces, rates are predicted to decline(inverted effect) owing to less favorable Franck–Condonfactors for the electron transfer. The central lesson of classicaltheory is that nuclear rearrangements accompanying ET mustbe compensated by reaction driving force (Figure 1). Thebalance between �G◦ and λ is a direct consequence ofprotein structure.
Electron transfer in proteins generally involves redoxcenters separated by long distances. The electronic interaction

2 LONG-RANGE ELECTRON TRANSFER IN BIOLOGY
0 0.5l 1.5l 2.0l
k ET
R R RP P P
l
−∆G°
k°ET
Figure 1 Driving-force dependence of ET rates predicted bysemiclassical theory (equation 1). Rates increase with driving forceuntil they reach a maximum value (k◦
ET) at −�G◦ = λ. Rates thendecrease at higher driving forces (inverted effect)
between redox sites is relatively weak and the transition statefor the ET reaction must be formed many times before there is asuccessful conversion from reactants to products; the processis electronically nonadiabatic. A Landau–Zener treatmentof the reactant-product transition probability produces thefamiliar semiclassical expression for the rate of nonadiabaticelectron transfer between a donor (D) and acceptor (A) heldat fixed distance (equation 1).7 Biological electron flow overlong distances with a relatively small release of free energyis possible because the protein fold creates a suitable balancebetween �G◦ and λ as well as adequate electronic couplingbetween distant redox centers.
kET =√
4π3
h2λRTH 2
AB exp
{− (�G◦ + λ)2
4λRT
}(1)
2.1.1 Redox Potentials
The reduction potentials of redox-active proteins areexquisitely sensitive to the structure of the polypeptide.10–13
It is well known that homologous proteins from differentorganisms can have quite disparate amino acid sequencesyet nearly identical three-dimensional structures.14,15 Nev-ertheless, single-point mutations can destroy redox functionwithout disrupting structure. Indeed, substitution of a singleamino acid in myoglobin can shift the Fe(III/II) reductionpotential by as much as 200 mV, effecting greater than athousand-fold change in the equilibrium constant for reactionwith a redox partner.16
The secondary and tertiary structures of a protein canmodulate the reduction potential of a single cofactor bymore than 500 mV. The Fe(III/II) reduction potential of afree heme in aqueous solution is approximately −200 mVversus the normal hydrogen electrode (NHE), the potential of
cytochrome c is 260 mV, and that of cytochrome f reaches450 mV.17 The shift in reduction potential is reflected in adifferential folding free energy of the oxidized and reducedproteins.18 In the case of cytochrome f , the Fe(II) proteinis more stable toward unfolding than the oxidized protein;19
the redox potential indicates a stability differential of some650 meV (63 kJ mol−1). In order for cytochrome f to be aviable redox protein, the folding free energy of the oxidizedform must be at least 2 kBT (∼5 kJ mol−1 at 298 K), requiringthat the folding free energy of the reduced protein be greaterthan 68 kJ mol−1 (700 meV).
2.1.2 Reorganization Energy
The protein fold plays a central role in lowering thereorganization energy of a biological ET reaction.10 A largepart of the λ-reduction results from sequestering a redoxcenter from the aqueous solvent environment. Continuummodels suggest that embedding a redox center inside a lowdielectric cavity can lower the outer-sphere reorganizationenergy by as much as 50%.20 Moreover, by constrainingthe coordination environment around metal centers, inner-sphere reorganization energy can be reduced as well.10 Indeed,metals that are typically poor redox reagents because oflarge reorganization barriers can be extremely efficient whenembedded in protein interiors. The reorganization energyfor electron self-exchange in Cu(phen)2
2+/+, for example, is∼2.4 eV; the value for Cu(II/I) in Pseudomonas aeruginosaazurin is 0.7 eV. The 1.7-eV reduction in λ reflects thetransition-state stabilization imposed by the azurin fold.10,21
It is important to remember that the reorganization energyis a composite parameter rather than a fundamental physicalquantity. Refinements to the semiclassical theory usually arisefrom quantum mechanical treatments of vibrational motions.22
The increased rigor associated with these models, however, israrely accompanied by the extra data required to cope withthe influx of new parameters. The approximations involved inits definition, and the errors associated with its measurementdictate that λ should never be expressed with great precision.
2.2 Electronic Coupling
The ability to control redox potentials and reorganizationenergies in proteins comes at a price: ET partners buriedwithin insulating polypeptides cannot come into close contactto exchange electrons. The essential electronic interactionbetween redox cofactors must be mediated by the polypeptidematrix. Extensive experimental and theoretical efforts havebeen aimed at elucidating the factors that regulate distantelectronic couplings between redox sites in proteins.21,23,24
The electronic coupling matrix element (HAB) reflects thestrength of the interaction between reactants and productsat the nuclear configuration of the transition state. Square-barrier ET tunneling models predict that the coupling will

depend exponentially on the distance (r) between redoxcenters (equation 2).25 A square tunneling barrier implies thata homogeneous medium separates the donor and acceptor.This model is appropriate for electron tunneling across avacuum (β = 3–5 A−1) and is a reasonable
HAB(r) = HAB(ro) exp{− 1
2 β(r − ro)}
(2)
approximation for tunneling through glassy solvents (H2O,β = 1.65 A−1;26 2-methyltetrahydrofuran, β = 1.2 A−127).Superexchange models are better suited to the description oftunneling through inhomogeneous media. In 1961, McConnelldescribed a superexchange model for electron tunneling froma donor to an acceptor across a bridge composed of n identicalrepeat units.28 The electronic coupling matrix element is afunction of the couplings between redox sites and the bridge(hAb, hbB), the coupling between bridge elements (hbb), andthe gap (�ε) between the energy of tunneling electron (orhole) and reduced (or oxidized) bridge states (equation 3).
HAB = hAb
�ε
(hbb
�ε
)n−1
hbB (3)
The medium separating redox sites in proteins is comprisedof a complex array of bonded and nonbonded contacts andan ab initio calculation of coupling strengths is a formidablechallenge.29 The homologous-bridge superexchange model(equation 3) is not suitable because of the diverse interactionsin proteins. Beratan and Onuchic developed a generalizationof the McConnell superexchange coupling model thataccommodates the structural complexity of a protein matrix.30
In this tunneling-pathway model, the medium between D and Ais decomposed into smaller subunits linked by covalent bonds,hydrogen bonds, or through-space jumps. Each link is assigneda coupling decay (εC, εH, εS), and a structure-dependentsearching algorithm is used to identify the optimum couplingpathway between the two redox sites. The total coupling of asingle pathway is given as a repeated product of the couplingsfor the individual links (equation 4). The variation of ET rateswith r depends upon the coupling-decay factors
HAB = �εC�εH�εS (4)
for hydrogen bonds (εH), van der Waals contacts (εS), andsingle covalent bonds (εC). Equation (3) suggests that themagnitude of εC should depend critically upon the energyof the tunneling electron relative to the energies of thebridge hole and electron states. Clear demonstrations of thisenergy dependence in the tunneling regime have been elusive.Studies, however, have shown that electron transport overexceptionally long distances is possible when hole or electronstates of the bridge can be populated as real intermediates.31,32
In comparing ET data from different protein systems, then,it is important to consider the tunneling-energy gap and the
LONG-RANGE ELECTRON TRANSFER IN BIOLOGY 3
possibility of forming oxidized or reduced intermediates inthe bridging medium.
The tunneling-pathway model has proven to be one ofthe most useful methods for estimating distant electroniccouplings.21,23,30,33 The original tunneling-pathway modelsuccessfully described the distance dependence of proteinET reactions when a single pathway dominated thecoupling.30 The model was less successful when multiplepathways contributed to the overall coupling. More elaboratecomputational protocols have since been developed to describein greater detail the factors that determine distant couplings inproteins.29,33–38
3 CHEMICALLY MODIFIED PROTEINS
3.1 Ru-modified Proteins
Semiclassical theory provides a framework for under-standing biological electron flow; what is necessary onthe experimental front are systematic investigations of theresponse of rates to variations in ET parameters (�G◦, λ,r). Early efforts involving studies of bimolecular ET reac-tions were frustrated by the effects of diffusion. A simplebimolecular ET reaction can be broken into a sequence ofthree steps: diffusive formation of an encounter or precursorcomplex (DA); ET from donor to acceptor within the precursorcomplex (DA D+A−); and dissociation of the successor
kobs = k+DkET
k−D + kET(5)
complex to give products. The precursor and successorcomplexes are rarely observed in ET reactions; it is reasonableto employ a steady-state approximation to describe the timedependence of the [DA] concentration (i.e. ∂[DA]/∂t = 0).Within the limits of this approximation, the observed second-order rate constant for a bimolecular ET reaction (equation 5)depends on the rates of formation and dissociation of theprecursor complex (k+D and k−D, respectively) and the ETrate within the complex (kET, equation 1). Below the diffusionlimit (i.e. kET � k−D), kobs is equal to K[DA]kET (whereK[DA] = k+D/k−D is the equilibrium constant for precursor-complex formation). Since the value of K[DA] is usually notknown, it is quite difficult to extract accurate values of λ andHAB from low-driving-force bimolecular ET rates. At highdriving forces, reaction rates become masked by diffusion(i.e. kET � k−D, kobs = k+D), frustrating efforts to observeinverted driving-force behavior.
In order to circumvent these difficulties, experimental-ists developed methods to study the rates of intraprotein ETreactions.21,23,24,39 One early approach involved metallopro-teins that had been surface-labeled with redox-active metalcomplexes.40,41
4 LONG-RANGE ELECTRON TRANSFER IN BIOLOGY
3.2 Reorganization Energy
3.2.1 Cytochrome c
Investigations of intramolecular ET in heme proteinshave focused on cytochrome c (104 amino acids in thehorse protein; 12.5 kDa; E◦ = 0.26 V vs. NHE) (see Iron:Heme Proteins & Electron Transport) (Figure 2).14,15 Earlywork with the Ru–ammine modified protein involvedthe replacement of the native Fe center with Zn. Long-range ET reactions were initiated by visible-light excitationof the resulting Zn-porphyrin (ZnPor) to its long-lived(>10 ms), strongly reducing (E◦ ∼ −0.8 V vs. NHE) triplet-excited state. A driving-force study of ET rates inRu(NH3)4L(His33)-modified Zn-substituted cytochrome c
(L = NH3, pyridine, isonicotinamide) was consistent withλ12 = 1.2 eV.23,42 The self-exchange reorganization energiesfor Ru-ammine complexes (λ11) are in the vicinity of 1.6 eV.Intramolecular ET kinetics, then, suggest that λ22 = 0.8 eVfor Zn-cytochrome c.42
Studies of high-driving-force ET in heme and nonhemeproteins were made possible by Ru-diimine labeling protocolsand the ‘flash-quench’ triggering method.43 The driving-forcedependence of ET in Ru(diimine)2(im)(His33)-modified Fe-cytochrome c (im = imidazole) is best described by λ12 =0.8 eV.21,23 This value is lower than that found for Ru-ammine-modified Zn-cytochrome c because the diimine ligandscoordinated to the Ru center are larger and more hydrophobicthan ammines. Consequently, the self-exchange reorganiza-tion energy for Ru(diimine)2(im)(His)3+/2+ is substantiallysmaller (λ11 = 0.8 eV) than that of the ammine.23,42 The com-bined results from ET measurements in the Ru–ammine andRu–diimine proteins suggest that the reorganization energy
Figure 2 Ribbon representation of the peptide backbone in horseheart cytochrome c. The heme and its axial ligands are shown in black
for electron exchange between Fe(II)- and Fe(III)-cytochromec is 0.8(1) eV.
3.2.2 Azurin
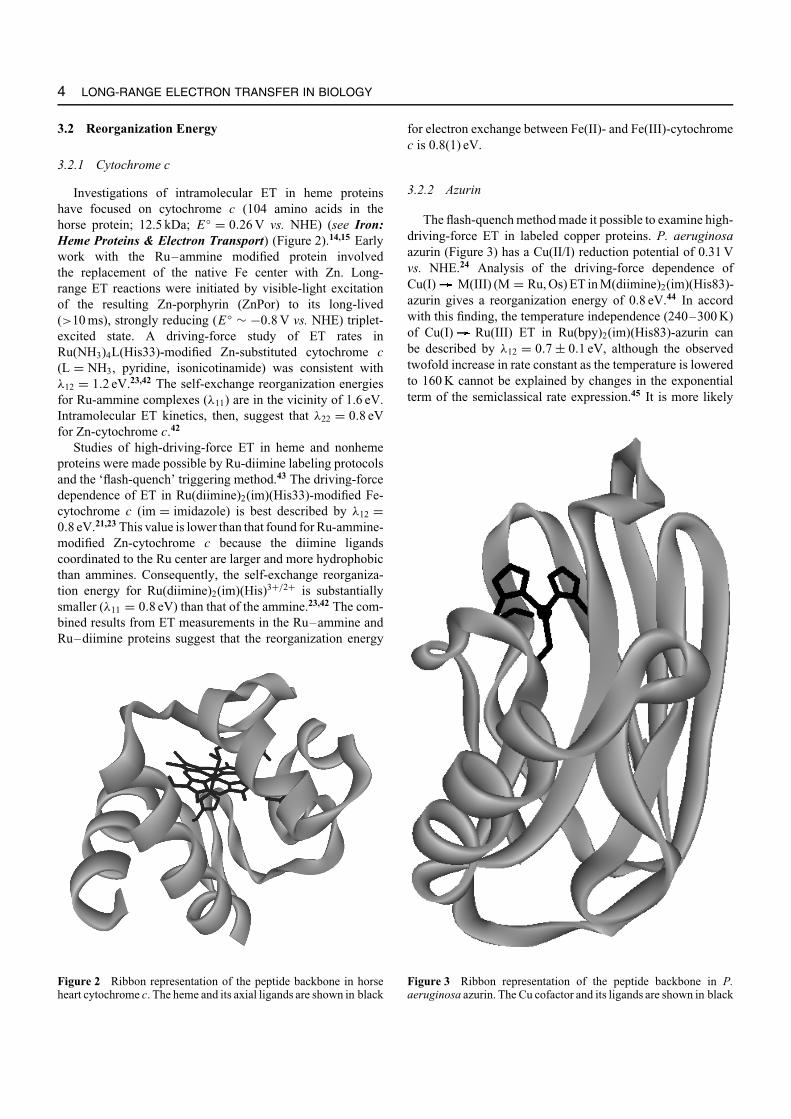
The flash-quench method made it possible to examine high-driving-force ET in labeled copper proteins. P. aeruginosaazurin (Figure 3) has a Cu(II/I) reduction potential of 0.31 Vvs. NHE.24 Analysis of the driving-force dependence ofCu(I) M(III) (M = Ru, Os) ET in M(diimine)2(im)(His83)-azurin gives a reorganization energy of 0.8 eV.44 In accordwith this finding, the temperature independence (240–300 K)of Cu(I) Ru(III) ET in Ru(bpy)2(im)(His83)-azurin canbe described by λ12 = 0.7 ± 0.1 eV, although the observedtwofold increase in rate constant as the temperature is loweredto 160 K cannot be explained by changes in the exponentialterm of the semiclassical rate expression.45 It is more likely
Figure 3 Ribbon representation of the peptide backbone in P.aeruginosa azurin. The Cu cofactor and its ligands are shown in black

that the Ru–Cu electronic coupling increases as the protein iscooled to 170 K.
Rates of Ru(III) and Os(III) reduction by Cu(I) havebeen measured in single crystals of P. aeruginosaM(diimine)2(im)(His83)-azurin. In these cases, protein con-formation and surface solvation are precisely defined byhigh-resolution X-ray structure determinations.46 The timeconstants for electron tunneling in crystals are roughly thesame as those measured in solution, indicating very similarprotein structures in the two states. High-resolution struc-tures of the oxidized (1.5 A) and reduced (1.4 A) forms ofRu(tpy)(bpy)(im)(His83)-azurin (tpy = 2,2′:6,2′′-terpyridine;bpy = 2,2′-bipyridine) establish that very small changesin copper coordination accompany reduction.46 AlthoughRu(bpy)2(im)(His83)-azurin is less solvated in the crystal lat-tice, the reorganization energy for Cu(I) Ru(III) electrontransfer falls in the same range (0.6–0.8 eV) determined exper-imentally for the reaction in solution. It is striking that drivingforces, reorganization energies, and rates of Cu(I) M(III)(M = Ru, Os) ET are virtually unchanged when labeledazurins lose one-third of their solvent-accessible surface upontransfer from dilute solutions to crystal lattices with just 40%water. These observations suggest that bulk water plays aminor role in azurin ET reactions; what little solvent reorga-nization occurs is likely to involve only the ordered watersof hydration.
3.3 Tunneling Timetables
Theoretical analyses of coupling pathways in proteinssuggest that the efficiency of long-range electron tunnelingdepends on the secondary structure of the polypeptidebetween the redox centers.47 The distance dependence ofET in azurin provides insight into the efficiency of couplingacross β-sheet structures.23 The copper center in azurin issituated at one end of an eight-stranded β-barrel, ligatedin a trigonal plane by two imidazoles (His46, His117)and a thiolate (Cys112); in addition, there are weak axialinteractions (Met121 thioether sulfur, Gly45 carbonyl oxygen)(Figure 3).48 The azurin from P. aeruginosa has two additionalHis residues, one of which (His83) reacts readily withRu-labeling reagents. An H83Q base mutant was preparedand individual mutant His residues were introduced atfive locations on β-strands extending from the Cys112and Met121 ligands (K122H, T124H, T126H, Q107H,M109H). Measurements of Cu(I) Ru(bpy)2(im)(HisX)3+ET (−�G◦ = 0.7 eV) provide a calibration for the distancedependence of ET along β-strands (Figure 4). The driving-force-optimized electron tunneling timetable for azurin revealsan exponential distance dependence, with a decay constant(β) of 1.1 A−1, and an intercept at close contact (ro = 3 A) of1013 s−1. This decay constant is quite similar to that found forsuperexchange-mediated tunneling across saturated alkanebridges (β ≈ 1.0 A−1),49 strongly indicating that a similarcoupling mechanism is operative in the polypeptide.
LONG-RANGE ELECTRON TRANSFER IN BIOLOGY 5
10 20 30
ms
µs
ns
Distance (Å)
Tunn
elin
g tim
e
b = 1.1 Å−1
b = 1.0 Å−1
s
ps
Figure 4 Distance dependence of driving-force-optimized electrontunneling times in Ru-labeled P. aeruginosa azurin. The solid line isthe distance decay predicted by the tunneling-pathway model for ETalong an ideal β-strand (β = 1.0 A−1). The dashed line is the best fitto the data (β = 1.1 A−1)23
The validity of the azurin tunneling timetable rests on theassumption that Ru-azurin structures are not very different incrystals and aqueous solutions. Measurements of ET kineticson crystalline samples of labeled azurins directly test thisassumption;46 the rate constants for oxidation of Cu(I) byRu(III) and Os(III) in solutions and crystals are nearly identicalfor each donor–acceptor pair. It follows that the crystalstructures of reduced and oxidized azurin are the relevantreactant and product states for solution ET.
It is important to distinguish between superexchange-mediated electron tunneling and multistep mechanisms thatalso can move charge over large molecular distances.31,32 Intunneling processes, quantum mechanical mixing of localizeddonor and acceptor states with oxidized (and/or reduced)bridge states couples the reactant and product states, producingan avoided crossing between the free-energy surfaces at thetransition state. Neither oxidized nor reduced bridge statesare populated in tunneling reactions; ET occurs in a singleelementary reaction step. There is a practical upper limitto the separation distance between redox sites; if chargesmust be transferred farther than this range, then multipletunneling steps are required. Long-range ET can proceed byeither single or multistep tunneling, but each mechanism hasdistinct energetic and coupling requirements, and can respondquite differently to changes in reaction parameters (e.g. T ,�G◦).

6 LONG-RANGE ELECTRON TRANSFER IN BIOLOGY
The energy gap between the donor/acceptor redox levelsand those of oxidized or reduced intermediate states is theprimary criterion in determining when multistep tunnelingbecomes important. In proteins with a single redox cofactor,the opportunities for multistep tunneling are limited. Extremeredox potentials are necessary to oxidize and reducepolypeptide backbones; thus multistep tunneling via backbonestates will not contribute to observed ET kinetics under mostsolution conditions. The side chains of certain amino acids(e.g. Tyr, Trp) have redox potentials that are more accessiblethan those of the peptide backbone.50,51 Oxidized Trp andTyr residues have been characterized spectroscopically ina large number of proteins, although direct evidence fortheir involvement in multistep tunneling reactions is hard tocome by.52
The Ru(bpy)2(im)(His)3+/2+ reduction potential (E◦ =1.0 V vs. NHE) is not high enough to oxidize Trpor Tyr residues in Ru-azurin; photogenerated holes inRu(bpy)2(im)(HisX)3+ complexes remain localized on theRu center. The energy gap between the Ru(III) hole stateand oxidized bridge states must therefore be greater than75 meV (3kBT at 295 K). The fact that oxidized bridge stateslie at higher energy than the Ru(III) hole does not rule outmultistep tunneling; endergonic steps can be compensated byfavorable reactions later in a sequence.32 Endergonic reactions,however, become less effective as the temperature decreases,so that multistep tunneling with highly endergonic steps willexhibit a strong dependence on temperature. The findingthat the rate of Cu(I) Ru(III) ET in Ru(bpy)2(im)(HisX)-azurin is nearly independent of temperature between 240and 300 K, coupled with the observation that decreasing thetemperature to 160 K produces a twofold increase in the ETrate, demonstrate that multistep tunneling cannot explain long-range ET in Ru-azurin.45 Instead, the data shown in Figure 4provide a calibration standard for superexchange-mediatedelectron tunneling in proteins.
The rates of high-driving-force ET reactions havebeen measured for more than 30 Ru(diimine)-labeledmetalloproteins.21,23,24 Only modest corrections are required toscale these rates to driving-force-optimized values, permittingcomparisons of ET in different proteins. The results aresummarized in the electron tunneling timetable of Figure 5.The reported distances are all metal-to-metal measures; inthe case of metal clusters, the closest metal was chosen.Tunneling times range from a few nanoseconds (12.2-A ET inthe high-potential iron–sulfur protein from C. vinosum) to 10milliseconds (26-A ET in P. aeruginosa azurin).
The Ru–protein data points are scattered around theRu–azurin β = 1.1 A−1 exponential distance decay. Morethan three-fourths of the Ru–protein ET rates fall in a 1.0to 1.3 A−1 β-value zone. The data in Figure 5 suggest that acanonical distance decay constant will not describe long-rangeelectron tunneling in proteins. Rates at a single distance candiffer by as much as a factor of 103 and D/A distances thatdiffer by as much as 5 A can produce identical rates. The
20
ms
µs
ns
Distance (Å)Tu
nnel
ing
time
10 30
s
ps
Figure 5 Tunneling timetable for ET in Ru-modified proteins:azurin (•); cytochrome c (©); myoglobin (�); cytochrome b562
(�); HiPIP (♦); and Fe:Zn-cytochrome c crystals (∇). The solidlines illustrate the tunneling-pathway predictions for coupling alongβ-strands (β = 1.0 A−1) and α-helices (β = 1.3 A−1); the dashedline illustrates a 1.1-A−1 distance decay. Distance decay for electrontunneling through water is shown as a black wedge. Estimateddistance dependence for tunneling through vacuum is shown as thegrey wedge21,23
absence of a simple exponential distance dependence in theRu–protein rate data is likely a reflection of the heterogeneityof the coupling medium. The efficiency of the couplingbetween redox centers is determined by the three-dimensionalstructure of the intervening polypeptide. While the azurin β-barrel structure supports a relatively uniform distance decay,highly helical proteins (myoglobin, cytochrome b562)21,24
exhibit far more heterogeneous behavior. The protein foldis the key determinant of biological ET rates: it establishesthe driving force, the reorganization energy, and theelectronic coupling.
4 PROTEIN–PROTEIN REACTIONS
In low ionic-strength buffers, many proteins of oppositecharge will form relatively tightly bound complexes.53,54 Withthe aid of rapid triggering methods, it is possible to measurerates of long-range ET between redox sites in protein–proteincomplexes.55,56 In many complexes, there are multiple bindingsites and it is not uncommon to find that the ET kineticsoften are regulated by the dynamics of conformational

changes in the complex.54 The usual interpretation is thatsurface diffusion of the two proteins produces a transientcomplex with significantly better electronic coupling andfaster electron transfer. Consequently, rates depend stronglyon solvent viscosity rather than intrinsic ET parameters (�G◦,λ, r). A further complication associated with studies ofprotein–protein ET in solution is that binding sites and,hence, locations of redox cofactors, often are unknown. Issuesof conformational change and structural ambiguity have beenaddressed recently with measurements of protein–protein ETkinetics in protein crystals.
4.1 Hemoglobin Hybrids
Kinetics measurements on crystallographically character-ized metal-substituted hemoglobin (Hb) hybrids providedsome of the earliest insights into interprotein ET rates.57
Because Hb is a very strongly bound complex of four polypep-tide subunits, ET measurements are not complicated by thedynamical problems that plague interpretation of rates in moreweakly bound complexes. Replacement of the native Fe centerin the β-subunits of Hb with Zn or Mg creates the opportunityfor photoinitiated ET reactions. The reacting metal centersin the Hb hybrids are separated by 25 A so that rates arerelatively slow even at high driving forces. The time constantfor ET from a triplet-excited ZnPor in the β-subunit to anFe(III) center in the α-subunit is about 16 ms. Extensive stud-ies of temperature dependences of hybrid Hb ET rates led tothe conclusion that the reorganization energy for these reac-tions (λ ∼ 1 eV) is dominated by outer-sphere contributions.58
Measurements of ET rates in cryogenic glasses suggest thatthe polypeptide is the primary outer-sphere medium for thereaction and that bulk solvent reorganization does not playan important role in the reaction. Moreover, it was suggestedthat even at room temperature, the protein medium in Hb actslike a frozen glass. Results from measurements on Ru-azurincrystals also indicate that bulk solvent makes only a minorcontribution to protein ET reorganization energies.46
4.2 Cytochrome c/cytochrome b5 Complexes
The ET reaction between cytochrome c and cytochrome b5
has been the subject of experimental and theoretical investiga-tions for more than forty years.59,60 Modeling both bimolecularand intracomplex ET between these proteins has been anactive field of study. The detailed structural model proposedby Salemme in 1976 for the precursor complex of this proteinpair stimulated a great deal of experimental work.61 Carefulspectroscopic studies revealed that these oppositely chargedproteins form a stable 1:1 complex at low ionic strength.59
McLendon and Miller employed a combination of photo-chemical and pulse-radiolytic methods to probe the driving-force dependence of heme–heme ET in this complex.53 TheET rates exhibit a near-Gaussian free-energy dependence, in
LONG-RANGE ELECTRON TRANSFER IN BIOLOGY 7
excellent agreement with a 0.8-eV reorganization energy. Thesignificance of this result is that, although this is a relativelylow value of λ for ET between transition metal complexes inaqueous solution, it is by no means optimized. Most biologicalET processes release less than 0.3 eV of free energy; with a0.8-eV reorganization energy, rates will be 1–2 orders ofmagnitude below their maximum values.
Evidence for more complex ET processes came fromstudies in which photochemically generated reductantsinjected electrons into preformed Fe-cytochrome b5/Fe-cytochrome c complexes. In one study, the rate of b5 c
ET (1.7 × 10³ s−1) was reported to depend on viscosityand surface mutations.62 A later laser-flash photolysis studyfound a rate-limiting second-order reduction of Fe-cytochromeb5/Fe-cytochrome c complexes and no sign of saturation,suggesting that the intracomplex ET rate was greater than104 s−1.59
Ru-modified cytochrome b5 and photochemical triggeringmethods were used to examine the kinetics of ET incytochrome b5/c complexes.60 Rapid intraprotein reduction(<100 ns) of Fe(III)-cytochrome b5 by excited Ru(bpy)3
2+made it possible to probe b5 c ET kinetics. Twoconcentration-independent ET rates (4 × 10⁵ s−1, 3.4 ×10⁴ s−1) were observed, suggesting that two cytochromeb5/c species are present in solution. Studies of ionic-strengthdependences and the effects of mutations suggest that theslower Fe(III)-cytochrome c reduction phase may be limitedby conformational changes within one of the complexes.60
4.3 Cytochrome c/cytochrome c Peroxidase Complexes
Cytochrome c peroxidase (CcP) catalyzes the two-electronreduction of H2O2 by ferrocytochrome c. Hydrogen peroxidereacts rapidly with the resting ferric form of CcP to producea species referred to as compound I, which contains a ferryl(Fe(IV)O2+) heme and a protein radical located on Trp191.The ET reactions involving these physiological redox partnershave been studied in great detail.54 At low ionic strength,acidic CcP and basic cytochrome c form a stable complex.A model of a 1:1 complex, based on the crystal structuresof the two independent proteins, was proposed by Poulosand Kraut in 1980.63 Twelve years later, Pelletier and Krautreported the crystal structure of a 1:1 complex of the two yeastproteins.64 Interestingly, the complex between yeast CcP andhorse cytochrome c exhibited a slightly different structure.Analysis of the yeast/yeast complex suggested an electroniccoupling pathway from the cytochrome c heme to the CcPheme via Trp191. On the basis of these crystallographicresults, Pelletier and Kraut argued that CcP and cytochrome c
form a highly specific 1:1 ET complex.Hoffman and coworkers have employed metal-substituted
CcP and cytochrome c to explore the ET kinetics between thesetwo proteins.54 Results from four-dimensional quenchingstudies, temperature and ionic-strength dependences, speciesvariations, and electrostatic modeling provide compelling

8 LONG-RANGE ELECTRON TRANSFER IN BIOLOGY
evidence for two distinct cytochrome c binding sites onCcP. The higher affinity binding site is the locus for Trp191radical reduction by cytochrome c. Heme (CcP) reductionby cytochrome c can occur from either the high or lowaffinity binding site but, when exchange between the twois rapid, reduction from the low affinity site dominates.54
These studies of CcP/cytochrome c ET, as well as thoseof cytochrome b5/c, reveal the considerable mechanisticcomplexity of protein–protein ET processes.
4.4 Zn-cytochrome c/Fe-cytochrome c Crystals
Studies of CcP/cytochrome c and cytochrome b5/c reac-tions highlight the difficulty of extracting ET parameterswhen donors and acceptors are not held at fixed distancesand orientations. Crystals containing photoactivatable donorsand acceptors at specific lattice sites are ideal media forinvestigating tunneling between proteins. In crystal lattices oftuna cytochrome c, chains of cytochrome c molecules formhelices with a 24.1-A separation between neighboring metalcenters.65 All other metal–metal distances in the lattice aregreater than 30 A. Thus, the heme groups can be treated asordered in a one-dimensional chain, separated by identicalprotein and solvent media. By doping Zn-cytochrome c intothis lattice, interprotein ET was probed using laser-flash tran-sient spectroscopy. ET from the triplet-excited Zn-porphyrinto a neighboring Fe(III)-cytochrome c proceeded with a rateconstant of 4(1) × 102 s−1; the rate of charge recombinationwas about four times faster (2.0(5) × 103 s−1).65
Rapid relay of electrons involving at least one soluble redoxenzyme requires the formation of short-lived, weakly boundprotein–protein complexes. The recognition sites betweenproteins in such complexes tend to be smaller (<1200 A2)and include more water molecules than the interfaces betweensubunits in oligomeric proteins. The interprotein interactionsin crystals of tuna cytochrome c involve relatively fewcontacts: 760 A2 of surface area is buried in an interface with31 van der Waals contacts (3.2 ≤ d ≤ 3.9 A) and 16 watermolecules (3 of which form bridging hydrogen bonds acrossthe interface) but only one direct hydrogen bond bridgingthe two proteins. Indeed, the cytochrome c – cytochromec interface is reminiscent of that between the naturalredox partners, cytochrome c and cytochrome c peroxidase(770 A2),64 and may be typical of the interaction zones forsoluble redox proteins. The Zn–Fe separation in doped tunacytochrome c crystals is similar to that in Zn–Fe–hemoglobinhybrids (24.7 A, T-state), although the tetrameric heme proteinhas many more contacts between subunits and a greater atomdensity at the interface. Nevertheless, *ZnPor Fe(III) andFe(II) ZnPor+• ET rates in Hb hybrids57 and Zn-doped tunacytochrome c crystal are quite similar and fall well within therange that has been established in studies of Ru-modifiedproteins.21,23,24 The protein crystal ET data demonstrate thatsmall interaction zones of low density are quite effective inmediating interprotein redox reactions.
5 PHOTOSYNTHESIS AND RESPIRATION
5.1 Photosynthetic Reaction Centers
Bacterial photosynthetic reaction centers (PRC) have beenamong the most actively studied ET proteins since DeVaultand Chance first measured C. vinosum tunneling rates in theearly 1960s.66,67 In many cases, measurements of ET kineticspreceded determination of the three-dimensional structure ofthe membrane-bound protein assembly. It was not until the X-ray crystal-structure determinations of the Rhodopseudomonas(Rps.) viridus68 and Rhodobacter (Rb.) sphaeroides69 PRCsthat distances could be assigned to specific rate constants.The recent crystal structures of photosystems I70,71 and II72,73
from cyanobacteria promise to clarify critical aspects of theET mechanisms in oxygenic PRC.74,75
Photosynthetic reaction centers are ideal substrates forinvestigations of long-range electron transfer.76–78 Chargeseparation in anoxygenic bacterial PRCs arises from aseries of highly optimized ET processes (Figure 6). Theprimary photochemical event involves 2-ps ET over 17.8 Afrom an electronically excited chlorophyll special pair(*(Bchl)2) to a pheophytin (Bphe) acceptor.79 The rate ofthis reaction increases by about a factor of two as thetemperature is lowered from 295 to 4 K. The absence ofthermal activation indicates that the reorganization energyfor *(Bchl)2 Bphe ET must be close to the driving force(0.2 eV). The reduced pheophytin delivers an electron toa quinone (QA) 14.5 A away in 100 ps. This productivereaction is 500 times faster than charge recombination withthe hole in the bacteriochlorophyll special pair ((Bchl)2
•+).In 100 ps, approximately half of the 1.3 eV excitation
(Bchl)2
BchlA
BpheA
QAQB
BpheB
BchlB
Fe
Figure 6 Model of the X-ray crystal structure of the photosyntheticreaction center from Rb. sphaeroides.69 The bacteriochlorophyllspecial pair ((Bchl)2), accessory bacteriochlorophylls (Bchl),bacteropheophytins (Bphe), quinones (Q), and iron complex (Fe)are shown in black. Electron transfer proceeds primarily along theA branch

energy of ∗(Bchl)2 has been used to produce a 28.7 Acharge separation.80 The charge on QA is subsequentlytransferred to a second quinone (QB) in a proton-coupledET step.81,82
The hole in the bacteriochlorophyll special pair is filledby electron transfer from a cytochrome. In Rps. viridis, thecytochrome donor is tightly bound to the PRC at the membranesurface. This subunit contains four hemes in a nearly lineararray oriented perpendicular to the membrane.68 The reductionpotentials of the hemes alternate from high (≥250 mVvs. NHE) to low (≤50 mV) as the distance from (Bchl)2
increases.83 The heme closest to the special pair, cytochromec559, has the highest potential and fills the (Bchl)2
•+ hole inabout ∼200 ns.84 The next well-characterized process is ETfrom cytochrome c556 to cytochrome c559 in ∼2 µs over adistance of 27.9 A.84
In Rb. sphaeroides, (Bchl)2•+ is reduced by a soluble
single heme protein, cytochrome c2. Several Rb. sphaeroidesPRC mutants with altered (Bchl)2
•+/0 potentials have beenprepared. In all, E◦((Bchl)2
•+/0) values range from a low of0.410 V to a high of 0.765 V vs. NHE (the wild-type value is0.505 V).85 A driving-force study of Fe(II) (Bchl)2
•+ ETin cytochrome c2/PRC complexes gave λ = 0.5 eV.86 Globalanalysis of temperature and driving-force dependences ofthese ET rates indicated that λ = 0.96 ± 0.07 eV, and HAB
values were not constant for all of the mutants.87 The kineticsof ET from cytochrome c2 to (Bchl)2
•+ in the PRC from Rb.sphaeroides have been measured in structurally characterizedcrystals.88 The rate (1.1 × 10⁶ s−1), driving force (0.16 eV),and donor–acceptor distance (21.2 A) are quite similar to thosefor ET from cytochrome c559 to (Bchl)2
•+ in Rps. viridis.Photosynthesis works because charge separation is more
efficient than energy-wasting charge recombination. Byblocking appropriate steps in the charge-separation sequence,it has been possible to determine the rates of PRC charge-recombination reactions. The near-linear arrangement ofredox cofactors forms a redox potential gradient that favorsshort-range charge-separation reactions. In all cases, chargerecombinations are many orders of magnitude slower thancompeting charge-separation reactions.80
Many of the PRC ET reactions exhibit only modestvariations with temperature. The rate of the primaryphotochemical event increases at cryogenic temperature.79
Several other reaction rates decrease by only smallfactors when temperatures are lowered.87 For chargeseparation, this behavior can be attributed to driving-force-optimized reactions.
5.2 Cytochrome c Oxidase
In the terminal reaction of the respiratory chain, membrane-bound cytochrome c oxidase (CcO) receives electrons fromsoluble cytochrome c and passes them on to O2.1 CcO isa multisubunit membrane-bound enzyme with four redoxcofactors (CuA, cytochrome a, cytochrome a3, CuB). The
LONG-RANGE ELECTRON TRANSFER IN BIOLOGY 9
CuA
Cyt a
Cyt a3
CuB
Figure 7 Model of the X-ray crystal structure of the bovinecytochrome c oxidase.90,91 The dimeric CuA site, cytochromes aand a3, and the CuB center are shown in black. Electrons enter theenzyme through CuA and oxygen is activated at the cytochromea3/CuB active site
locations of these metal complexes in CcO were revealedin the 1990s by the X-ray crystal structures of bacterial89
and bovine enzymes (Figure 7).90,91 The ET reactions of CcOhave been the subjects of extensive investigation.92,93 CuA, abinuclear Cu site with bridging S(Cys) atoms, is the primaryelectron acceptor from soluble cytochrome c.94 Studieswith Ru-modified cytochrome c reveal rapid (6 × 10⁴ s−1)95
electron injection from Fe(II) into CuA at low driving force(�G◦ = −0.03 eV).96 Modeling suggests that cytochrome c
binds to the bovine enzyme at an acidic patch on subunit IIwith an Fe–Cu distance of 17.8 A.97 The cytochrome c hemein the model is within 3.3 A of the Trp104 (subunit II) indolering, a residue that appears from mutagenesis experiments tobe critical for rapid cytochrome c/CuA ET. A possible electrontunneling path from this cytochrome c binding site throughTrp104 to the bridging S(Cys200) ligand on CuA has beenidentified.98
The 19.6-A electron transfer from CuA to cytochrome a
proceeds rapidly at low driving force (1.8 × 10⁴ s−1; �G◦ =−0.05 eV).95 Multiple electronic coupling pathways have been

10 LONG-RANGE ELECTRON TRANSFER IN BIOLOGY
proposed for this reaction. One postulated coupling route pro-ceeds from CuA ligand His204 (subunit II) across one hydro-gen bond to Arg438 (subunit I) (H204(Nε)-R438(O), 3.36 A),and another H– bond (2.95 A) from the Arg438 N–amide to thecytochrome a heme-propionate.1,99–101 A tunneling-currentsanalysis suggested a slightly different CuA-cytochrome a cou-pling route through His204.102 More recent work suggeststhat, owing to strong Cu–S(Cys) electronic interactions, path-ways involving the bridging Cys residues are important formediating coupling even though they involve more bondsthan do routes through His204. Two independent analysesindicated that the sequence Cys200/Ile199/Arg439/heme-propionate (cytochrome a) is the dominant coupling routebetween CuA and cytochrome a.101,102
The coupling between cytochrome a and cytochrome a3
has also been examined.99,102 Nearly equivalent couplingroutes between the two hemes involving the axial Hisresidues (His378(cytochrome a), His376(cytochrome a3))were identified. One pathway proceeds through the interveningPhe377 residue; the other two involve a hydrogen bondbetween His378 and Val374. From Ala375, one pathwaygoes directly to His376 and the other involves a hydrogenbond to Tyr372 (which is hydrogen bonded to His376). Asecond study identified three major cytochrome a/cytochromea3 pathways: one is the direct jump from heme a to heme a3;one has the aromatic ring of Phe377 as the only intermediategroup; and the third involves His378 and the Phe377 aromaticring. In spite of the similarity in CuA-cytochrome a (19.6 A)and CuA-cytochrome a3 (22.4 A) distances, pathway analysesdo not find important coupling pathways between the CuA
center and cytochrome a3.99,102
6 CONCLUDING REMARKS
It is interesting to compare rates of electron tunnelingin CcO and PRC with results from Ru-modified proteins(Figure 8).80,92 The solid line in the figure corresponds to theaverage distance dependence of driving-force-optimized ETrates in Ru-proteins (β = 1.1 A−1; 1013 s−1 intercept). Mostof the observed tunneling rates in CcO and the PRC lie nearor above this line, indicating that the natural ET reactions arehighly optimized, both in terms of reorganization energy andelectronic coupling. Three of the Rps. viridis PRC reactionsare at least two orders of magnitude faster than would beexpected for activationless ET: the initial charge-separationevent; ET from cytochrome c556 to cytochrome c559; andcharge recombination from reduced QA to cytochrome c559.These unusually high ET rates may signal the presence ofmultistep tunneling processes.79,88,103 It is interesting thatneither the QA
− (Bchl)2•+ nor the QA
− cytochromec559 charge-recombination reaction is unusually slow. Thiscontrasts with the Bphe− (Bchl)2
•+ reaction, which is103 times slower than expected for a driving-force-optimized
10 15 20 25 30 35 40 45
102
104
106
108
1010
Distance (Å)
k obs
, s−1
1005 50
1012
Figure 8 Distance dependence of observed ET rates in CcO (�)and the PRC (ž).92,104 The solid line shows the average distancedependence found for driving-force-optimized ET in Ru-modifiedproteins (β = 1.1 A−1)
process at the same distance.80 Inverted driving-force behaviormay be responsible for retarding Bphe− (Bchl)2
•+ ET, butmultistep tunneling may nullify its effects in the longer-range reactions. The rate of ET from CuA to cytochrome a
in CcO is close to that expected for an optimized reaction,yet the reaction driving force is just 50 meV. Clearly, bothreorganization energies and electronic coupling pathways inCcO have been finely tuned to achieve a high level of electrontransport efficiency.
7 RELATED ARTICLES
Copper Proteins with Type 1 Sites; Cytochrome Oxidase;Electron Transfer in Coordination Compounds; ElectronTransfer Reactions: Theory; Iron: Heme Proteins & ElectronTransport; Iron: Heme Proteins, Peroxidases, Catalases &Catalase-peroxidases; Photosynthesis.
8 REFERENCES
1. B. E. Ramirez, B. G. Malmstrom, J. R. Winkler, andH. B. Gray, Proc. Natl. Acad. Sci. U.S.A., 1995, 92, 11949.
2. P. Brzezinski and G. Larsson, Biochim. Biophys. ActaBioenerg., 2003, 1605, 1.
3. B. Giese, Curr. Opin. Chem. Biol., 2002, 6, 612.
4. M. E. Nunez and J. K. Barton, Curr. Opin. Chem. Biol., 2002,4, 199.

5. F. D. Lewis, in ‘Electron and Charge Transport Processesin DNA’, eds. H. B. Gray and J. R. Winkler, Weinheim,Germany, 2001.
6. N. M. Jackson and M. G. Hill, Curr. Opin. Chem. Biol., 2001,5, 209.
7. R. A. Marcus and N. Sutin, Biochim. Biophys. Acta, 1985,811, 265.
8. R. A. Marcus, Angew. Chem., Int. Ed. Eng., 1993, 32, 1111.
9. R. A. Marcus, Adv. Chem. Phys., 1999, 106, 1.
10. H. B. Gray, B. G. Malmstrom, and R. J. P. Williams, J. Biol.Inorg. Chem., 2000, 5, 551.
11. C. N. Schutz and A. Warshel, Proteins: Struct., Funct., Genet.,2001, 44, 400.
12. P. J. Stephens, D. R. Jollie, and A. Warshel, Chem. Rev., 1996,96, 2491.
13. F. A. Armstrong and G. S. Wilson, Electrochim. Acta, 2000,45, 2623.
14. G. R. Moore and G. W. Pettigrew, ‘Cytochromes c:Evolutionary, Structural, and Physicochemical Aspects’,Springer-Verlag, 1990.
15. R. A. Scott and A. G. Mauk, in ‘Cytochrome c – AMultidisciplinary Approach’, University Science Books,Sausalito, CA, 1996.
16. E. L. Raven and A. G. Mauk, Adv. Inorg. Chem., 2001, 51, 1.
17. F. A. Tezcan, J. R. Winkler, and H. B. Gray, J. Am. Chem.Soc., 1998, 120, 13383.
18. J. R. Telford, P. Wittung-Stafshede, H. B. Gray, andJ. R. Winkler, Acc. Chem. Res., 1998, 31, 755.
19. P. Wittung-Stafshede, Acc. Chem. Res., 2002, 35, 201.
20. T. Simonson, Rep. Prog. Phys., 2003, 66, 737.
21. H. B. Gray and J. R. Winkler, Q. Rev. Biophys., 2003, 36,341.
22. M. Bixon and J. Jortner, Adv. Chem. Phys., 1999, 106, 35.
23. H. B. Gray and J. R. Winkler, Annu. Rev. Biochem., 1996, 65,537.
24. J. R. Winkler, A. Di Bilio, N. A. Farrow, J. H. Richards, andH. B. Gray, Pure Appl. Chem., 1999, 71, 1753.
25. J. J. Hopfield, Proc. Natl. Acad. Sci. U.S.A., 1974, 71, 3640.
26. A. Ponce, H. B. Gray, and J. R. Winkler, J. Am. Chem. Soc.,2000, 122, 8187.
27. K. V. Mikkelsen and M. A. Ratner, Chem. Rev., 1978, 87,113.
28. H. M. McConnell, J. Chem. Phys., 1961, 35, 508.
29. A. A. Stuchebrukhov, Adv. Chem. Phys., 2001, 118, 1.
30. J. N. Onuchic, D. N. Beratan, J. R. Winkler, and H. B. Gray,Annu. Rev. Biophys. Biomol. Struct., 1992, 21, 349.
31. M. Bixon and J. Jortner, J. Chem. Phys., 1997, 107, 5154.
32. C. C. Page, C. C. Moser, and P. L. Dutton, Curr. Opin. Chem.Biol., 2003, 7, 551.
LONG-RANGE ELECTRON TRANSFER IN BIOLOGY 11
33. W. B. Curry, M. D. Grabe, I. V. Kurnikov, S. S. Skourtis,D. N. Beratan, J. J. Regan, A. J. A. Aquino, P. Beroza, andJ. N. Onuchic, J. Bioenerg. Biomembr., 1995, 27, 285.
34. J. J. Regan and J. N. Onuchic, Adv. Chem. Phys., 1999, 107,497.
35. I. A. Balabin and J. N. Onuchic, J. Phys. Chem. B, 1998, 102,7497.
36. S. S. Skourtis and D. N. Beratan, J. Biol. Inorg. Chem., 1997,2, 378.
37. K. Kumar, I. V. Kurnikov, D. N. Beratan, D. H. Waldeck, andM. B. Zimmt, J. Phys. Chem. A, 1998, 102, 5529.
38. A. A. Stuchebrukhov, J. Chem. Phys., 1996, 105, 10819.
39. F. Millett and B. Durham, Biochemistry, 2002, 41, 11315.
40. K. M. Yocom, J. B. Shelton, J. R. Shelton, W. E. Schroeder,G. Worosila, S. S. Isied, E. Bordignon, and H. B. Gray, Proc.Natl. Acad. Sci. U.S.A., 1982, 79, 7052.
41. J. R. Winkler, D. G. Nocera, K. M. Yocom, E. Bordignon, andH. B. Gray, J. Am. Chem. Soc., 1982, 104, 5798.
42. J. R. Winkler and H. B. Gray, Chem. Rev., 1992, 92, 369.
43. I.-J. Chang, H. B. Gray, and J. R. Winkler, J. Am. Chem. Soc.,1991, 113, 7056.
44. A. J. Di Bilio, M. G. Hill, N. Bonander, B. G. Karlsson,R. M. Villahermosa, B. G. Malmstrom, J. R. Winkler, andH. B. Gray, J. Am. Chem. Soc., 1997, 119, 9921.
45. L. K. Skov, T. Pascher, J. R. Winkler, and H. B. Gray, J. Am.Chem. Soc., 1998, 120, 1102.
46. B. R. Crane, A. J. Di Bilio, J. R. Winkler, and H. B. Gray, J.Am. Chem. Soc., 2001, 123, 11623.
47. D. N. Beratan, J. N. Betts, and J. N. Onuchic, Science, 1991,252, 1285.
48. E. T. Adman, Adv. Protein Chem., 1991, 42, 145.
49. J. F. Smalley, H. O. Finklea, C. E. D. Chidsey, M. R. Linford,S. E. Creager, J. P. Ferraris, K. Chalfant, T. Zawodzinsk,S. W. Feldberg, and M. D. Newton, J. Am. Chem. Soc., 2003,125, 2004.
50. J. Stubbe and W. A. van der Donk, Chem. Rev., 1998, 98, 705.
51. J. Stubbe, D. G. Nocera, C. S. Yee, and M. C. Y. Chang,Chem. Rev., 2003, 103, 2167.
52. M. C. Y. Chang, C. S. Yee, J. Stubbe, and D. G. Nocera, Proc.Natl. Acad. Sci. U.S.A., 2004, 101, 6882.
53. G. McLendon and R. Hake, Chem. Rev., 1992, 92, 481.
54. J. M. Nocek, J. S. Zhou, S. DeForest, S. Priyadarshy,D. N. Beratan, J. N. Onuchic, and B. M. Hoffman, Chem.Rev., 1996, 96, 2459.
55. V. L. Davidson, Acc. Chem. Res., 2000, 33, 87.
56. G. Tollin, J. Bioenerg. Biomembr., 1995, 27, 303.
57. B. M. Hoffman, M. J. Natan, J. M. Nocek, and S. A. Wallin,Struct. Bonding, 1991, 75, 85.
58. L. A. Dick, I. Malfant, D. Kuila, S. Nebolsky, J. M. Nocek,B. M. Hoffman, and M. A. Ratner, J. Am. Chem. Soc., 1998,120, 11401.
12 LONG-RANGE ELECTRON TRANSFER IN BIOLOGY
59. A. G. Mauk, M. R. Mauk, G. R. Moore, and S. H. Northrup,J. Bioenerg. Biomembr., 1995, 27, 311.
60. B. Durham, J. L. Fairris, M. McLean, F. Millett, J. R. Scott,S. G. Sligar, and A. Willie, J. Bioenerg. Biomembr., 1995, 27,331.
61. F. R. Salemme, J. Mol. Biol., 1976, 102, 563.
62. L. Qin, K. K. Rodgers, and S. G. Sligar, Mol. Cryst. Liq.Cryst., 1991, 194, 311.
63. T. L. Poulos and J. Kraut, J. Biol. Chem., 1980, 255, 10322.
64. H. Pelletier and J. Kraut, Science, 1992, 258, 1748.
65. F. A. Tezcan, B. R. Crane, J. R. Winkler, and H. B. Gray,Proc. Natl. Acad. Sci. U.S.A., 2001, 98, 5002.
66. D. De Vault and B. Chance, Biophys. J., 1966, 6, 825.
67. D. De. Vault, J. H. Parkes, and B. Chance, Nature, 1967, 215,642.
68. J. Deisenhofer, O. Epp, I. Sinning, and H. Michel, J. Mol.Biol., 1995, 246, 429.
69. H. Komiya, T. O. Yeates, D. C. Rees, J. P. Allen, andG. Feher, Proc. Natl. Acad. Sci. U.S.A., 1988, 85, 9012.
70. P. Jordan, P. Fromme, H. T. Witt, O. Klukas, W. Saenger, andN. Krauß, Nature, 2001, 411.
71. P. Fromme, P. Jordan, and N. Krauß, Biochim. Biophys. Acta,2001, 1507, 5.
72. A. Zouni, H. T. Witt, J. Kern, N. Krauß, W. Saenger, andP. Orth, Nature, 2001, 409, 739.
73. N. Kamiya and J. R. Shen, Proc. Natl. Acad. Sci. U.S.A., 2003,100, 98.
74. N. Krauß, Curr. Opin. Chem. Biol., 2003, 7, 540.
75. J. H. A. Nugent, Eur. J. Biochem., 1996, 237, 519.
76. Govindjee, J. T. Beatty, and H. Gest, Photosynth. Res., 2003,76, 1.
77. Govindjee and H. Gest, Photosynth. Res., 2002, 73, 1.
78. K. Mobius, Chem. Soc. Rev., 2000, 29, 129.
79. C. Kirmaier and D. Holten, Photosynth. Res., 1987, 13,225.
80. S. Franzen, R. F. Goldstein, and S. G. Boxer, J. Phys. Chem.,1993, 97, 3040.
81. M. Y. Okamura, M. L. Paddock, M. S. Graige, and G. Feher,Biochim. Biophys. Acta Bioenerg., 2000, 1458, 148.
82. R. I. Cukier and D. G. Nocera, Annu. Rev. Phys. Chem., 1998,49, 337.
83. F. Baymann and F. Rappaport, Biochemistry, 1998, 37,15320.
84. J. M. Ortega and P. Mathis, Biochemistry, 1993, 32, 1141.
85. X. Lin, H. A. Murchison, V. Nagarajan, W. W. Parson,J. P. Allen, and J. C. Williams, Proc. Natl. Acad. Sci. U.S.A.,1994, 91, 10265.
86. X. Lin, J. C. Williams, J. P. Allen, and P. Mathis,Biochemistry, 1994, 33, 13517.
87. G. Venturoli, F. Drepper, J. C. Williams, J. P. Allen, X. Lin,and P. Mathis, Biophys. J., 1998, 74, 3226.
88. H. L. Axelrod, E. C. Abresch, M. Y. Okamura, A. P. Yeh,D. C. Rees, and G. Feher, J. Mol. Biol., 2002, 319,501.
89. S. Iwata, C. Ostermeier, B. Ludwig, and H. Michel, Nature,1995, 376, 660.
90. T. Tsukihara, H. Aoyama, E. Yamashita, T. Tomizaki,H. Yamaguchi, K. Shinzawa-Itoh, R. Nakashima, R. Yaono,and S. Yoshikawa, Science, 1995, 269, 1071.
91. S. Yoshikawa, K. Shinzawa-Itoh, R. Nakashima, R. Yaono,E. Yamashita, N. Inoue, M. Yao, J. M. Fei, C. P. Libeu,T. Mizushima, H. Yamaguchi, T. Tomizaki, and T. Tsukihara,Science, 1998, 280, 1723.
92. J. R. Winkler, B. G. Malmstrom, and H. B. Gray, Biophys.Chem., 1995, 54, 199.
93. O. Einarsdottir and I. Szundi, Biochim. Biophys. ActaBioenerg., 2004, 1655, 263.
94. H. Beinert, Eur. J. Biochem., 1997, 245, 521.
95. L. M. Geren, J. R. Beasley, B. R. Fine, A. J. Saunders,S. Hibdon, G. J. Pielak, B. Durham, and F. Millett, J. Biol.Chem., 1995, 270, 2466.
96. L. P. Pan, S. Hibdon, R.-Q. Liu, B. Durham, and F. Millett,Biochemistry, 1993, 32, 8492.
97. V. A. Roberts and M. E. Pique, J. Biol. Chem., 1999, 274,38051.
98. R. K. Szilagyi and E. I. Solomon, Curr. Opin. Chem. Biol.,2002, 6, 250.
99. J. J. Regan, B. E. Ramirez, J. R. Winkler, H. B. Gray, andB. G. Malmstrom, J. Bioenerg. Biomembr., 1998, 30,35.
100. D. R. Gamelin, D. W. Randall, M. T. Hay, R. T. Houser,T. C. Mulder, G. W. Canters, S. de Vries, W. B. Tolman,Y. Lu, and E. I. Solomon, J. Am. Chem. Soc., 1998, 120,5246.
101. S. D. George, M. Metz, R. K. Szilagyi, H. Wang, S. P.Cramer, Y. Lu, W. B. Tolman, B. Hedman, K. O. Hodgson,and E. I. Solomon, J. Am. Chem. Soc., 2001, 123,5757.
102. D. M. Medvedev, I. Daizadeh, and A. A. Stuchebrukhov, J.Am. Chem. Soc., 2000, 122, 6571.
103. C. C. Page, C. C. Moser, X. Chen, and P. L. Dutton, Nature,1999, 402, 47.
104. H. B. Gray and W. R. Ellis Jr, in ‘Electron Trans-fer’, eds. I. Bertini, H. B. Gray, S. J. Lippard, andJ. S. Valentine, University Science Books, Mill Valley, CA,1994.
Acknowledgments
I thank Brian S. Leigh for assistance with the graphics. Thisresearch is supported by the National Science Foundation andthe National Institutes of Health.